CII Communique - February, 2010
CII Communique - February, 2010
CII Communique - February, 2010

Create successful ePaper yourself
Turn your PDF publications into a flip-book with our unique Google optimized e-Paper software.
cover story<br />
reduce the fiscal deficit to 5.5% of GDP, as articulated<br />
by the Finance Minister.<br />
Companies are Seeing Sales Pick-up<br />
The last year has also been a difficult year for companies<br />
– the global economy entered a recession, and<br />
commodity prices tumbled, resulting in a slide in most<br />
companies’ top line growth.<br />
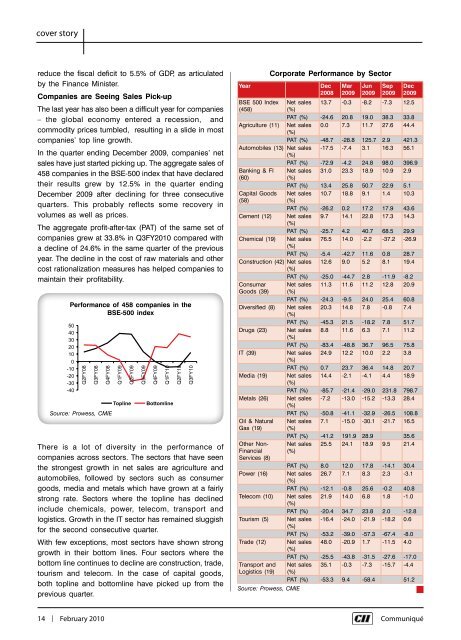
In the quarter ending December 2009, companies’ net<br />
sales have just started picking up. The aggregate sales of<br />
458 companies in the BSE-500 index that have declared<br />
their results grew by 12.5% in the quarter ending<br />
December 2009 after declining for three consecutive<br />
quarters. This probably reflects some recovery in<br />
volumes as well as prices.<br />
The aggregate profit-after-tax (PAT) of the same set of<br />
companies grew at 33.8% in Q3FY<strong>2010</strong> compared with<br />
a decline of 24.6% in the same quarter of the previous<br />
year. The decline in the cost of raw materials and other<br />
cost rationalization measures has helped companies to<br />
maintain their profitability.<br />
Performance of 458 companies in the<br />
BSE-500 index<br />
50<br />
40<br />
30<br />
20<br />
10<br />
0<br />
-10<br />
-20<br />
-30<br />
-40<br />
Q2FY08<br />
Q3FY08<br />
Q4FY08<br />
Q1FY09<br />
Q2FY09<br />
Topline<br />
Source: Prowess, CMIE<br />
There is a lot of diversity in the performance of<br />
companies across sectors. The sectors that have seen<br />
the strongest growth in net sales are agriculture and<br />
automobiles, followed by sectors such as consumer<br />
goods, media and metals which have grown at a fairly<br />
strong rate. Sectors where the topline has declined<br />
include chemicals, power, telecom, transport and<br />
logistics. Growth in the IT sector has remained sluggish<br />
for the second consecutive quarter.<br />
With few exceptions, most sectors have shown strong<br />
growth in their bottom lines. Four sectors where the<br />
bottom line continues to decline are construction, trade,<br />
tourism and telecom. In the case of capital goods,<br />
both topline and bottomline have picked up from the<br />
previous quarter.<br />
Q3FY09<br />
Q4FY09<br />
Q1FY10<br />
Bottomline<br />
Q2FY10<br />
Q3FY10<br />
Year<br />
Corporate Performance by Sector<br />
Dec<br />
2008<br />
Mar<br />
2009<br />
Jun<br />
2009<br />
Sep<br />
2009<br />
Dec<br />
2009<br />
BSE 500 Index Net sales 13.7 -0.3 -8.2 -7.3 12.5<br />
(458)<br />
(%)<br />
PAT (%) -24.6 20.8 19.0 38.3 33.8<br />
Agriculture (11) Net sales 0.0 7.3 11.7 27.6 44.4<br />
(%)<br />
PAT (%) -48.7 -28.8 125.7 2.9 421.3<br />
Automobiles (13) Net sales -17.5 -7.4 3.1 16.3 56.1<br />
(%)<br />
PAT (%) -72.9 -4.2 24.8 98.0 396.9<br />
Banking & FI Net sales 31.0 23.3 18.9 10.9 2.9<br />
(60)<br />
(%)<br />
PAT (%) 13.4 25.8 50.7 22.9 5.1<br />
Capital Goods Net sales 10.7 18.8 9.1 1.4 10.3<br />
(58)<br />
(%)<br />
PAT (%) -26.2 0.2 17.2 17.9 43.6<br />
Cement (12) Net sales 9.7 14.1 22.8 17.3 14.3<br />
(%)<br />
PAT (%) -25.7 4.2 40.7 68.5 29.9<br />
Chemical (19) Net sales 76.5 14.0 -2.2 -37.2 -26.9<br />
(%)<br />
PAT (%) -5.4 -42.7 11.6 0.8 28.7<br />
Construction (42) Net sales 12.6 9.0 5.2 8.1 19.4<br />
(%)<br />
PAT (%) -25.0 -44.7 2.8 -11.9 -8.2<br />
Consumar Net sales 11.3 11.6 11.2 12.8 20.9<br />
Goods (39) (%)<br />
PAT (%) -24.3 -9.5 24.0 25.4 60.8<br />
Diversified (8) Net sales 20.3 14.8 7.8 -0.8 7.4<br />
(%)<br />
PAT (%) -45.3 21.5 -18.2 7.8 51.7<br />
Drugs (23) Net sales 8.8 11.6 6.3 7.1 11.2<br />
(%)<br />
PAT (%) -83.4 -48.8 36.7 96.5 75.8<br />
IT (39)<br />
Net sales 24.9 12.2 10.0 2.2 3.8<br />
(%)<br />
PAT (%) 0.7 23.7 36.4 14.8 20.7<br />
Media (19) Net sales 14.4 -2.1 -4.1 4.4 18.9<br />
(%)<br />
PAT (%) -85.7 -21.4 -29.0 231.8 798.7<br />
Metals (26) Net sales -7.2 -13.0 -15.2 -13.3 28.4<br />
(%)<br />
PAT (%) -50.8 -41.1 -32.9 -26.5 108.8<br />
Oil & Natural Net sales 7.1 -15.0 -30.1 -21.7 16.5<br />
Gas (19) (%)<br />
PAT (%) -41.2 191.9 28.9 35.6<br />
Other Non- Net sales 25.5 24.1 18.9 9.5 21.4<br />
Financial<br />
Services (8)<br />
(%)<br />
PAT (%) 8.0 12.0 17.8 -14.1 30.4<br />
Power (16) Net sales 26.7 7.1 8.3 2.3 -3.1<br />
(%)<br />
PAT (%) -12.1 -0.8 25.6 -0.2 40.8<br />
Telecom (10) Net sales 21.9 14.0 6.8 1.8 -1.0<br />
(%)<br />
PAT (%) -20.4 34.7 23.8 2.0 -12.8<br />
Tourism (5) Net sales -16.4 -24.0 -21.9 -18.2 0.6<br />
(%)<br />
PAT (%) -53.2 -39.0 -57.3 -67.4 -8.0<br />
Trade (12) Net sales 48.0 -20.9 1.7 -11.5 4.0<br />
(%)<br />
PAT (%) -25.5 -43.8 -31.5 -27.6 -17.0<br />
Transport and Net sales 35.1 -0.3 -7.3 -15.7 -4.4<br />
Logistics (19) (%)<br />
PAT (%) -53.3 9.4 -58.4 51.2<br />
Source: Prowess, CMIE<br />
14 | <strong>February</strong> <strong>2010</strong> Communiqué