2012 Global Market report - NAI Global
2012 Global Market report - NAI Global
2012 Global Market report - NAI Global
You also want an ePaper? Increase the reach of your titles
YUMPU automatically turns print PDFs into web optimized ePapers that Google loves.
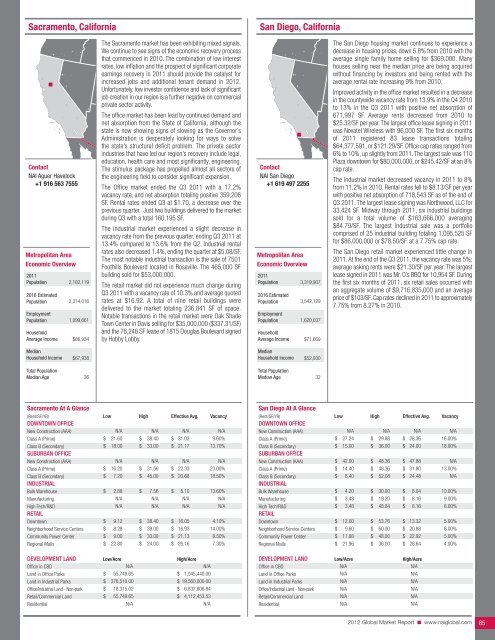
Sacramento, California<br />
San Diego, California<br />
Contact<br />
<strong>NAI</strong> Aguer Havelock<br />
+1 916 563 7555<br />
Metropolitan Area<br />
Economic Overview<br />
2011<br />
Population<br />
2016 Estimated<br />
Population<br />
Employment<br />
Population<br />
Household<br />
Average Income<br />
2,182,119<br />
2,314,016<br />
1,099,661<br />
$86,934<br />
The Sacramento market has been exhibiting mixed signals.<br />
We continue to see signs of the economic recovery process<br />
that commenced in 2010. The combination of low interest<br />
rates, low inflation and the prospect of significant corporate<br />
earnings recovery in 2011 should provide the catalyst for<br />
increased jobs and additional tenant demand in <strong>2012</strong>.<br />
Unfortunately, low investor confidence and lack of significant<br />
job creation in our region is a further negative on commercial<br />
private sector activity.<br />
The office market has been lead by continued demand and<br />
net absorption from the State of California, although the<br />
state is now showing signs of slowing as the Governor’s<br />
Administration is desperately looking for ways to solve<br />
the state’s structural deficit problem. The private sector<br />
industries that have led our region’s recovery include legal,<br />
education, health care and most significantly, engineering.<br />
The stimulus package has propelled almost all sectors of<br />
the engineering field to consider significant expansion.<br />
The Office market ended the Q3 2011 with a 17.2%<br />
vacancy rate, and net absorption totaling positive 359,206<br />
SF. Rental rates ended Q3 at $1.70, a decrease over the<br />
previous quarter. Just two buildings delivered to the market<br />
during Q3 with a total 160,195 SF.<br />
The industrial market experienced a slight decrease in<br />
vacancy rate from the previous quarter, ending Q3 2011 at<br />
13.4% compared to 13.6% from the Q2. Industrial rental<br />
rates also decreased 1.4%, ending the quarter at $5.08/SF.<br />
The most notable industrial transaction is the sale of 7501<br />
Foothills Boulevard located in Roseville. The 465,000 SF<br />
building sold for $53,000,000.<br />
The retail market did not experience much change during<br />
Q3 2011 with a vacancy rate of 10.3% and average quoted<br />
rates at $16.92. A total of nine retail buildings were<br />
delivered to the market totaling 236,841 SF of space.<br />
Notable transactions in the retail market were Oak Shade<br />
Town Center in Davis selling for $35,000,000 ($337.31/SF)<br />
and the 76,248 SF lease of 1815 Douglas Boulevard signed<br />
by Hobby Lobby.<br />
Contact<br />
<strong>NAI</strong> San Diego<br />
+1 619 497 2255<br />
Metropolitan Area<br />
Economic Overview<br />
2011<br />
Population<br />
2016 Estimated<br />
Population<br />
Employment<br />
Population<br />
Household<br />
Average Income<br />
3,319,907<br />
3,542,129<br />
1,620,037<br />
$71,669<br />
The San Diego housing market continues to experience a<br />
decrease in housing prices, down 5.8% from 2010 with the<br />
average single family home selling for $369,000. Many<br />
houses selling near the median price are being acquired<br />
without financing by investors and being rented with the<br />
average rental rate increasing 9% from 2010.<br />
Improved activity in the office market resulted in a decrease<br />
in the countywide vacancy rate from 13.9% in the Q4 2010<br />
to 13% in the Q3 2011 with positive net absorption of<br />
671,997 SF. Average rents decreased from 2010 to<br />
$25.32/SF per year. The largest office lease signing in 2011<br />
was Novatel Wireless with 96,000 SF. The first six months<br />
of 2011 registered 83 lease transactions totaling<br />
$64,377,591, or $121.29/SF. Office cap rates ranged from<br />
6% to 10%, up slightly from 2011. The largest sale was 110<br />
Plaza downtown for $80,000,000, or $245.42/SF at an 8%<br />
cap rate.<br />
The industrial market decreased vacancy in 2011 to 8%<br />
from 11.2% in 2010. Rental rates fell to $8.13/SF per year<br />
with positive net absorption of 718,543 SF as of the end of<br />
Q3 2011. The largest lease signing was Northwood, LLC for<br />
33,424 SF. Midway through 2011, six industrial buildings<br />
sold for a total volume of $163,666,000 averaging<br />
$84.79/SF. The largest industrial sale was a portfolio<br />
comprised of 25 industrial building totaling 1,095,525 SF<br />
for $86,000,000 or $78.50/SF. at a 7.75% cap rate.<br />
The San Diego retail market experienced little change in<br />
2011. At the end of the Q3 2011, the vacancy rate was 5%;<br />
average asking rents were $21.30/SF per year. The largest<br />
lease signed in 2011 was Mr. O’s BBQ for 10,954 SF. During<br />
the first six months of 2011, six retail sales occurred with<br />
an aggregate volume of $9,716,835,000 and an average<br />
price of $103/SF. Cap rates declined in 2011 to approximately<br />
7.75% from 8.27% in 2010.<br />
Median<br />
Household Income<br />
$67,938<br />
Median<br />
Household Income<br />
$52,930<br />
Total Population<br />
Median Age<br />
36<br />
Total Population<br />
Median Age<br />
32<br />
Sacramento At A Glance<br />
(Rent/SF/YR) low High effective avg. Vacancy<br />
doWntoWn offIce<br />
New Construction (AAA)<br />
Class A (Prime)<br />
Class B (Secondary)<br />
suburban offIce<br />
New Construction (AAA)<br />
Class A (Prime)<br />
Class B (Secondary)<br />
IndustrIal<br />
$<br />
$<br />
$<br />
$<br />
N/A<br />
21.60<br />
18.00<br />
N/A<br />
16.20<br />
7.20<br />
$<br />
$<br />
$<br />
$<br />
N/A<br />
38.40<br />
33.00<br />
N/A<br />
31.56<br />
45.00<br />
N/A<br />
$ 31.03<br />
$ 21.17<br />
N/A<br />
$ 22.33<br />
$ 20.68<br />
N/A<br />
9.60%<br />
13.70%<br />
N/A<br />
23.00%<br />
18.50%<br />
Bulk Warehouse<br />
Manufacturing<br />
High Tech/R&D<br />
retaIl<br />
$ 2.88<br />
N/A<br />
N/A<br />
$ 7.56<br />
N/A<br />
N/A<br />
$ 5.10<br />
N/A<br />
N/A<br />
13.60%<br />
N/A<br />
N/A<br />
Downtown<br />
Neighborhood Service Centers<br />
Community Power Center<br />
Regional Malls<br />
$<br />
$<br />
$<br />
$<br />
9.12<br />
8.28<br />
9.00<br />
22.80<br />
$<br />
$<br />
$<br />
$<br />
38.40<br />
39.00<br />
33.00<br />
24.00<br />
$ 16.05<br />
$ 16.93<br />
$ 21.13<br />
$ 26.16<br />
4.10%<br />
14.00%<br />
8.50%<br />
7.30%<br />
deVeloPment land Low/Acre High/Acre<br />
Office in CBD<br />
Land in Office Parks<br />
$<br />
N/A<br />
55,749.65<br />
N/A<br />
$ 1,045,440.00<br />
Land in Industrial Parks<br />
$ 376,510.00 $ 19,560,000.00<br />
Office/Industrial Land - Non-park<br />
Retail/Commercial Land<br />
Residential<br />
$<br />
$<br />
18,315.02<br />
55,749.65<br />
N/A<br />
$ 6,837,606.84<br />
$ 4,112,453.53<br />
N/A<br />
San Diego At A Glance<br />
(Rent/SF/YR) low High effective avg. Vacancy<br />
doWntoWn offIce<br />
New Construction (AAA)<br />
Class A (Prime)<br />
Class B (Secondary)<br />
suburban offIce<br />
New Construction (AAA)<br />
Class A (Prime)<br />
Class B (Secondary)<br />
IndustrIal<br />
$<br />
$<br />
$<br />
$<br />
$<br />
N/A<br />
27.24<br />
15.00<br />
42.00<br />
14.40<br />
8.40<br />
$<br />
$<br />
$<br />
$<br />
$<br />
N/A<br />
29.88<br />
36.00<br />
48.36<br />
48.36<br />
52.08<br />
N/A<br />
$ 28.36<br />
$ 24.00<br />
$ 47.88<br />
$ 31.80<br />
$ 24.48<br />
N/A<br />
16.00%<br />
18.00%<br />
N/A<br />
13.00%<br />
N/A<br />
Bulk Warehouse<br />
Manufacturing<br />
High Tech/R&D<br />
retaIl<br />
$<br />
$<br />
$<br />
4.20<br />
3.48<br />
3.48<br />
$<br />
$<br />
$<br />
30.00<br />
19.20<br />
48.84<br />
$<br />
$<br />
$<br />
8.04<br />
8.16<br />
8.16<br />
10.00%<br />
9.00%<br />
8.00%<br />
Downtown<br />
Neighborhood Service Centers<br />
Community Power Center<br />
Regional Malls<br />
$<br />
$<br />
$<br />
$<br />
12.00<br />
9.60<br />
11.88<br />
21.96<br />
$<br />
$<br />
$<br />
$<br />
53.76<br />
60.00<br />
48.00<br />
36.00<br />
$ 13.32<br />
$ 20.88<br />
$ 22.92<br />
$ 26.64<br />
5.00%<br />
8.00%<br />
5.00%<br />
4.00%<br />
deVeloPment land Low/Acre High/Acre<br />
Office in CBD<br />
Land in Office Parks<br />
Land in Industrial Parks<br />
Office/Industrial Land - Non-park<br />
Retail/Commercial Land<br />
Residential<br />
N/A<br />
N/A<br />
N/A<br />
N/A<br />
N/A<br />
N/A<br />
N/A<br />
N/A<br />
N/A<br />
N/A<br />
N/A<br />
N/A<br />
<strong>2012</strong> <strong>Global</strong> <strong>Market</strong> Report n www.naiglobal.com 85


