2012 Global Market report - NAI Global
2012 Global Market report - NAI Global
2012 Global Market report - NAI Global
Create successful ePaper yourself
Turn your PDF publications into a flip-book with our unique Google optimized e-Paper software.
Tijuana, Baja California, Mexico<br />
Contact<br />
<strong>NAI</strong> Mexico<br />
+1 619 690 3029<br />
Country Data<br />
Area (Sq Mi)<br />
GDP Growth<br />
GDP 2011 (US$ B)<br />
GDP/Capita (US$)<br />
Inflation Rate<br />
Unemployment Rate<br />
Interest Rate<br />
Population (Millions)<br />
758,449<br />
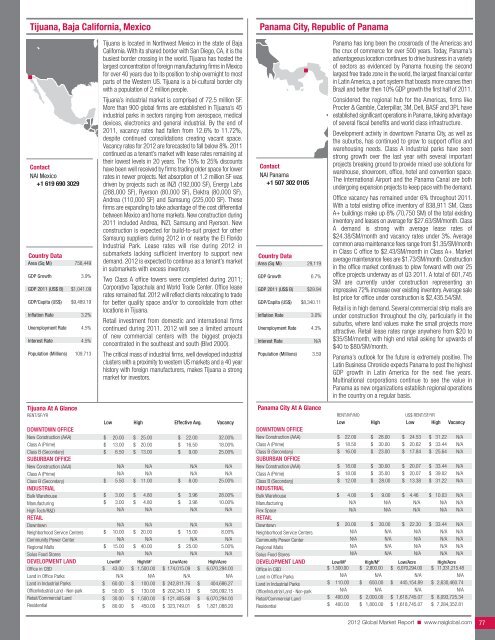
Tijuana is located in Northwest Mexico in the state of Baja<br />
California. With its shared border with San Diego, CA, it is the<br />
busiest border crossing in the world. Tijuana has hosted the<br />
largest concentration of foreign manufacturing firms in Mexico<br />
for over 40 years due to its position to ship overnight to most<br />
parts of the Western US. Tijuana is a bi-cultural border city<br />
with a population of 2 million people.<br />
Tijuana’s industrial market is comprised of 72.5 million SF.<br />
More than 900 global firms are established in Tijuana’s 45<br />
industrial parks in sectors ranging from aerospace, medical<br />
devices, electronics and general industrial. By the end of<br />
2011, vacancy rates had fallen from 12.6% to 11.72%,<br />
despite continued consolidations creating vacant space.<br />
Vacancy rates for <strong>2012</strong> are forecasted to fall below 8%. 2011<br />
continued as a tenant’s market with lease rates remaining at<br />
their lowest levels in 20 years. The 15% to 25% discounts<br />
have been well received by firms trading older space for lower<br />
rates in newer projects. Net absorption of 1.2 million SF was<br />
driven by projects such as INZI (192,000 SF), Energy Labs<br />
(288,000 SF), Ryerson (80,000 SF), Elektra (80,000 SF),<br />
Andrea (110,000 SF) and Samsung (225,000 SF). These<br />
firms are expanding to take advantage of the cost differential<br />
between Mexico and home markets. New construction during<br />
2011 included Andrea, INZI, Samsung and Ryerson. New<br />
construction is expected for build-to-suit project for other<br />
Samsung suppliers during <strong>2012</strong> in or nearby the El Florido<br />
Industrial Park. Lease rates will rise during <strong>2012</strong> in<br />
submarkets lacking sufficient inventory to support new<br />
demand. <strong>2012</strong> is expected to continue as a tenant’s market<br />
in submarkets with excess inventory.<br />
Two Class A office towers were completed during 2011;<br />
Corporativo Tapachula and World Trade Center. Office lease<br />
rates remained flat. <strong>2012</strong> will reflect clients relocating to trade<br />
for better quality space and/or to consolidate from other<br />
locations in Tijuana.<br />
Retail investment from domestic and international firms<br />
continued during 2011. <strong>2012</strong> will see a limited amount<br />
of new commercial centers with the biggest projects<br />
concentrated in the southeast and south (Blvd 2000).<br />
The critical mass of industrial firms, well developed industrial<br />
clusters with a proximity to western US markets and a 40 year<br />
history with foreign manufacturers, makes Tijuana a strong<br />
market for investors.<br />
Tijuana At A Glance<br />
RENT/SF/YR<br />
low High effective avg. Vacancy<br />
doWntoWn offIce<br />
New Construction (AAA)<br />
Class A (Prime)<br />
Class B (Secondary)<br />
suburban offIce<br />
New Construction (AAA)<br />
Class A (Prime)<br />
Class B (Secondary)<br />
IndustrIal<br />
$<br />
$<br />
$<br />
$<br />
20.00<br />
13.00<br />
6.50<br />
N/A<br />
N/A<br />
5.50<br />
$ 25.00<br />
$ 20.00<br />
$ 13.00<br />
N/A<br />
N/A<br />
$ 11.00<br />
$<br />
$<br />
$<br />
$<br />
22.00<br />
16.50<br />
9.00<br />
N/A<br />
N/A<br />
8.00<br />
32.00%<br />
18.00%<br />
25.00%<br />
N/A<br />
N/A<br />
25.00%<br />
Bulk Warehouse<br />
Manufacturing<br />
High Tech/R&D<br />
retaIl<br />
Downtown<br />
$<br />
$<br />
3.00<br />
3.00<br />
N/A<br />
N/A<br />
$<br />
$<br />
4.80<br />
4.80<br />
N/A<br />
N/A<br />
$<br />
$<br />
3.96<br />
3.96<br />
N/A<br />
N/A<br />
28.00%<br />
10.00%<br />
N/A<br />
N/A<br />
Neighborhood Service Centers<br />
Community Power Center<br />
Regional Malls<br />
Solus Food Stores<br />
$<br />
$<br />
10.00<br />
N/A<br />
15.00<br />
N/A<br />
$ 20.00<br />
N/A<br />
$ 40.00<br />
N/A<br />
$<br />
$<br />
15.00<br />
N/A<br />
25.00<br />
N/A<br />
8.00%<br />
N/A<br />
5.00%<br />
N/A<br />
deVeloPment land low/m 2 High/m 2 low/acre High/acre<br />
Office in CBD<br />
Land in Office Parks<br />
Land in Industrial Parks<br />
Office/Industrial Land - Non-park<br />
Retail/Commercial Land<br />
Residential<br />
3.9%<br />
$1,041.09<br />
$9,489.19<br />
3.2%<br />
4.5%<br />
4.5%<br />
109.713<br />
$ 43.00 $ 1,500.00 $ 174,015.09 $ 6,070,294.00<br />
N/A N/A N/A N/A<br />
$ 60.00 $ 100.00 $ 242,811.76 $ 404,686.27<br />
$ 50.00 $ 130.00 $ 202,343.13 $ 526,092.15<br />
$ 30.00 $ 1,500.00 $ 121,405.88 $ 6,070,294.00<br />
$ 80.00 $ 450.00 $ 323,749.01 $ 1,821,088.20<br />
Panama City, Republic of Panama<br />
Contact<br />
<strong>NAI</strong> Panama<br />
+1 507 302 0105<br />
Country Data<br />
Area (Sq Mi)<br />
GDP Growth<br />
GDP 2011 (US$ B)<br />
GDP/Capita (US$)<br />
Inflation Rate<br />
Unemployment Rate<br />
Interest Rate<br />
Population (Millions)<br />
Panama City At A Glance<br />
Panama has long been the crossroads of the Americas and<br />
the crux of commerce for over 500 years. Today, Panama’s<br />
advantageous location continues to drive business in a variety<br />
of sectors as evidenced by Panama housing the second<br />
largest free trade zone in the world, the largest financial center<br />
in Latin America, a port system that boasts more cranes then<br />
Brazil and better then 10% GDP growth the first half of 2011.<br />
Considered the regional hub for the Americas, firms like<br />
Procter & Gamble, Caterpillar, 3M, Dell, BASF and 3PL have<br />
established significant operations in Panama, taking advantage<br />
of several fiscal benefits and world class infrastructure.<br />
Development activity in downtown Panama City, as well as<br />
the suburbs, has continued to grow to support office and<br />
warehousing needs. Class A industrial parks have seen<br />
strong growth over the last year with several important<br />
projects breaking ground to provide mixed use solutions for<br />
warehouse, showroom, office, hotel and convention space.<br />
The International Airport and the Panama Canal are both<br />
undergoing expansion projects to keep pace with the demand.<br />
Office vacancy has remained under 6% throughout 2011.<br />
With a total existing office inventory of 838,911 SM, Class<br />
A+ buildings make up 8% (70,750 SM) of the total existing<br />
inventory and leases on average for $27.63/SM/month. Class<br />
A demand is strong with average lease rates of<br />
$24.38/SM/month and vacancy rates under 3%. Average<br />
common area maintenance fees range from $1.35/SM/month<br />
in Class C office to $2.43/SM/month in Class A+. <strong>Market</strong><br />
average maintenance fees are $1.73/SM/month. Construction<br />
in the office market continues to plow forward with over 25<br />
office projects underway as of Q3 2011. A total of 601,745<br />
SM are currently under construction representing an<br />
impressive 72% increase over existing inventory. Average sale<br />
list price for office under construction is $2,435.54/SM.<br />
Retail is in high demand. Several commercial strip malls are<br />
under construction throughout the city, particularly in the<br />
suburbs, where land values make the small projects more<br />
attractive. Retail lease rates range anywhere from $20 to<br />
$35/SM/month, with high end retail asking for upwards of<br />
$40 to $80/SM/month.<br />
Panama’s outlook for the future is extremely positive. The<br />
Latin Business Chronicle expects Panama to post the highest<br />
GDP growth in Latin America for the next five years.<br />
Multinational corporations continue to see the value in<br />
Panama as new organizations establish regional operations<br />
in the country on a regular basis.<br />
RENT/M 2 /MO<br />
US$ RENT/SF/YR<br />
low High low High Vacancy<br />
doWntoWn offIce<br />
New Construction (AAA)<br />
Class A (Prime)<br />
Class B (Secondary)<br />
suburban offIce<br />
New Construction (AAA)<br />
Class A (Prime)<br />
Class B (Secondary)<br />
IndustrIal<br />
Bulk Warehouse<br />
Manufacturing<br />
Flex Space<br />
retaIl<br />
Downtown<br />
Neighborhood Service Centers<br />
Community Power Center<br />
Regional Malls<br />
Solus Food Stores<br />
$<br />
$<br />
$<br />
$<br />
$<br />
$<br />
$<br />
$<br />
22.00<br />
18.50<br />
16.00<br />
18.00<br />
18.00<br />
12.00<br />
4.00<br />
N/A<br />
N/A<br />
20.00<br />
N/A<br />
N/A<br />
N/A<br />
N/A<br />
$<br />
$<br />
$<br />
$<br />
$<br />
$<br />
$<br />
$<br />
28.00<br />
30.00<br />
23.00<br />
30.00<br />
35.00<br />
28.00<br />
9.00<br />
N/A<br />
N/A<br />
30.00<br />
N/A<br />
N/A<br />
N/A<br />
N/A<br />
$<br />
$<br />
$<br />
$<br />
$<br />
$<br />
$<br />
$<br />
24.53<br />
20.62<br />
17.84<br />
20.07<br />
20.07<br />
13.38<br />
4.46<br />
N/A<br />
N/A<br />
22.30<br />
N/A<br />
N/A<br />
N/A<br />
N/A<br />
$ 31.22<br />
$ 33.44<br />
$ 25.64<br />
$ 33.44<br />
$ 39.02<br />
$ 31.22<br />
$ 10.03<br />
N/A<br />
N/A<br />
$ 33.44<br />
N/A<br />
N/A<br />
N/A<br />
N/A<br />
N/A<br />
N/A<br />
N/A<br />
N/A<br />
N/A<br />
N/A<br />
N/A<br />
N/A<br />
N/A<br />
N/A<br />
N/A<br />
N/A<br />
N/A<br />
N/A<br />
deVeloPment land low/m 2 High/m 2 low/acre High/acre<br />
Office in CBD<br />
Land in Office Parks<br />
Land in Industrial Parks<br />
Office/Industrial Land - Non-park<br />
Retail/Commercial Land<br />
Residential<br />
29,119<br />
6.7%<br />
$29.94<br />
$8,340.11<br />
3.0%<br />
4.3%<br />
N/A<br />
3.59<br />
$ 1,500.00 $ 2,800.00 $ 6,070,294.00 $ 11,331,215.48<br />
N/A N/A N/A N/A<br />
$ 110.00 $ 650.00 $ 445,154.89 $ 2,630,460.74<br />
N/A N/A N/A N/A<br />
$ 400.00 $ 2,000.00 $ 1,618,745.07 $ 8,093,725.34<br />
$ 400.00 $ 1,800.00 $ 1,618,745.07 $ 7,284,352.81<br />
<strong>2012</strong> <strong>Global</strong> <strong>Market</strong> Report n www.naiglobal.com 77


