2012 Global Market report - NAI Global
2012 Global Market report - NAI Global
2012 Global Market report - NAI Global
You also want an ePaper? Increase the reach of your titles
YUMPU automatically turns print PDFs into web optimized ePapers that Google loves.
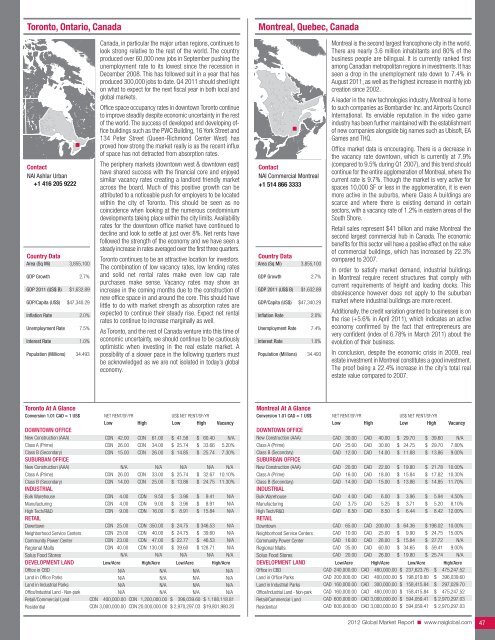
Toronto, Ontario, Canada<br />
Montreal, Quebec, Canada<br />
Contact<br />
<strong>NAI</strong> Ashlar Urban<br />
+1 416 205 9222<br />
Country Data<br />
Area (Sq Mi)<br />
GDP Growth<br />
GDP 2011 (US$ B)<br />
GDP/Capita (US$)<br />
Inflation Rate<br />
Unemployment Rate<br />
Interest Rate<br />
Population (Millions)<br />
3,855,100<br />
2.7%<br />
$1,632.89<br />
$47,340.29<br />
2.0%<br />
7.5%<br />
1.0%<br />
34.493<br />
Canada, in particular the major urban regions, continues to<br />
look strong relative to the rest of the world. The country<br />
produced over 60,000 new jobs in September pushing the<br />
unemployment rate to its lowest since the recession in<br />
December 2008. This has followed suit in a year that has<br />
produced 300,000 jobs to date. Q4 2011 should shed light<br />
on what to expect for the next fiscal year in both local and<br />
global markets.<br />
Office space occupancy rates in downtown Toronto continue<br />
to improve steadily despite economic uncertainty in the rest<br />
of the world. The success of developed and developing office<br />
buildings such as the PWC Building, 16 York Street and<br />
134 Peter Street (Queen-Richmond Center West) has<br />
proved how strong the market really is as the recent influx<br />
of space has not detracted from absorption rates.<br />
The periphery markets (downtown west & downtown east)<br />
have shared success with the financial core and enjoyed<br />
similar vacancy rates creating a landlord friendly market<br />
across the board. Much of this positive growth can be<br />
attributed to a noticeable push for employers to be located<br />
within the city of Toronto. This should be seen as no<br />
coincidence when looking at the numerous condominium<br />
developments taking place within the city limits. Availability<br />
rates for the downtown office market have continued to<br />
decline and look to settle at just over 8%. Net rents have<br />
followed the strength of the economy and we have seen a<br />
steady increase in rates averaged over the first three quarters.<br />
Toronto continues to be an attractive location for investors.<br />
The combination of low vacancy rates, low lending rates<br />
and solid net rental rates make even low cap rate<br />
purchases make sense. Vacancy rates may show an<br />
increase in the coming months due to the construction of<br />
new office space in and around the core. This should have<br />
little to do with market strength as absorption rates are<br />
expected to continue their steady rise. Expect net rental<br />
rates to continue to increase marginally as well.<br />
As Toronto, and the rest of Canada venture into this time of<br />
economic uncertainty, we should continue to be cautiously<br />
optimistic when investing in the real estate market. A<br />
possibility of a slower pace in the following quarters must<br />
be acknowledged as we are not isolated in today’s global<br />
economy.<br />
Contact<br />
<strong>NAI</strong> Commercial Montreal<br />
+1 514 866 3333<br />
Country Data<br />
Area (Sq Mi)<br />
GDP Growth<br />
GDP 2011 (US$ B)<br />
GDP/Capita (US$)<br />
Inflation Rate<br />
Unemployment Rate<br />
Interest Rate<br />
Population (Millions)<br />
3,855,100<br />
2.7%<br />
$1,632.89<br />
$47,340.29<br />
2.0%<br />
7.4%<br />
1.0%<br />
34.493<br />
Montreal is the second largest francophone city in the world.<br />
There are nearly 3.6 million inhabitants and 80% of the<br />
business people are bilingual. It is currently ranked first<br />
among Canadian metropolitan regions in investments. It has<br />
seen a drop in the unemployment rate down to 7.4% in<br />
August 2011, as well as the highest increase in monthly job<br />
creation since 2002.<br />
A leader in the new technologies industry, Montreal is home<br />
to such companies as Bombardier Inc. and Airports Council<br />
International. Its enviable reputation in the video game<br />
industry has been further maintained with the establishment<br />
of new companies alongside big names such as Ubisoft, EA<br />
Games and THQ.<br />
Office market data is encouraging. There is a decrease in<br />
the vacancy rate downtown, which is currently at 7.9%<br />
(compared to 9.5% during Q1 2007), and this trend should<br />
continue for the entire agglomeration of Montreal, where the<br />
current rate is 9.7%. Though the market is very active for<br />
spaces 10,000 SF or less in the agglomeration, it is even<br />
more active in the suburbs, where Class A buildings are<br />
scarce and where there is existing demand in certain<br />
sectors, with a vacancy rate of 1.2% in eastern areas of the<br />
South Shore.<br />
Retail sales represent $41 billion and make Montreal the<br />
second largest commercial hub in Canada. The economic<br />
benefits for this sector will have a positive effect on the value<br />
of commercial buildings, which has increased by 22.3%<br />
compared to 2007.<br />
In order to satisfy market demand, industrial buildings<br />
in Montreal require recent structures that comply with<br />
current requirements of height and loading docks. This<br />
obsolescence however does not apply to the suburban<br />
market where industrial buildings are more recent.<br />
Additionally, the credit variation granted to businesses is on<br />
the rise (+5.6% in April 2011), which indicates an active<br />
economy confirmed by the fact that entrepreneurs are<br />
very confident (index of 6.78% in March 2011) about the<br />
evolution of their business.<br />
In conclusion, despite the economic crisis in 2009, real<br />
estate investment in Montreal constitutes a good investment.<br />
The proof being a 22.4% increase in the city’s total real<br />
estate value compared to 2007.<br />
Toronto At A Glance<br />
conversion 1.01 cad = 1 us$ NET RENT/SF/YR US$ NET RENT/SF/YR<br />
low High low High Vacancy<br />
doWntoWn offIce<br />
New Construction (AAA)<br />
Class A (Prime)<br />
Class B (Secondary)<br />
suburban offIce<br />
New Construction (AAA)<br />
CDN 42.00<br />
CDN 26.00<br />
CDN 15.00<br />
N/A<br />
CDN<br />
CDN<br />
CDN<br />
61.00<br />
34.00<br />
26.00<br />
N/A<br />
$ 41.58<br />
$ 25.74<br />
$ 14.85<br />
N/A<br />
$ 60.40<br />
$ 33.66<br />
$ 25.74<br />
N/A<br />
N/A<br />
5.20%<br />
7.30%<br />
N/A<br />
Class A (Prime)<br />
Class B (Secondary)<br />
IndustrIal<br />
CDN 26.00<br />
CDN 14.00<br />
CDN<br />
CDN<br />
33.00<br />
25.00<br />
$ 25.74<br />
$ 13.86<br />
$ 32.67 10.10%<br />
$ 24.75 11.30%<br />
Bulk Warehouse<br />
Manufacturing<br />
CDN<br />
CDN<br />
4.00<br />
4.00<br />
CDN<br />
CDN<br />
9.50<br />
9.00<br />
$<br />
$<br />
3.96<br />
3.96<br />
$<br />
$<br />
9.41<br />
8.91<br />
N/A<br />
N/A<br />
High Tech/R&D<br />
retaIl<br />
CDN 9.00 CDN 16.00 $ 8.91 $ 15.84 N/A<br />
Downtown<br />
CDN 25.00 CDN 350.00 $ 24.75 $ 346.53 N/A<br />
Neighborhood Service Centers<br />
Community Power Center<br />
CDN 25.00<br />
CDN 23.00<br />
CDN<br />
CDN<br />
40.00<br />
47.00<br />
$ 24.75<br />
$ 22.77<br />
$ 39.60<br />
$ 46.53<br />
N/A<br />
N/A<br />
Regional Malls<br />
Solus Food Stores<br />
CDN 40.00<br />
N/A<br />
CDN 130.00<br />
N/A<br />
$ 39.60<br />
N/A<br />
$ 128.71<br />
N/A<br />
N/A<br />
N/A<br />
deVeloPment land low/acre High/acre low/acre High/acre<br />
Office in CBD<br />
Land in Office Parks<br />
Land in Industrial Parks<br />
Office/Industrial Land - Non-park<br />
Retail/Commercial Land<br />
Residential<br />
N/A N/A N/A N/A<br />
N/A N/A N/A N/A<br />
N/A N/A N/A N/A<br />
N/A N/A N/A N/A<br />
CDN 400,000.00 CDN 1,200,000.00 $ 396,039.60 $ 1,188,118.81<br />
CDN 3,000,000.00 CDN 20,000,000.00 $ 2,970,297.03 $19,801,980.20<br />
Montreal At A Glance<br />
conversion 1.01 cad = 1 us$ NET RENT/SF/YR US$ NET RENT/SF/YR<br />
low High low High Vacancy<br />
doWntoWn offIce<br />
New Construction (AAA)<br />
Class A (Prime)<br />
Class B (Secondary)<br />
suburban offIce<br />
New Construction (AAA)<br />
Class A (Prime)<br />
Class B (Secondary)<br />
IndustrIal<br />
CAD 30.00<br />
CAD 25.00<br />
CAD 12.00<br />
CAD 20.00<br />
CAD 16.00<br />
CAD 14.00<br />
CAD<br />
CAD<br />
CAD<br />
CAD<br />
CAD<br />
CAD<br />
40.00<br />
30.00<br />
14.00<br />
22.00<br />
18.00<br />
15.00<br />
$ 29.70<br />
$ 24.75<br />
$ 11.88<br />
$ 19.80<br />
$ 15.84<br />
$ 13.86<br />
$ 39.60<br />
$ 29.70<br />
$ 13.86<br />
$ 21.78<br />
$ 17.82<br />
$ 14.85<br />
N/A<br />
7.80%<br />
9.00%<br />
10.00%<br />
10.30%<br />
11.70%<br />
Bulk Warehouse<br />
Manufacturing<br />
High Tech/R&D<br />
retaIl<br />
CAD<br />
CAD<br />
CAD<br />
4.00<br />
3.75<br />
6.50<br />
CAD<br />
CAD<br />
CAD<br />
6.00<br />
5.25<br />
8.50<br />
$<br />
$<br />
$<br />
3.96<br />
3.71<br />
6.44<br />
$<br />
$<br />
$<br />
5.94<br />
5.20<br />
8.42<br />
4.50%<br />
8.10%<br />
12.00%<br />
Downtown<br />
CAD 65.00 CAD 200.00 $ 64.36 $ 198.02 10.00%<br />
Neighborhood Service Centers CAD 10.00 CAD 25.00 $ 9.90 $ 24.75 15.00%<br />
Community Power Center<br />
Regional Malls<br />
Solus Food Stores<br />
CAD 16.00<br />
CAD 35.00<br />
CAD 20.00<br />
CAD<br />
CAD<br />
CAD<br />
28.00<br />
60.00<br />
26.00<br />
$ 15.84<br />
$ 34.65<br />
$ 19.80<br />
$ 27.72<br />
$ 59.41<br />
$ 25.74<br />
N/A<br />
9.00%<br />
N/A<br />
deVeloPment land low/acre High/acre low/acre High/acre<br />
Office in CBD<br />
Land in Office Parks<br />
Land in Industrial Parks<br />
Office/Industrial Land - Non-park<br />
Retail/Commercial Land<br />
Residential<br />
CAD 240,000.00 CAD 480,000.00 $ 237,623.76 $ 475,247.52<br />
CAD 200,000.00 CAD 400,000.00 $ 198,019.80 $ 396,039.60<br />
CAD 160,000.00 CAD 300,000.00 $ 158,415.84 $ 297,029.70<br />
CAD 160,000.00 CAD 480,000.00 $ 158,415.84 $ 475,247.52<br />
CAD 600,000.00 CAD 3,000,000.00 $ 594,059.41 $ 2,970,297.03<br />
CAD 600,000.00 CAD 3,000,000.00 $ 594,059.41 $ 2,970,297.03<br />
<strong>2012</strong> <strong>Global</strong> <strong>Market</strong> Report n www.naiglobal.com 47


