2012 Global Market report - NAI Global
2012 Global Market report - NAI Global
2012 Global Market report - NAI Global
Create successful ePaper yourself
Turn your PDF publications into a flip-book with our unique Google optimized e-Paper software.
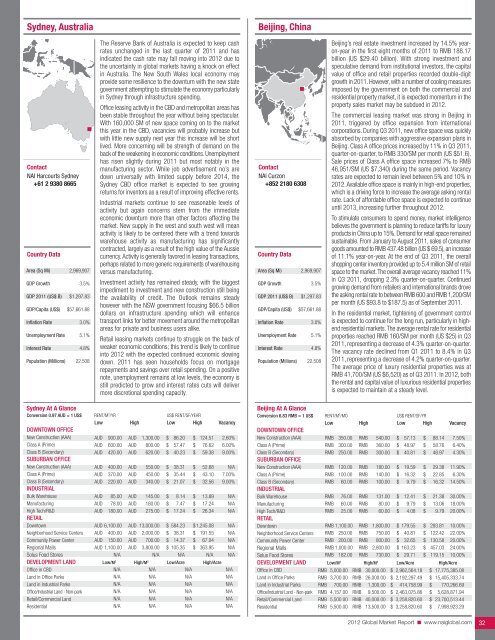
Sydney, Australia<br />
Beijing, China<br />
Contact<br />
<strong>NAI</strong> Harcourts Sydney<br />
+61 2 9380 8665<br />
Country Data<br />
Area (Sq Mi)<br />
GDP Growth<br />
GDP 2011 (US$ B)<br />
GDP/Capita (US$)<br />
Inflation Rate<br />
Unemployment Rate<br />
Interest Rate<br />
Population (Millions)<br />
2,969,907<br />
3.5%<br />
$1,297.83<br />
$57,661.88<br />
3.0%<br />
5.1%<br />
4.8%<br />
22.508<br />
The Reserve Bank of Australia is expected to keep cash<br />
rates unchanged in the last quarter of 2011 and has<br />
indicated the cash rate may fall moving into <strong>2012</strong> due to<br />
the uncertainty in global markets having a knock on effect<br />
in Australia. The New South Wales local economy may<br />
provide some resilience to the downturn with the new state<br />
government attempting to stimulate the economy particularly<br />
in Sydney through infrastructure spending.<br />
Office leasing activity in the CBD and metropolitan areas has<br />
been stable throughout the year without being spectacular.<br />
With 160,000 SM of new space coming on to the market<br />
this year in the CBD, vacancies will probably increase but<br />
with little new supply next year this increase will be short<br />
lived. More concerning will be strength of demand on the<br />
back of the weakening in economic conditions. Unemployment<br />
has risen slightly during 2011 but most notably in the<br />
manufacturing sector. While job advertisement no’s are<br />
down universally with limited supply before 2014, the<br />
Sydney CBD office market is expected to see growing<br />
returns for inventors as a result of improving effective rents.<br />
Industrial markets continue to see reasonable levels of<br />
activity but again concerns stem from the immediate<br />
economic downturn more than other factors affecting the<br />
market. New supply in the west and south west will mean<br />
activity is likely to be centered there with a trend towards<br />
warehouse activity as manufacturing has significantly<br />
contracted, largely as a result of the high value of the Aussie<br />
currency. Activity is generally favored in leasing transactions,<br />
perhaps related to more generic requirements of warehousing<br />
versus manufacturing.<br />
Investment activity has remained steady, with the biggest<br />
impediment to investment and new construction still being<br />
the availability of credit. The Outlook remains steady<br />
however with the NSW government focusing $66.5 billion<br />
dollars on infrastructure spending which will enhance<br />
transport links for better movement around the metropolitan<br />
areas for private and business users alike.<br />
Retail leasing markets continue to struggle on the back of<br />
weaker economic conditions; this trend is likely to continue<br />
into <strong>2012</strong> with the expected continued economic slowing<br />
down. 2011 has seen households focus on mortgage<br />
repayments and savings over retail spending. On a positive<br />
note, unemployment remains at low levels, the economy is<br />
still predicted to grow and interest rates cuts will deliver<br />
more discretional spending capacity.<br />
Contact<br />
<strong>NAI</strong> Curzon<br />
+852 2180 6308<br />
Country Data<br />
Area (Sq Mi)<br />
GDP Growth<br />
GDP 2011 (US$ B)<br />
GDP/Capita (US$)<br />
Inflation Rate<br />
Unemployment Rate<br />
Interest Rate<br />
Population (Millions)<br />
2,969,907<br />
3.5%<br />
$1,297.83<br />
$57,661.88<br />
3.0%<br />
5.1%<br />
4.8%<br />
22.508<br />
Beijing’s real estate investment increased by 14.5% yearon-year<br />
in the first eight months of 2011 to RMB 188.17<br />
billion (US $29.40 billion). With strong investment and<br />
speculative demand from institutional investors, the capital<br />
value of office and retail properties recorded double-digit<br />
growth in 2011. However, with a number of cooling measures<br />
imposed by the government on both the commercial and<br />
residential property market, it is expected momentum in the<br />
property sales market may be subdued in <strong>2012</strong>.<br />
The commercial leasing market was strong in Beijing in<br />
2011, triggered by office expansion from international<br />
corporations. During Q3 2011, new office space was quickly<br />
absorbed by companies with aggressive expansion plans in<br />
Beijing. Class A office prices increased by 11% in Q3 2011,<br />
quarter-on-quarter, to RMB 330/SM per month (US $51.6).<br />
Sale prices of Class A office space increased 7% to RMB<br />
46,951/SM (US $7,340) during the same period. Vacancy<br />
rates are expected to remain level between 5% and 10% in<br />
<strong>2012</strong>. Available office space is mainly in high-end properties,<br />
which is a driving force to increase the average asking rental<br />
rate. Lack of affordable office space is expected to continue<br />
until 2013, increasing further throughout <strong>2012</strong>.<br />
To stimulate consumers to spend money, market intelligence<br />
believes the government is planning to reduce tariffs for luxury<br />
products in China up to 15%. Demand for retail space remained<br />
sustainable. From January to August 2011, sales of consumer<br />
goods amounted to RMB 437.48 billion (US $ 69.5), an increase<br />
of 11.1% year-on-year. At the end of Q3 2011, the overall<br />
shopping center inventory provided up to 5.4 million SM of retail<br />
space to the market. The overall average vacancy reached 11%<br />
in Q3 2011, dropping 2.3% quarter-on-quarter. Continued<br />
growing demand from retailers and international brands drove<br />
the asking rental rate to between RMB 600 and RMB 1,200/SM<br />
per month (US $93.8 to $187.5) as of September 2011.<br />
In the residential market, tightening of government control<br />
is expected to continue for the long run, particularly in highend<br />
residential markets. The average rental rate for residential<br />
properties reached RMB 160/SM per month (US $25) in Q3<br />
2011, representing a decrease of 4.3% quarter-on-quarter.<br />
The vacancy rate declined from Q1 2011 to 8.4% in Q3<br />
2011, representing a decrease of 4.2% quarter-on-quarter.<br />
The average price of luxury residential properties was at<br />
RMB 41,700/SM (US $6,520) as of Q3 2011. In <strong>2012</strong>, both<br />
the rental and capital value of luxurious residential properties<br />
is expected to maintain at a steady level.<br />
Sydney At A Glance<br />
conversion 0.97 aud = 1 us$ RENT/M 2 /YR US$ RENT/SF/YEAR<br />
low High low High Vacancy<br />
doWntoWn offIce<br />
New Construction (AAA)<br />
Class A (Prime)<br />
Class B (Secondary)<br />
suburban offIce<br />
New Construction (AAA)<br />
Class A (Prime)<br />
Class B (Secondary)<br />
IndustrIal<br />
Bulk Warehouse<br />
Manufacturing<br />
High Tech/R&D<br />
retaIl<br />
AUD<br />
AUD<br />
AUD<br />
AUD<br />
AUD<br />
AUD<br />
AUD<br />
AUD<br />
AUD<br />
900.00<br />
600.00<br />
420.00<br />
400.00<br />
370.00<br />
220.00<br />
85.00<br />
78.00<br />
180.00<br />
AUD<br />
AUD<br />
AUD<br />
AUD<br />
AUD<br />
AUD<br />
AUD<br />
AUD<br />
AUD<br />
1,300.00<br />
800.00<br />
620.00<br />
550.00<br />
450.00<br />
340.00<br />
145.00<br />
180.00<br />
275.00<br />
$<br />
$<br />
$<br />
$<br />
$<br />
$<br />
$<br />
$<br />
$<br />
86.20<br />
57.47<br />
40.23<br />
38.31<br />
35.44<br />
21.07<br />
8.14<br />
7.47<br />
17.24<br />
$<br />
$<br />
$<br />
$<br />
$<br />
$<br />
$<br />
$<br />
$<br />
124.51<br />
76.62<br />
59.38<br />
52.68<br />
43.10<br />
32.56<br />
13.89<br />
17.24<br />
26.34<br />
2.60%<br />
6.00%<br />
9.00%<br />
N/A<br />
7.00%<br />
9.00%<br />
N/A<br />
N/A<br />
N/A<br />
Downtown<br />
AUD 6,100.00 AUD 13,000.00 $ 584.23 $ 1,245.08 N/A<br />
Neighborhood Service Centers AUD 400.00 AUD 2,000.00 $ 38.31 $ 191.55 N/A<br />
Community Power Center AUD150.00 AUD 700.00 $ 14.37 $ 67.04 N/A<br />
Regional Malls<br />
Solus Food Stores<br />
AUD 1,100.00<br />
N/A<br />
AUD 3,800.00<br />
N/A<br />
$ 105.35<br />
N/A<br />
$ 363.95<br />
N/A<br />
N/A<br />
N/A<br />
deVeloPment land low/m 2 High/m 2 low/acre High/acre<br />
Office in CBD<br />
Land in Office Parks<br />
Land in Industrial Parks<br />
Office/Industrial Land - Non-park<br />
Retail/Commercial Land<br />
Residential<br />
N/A N/A N/A N/A<br />
N/A N/A N/A N/A<br />
N/A N/A N/A N/A<br />
N/A N/A N/A N/A<br />
N/A N/A N/A N/A<br />
N/A N/A N/A N/A<br />
Beijing At A Glance<br />
conversion 6.83 rmb = 1 us$ RENT/M 2 /MO US$ RENT/SF/YR<br />
low High low High Vacancy<br />
doWntoWn offIce<br />
New Construction (AAA) RMB 350.00 RMB 540.00 $ 57.13 $ 88.14 7.50%<br />
Class A (Prime)<br />
RMB 300.00 RMB 360.00 $ 48.97 $ 58.76 6.40%<br />
Class B (Secondary)<br />
suburban offIce<br />
New Construction (AAA)<br />
Class A (Prime)<br />
RMB 250.00<br />
RMB 120.00<br />
RMB 100.00<br />
RMB<br />
RMB<br />
RMB<br />
300.00<br />
180.00<br />
140.00<br />
$<br />
$<br />
$<br />
40.81<br />
19.59<br />
16.32<br />
$<br />
$<br />
$<br />
48.97<br />
29.38<br />
22.85<br />
4.30%<br />
11.90%<br />
6.30%<br />
Class B (Secondary)<br />
IndustrIal<br />
Bulk Warehouse<br />
Manufacturing<br />
High Tech/R&D<br />
retaIl<br />
RMB<br />
RMB<br />
RMB<br />
RMB<br />
60.00<br />
76.00<br />
60.00<br />
25.00<br />
RMB<br />
RMB<br />
RMB<br />
RMB<br />
100.00<br />
131.00<br />
80.00<br />
60.00<br />
$<br />
$<br />
$<br />
$<br />
9.79<br />
12.41<br />
9.79<br />
4.08<br />
$<br />
$<br />
$<br />
$<br />
16.32<br />
21.38<br />
13.06<br />
9.79<br />
14.50%<br />
30.00%<br />
18.00%<br />
20.00%<br />
Downtown<br />
RMB 1,100.00 RMB 1,800.00 $ 179.55 $ 293.81 10.00%<br />
Neighborhood Service Centers RMB 250.00 RMB 750.00 $ 40.81 $ 122.42 22.00%<br />
Community Power Center RMB 200.00 RMB 800.00 $ 32.65 $ 130.58 20.00%<br />
Regional Malls<br />
RMB 1,000.00 RMB 2,800.00 $ 163.23 $ 457.03 24.00%<br />
Solus Food Stores<br />
RMB 182.00 RMB 730.00 $ 29.71 $ 119.15 10.00%<br />
deVeloPment land low/m 2 High/m 2 low/acre High/acre<br />
Office in CBD<br />
Land in Office Parks<br />
Land in Industrial Parks<br />
Office/Industrial Land - Non-park<br />
Retail/Commercial Land<br />
Residential<br />
RMB 5,000.00 RMB 30,000.00 $ 2,962,564.18 $ 17,775,385.08<br />
RMB 3,700.00 RMB 26,000.00 $ 2,192,297.49 $ 15,405,333.74<br />
RMB 700.00 RMB 1,300.00 $ 414,758.99 $ 770,266.69<br />
RMB 4,157.00 RMB 9,500.00 $ 2,463,075.86 $ 5,628,871.94<br />
RMB 5,500.00 RMB 40,000.00 $ 3,258,820.60 $ 23,700,513.44<br />
RMB 5,500.00 RMB 13,500.00 $ 3,258,820.60 $ 7,998,923.29<br />
<strong>2012</strong> <strong>Global</strong> <strong>Market</strong> Report n www.naiglobal.com 32


