2012 Global Market report - NAI Global
2012 Global Market report - NAI Global
2012 Global Market report - NAI Global
You also want an ePaper? Increase the reach of your titles
YUMPU automatically turns print PDFs into web optimized ePapers that Google loves.
Houston, Texas<br />
Contact<br />
<strong>NAI</strong> Houston<br />
+1 713 629 0500<br />
Metropolitan Area<br />
Economic Overview<br />
2011<br />
Population<br />
2016 Estimated<br />
Population<br />
Employment<br />
Population<br />
Household<br />
Average Income<br />
Median<br />
Household Income<br />
Total Population<br />
Median Age<br />
6,106,419<br />
6,744,892<br />
3,106,316<br />
$79,886<br />
$57,045<br />
32<br />
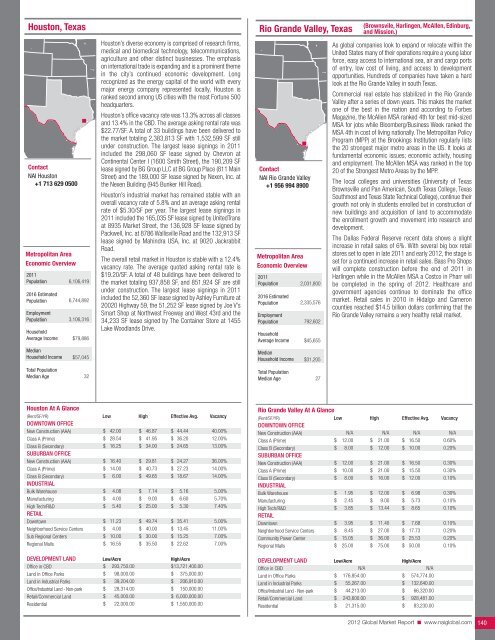
Houston’s diverse economy is comprised of research firms,<br />
medical and biomedical technology, telecommunications,<br />
agriculture and other distinct businesses. The emphasis<br />
on international trade is expanding and is a prominent theme<br />
in the city’s continued economic development. Long<br />
recognized as the energy capital of the world with every<br />
major energy company represented locally, Houston is<br />
ranked second among US cities with the most Fortune 500<br />
headquarters.<br />
Houston’s office vacancy rate was 13.3% across all classes<br />
and 13.4% in the CBD. The average asking rental rate was<br />
$22.77/SF. A total of 33 buildings have been delivered to<br />
the market totaling 2,383,813 SF with 1,532,599 SF still<br />
under construction. The largest lease signings in 2011<br />
included the 298,060 SF lease signed by Chevron at<br />
Continental Center I (1600 Smith Street), the 190,209 SF<br />
lease signed by BG Group LLC at BG Group Place (811 Main<br />
Street) and the 189,000 SF lease signed by Nexen, Inc. at<br />
the Nexen Building (945 Bunker Hill Road).<br />
Houston’s industrial market has remained stable with an<br />
overall vacancy rate of 5.8% and an average asking rental<br />
rate of $5.30/SF per year. The largest lease signings in<br />
2011 included the 165,035 SF lease signed by UnitedTrans<br />
at 8935 <strong>Market</strong> Street, the 136,928 SF lease signed by<br />
Packwell, Inc. at 8786 Wallisville Road and the 132,913 SF<br />
lease signed by Mahindra USA, Inc. at 9020 Jackrabbit<br />
Road.<br />
The overall retail market in Houston is stable with a 12.4%<br />
vacancy rate. The average quoted asking rental rate is<br />
$19.20/SF. A total of 48 buildings have been delivered to<br />
the market totaling 937,858 SF, and 851,924 SF are still<br />
under construction. The largest lease signings in 2011<br />
included the 52,360 SF lease signed by Ashley Furniture at<br />
20020 Highway 59, the 51,252 SF lease signed by Joe V’s<br />
Smart Shop at Northwest Freeway and West 43rd and the<br />
34,233 SF lease signed by The Container Store at 1455<br />
Lake Woodlands Drive.<br />
Rio Grande Valley, Texas<br />
Contact<br />
<strong>NAI</strong> Rio Grande Valley<br />
+1 956 994 8900<br />
Metropolitan Area<br />
Economic Overview<br />
2011<br />
Population<br />
2016 Estimated<br />
Population<br />
Employment<br />
Population<br />
Household<br />
Average Income<br />
Median<br />
Household Income<br />
Total Population<br />
Median Age<br />
2,031,800<br />
2,335,576<br />
792,602<br />
$45,655<br />
$31,205<br />
27<br />
(Brownsvile, Harlingen, McAllen, Edinburg,<br />
and Mission.)<br />
As global companies look to expand or relocate within the<br />
United States many of their operations require a young labor<br />
force, easy access to international sea, air and cargo ports<br />
of entry, low cost of living, and access to development<br />
opportunities. Hundreds of companies have taken a hard<br />
look at the Rio Grande Valley in south Texas.<br />
Commercial real estate has stabilized in the Rio Grande<br />
Valley after a series of down years. This makes the market<br />
one of the best in the nation and according to Forbes<br />
Magazine, the McAllen MSA ranked 4th for best mid-sized<br />
MSA for jobs while Bloomberg/Business Week ranked the<br />
MSA 4th in cost of living nationally. The Metropolitan Policy<br />
Program (MPP) at the Brookings Institution regularly lists<br />
the 20 strongest major metro areas in the US. It looks at<br />
fundamental economic issues; economic activity, housing<br />
and employment. The McAllen MSA was ranked in the top<br />
20 of the Strongest Metro Areas by the MPP.<br />
The local colleges and universities (University of Texas<br />
Brownsville and Pan American, South Texas College, Texas<br />
Southmost and Texas State Technical College), continue their<br />
growth not only in students enrolled but in construction of<br />
new buildings and acquisition of land to accommodate<br />
the enrollment growth and movement into research and<br />
development.<br />
The Dallas Federal Reserve recent data shows a slight<br />
increase in retail sales of 6%. With several big box retail<br />
stores set to open in late 2011 and early <strong>2012</strong>, the stage is<br />
set for a continued increase in retail sales. Bass Pro Shops<br />
will complete construction before the end of 2011 in<br />
Harlingen while in the McAllen MSA a Costco in Pharr will<br />
be completed in the spring of <strong>2012</strong>. Healthcare and<br />
government agencies continue to dominate the office<br />
market. Retail sales in 2010 in Hidalgo and Cameron<br />
counties reached $14.5 billion dollars confirming that the<br />
Rio Grande Valley remains a very healthy retail market.<br />
Houston At A Glance<br />
(Rent/SF/YR) low High effective avg. Vacancy<br />
doWntoWn offIce<br />
New Construction (AAA)<br />
Class A (Prime)<br />
Class B (Secondary)<br />
suburban offIce<br />
New Construction (AAA)<br />
Class A (Prime)<br />
$ 42.00<br />
$ 28.54<br />
$ 16.25<br />
$ 16.40<br />
$ 14.00<br />
$ 46.87<br />
$ 41.95<br />
$ 34.00<br />
$ 29.81<br />
$ 40.73<br />
$ 44.44<br />
$ 36.20<br />
$ 24.65<br />
$ 24.27<br />
$ 27.23<br />
40.00%<br />
12.00%<br />
13.00%<br />
36.00%<br />
14.00%<br />
Class B (Secondary)<br />
IndustrIal<br />
$ 6.00 $ 49.65 $ 18.67 14.00%<br />
Bulk Warehouse<br />
Manufacturing<br />
$<br />
$<br />
4.08<br />
4.00<br />
$<br />
$<br />
7.14<br />
9.00<br />
$<br />
$<br />
5.16<br />
6.60<br />
5.00%<br />
5.70%<br />
High Tech/R&D<br />
retaIl<br />
$ 5.40 $ 25.00 $ 5.30 7.40%<br />
Downtown<br />
$ 11.23 $ 49.74 $ 35.41 5.00%<br />
Neighborhood Service Centers $ 4.00 $ 40.00 $ 13.45 11.00%<br />
Sub Regional Centers<br />
Regional Malls<br />
$ 10.00<br />
$ 16.55<br />
$ 30.00<br />
$ 35.50<br />
$ 15.25<br />
$ 22.62<br />
7.00%<br />
7.00%<br />
deVeloPment land Low/Acre High/Acre<br />
Office in CBD<br />
$ 293,750.00 $13,721,400.00<br />
Land in Office Parks<br />
Land in Industrial Parks<br />
Office/Industrial Land - Non-park<br />
$<br />
$<br />
$<br />
98,000.00<br />
39,204.00<br />
28,314.00<br />
$<br />
$<br />
$<br />
375,000.00<br />
206,910.00<br />
150,000.00<br />
Retail/Commercial Land<br />
Residential<br />
$<br />
$<br />
45,000.00<br />
22,000.00<br />
$ 6,000,000.00<br />
$ 1,550,000.00<br />
Rio Grande Valley At A Glance<br />
(Rent/SF/YR) low High effective avg. Vacancy<br />
doWntoWn offIce<br />
New Construction (AAA)<br />
Class A (Prime)<br />
Class B (Secondary)<br />
suburban offIce<br />
New Construction (AAA)<br />
Class A (Prime)<br />
Class B (Secondary)<br />
IndustrIal<br />
$<br />
$<br />
$<br />
$<br />
$<br />
N/A<br />
12.00<br />
8.00<br />
12.00<br />
10.00<br />
8.00<br />
$<br />
$<br />
$<br />
$<br />
$<br />
N/A<br />
21.00<br />
12.00<br />
21.00<br />
21.00<br />
16.00<br />
N/A<br />
$ 16.50<br />
$ 10.00<br />
$ 16.50<br />
$ 15.50<br />
$ 12.00<br />
N/A<br />
0.60%<br />
0.20%<br />
0.30%<br />
0.30%<br />
0.10%<br />
Bulk Warehouse<br />
Manufacturing<br />
High Tech/R&D<br />
retaIl<br />
Downtown<br />
$<br />
$<br />
$<br />
$<br />
1.95<br />
2.45<br />
3.85<br />
3.95<br />
$<br />
$<br />
$<br />
$<br />
12.00<br />
9.00<br />
13.44<br />
11.40<br />
$<br />
$<br />
$<br />
$<br />
6.98<br />
5.73<br />
8.65<br />
7.68<br />
0.30%<br />
0.10%<br />
0.10%<br />
0.10%<br />
Neighborhood Service Centers<br />
Community Power Center<br />
Regional Malls<br />
$<br />
$<br />
$<br />
8.45<br />
15.05<br />
25.00<br />
$<br />
$<br />
$<br />
27.00<br />
36.00<br />
75.00<br />
$ 17.73<br />
$ 25.53<br />
$ 50.00<br />
0.20%<br />
0.20%<br />
0.10%<br />
deVeloPment land Low/Acre High/Acre<br />
Office in CBD<br />
Land in Office Parks<br />
Land in Industrial Parks<br />
Office/Industrial Land - Non-park<br />
Retail/Commercial Land<br />
Residential<br />
$<br />
$<br />
$<br />
$<br />
$<br />
N/A<br />
176,854.00<br />
55,267.00<br />
44,213.00<br />
243,600.00<br />
21,315.00<br />
$<br />
$<br />
$<br />
$<br />
$<br />
N/A<br />
574,774.00<br />
132,640.00<br />
66,320.00<br />
928,481.00<br />
83,230.00<br />
<strong>2012</strong> <strong>Global</strong> <strong>Market</strong> Report n www.naiglobal.com 140


