2012 Global Market report - NAI Global
2012 Global Market report - NAI Global
2012 Global Market report - NAI Global
Create successful ePaper yourself
Turn your PDF publications into a flip-book with our unique Google optimized e-Paper software.
Grand Rapids, Michigan<br />
Lansing, Michigan<br />
Contact<br />
<strong>NAI</strong> West Michigan<br />
+1 616 776 0100<br />
Metropolitan Area<br />
Economic Overview<br />
2011<br />
Population<br />
2016 Estimated<br />
Population<br />
Employment<br />
Population<br />
Household<br />
Average Income<br />
Median<br />
Household Income<br />
1,322,233<br />
1,322,067<br />
690,695<br />
$61,589<br />
$50,372<br />
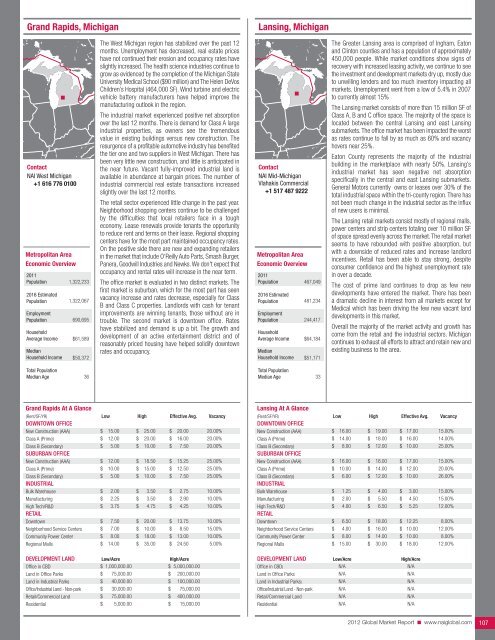
The West Michigan region has stabilized over the past 12<br />
months. Unemployment has decreased, real estate prices<br />
have not continued their erosion and occupancy rates have<br />
slightly increased. The health science industries continue to<br />
grow as evidenced by the completion of the Michigan State<br />
University Medical School ($90 million) and The Helen DeVos<br />
Children’s Hospital (464,000 SF). Wind turbine and electric<br />
vehicle battery manufacturers have helped improve the<br />
manufacturing outlook in the region.<br />
The industrial market experienced positive net absorption<br />
over the last 12 months. There is demand for Class A large<br />
industrial properties, as owners see the tremendous<br />
value in existing buildings versus new construction. The<br />
resurgence of a profitable automotive industry has benefited<br />
the tier one and two suppliers in West Michigan. There has<br />
been very little new construction, and little is anticipated in<br />
the near future. Vacant fully-improved industrial land is<br />
available in abundance at bargain prices. The number of<br />
industrial commercial real estate transactions increased<br />
slightly over the last 12 months.<br />
The retail sector experienced little change in the past year.<br />
Neighborhood shopping centers continue to be challenged<br />
by the difficulties that local retailers face in a tough<br />
economy. Lease renewals provide tenants the opportunity<br />
to reduce rent and terms on their lease. Regional shopping<br />
centers have for the most part maintained occupancy rates.<br />
On the positive side there are new and expanding retailers<br />
in the market that include O'Reilly Auto Parts, Smash Burger,<br />
Panera, Goodwill Industries and Newks. We don't expect that<br />
occupancy and rental rates will increase in the near term.<br />
The office market is evaluated in two distinct markets. The<br />
first market is suburban, which for the most part has seen<br />
vacancy increase and rates decrease, especially for Class<br />
B and Class C properties. Landlords with cash for tenant<br />
improvements are winning tenants, those without are in<br />
trouble. The second market is downtown office. Rates<br />
have stabilized and demand is up a bit. The growth and<br />
development of an active entertainment district and of<br />
reasonably priced housing have helped solidify downtown<br />
rates and occupancy.<br />
Contact<br />
<strong>NAI</strong> Mid-Michigan<br />
Vlahakis Commercial<br />
+1 517 487 9222<br />
Metropolitan Area<br />
Economic Overview<br />
2011<br />
Population<br />
2016 Estimated<br />
Population<br />
Employment<br />
Population<br />
Household<br />
Average Income<br />
Median<br />
Household Income<br />
467,049<br />
481,234<br />
244,417<br />
$64,184<br />
$51,171<br />
The Greater Lansing area is comprised of Ingham, Eaton<br />
and Clinton counties and has a population of approximately<br />
450,000 people. While market conditions show signs of<br />
recovery with increased leasing activity, we continue to see<br />
the investment and development markets dry up, mostly due<br />
to unwilling lenders and too much inventory impacting all<br />
markets. Unemployment went from a low of 5.4% in 2007<br />
to currently almost 15%<br />
The Lansing market consists of more than 15 million SF of<br />
Class A, B and C office space. The majority of the space is<br />
located between the central Lansing and east Lansing<br />
submarkets. The office market has been impacted the worst<br />
as rates continue to fall by as much as 60% and vacancy<br />
hovers near 25%.<br />
Eaton County represents the majority of the industrial<br />
building in the marketplace with nearly 50%. Lansing’s<br />
industrial market has seen negative net absorption<br />
specifically in the central and east Lansing submarkets.<br />
General Motors currently owns or leases over 30% of the<br />
total industrial space within the tri-county region. There has<br />
not been much change in the industrial sector as the influx<br />
of new users is minimal.<br />
The Lansing retail markets consist mostly of regional malls,<br />
power centers and strip centers totaling over 10 million SF<br />
of space spread evenly across the market. The retail market<br />
seems to have rebounded with positive absorption, but<br />
with a downside of reduced rates and increase landlord<br />
incentives. Retail has been able to stay strong, despite<br />
consumer confidence and the highest unemployment rate<br />
in over a decade.<br />
The cost of prime land continues to drop as few new<br />
developments have entered the market. There has been<br />
a dramatic decline in interest from all markets except for<br />
Medical which has been driving the few new vacant land<br />
developments in this market.<br />
Overall the majority of the market activity and growth has<br />
come from the retail and the industrial sectors. Michigan<br />
continues to exhaust all efforts to attract and retain new and<br />
existing business to the area.<br />
Total Population<br />
Median Age<br />
36<br />
Total Population<br />
Median Age<br />
33<br />
Grand Rapids At A Glance<br />
(Rent/SF/YR) low High effective avg. Vacancy<br />
doWntoWn offIce<br />
New Construction (AAA)<br />
$ 15.00 $ 25.00 $ 20.00 20.00%<br />
Class A (Prime)<br />
Class B (Secondary)<br />
suburban offIce<br />
New Construction (AAA)<br />
Class A (Prime)<br />
Class B (Secondary)<br />
IndustrIal<br />
Bulk Warehouse<br />
Manufacturing<br />
High Tech/R&D<br />
retaIl<br />
Downtown<br />
Neighborhood Service Centers<br />
Community Power Center<br />
Regional Malls<br />
$<br />
$<br />
$<br />
$<br />
$<br />
$<br />
$<br />
$<br />
$<br />
$<br />
$<br />
$<br />
12.00<br />
5.00<br />
12.00<br />
10.00<br />
5.00<br />
2.00<br />
2.25<br />
3.75<br />
7.50<br />
7.00<br />
8.00<br />
14.00<br />
$<br />
$<br />
$<br />
$<br />
$<br />
$<br />
$<br />
$<br />
$<br />
$<br />
$<br />
$<br />
20.00<br />
10.00<br />
18.50<br />
15.00<br />
10.00<br />
3.50<br />
3.50<br />
4.75<br />
20.00<br />
10.00<br />
18.00<br />
35.00<br />
$<br />
$<br />
$<br />
$<br />
$<br />
$<br />
$<br />
$<br />
$<br />
$<br />
$<br />
$<br />
16.00<br />
7.50<br />
15.25<br />
12.50<br />
7.50<br />
2.75<br />
2.90<br />
4.25<br />
13.75<br />
8.50<br />
13.00<br />
24.50<br />
20.00%<br />
20.00%<br />
25.00%<br />
25.00%<br />
25.00%<br />
10.00%<br />
10.00%<br />
10.00%<br />
10.00%<br />
15.00%<br />
10.00%<br />
5.00%<br />
deVeloPment land Low/Acre High/Acre<br />
Office in CBD<br />
$ 1,000,000.00 $ 5,000,000.00<br />
Land in Office Parks<br />
Land in Industrial Parks<br />
Office/Industrial Land - Non-park<br />
Retail/Commercial Land<br />
Residential<br />
$<br />
$<br />
$<br />
$<br />
$<br />
75,000.00<br />
40,000.00<br />
30,000.00<br />
75,000.00<br />
5,000.00<br />
$<br />
$<br />
$<br />
$<br />
$<br />
200,000.00<br />
100,000.00<br />
75,000.00<br />
400,000.00<br />
15,000.00<br />
Lansing At A Glance<br />
(Rent/SF/YR) low High effective avg. Vacancy<br />
doWntoWn offIce<br />
New Construction (AAA)<br />
Class A (Prime)<br />
Class B (Secondary)<br />
suburban offIce<br />
New Construction (AAA)<br />
Class A (Prime)<br />
Class B (Secondary)<br />
IndustrIal<br />
$<br />
$<br />
$<br />
$<br />
$<br />
$<br />
16.00<br />
14.00<br />
8.00<br />
16.00<br />
10.00<br />
6.00<br />
$<br />
$<br />
$<br />
$<br />
$<br />
$<br />
19.00<br />
18.00<br />
12.00<br />
18.00<br />
14.00<br />
12.00<br />
$ 17.00<br />
$ 16.00<br />
$ 10.00<br />
$ 17.00<br />
$ 12.00<br />
$ 10.00<br />
15.00%<br />
14.00%<br />
25.00%<br />
15.00%<br />
20.00%<br />
26.00%<br />
Bulk Warehouse<br />
Manufacturing<br />
High Tech/R&D<br />
retaIl<br />
$<br />
$<br />
$<br />
1.25<br />
2.00<br />
4.00<br />
$<br />
$<br />
$<br />
4.00<br />
5.50<br />
6.50<br />
$<br />
$<br />
$<br />
3.00<br />
4.50<br />
5.25<br />
15.00%<br />
15.00%<br />
12.00%<br />
Downtown<br />
Neighborhood Service Centers<br />
Community Power Center<br />
Regional Malls<br />
$<br />
$<br />
$<br />
$<br />
6.50<br />
4.00<br />
8.00<br />
15.00<br />
$<br />
$<br />
$<br />
$<br />
18.00<br />
16.00<br />
14.00<br />
30.00<br />
$ 12.25<br />
$ 10.00<br />
$ 10.00<br />
$ 18.00<br />
8.00%<br />
12.00%<br />
8.00%<br />
12.00%<br />
deVeloPment land Low/Acre High/Acre<br />
Office in CBD)<br />
Land in Office Parks<br />
Land in Industrial Parks)<br />
Office/Industrial Land - Non-park<br />
Retail/Commercial Land<br />
Residential<br />
N/A<br />
N/A<br />
N/A<br />
N/A<br />
N/A<br />
N/A<br />
N/A<br />
N/A<br />
N/A<br />
N/A<br />
N/A<br />
N/A<br />
<strong>2012</strong> <strong>Global</strong> <strong>Market</strong> Report n www.naiglobal.com 107


