

The Quick Count and Election Observation
The Quick Count and Election Observation
The Quick Count and Election Observation

Create successful ePaper yourself
Turn your PDF publications into a flip-book with our unique Google optimized e-Paper software.
CHAPTER FIVE: STATISTICAL PRINCIPLES AND QUICK COUNTS<br />
68 <strong>The</strong> formula, then, is as follows:<br />
For a dataset containing observations x 1<br />
, x 2<br />
, x 3<br />
… x n<br />
s 2 = (x 1 -x)2 + (x 2 -x) 2 + (x 3 -x) 2 ... (x n -x) 2<br />
n-1<br />
Where<br />
s 2 = variance<br />
x 1<br />
, x 2<br />
, x 3<br />
… x n<br />
are the observations<br />
x is the mean<br />
n is the number of observations<br />
In short form, it appears as:<br />
s 2 =<br />
∑ (x-x)2<br />
n-1<br />
<strong>The</strong> st<strong>and</strong>ard deviation is the square root of the variance. Statisticians usually<br />
rely on the st<strong>and</strong>ard deviation because it expresses the variance in st<strong>and</strong>ardized<br />
units that can be meaningfully compared. <strong>The</strong> larger the st<strong>and</strong>ard deviation<br />
for any dataset, the more the data are spread out from the mean. <strong>The</strong> smaller<br />
the st<strong>and</strong>ard deviation, the more tightly are the individual data points<br />
clustered around the mean.<br />
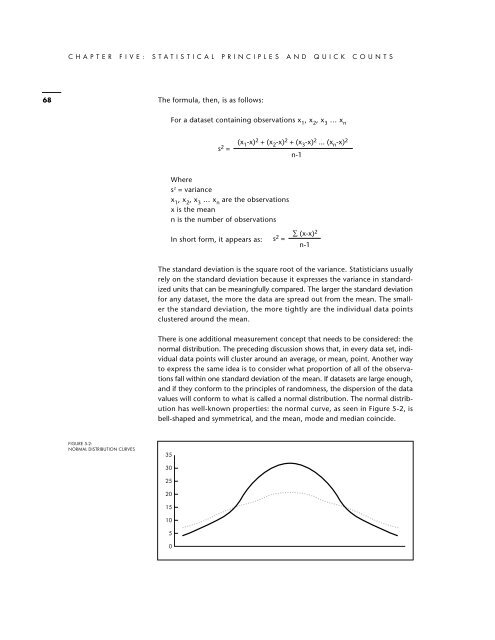
<strong>The</strong>re is one additional measurement concept that needs to be considered: the<br />
normal distribution. <strong>The</strong> preceding discussion shows that, in every data set, individual<br />
data points will cluster around an average, or mean, point. Another way<br />
to express the same idea is to consider what proportion of all of the observations<br />
fall within one st<strong>and</strong>ard deviation of the mean. If datasets are large enough,<br />
<strong>and</strong> if they conform to the principles of r<strong>and</strong>omness, the dispersion of the data<br />
values will conform to what is called a normal distribution. <strong>The</strong> normal distribution<br />
has well-known properties: the normal curve, as seen in Figure 5-2, is<br />
bell-shaped <strong>and</strong> symmetrical, <strong>and</strong> the mean, mode <strong>and</strong> median coincide.<br />
FIGURE 5-2:<br />
NORMAL DISTRIBUTION CURVES<br />
35<br />
30<br />
25<br />
20<br />
15<br />
10<br />
5<br />
0