The Quick Count and Election Observation
The Quick Count and Election Observation The Quick Count and Election Observation
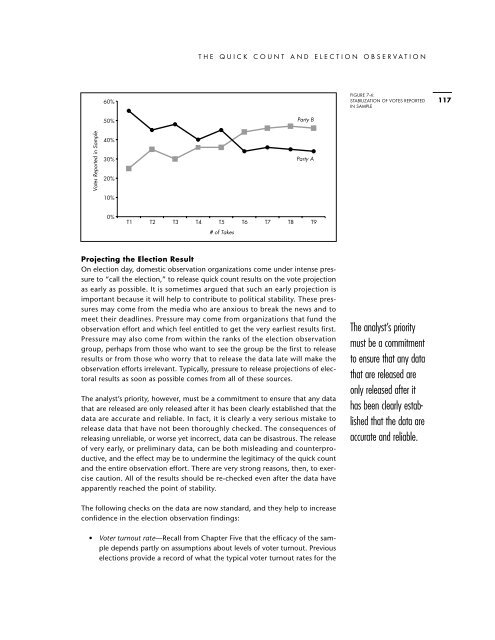
THE QUICK COUNT AND ELECTION OBSERVATION 60% 50% Party B FIGURE 7-4: STABILIZATION OF VOTES REPORTED IN SAMPLE 117 Votes Reported in Sample 40% 30% 20% 10% Party A 0% T1 T2 T3 T4 T5 T6 T7 T8 T9 # of Takes Projecting the Election Result On election day, domestic observation organizations come under intense pressure to “call the election,” to release quick count results on the vote projection as early as possible. It is sometimes argued that such an early projection is important because it will help to contribute to political stability. These pressures may come from the media who are anxious to break the news and to meet their deadlines. Pressure may come from organizations that fund the observation effort and which feel entitled to get the very earliest results first. Pressure may also come from within the ranks of the election observation group, perhaps from those who want to see the group be the first to release results or from those who worry that to release the data late will make the observation efforts irrelevant. Typically, pressure to release projections of electoral results as soon as possible comes from all of these sources. The analyst’s priority, however, must be a commitment to ensure that any data that are released are only released after it has been clearly established that the data are accurate and reliable. In fact, it is clearly a very serious mistake to release data that have not been thoroughly checked. The consequences of releasing unreliable, or worse yet incorrect, data can be disastrous. The release of very early, or preliminary data, can be both misleading and counterproductive, and the effect may be to undermine the legitimacy of the quick count and the entire observation effort. There are very strong reasons, then, to exercise caution. All of the results should be re-checked even after the data have apparently reached the point of stability. The analyst’s priority must be a commitment to ensure that any data that are released are only released after it has been clearly established that the data are accurate and reliable. The following checks on the data are now standard, and they help to increase confidence in the election observation findings: • Voter turnout rate—Recall from Chapter Five that the efficacy of the sample depends partly on assumptions about levels of voter turnout. Previous elections provide a record of what the typical voter turnout rates for the
CHAPTER SEVEN: COLLECTING AND ANALYZING QUICK COUNT DATA 118 country have been. Recall that information about the typical level of voter turnout is usually used to inform analysts about the estimated sample size. Voter turnout is factored into calculations about the margins of error. There is no way to predict what turnout rates will be before election day, but Form 2 quick count data will provide a real measure of actual voter turnout on election day. So, the analytic questions to examine are: was the voter turnout rate in this election higher or lower than average, and does the voter turnout rate in the election meet the assumptions used in the original calculation of the margins of error? If the turnout rate meets, or exceeds, the levels assumed in the calculation of the margins of error, then there is no problem. But, if the voter turnout is lower than expected, the margins of error have to be recalculated, and the new criterion has to be applied to the stabilized data. A lower than expected turnout may mean that the effective sample size has to be somewhat larger than originally anticipated, and that might mean delaying the announcement of a result until the minimal criterion is satisfied. • Rogue data—In nearly all election observations, there are findings that are difficult to account for and which apparently indicate that, to some extent, procedural requirements for the administration of the election may have been violated. In some instances, these “findings” might be attributable to something as simple as errors in data input, which can and should be corrected. In other cases, there may be genuine rogue results. If, for example, quick count data show that 757 votes were recorded at a particular polling station when the allowable maximum for each polling station is 600 votes, then this rogue result should be documented and investigated. If the number of rogue cases is large, then there may be reasons to question the legitimacy of the count. The prudent strategy is to conduct a late sweep of the data to identify the scope and scale of “outlying data results” and to do so before the quick count results are released. • Missing data—Even though the data on the vote count may have stabilized by T6, as in the example in Figure 7-4, it will almost certainly be the case that 100 percent of the entire sample will not have reported. Missing data require the attention of analysts. The analysts must determine how the missing data are distributed across the sample. If the missing data are distributed relatively evenly between the various strata (capital city, urban areas outside of the capital, and rural/remote areas), then it is unlikely that the addition of these data to the sample will have a material effect on the outcome predicted by the stabilized data. The problem is that missing data tend not to be evenly distributed throughout the effective sample. Data from rural/remote areas are usually more likely to be missing than are data from the capital city region. In that case, it is prudent to run an analytic check to determine what the overall result would look like if there were no missing data. That can be done by analyzing the differences in vote distributions for the competing political parties within each strata and then supplementing the stabilized data with weighted missing data. The weights are determined arithmetically
- Page 84 and 85: THE QUICK COUNT AND ELECTION OBSERV
- Page 86 and 87: THE QUICK COUNT AND ELECTION OBSERV
- Page 88 and 89: THE QUICK COUNT AND ELECTION OBSERV
- Page 90 and 91: THE QUICK COUNT AND ELECTION OBSERV
- Page 92 and 93: THE QUICK COUNT AND ELECTION OBSERV
- Page 94 and 95: THE QUICK COUNT AND ELECTION OBSERV
- Page 96 and 97: THE QUICK COUNT AND ELECTION OBSERV
- Page 98 and 99: THE QUICK COUNT AND ELECTION OBSERV
- Page 100 and 101: THE QUICK COUNT AND ELECTION OBSERV
- Page 102 and 103: THE QUICK COUNT AND ELECTION OBSERV
- Page 104 and 105: THE QUICK COUNT AND ELECTION OBSERV
- Page 106 and 107: FIGURE 6-1: SAMPLE OBSERVER FORMS 8
- Page 108 and 109: THE QUICK COUNT AND ELECTION OBSERV
- Page 110 and 111: THE QUICK COUNT AND ELECTION OBSERV
- Page 112 and 113: THE QUICK COUNT AND ELECTION OBSERV
- Page 114 and 115: THE QUICK COUNT AND ELECTION OBSERV
- Page 116: THE QUICK COUNT AND ELECTION OBSERV
- Page 119 and 120: CHAPTER SEVEN: COLLECTING AND ANALY
- Page 121 and 122: CHAPTER SEVEN: COLLECTING AND ANALY
- Page 123 and 124: CHAPTER SEVEN: COLLECTING AND ANALY
- Page 125 and 126: CHAPTER SEVEN: COLLECTING AND ANALY
- Page 127 and 128: CHAPTER SEVEN: COLLECTING AND ANALY
- Page 129 and 130: CHAPTER SEVEN: COLLECTING AND ANALY
- Page 131 and 132: CHAPTER SEVEN: COLLECTING AND ANALY
- Page 133: CHAPTER SEVEN: COLLECTING AND ANALY
- Page 137 and 138: CHAPTER SEVEN: COLLECTING AND ANALY
- Page 139 and 140: C H A P T E R E I G H T : T H E E N
- Page 141 and 142: C H A P T E R E I G H T : T H E E N
- Page 143 and 144: C H A P T E R E I G H T : T H E E N
- Page 145 and 146: C H A P T E R E I G H T : T H E E N
- Page 147 and 148: C H A P T E R E I G H T : T H E E N
- Page 149 and 150: C H A P T E R E I G H T : T H E E N
- Page 151 and 152: A P P E N D I C E S 134 ORGANIZATIO
- Page 153 and 154: A P P E N D I C E S 136 Ghana • N
- Page 155 and 156: A P P E N D I C E S 138 ment in Afr
- Page 157 and 158: A P P E N D I C E S 140 Montenegro
- Page 159 and 160: A P P E N D I C E S 142 NDI is part
- Page 161 and 162: A P P E N D I C E S 144 WORK PLAN F
- Page 163 and 164: A P P E N D I C E S 146 APPENDIX 3A
- Page 165 and 166: A P P E N D I C E S 148 EXAMPLE OF
- Page 167 and 168: A P P E N D I C E S 150 APPENDIX 3C
- Page 169 and 170: A P P E N D I C E S 152 APPENDIX 3D
- Page 171 and 172: A P P E N D I C E S 154 APPENDIX 4
- Page 173 and 174: A P P E N D I C E S 156 APPENDIX 4
- Page 175 and 176: A P P E N D I C E S 158 APPENDIX 4
- Page 177 and 178: A P P E N D I C E S 160 APPENDIX 5
- Page 179 and 180: A P P E N D I C E S 162 DIAGRAM OF
- Page 181 and 182: A P P E N D I C E S 164 SAMPLE OBSE
- Page 183 and 184: A P P E N D I C E S 166 EXAMPLE OF
THE QUICK COUNT AND ELECTION OBSERVATION<br />
60%<br />
50%<br />
Party B<br />
FIGURE 7-4:<br />
STABILIZATION OF VOTES REPORTED<br />
IN SAMPLE<br />
117<br />
Votes Reported in Sample<br />
40%<br />
30%<br />
20%<br />
10%<br />
Party A<br />
0%<br />
T1<br />
T2 T3 T4 T5<br />
T6 T7 T8 T9<br />
# of Takes<br />
Projecting the <strong>Election</strong> Result<br />
On election day, domestic observation organizations come under intense pressure<br />
to “call the election,” to release quick count results on the vote projection<br />
as early as possible. It is sometimes argued that such an early projection is<br />
important because it will help to contribute to political stability. <strong>The</strong>se pressures<br />
may come from the media who are anxious to break the news <strong>and</strong> to<br />
meet their deadlines. Pressure may come from organizations that fund the<br />
observation effort <strong>and</strong> which feel entitled to get the very earliest results first.<br />
Pressure may also come from within the ranks of the election observation<br />
group, perhaps from those who want to see the group be the first to release<br />
results or from those who worry that to release the data late will make the<br />
observation efforts irrelevant. Typically, pressure to release projections of electoral<br />
results as soon as possible comes from all of these sources.<br />
<strong>The</strong> analyst’s priority, however, must be a commitment to ensure that any data<br />
that are released are only released after it has been clearly established that the<br />
data are accurate <strong>and</strong> reliable. In fact, it is clearly a very serious mistake to<br />
release data that have not been thoroughly checked. <strong>The</strong> consequences of<br />
releasing unreliable, or worse yet incorrect, data can be disastrous. <strong>The</strong> release<br />
of very early, or preliminary data, can be both misleading <strong>and</strong> counterproductive,<br />
<strong>and</strong> the effect may be to undermine the legitimacy of the quick count<br />
<strong>and</strong> the entire observation effort. <strong>The</strong>re are very strong reasons, then, to exercise<br />
caution. All of the results should be re-checked even after the data have<br />
apparently reached the point of stability.<br />
<strong>The</strong> analyst’s priority<br />
must be a commitment<br />
to ensure that any data<br />
that are released are<br />
only released after it<br />
has been clearly established<br />
that the data are<br />
accurate <strong>and</strong> reliable.<br />
<strong>The</strong> following checks on the data are now st<strong>and</strong>ard, <strong>and</strong> they help to increase<br />
confidence in the election observation findings:<br />
• Voter turnout rate—Recall from Chapter Five that the efficacy of the sample<br />
depends partly on assumptions about levels of voter turnout. Previous<br />
elections provide a record of what the typical voter turnout rates for the


