Balance Sheet at 31 December 2010 of BBVA
Balance Sheet at 31 December 2010 of BBVA
Balance Sheet at 31 December 2010 of BBVA

You also want an ePaper? Increase the reach of your titles
YUMPU automatically turns print PDFs into web optimized ePapers that Google loves.
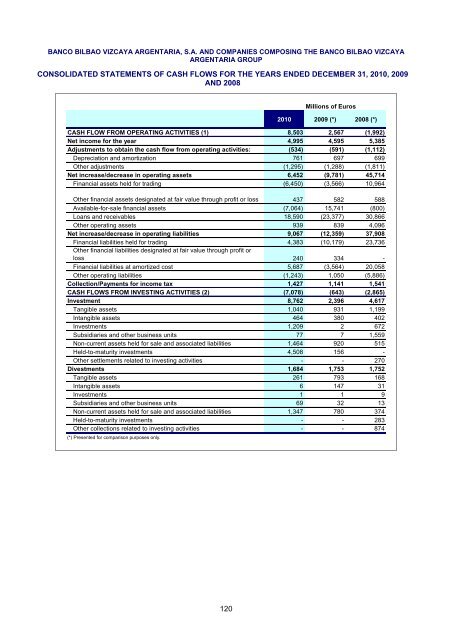
BANCO BILBAO VIZCAYA ARGENTARIA, S.A. AND COMPANIES COMPOSING THE BANCO BILBAO VIZCAYA<br />
ARGENTARIA GROUP<br />
CONSOLIDATED STATEMENTS OF CASH FLOWS FOR THE YEARS ENDED DECEMBER <strong>31</strong>, <strong>2010</strong>, 2009<br />
AND 2008<br />
Millions <strong>of</strong> Euros<br />
<strong>2010</strong> 2009 (*) 2008 (*)<br />
CASH FLOW FROM OPERATING ACTIVITIES (1) 8,503 2,567 (1,992)<br />
Net income for the year 4,995 4,595 5,385<br />
Adjustments to obtain the cash flow from oper<strong>at</strong>ing activities: (534) (591) (1,112)<br />
Depreci<strong>at</strong>ion and amortiz<strong>at</strong>ion 761 697 699<br />
Other adjustments (1,295) (1,288) (1,811)<br />
Net increase/decrease in oper<strong>at</strong>ing assets 6,452 (9,781) 45,714<br />
Financial assets held for trading (6,450) (3,566) 10,964<br />
Other financial assets design<strong>at</strong>ed <strong>at</strong> fair value through pr<strong>of</strong>it or loss 437 582 588<br />
Available-for-sale financial assets (7,064) 15,741 (800)<br />
Loans and receivables 18,590 (23,377) 30,866<br />
Other oper<strong>at</strong>ing assets 939 839 4,096<br />
Net increase/decrease in oper<strong>at</strong>ing liabilities 9,067 (12,359) 37,908<br />
Financial liabilities held for trading 4,383 (10,179) 23,736<br />
Other financial liabilities design<strong>at</strong>ed <strong>at</strong> fair value through pr<strong>of</strong>it or<br />
loss 240 334 -<br />
Financial liabilities <strong>at</strong> amortized cost 5,687 (3,564) 20,058<br />
Other oper<strong>at</strong>ing liabilities (1,243) 1,050 (5,886)<br />
Collection/Payments for income tax 1,427 1,141 1,541<br />
CASH FLOWS FROM INVESTING ACTIVITIES (2) (7,078) (643) (2,865)<br />
Investment 8,762 2,396 4,617<br />
Tangible assets 1,040 9<strong>31</strong> 1,199<br />
Intangible assets 464 380 402<br />
Investments 1,209 2 672<br />
Subsidiaries and other business units 77 7 1,559<br />
Non-current assets held for sale and associ<strong>at</strong>ed liabilities 1,464 920 515<br />
Held-to-m<strong>at</strong>urity investments 4,508 156 -<br />
Other settlements rel<strong>at</strong>ed to investing activities - - 270<br />
Divestments 1,684 1,753 1,752<br />
Tangible assets 261 793 168<br />
Intangible assets 6 147 <strong>31</strong><br />
Investments 1 1 9<br />
Subsidiaries and other business units 69 32 13<br />
Non-current assets held for sale and associ<strong>at</strong>ed liabilities 1,347 780 374<br />
Held-to-m<strong>at</strong>urity investments - - 283<br />
Other collections rel<strong>at</strong>ed to investing activities - - 874<br />
(*) Presented for comparison purposes only.<br />
120