The CoDeSys Visualization
The CoDeSys Visualization
The CoDeSys Visualization

Create successful ePaper yourself
Turn your PDF publications into a flip-book with our unique Google optimized e-Paper software.
<strong>The</strong> <strong>CoDeSys</strong> <strong>Visualization</strong><br />
Supplement to the User Manual for<br />
PLC Programming<br />
with <strong>CoDeSys</strong> 2.3
Contents<br />
Copyright © 2003 by 3S - Smart Software Solutions GmbH<br />
All rights reserved.<br />
We have gone to great lengths to ensure this documentation is correct and complete. However,<br />
since it is not possible to produce an absolutely error-free text, please feel free to send us your<br />
hints and suggestions for improving it.<br />
Trademark<br />
Intel is a registered trademark and 80286, 80386, 80486, Pentium are trademarks of Intel<br />
Corporation.<br />
Microsoft, MS and MS-DOS are registered trademarks, Windows is a trademark of Microsoft<br />
Corporation.<br />
Publisher<br />
3S - Smart Software Solutions GmbH<br />
Fischerstraße 19<br />
D-87435 Kempten<br />
Tel. +49 831 5 40 31 - 0<br />
Fax +49 831 5 40 31 – 50<br />
Last update 20.08.2003<br />
Version 1.0<br />
i
Contents<br />
Table Of Contents<br />
1 Advantages of an integrated visualization 1-1<br />
2 <strong>The</strong> <strong>Visualization</strong> Editor in <strong>CoDeSys</strong> 2-3<br />
2.1 Create a new <strong>Visualization</strong> .................................................................................. 2-4<br />
2.2 <strong>Visualization</strong> Elements, Insert.............................................................................. 2-4<br />
2.3 Positioning of <strong>Visualization</strong> Elements.................................................................. 2-7<br />
2.4 <strong>Visualization</strong> Configuration ................................................................................ 2-10<br />
2.4.1 <strong>Visualization</strong> Elements, Configure..................................................................... 2-11<br />
2.4.2 <strong>Visualization</strong> Object, Configure.......................................................................... 2-39<br />
2.5 Dynamic Texts.................................................................................................... 2-43<br />
2.5.1 Configuration ...................................................................................................... 2-43<br />
2.5.2 XML-File for Dynamic Texts............................................................................... 2-44<br />
2.6 Calling up language-dependent Online Help via a visualization element......... 2-46<br />
2.7 Placeholder Concept.......................................................................................... 2-46<br />
2.8 <strong>Visualization</strong> in Online Mode.............................................................................. 2-48<br />
2.9 <strong>Visualization</strong>s in libraries.................................................................................... 2-49<br />
3 <strong>CoDeSys</strong> HMI 3-1<br />
3.1 Installation, Start and Operating .......................................................................... 3-1<br />
4 Web-<strong>Visualization</strong> 4-1<br />
4.1 Preconditions........................................................................................................ 4-1<br />
4.2 Editing the WebVisu.htm file................................................................................ 4-1<br />
4.3 Preparing a Web-<strong>Visualization</strong> in <strong>CoDeSys</strong> ........................................................ 4-2<br />
4.4 Configuration and Start of the Web Server.......................................................... 4-2<br />
4.5 Calling a Web-<strong>Visualization</strong> via Internet .............................................................. 4-3<br />
5 Target-<strong>Visualization</strong> 5-1<br />
6 Index<br />
5.1.1 Preconditions........................................................................................................ 5-1<br />
5.1.2 Creating a Target-visualization ............................................................................ 5-1<br />
5.1.3 Starting the Target-<strong>Visualization</strong>..............................................................................2<br />
i
1 - Advantages of an integrated visualization<br />
1 Advantages of an integrated visualization<br />
For visualizing, that means watching and operating the data of a controller which has is programmed<br />
with <strong>CoDeSys</strong>, no additional tool is required. <strong>The</strong> programming system contains an integrated<br />
visualization editor (see chapter Fehler! Verweisquelle konnte nicht gefunden werden.), allowing<br />
the user to create visualization objects to the parallel to the development of the application in the<br />
same user interface.<br />
<strong>The</strong> integration offers a lot of benefits:<br />
<strong>The</strong> visualization integrated in <strong>CoDeSys</strong> does not need a tag list and it can directly access the<br />
variables in the controller. Any OPC- or DDE-layer, which often is difficult to configure, is also not<br />
necessary, because the communication is done by the same mechanism which is used for the<br />
programming system. Thus the engineering effort for the realization of visualizations will be clearly<br />
reduced. Besides that the connection of controller and visualization allows running modes (see<br />
below), in which the conventional display on a PC with a monitor is not needed any longer.<br />
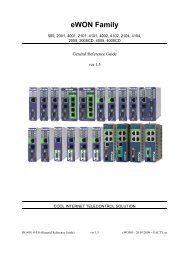
One of the main advantages of the concept: <strong>The</strong> visualization masks which are created in the<br />
programming system can run in four different modes without requiring any modifications, if desired<br />
even parallel:<br />
1. Directly in the programming system<br />
For testing the created visualization masks, but also for service or diagnosis purposes in direct<br />
connection with the controller you do not need a further tool: In online mode you immediately get a<br />
display of the visualizations within the programming system.<br />
<strong>CoDeSys</strong><br />
<strong>CoDeSys</strong> HMI<br />
XML<br />
WebVisualisierung<br />
ST-Code<br />
TargetVisualisierung<br />
2. <strong>CoDeSys</strong> HMI<br />
<strong>The</strong> program <strong>CoDeSys</strong> HMI, which displays visualizations on a PC without the complete development<br />
user interface, also communicates via the programming interface. <strong>The</strong> configuration of OPC (OPC -<br />
OLE for Process Control) – resp. DDE (DDE – Dynamic Data Excange) inteface is not necessary. See<br />
chapter 3.<br />
3. Web-<strong>Visualization</strong><br />
Optionally <strong>CoDeSys</strong> generates a description in XML format from the visualization data, which is<br />
loaded to the controller together with a Java-Applet (Applet – a program developped in the<br />
programming language JAVA, which can be processed by browsers) and which can be displayed via<br />
TCP/IP on a browser. Thus the visuaization data are available online on various platforms. See<br />
chapter 4.<br />
<strong>CoDeSys</strong> <strong>Visualization</strong> 1-1
Create a new <strong>Visualization</strong><br />
4. Target-<strong>Visualization</strong><br />
For controllers with integrated display the visualization data can be loaded from the programming<br />
system together with the application to the target system. <strong>The</strong>re they get displayed automatically. This<br />
solution can be portated with low effort to any devices which are programmable with <strong>CoDeSys</strong>. See<br />
chapter 5.<br />
Overview on the functions:<br />
• Elements<br />
- Rectangle, Ellipse, Rounded rectangle<br />
- Line, Polygon, Polyline, Curve<br />
- Bitmap, WMF-file<br />
- Button, Table, Histogram, Bar Display, Meter<br />
- Reference to another visualization<br />
• Animations (depending on element type):<br />
- Text display<br />
- Color changes<br />
- Visible/Invisible<br />
- Shift<br />
- Rotation<br />
- Scaling<br />
- Offset on the particular edges of an object (for Bar Display)<br />
- Button activ/inactiv<br />
- Current line (only text display)<br />
• Input possibilities:<br />
- Toggle/tap Boolean value<br />
- Text input<br />
- Change of visualization<br />
- Special actions (Leave visualization, Read/Write receipts, Switch language, call external EXE etc.)<br />
- Choose line (only text display)<br />
• Further properties<br />
- Switching language<br />
- Tooltips for all elements<br />
- ASCII Import/Export<br />
- Background Bitmap<br />
- Automatic Scaling<br />
- Drawing operations: Alignment, Order, Grouping<br />
- Placeholder concept for creating objects with complex graphic elements<br />
- Programmed visualization expressions<br />
1-2<br />
<strong>CoDeSys</strong> <strong>Visualization</strong>
2 - <strong>The</strong> <strong>Visualization</strong> Editor in <strong>CoDeSys</strong><br />
2 <strong>The</strong> <strong>Visualization</strong> Editor in <strong>CoDeSys</strong><br />
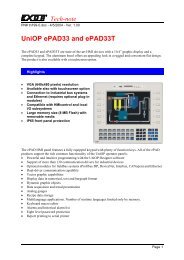
A visualization is a graphical representation of the project variables which allows inputs to the PLC<br />
program in online mode via mouse and keypad. <strong>The</strong> <strong>CoDeSys</strong> visualization editor, which is part of<br />
the programming system provides graphic elements which can be arranged as desired and can be<br />
connected with project variables. <strong>The</strong>reupon in online mode the look of the graphical elements will<br />
change depending on the variables values.<br />
Simple example: In order to represent a fill level, which is calculated by the PLC program, draw a bar<br />
and connect it to the corresponding project variable, so that the length and color of the bar will show<br />
the current fill level value. Add a text field which will display the current value in a text string and a<br />
button for starting and stopping the program.<br />
<strong>The</strong> properties of a single visualization element as well as of the whole visualization object will be<br />
defined in appropriate configuration dialogs. <strong>The</strong>re it is possible to set basic parameters by activating<br />
options as well as to define a dynamic parameterizing by entering project variables.<br />
Additional special possibilities for configuring are given by the programability of element properties via<br />
structure variables.<br />
Using placeholders in the configuration dialogs may save a lot of effort in case you want to use the<br />
same visualization object several times with different configurations.<br />
Also regard the option to define special hotkeys for each particular visualization.<br />
Example of a visualization<br />
<strong>CoDeSys</strong> <strong>Visualization</strong> 2-3
Create a new <strong>Visualization</strong><br />
2.1 Create a new <strong>Visualization</strong><br />
A visualization object is a <strong>CoDeSys</strong> object which is managed in the '<strong>Visualization</strong>' register of the<br />
Object Organizer. It contains an arrangement of visualization elements and can get certain object<br />
properties. One or several visualization objects can be created in a <strong>CoDeSys</strong> project and might be<br />
linked with each other.<br />
In order to create a visualization object in the Object Organizer, you must select the register card for<br />
<strong>Visualization</strong> in the Object OrganizerUsing the 'Project' 'Object Add' command, you can create<br />
a new visualization object. Open the 'New visualization' dialog, in which you can enter the name of the<br />
new visualization. Once a valid entry is made, that is not a name that is already in use and no special<br />
characters used, you can close the dialog with OK. A window opens, in which you can edit the new<br />
visualization.<br />
Please regard: If you want to use the implicit variable CurrentVisu (type STRING) for addressing the currently<br />
opened visualization object, you throughout must use capital letters for the names of the visualization<br />
objects (e.g. "PLC_VISU").<br />
2.2 <strong>Visualization</strong> Elements, Insert...<br />
A visualization element is a graphical element, which is used to fill a visualization object. <strong>The</strong> available<br />
elements are offered in the <strong>CoDeSys</strong> menu bar. Each element gets a separate configuration.<br />
You can insert various geometric forms, as well as bitmaps, metafiles, buttons and existing<br />
visualizations, into your visualization.<br />
Geometric forms at your disposal include: rectangles, rounded rectangles, ellipses/circles, and<br />
polygons.<br />
Go to the 'Insert' menu item and select freely from the following commands:<br />
'Rectangle',<br />
'Rounded Rectangle', 'Ellipse', 'Polygon'‚ Polyline', 'Curve', 'Pie',<br />
'Bitmap', '<strong>Visualization</strong>', 'Button', 'Table', 'Meter', 'Bar Display',<br />
'Histogram',<br />
'WMF file'. A check appears in front of the selected command. You can also use<br />
the tool bar. <strong>The</strong> selected element appears pushed down(e.g. ).<br />
If you now go to the editor window with the mouse, you will see that the mouse pointer is identified<br />
with the corresponding symbol (e.g. ). Click on the desired starting point of your element and<br />
move the pointer with pressed left mouse key until the element has the desired dimensions.<br />
If you want to create a polygon or a line, first click with the mouse on the position of the first corner of<br />
the polygon resp. on the starting point of the line, and then click on the further desired corner points.<br />
By doubleclicking on the last corner point you will close the polygon and it will be completely drawn<br />
respectively the line will be completed. If you want to create a curve (Bezier curves) determine the<br />
initial and two other points with mouse clicks to define the circumscribing rectangle. An arc is drawn<br />
after the third mouse click. You can then change the position of the end point of the arc by moving the<br />
mouse and can then end the process with a double click or add another arc with additional mouse<br />
clicks.<br />
Furthermore pay attention, to the status bar and the change from select and insert modes.<br />
'Insert' 'Rectangle'<br />
Symbol:<br />
With the command you can insert a rectangle as an element into your present visualization. (Use, see<br />
<strong>Visualization</strong> Elements, Insert)<br />
2-4<br />
<strong>CoDeSys</strong> <strong>Visualization</strong>
2 - <strong>The</strong> <strong>Visualization</strong> Editor in <strong>CoDeSys</strong><br />
'Insert' 'Rounded Rectangle'<br />
Symbol:<br />
'Insert' 'Ellipse'<br />
With the command you can insert a rectangle with rounded corners as an element in your present<br />
visualization. (Use, see <strong>Visualization</strong> Elements, Insert).<br />
Symbol:<br />
With the command you can insert a circle or an ellipse as an element in your present visualization.<br />
(Use, see <strong>Visualization</strong> Elements, Insert).<br />
'Insert' 'Polygon'<br />
Symbol:<br />
With the command you can insert a polygon as an element in your present visualization. (Use, see<br />
<strong>Visualization</strong> Elements, Insert).<br />
'Insert' 'Polyline'<br />
Symbol:<br />
'Insert' 'Curve'<br />
'Insert' 'Pie'<br />
With the command you can insert a line as an element into your current visualization. (Use, see<br />
<strong>Visualization</strong> Elements, Insert).<br />
Symbol:<br />
With the command you can insert a Bezier curve as an element into your current visualization. (Use,<br />
see <strong>Visualization</strong> Elements, Insert ).<br />
Symbol:<br />
Use this command to insert a Pie Segment as an element into your current visualization.<br />
While pressing the left mouse button, bring up an area in the desired size. An oval element including a<br />
line marking the radius at the 0° position will be displayed. As long as keeping the mouse button<br />
pressed you can immediately change size and position of the element by moving the mouse. A little<br />
black square is attended to the the element, indicating the corner of a virtual rectangle surronding the<br />
element.<br />
In order to define the start and end angles of a Pie, select the end point of the radius line on the<br />
circular arc by a mouse-click. As soon as you, keeping the mouse button pressed, move the cursor,<br />
two small rectangles will be displayed, indicating the two angle positions. As from now those can be<br />
selected and moved seperately. If you want the angle values get defined dynamically by variables,<br />
open the configuration dialog category 'Angle' and enter the desired variable names.<br />
You can resize or reshape the element later by either clicking on the centre point, the cursor getting<br />
displayed as diagonally crossed arrows, and moving the mouse while keeping the mouse button<br />
pressed (or using the arrow keys). Alternatively you can select and move the corner indicating little<br />
square outside of the element. In order to move the element to another position, click inside the<br />
element to get the cursor beeing displayed as vertically crossed arrows and then move the cursor.<br />
<strong>CoDeSys</strong> <strong>Visualization</strong> 2-5
<strong>Visualization</strong> Elements, Insert...<br />
'Insert' 'Bitmap'<br />
Symbol:<br />
With the command you can insert a bitmap as an element in your present visualization. (Use, see<br />
<strong>Visualization</strong> Elements, Insert).<br />
While pressing the left mouse button, bring up an area in the desired size. <strong>The</strong> dialog box is opened<br />
for opening a file. Once you have selected the desired bitmap, it will be inserted into the area brought<br />
up. You can define in the bitmap configuration dialog, whether a just link to the bitmap file should be<br />
stored or the bitmap should be inserted as an element.<br />
'Insert' '<strong>Visualization</strong>'<br />
Symbol:<br />
'Insert' 'Button'<br />
With the command you can insert an existing visualization as an element in your present visualization.<br />
(Use, see <strong>Visualization</strong> Elements, Insert).<br />
While pressing the left mouse button, bring up an area in the desired size. A selection list of existing<br />
visualizations opens. After you have selected the desired visualization, it will be inserted in the defined<br />
area.<br />
An inserted visualization will also be named as a reference.<br />
Symbol:<br />
This command is used to insert a button into your current visualization. (Use, see <strong>Visualization</strong><br />
Elements, Insert).<br />
Drag the element to the desired size with the left mouse button held down.<br />
If a toggle variable is configured for the button it displays the state of this variable by visually<br />
displaying whether it is pressed or not pressed. Conversely, the variable is toggled by „pressing" the<br />
button.<br />
'Insert' 'WMF file'<br />
Symbol:<br />
'Insert' 'Table'<br />
This command is used to insert a Windows Metafile. <strong>The</strong> standard dialog for opening a file will appear,<br />
where you can select a file (extension *.wmf). After having closed the dialog with OK the file will be<br />
inserted as an element in the visualization. Please regard, that no link to a file will be saved, like it is<br />
done when you insert a bitmap, but the elements of the metafile will be inserted as a group.<br />
Symbol:<br />
Use this command to insert a Table element as an element into your current visualization. It is used to<br />
display the current values of the elements of an array.<br />
While pressing the left mouse button, bring up an area in the desired size. Before the element gets<br />
displayed the configuration dialog 'Configure table'' will be opened. Here you will find additionally to<br />
the standard categories Tooltip and Security the categories 'Table', 'Columns', 'Rows' and 'Selection'<br />
where you can define contents and appearance of the table.<br />
2-6<br />
<strong>CoDeSys</strong> <strong>Visualization</strong>
2 - <strong>The</strong> <strong>Visualization</strong> Editor in <strong>CoDeSys</strong><br />
'Insert' 'Meter'<br />
Symbol:<br />
Use this command to insert a Meter as an element into your current visualization. It provides a scale<br />
which is defined as a sector of a circular arc, and a pointer element.<br />
While pressing the left mouse button, bring up an area in the desired size. Before the element gets<br />
displayed the configuration dialog Configure Meter will be opened. Here you can define various<br />
parameters concerning the display of the element and a preview is available to check the<br />
configuration before really inserting the element by confirming the dialog.<br />
'Insert' 'Bar Display'<br />
Symbol:<br />
Use this command to insert a Bar Display element into your current visualization. It is used to visualize<br />
the value of the assigned variable by a bar indicating the value by its lenght along a horizontal scale.<br />
While pressing the left mouse button, bring up an area in the desired size. Before the element gets<br />
displayed the configuration dialog 'Configure bar display' will be opened. Here you can define various<br />
parameters concerning the display of the element and a preview is available to check the<br />
configuration before really inserting the element by confirming the dialog.<br />
'Insert' 'Histogram'<br />
Symbol:<br />
Use this command to insert a Histogram element into your current visualization. It is used to visualize<br />
the elements of an array by bars which are placed side by side each indicating the value of the<br />
element by its length.<br />
While pressing the left mouse button, bring up an area in the desired size. Before the element gets<br />
displayed the configuration dialog 'Configure Histogram' will be opened. Here you can define various<br />
parameters concerning the display of the element and a preview is available to check the<br />
configuration before really inserting the element by confirming the dialog.<br />
2.3 Positioning of <strong>Visualization</strong> Elements...<br />
Selecting <strong>Visualization</strong> Elements<br />
<strong>The</strong> selection mode is activated by default. Um ein Element In order to select an element, click with<br />
the mouse on the element. You can also select the first element of the elements list by pressing the<br />
key and jump to the next by each further keystroke. If you press the key while pressing<br />
the key, you jump backwards in the order of the elements list.<br />
In order to select elements, which are placed one upon the other, first select the top level element by<br />
a mouseclick. <strong>The</strong>n do further mouseclicks while the button is pressed, to reach the elements<br />
in the underlying levels .<br />
In order to mark multiple elements, press and hold the key and click the corresponding<br />
elements, one after another; or, while holding down the left mouse button, pull a window over the<br />
elements to be selected.<br />
In order to select all the elements, use the 'Extras' 'Select All' command.<br />
If you are in the element list (called by 'Extras' 'Element list'), you can select the concerned element<br />
in the visualization by selecting a line.<br />
<strong>CoDeSys</strong> <strong>Visualization</strong> 2-7
Positioning of <strong>Visualization</strong> Elements...<br />
Changing the Selection and Insert Mode<br />
'Extras' 'Select'<br />
After the insertion of a visualization element, there is an automatic change back into the selection<br />
mode. If you want to insert an additional element the same way, you can once again select the<br />
corresponding command in the menu or the symbol<br />
in the tool bar.<br />
You can also quickly change between the selection mode and the insert mode by pressing the key<br />
and the right mouse button simultaneously.<br />
In the insert mode, the corresponding symbol will also appear at the mouse pointer, and the name will<br />
also be indicated in black in the status bar.<br />
This command is used to switch the selection mode on or off. This can also be achieved using the<br />
symbol<br />
or by pressing the right mousekey while holding down the key at the same time.<br />
'Extras' 'Select All'<br />
This command allows you to select all visualization elements within the current visualization object.<br />
Copying Visual Elements<br />
One or more selected elements can be inserted with the 'Edit' 'Copy'command, the + key<br />
combination, or the corresponding copy symbol, and with 'Edit' 'Paste'.<br />
A further possibility is to select the elements and to again click in one of these elements with the<br />
key held down. If you now hold the left mouse button down, you can separate the elements<br />
thus copied from the original.<br />
Modifying <strong>Visualization</strong> Elements<br />
You can select an element which has already been inserted by a mouse click on the element or by<br />
pressing the key. A small black square will appear at each corner of each of the elements, (with<br />
ellipses at the corners of the surrounding rectangle). Except in the case of polygons, lines or curves<br />
further squares appear in the middle of the element edges between the corner points.<br />
With a selected element, the turning point (balance point) is also displayed at the same time. You can<br />
then rotate the element around this point with a set motion/angle. <strong>The</strong> turning point is displayed as a<br />
small black circle with a white cross (<br />
button.<br />
). You can drag the turning point with a pressed left mouse<br />
You can change the size of the element by clicking on one of the black squares and, while keeping<br />
the left mouse button pressed, controlling the new outline.<br />
With the selection of a polygon, you can drag each individual corner using the same technique. While<br />
doing this, if you press the -key then an additional corner point will be inserted at the corner<br />
point, an additional corner point will be inserted, which can be dragged by moving the mouse. By<br />
pressing the +-key, you can remove a corner point.<br />
Dragging <strong>Visualization</strong> Elements<br />
One or more selected elements can be dragged by pressing the left mouse button or the arrow key.<br />
Grouping Elements<br />
Elements can be grouped by selecting all desired elements and performing the command 'Extras'<br />
'Group'. <strong>The</strong> group will behave like a single element:<br />
2-8<br />
<strong>CoDeSys</strong> <strong>Visualization</strong>
2 - <strong>The</strong> <strong>Visualization</strong> Editor in <strong>CoDeSys</strong><br />
• the grouped elements get a collective frame; when dragging the frame all elements will be<br />
stretched or compressed; only the group can be moved to another position.<br />
• the grouped elements get collective properties: inputs only can effect the group and not a single<br />
element. Thus the elements also get one collective configuration dialog (category 'group'). <strong>The</strong><br />
property 'Change color' can not be configured for a group !<br />
To redefine a single element of a group, the grouping must be redone by the command 'Extras' 'Break<br />
up group'. <strong>The</strong> configuration of the group will be lost in this case.<br />
Note:<br />
As soon as you save the project as <strong>CoDeSys</strong> Version 2.1 or lower, a group of visualization elements<br />
will be resolved automatically; that means that the elements of the group will be shown as single<br />
elements in the visualization.<br />
'Extras' 'Send to Front'<br />
Use this command to bring selected visualization elements to the front.<br />
'Extras' 'Send to Back'<br />
'Extras' 'Align'<br />
Use this command to send selected visualization elements to the back.<br />
Use this command to align selected visualization elements.<br />
<strong>The</strong> following alignment options are available:<br />
• Left: the left edge of each of the elements will be aligned to the element that is furthest to the left<br />
• the same is true for Right / Top / Bottom<br />
• Horizontal Center: each of the elements will be aligned to the average horizontal center of all<br />
elements<br />
• Vertical Center: each of the elements will be aligned to the average vertical center of all elements<br />
'Extras' 'Elementlist'<br />
This command opens a dialog box containing a list of all visualization elements including their<br />
number, type and position. <strong>The</strong> position is given according to the x and y position of the upper left<br />
(x1, y1) and the lower right (x2, y2) corner of the element.<br />
When one or more items have been selected, the corresponding elements in the visualization are<br />
marked for visual control and if necessary the display will scroll to that section of the visualization that<br />
contains the elements.<br />
Use the To front button to bring selected visualization elements to the front. Use the To behind<br />
button to move them to the back.<br />
Below the elements list there you find – depending on which element is currently selected - one of the<br />
following combinations of edit fields where you can modify size and position of the element:<br />
• If a rectangle, rounded rectangle, ellipse, bitmap, visualization, button or a meta file is currently<br />
selected, then next to the text "Rectangle (x1, y1, x2, y2)" there are four edit fields, where the<br />
actual x/y positions are shown and can be modified.<br />
• If a line, polygon or a curve is currently selected, a table will be available showing the actual X-<br />
Position and Y-Position of each of the black squares which mark the shape of the element, as<br />
soon as it is selected. <strong>The</strong>se values can be edited here.<br />
To set the modified position values in the elements list and in the visualization, press button Set<br />
rectangle (in case 1.) resp. Set polygon (in case 2.).<br />
Use the Delete button to remove selected visualization elements.<br />
Use the Undo and Redo buttons to undo or restore changes that have been made just as you would<br />
do with the commands 'Edit' 'Undo' and 'Edit' 'Redo' . In the dialog box, you can observe the changes<br />
that are being made.<br />
<strong>CoDeSys</strong> <strong>Visualization</strong> 2-9
<strong>Visualization</strong> Configuration<br />
Click on OK to close the dialog box and confirm the changes.<br />
Use Configure to get the configuration dialog for the element.<br />
Element list dialog box<br />
Status Bar in the <strong>Visualization</strong><br />
If a visualization has the focus, the current X and Y position of the mouse cursor in pixels relative to<br />
the upper left corner of the image is displayed in the status bar. If the mouse pointer is located on an<br />
Element, or if the element is being processed, then the number of the element will be displayed. If<br />
you have selected an element to insert, then this element will also appear (for example, Rectangle).<br />
2.4 <strong>Visualization</strong> Configuration<br />
When configuring a visualization you have to distinguish between the configuration a particular<br />
graphic element and the visualization object as a whole. Correspondingly a different selection of<br />
configuration dialogs will be available, which can be opened by the command 'Configure' from Menu<br />
'Extras' resp. from the context menu.<br />
In this dialogs the properties of an element or object are set either by activating options or dynamically<br />
by inserting project variables. Besides that the properties can be programmed via the components of<br />
a structure variable, which can be defined for each visualization element.<br />
Regard the order of analysis, which will be followed in online mode:<br />
- <strong>The</strong> values which are given dynamically, i.e. via project variables, will overwrite the fix parameters<br />
defined for the same property.<br />
- If an element property is defined by a "normal" project variable as well as by the component of a<br />
structure variable, then in online mode primarily the value of the project variable will be regarded.<br />
Please regard the possibility of using Placeholders as well as the special input possibilities which are<br />
useful if the visualization should be used in <strong>CoDeSys</strong> HMI resp. as Target or Web-visualization , that<br />
2-10<br />
<strong>CoDeSys</strong> <strong>Visualization</strong>
2 - <strong>The</strong> <strong>Visualization</strong> Editor in <strong>CoDeSys</strong><br />
Placeholders<br />
means if the visualization serves as the only user inteface for a PLC programm (see also: INTERN in<br />
category 'Input' of the configuration dialogs, Keyboard usage)<br />
At each location in the configuration dialog at which variables or text are entered, a placeholder can<br />
be set in place of the respective variable or text. This makes sense if the visualization object is not to<br />
be used directly in the program, but is created to be inserted in other visualization objects as an<br />
"instance". When configuring such an Instance, the placeholders can be replaced with variable<br />
names or with text.<br />
See chapter 2.7 for the placeholder concept.<br />
2.4.1 <strong>Visualization</strong> Elements, Configure...<br />
'Extras' 'Configure'<br />
With this command, the 'Configure element' dialog opens for configuring the selected visualization<br />
element (see Select visualization element). You are given the dialog box when you doubleclick on the<br />
element.<br />
Select a category in the left area of the dialog box (available categories depending on element type)<br />
and fill out the requested information in the right area. This has to be done by activating options resp.<br />
by inserting the name of valid variables, whose values should define the property of the element.<br />
Note: <strong>The</strong>re are also configuration dialogs available for a group of elements. Regard that the settings will<br />
be valid for the "element" group. If you want to configure the particular elements of the group, you<br />
have to resolve the group.<br />
Note: If you have defined an element property by a "static" setting as well as dynamically by a variable,<br />
then in online mode the variable will overwrite the static value (Example: "Alarm color Inside" can be<br />
defined statically in category 'Color' and additionally dynamically in category 'Colorvariables' by a<br />
variable). If the setting is controlled by a "normal" project variable as well as by a structure variable,<br />
then the value of structure variable also will be overwritten by the "normal" project variable.<br />
Please regard: Meter, Bar Display and Histogram must be re-grouped before !<br />
At locations in the element configuration where variables are operative, the following Entries are<br />
possible:<br />
• Variable names, for which input assistant is available<br />
• Expressions which are assembled from component accesses, field accesses with constant index,<br />
variables and direct addresses.<br />
• Operators and constants, which can be combined at will with the aforementioned expressions.<br />
• Placeholders instead of variable names or text strings<br />
Examples of permissible expressions:<br />
x + y<br />
100*PLC_PRG.a<br />
TRUE<br />
NOT PLC_PRG.b<br />
9*sin(x + 100)+cos(y+100)<br />
Function calls are not possible. Invalid expressions result in an error message on login („Invalid Watch<br />
expression..."). Examples of invalid expressions: fun(88), a := 9, RETURN.<br />
<strong>The</strong>re are two possible ways in the configuration dialogs to write global variables: „.globvar" and<br />
„globvar" are equivalent. <strong>The</strong> style with a dot (which is that used in the Watch- and Receipt Manager)<br />
is not allowed within an assembled expression, however.<br />
Regard also the possibility of using Placeholders (see chapter 2.7).<br />
<strong>CoDeSys</strong> <strong>Visualization</strong> 2-11
<strong>Visualization</strong> Configuration<br />
Angle<br />
In the configuration dialog 'Configure Pie' in the Angle category you can each enter a value or a<br />
variable defining the start angle and the end angle of the sector element in degrees. <strong>The</strong> sector will<br />
be drawn clockwise from the start angle position to the end angle position.<br />
Example:<br />
Enter start angle: "90", end angle: "180"<br />
Dialog for Configuring a Pie<br />
Shape<br />
In the visualization element configuration dialog box, you can select in the Shape category from<br />
among Rectangle, Rounded Rectangle, Line and Ellipse respectively Polygon, Line and Curve.<br />
<strong>The</strong> form will change into the size already set.<br />
Dialog Box for Configuring <strong>Visualization</strong> Elements (Shape Category)<br />
2-12<br />
<strong>CoDeSys</strong> <strong>Visualization</strong>
2 - <strong>The</strong> <strong>Visualization</strong> Editor in <strong>CoDeSys</strong><br />
Text<br />
Dialog Box for Configuring <strong>Visualization</strong> Elements (Text Category)<br />
In the dialog for configuring visualization elements, you can specify a text for the element in the Text<br />
category. This can be entered directly or/and a variable can be defined which will determine the text<br />
string. <strong>The</strong> usage of placeholders is possible. Also the default settings for font and alignment are done<br />
here.<br />
Note:<br />
As soon as text parameters are additionally provided dynamically, which means by a system or<br />
structure variable (see also below, categorie 'Text variables' resp. 'Programmability'), the static<br />
definitions which are done in the currently opened dialog , will be overwritten !<br />
In case of multiple definition of an element property consider the specific order of precedence<br />
concerning according to which a value might be overwritten in online mode by another.<br />
Enter the text in the Content field. With the key combination + you can insert line<br />
breaks, with +, tab stops. Besides the input of a pure text string you can use the following<br />
formatting sequences:<br />
• If you include "%s" into the text, then this location, in Online mode, will be replaced by the value of<br />
the variable from the Text Output field of the Variables category. You also can use a formatting<br />
string, which conforms with the standard C-library function 'sprintf': e.g. "%d" for integer types, "%f"<br />
for floating types, "%2.5f" for floating types with 2 decimal places before and 5 behind the comma,<br />
"%x" for integer types in hexadecimal format. <strong>The</strong> value of the variable will be displayed<br />
correspondingly in online mode. You can enter any IEC-conforming format strings, which fit to the<br />
type of the used variable. Attention: It is not checked whether the type which is used in the<br />
formatting string matches with the type of the variable which is defined in the 'Text Output' field !<br />
Example:<br />
Input in the 'Content' field: Fill level %2.5f mm<br />
Input in the 'Text Output' field e.g.: fvar1 (REAL variable)<br />
-> Output in online mode e.g.: Fill level 32.8999 mm<br />
• If you enter "%t", followed by a certain sequence of special placeholders, then this location will be<br />
replaced in Online mode by the system time. <strong>The</strong> placeholders define the display format, see the<br />
following table. Attention: Do not insert any other characters before %t in the 'Content' field (in<br />
contrast this is allowed for e.g. "%s", see above)<br />
%a Abbreviated weekday name<br />
%A Full weekday name<br />
<strong>CoDeSys</strong> <strong>Visualization</strong> 2-13
<strong>Visualization</strong> Configuration<br />
%b Abbreviated month name<br />
%B Full month name<br />
%c Date and time representation appropriate for locale<br />
%d Day of month as decimal number (01 – 31)<br />
%H Hour in 24-hour format (00 – 23)<br />
%I Hour in 12-hour format (01 – 12)<br />
%j Day of year as decimal number (001 – 366)<br />
%m Month as decimal number (01 – 12)<br />
%M Minute as decimal number (00 – 59)<br />
%p Current locale’s A.M./P.M. indicator for 12-hour clock<br />
%S Second as decimal number (00 – 59)<br />
%U Week of year as decimal number, with Sunday as first day of week (00 – 53)<br />
%w Weekday as decimal number (0 – 6; Sunday is 0)<br />
%W Week of year as decimal number, with Monday as first day of week (00 – 53)<br />
%x Date representation for current locale<br />
%X Time representation for current locale<br />
%y Year without century, as decimal number (00 – 99)<br />
%Y Year with century, as decimal number<br />
%z, %Z Time-zone name or abbreviation; no characters if time zone is unknown<br />
%% Percent sign<br />
Examples:<br />
%t%a %b %d.%m.%y %H:%M:%S<br />
-> Display in online mode: Wed Aug 28.08.02 16:32:45<br />
Between the placeholders you can insert any text strings:<br />
%Today is %d.%m.%y<br />
-> Display in online mode: Today is 28.08.02<br />
Note:<br />
If a text string is to be transferred into a translation file , which will then be used in Online<br />
mode to enable switching into another national language, it must be delimited at the<br />
beginning and end by #.<br />
Examples: "#Pump 1#" or else even "#Pump# 1"<br />
<strong>The</strong> second case might for example, in the event of multiple occurrences of the text Pump<br />
(Pump 1, Pump 2, etc.), prevent multiple appearances in the translation.<br />
• If you include" %" into the text, you can enter instead of "PREFIX" a certain string, which<br />
will serve as an identifier concerning the use of dynamic texts. <strong>The</strong> prefix will be used together with<br />
an ID number, which is to be defined in the 'Variables' category of the configuration dialog in field<br />
'Textdisplay'. <strong>The</strong> combination references to a certain text, which is contained in a xml-file listing all<br />
possible dynamic texts.Thus at run time the text which is indicated by the current ID-Prefixcombination<br />
will be displayed. For further information see also the description of 'Settings',<br />
category Language.<br />
<strong>The</strong> configured text will appear online in the prescribed alignment within the element: horizontally<br />
left, center or right and vertically top, center or bottom.<br />
2-14<br />
<strong>CoDeSys</strong> <strong>Visualization</strong>
2 - <strong>The</strong> <strong>Visualization</strong> Editor in <strong>CoDeSys</strong><br />
If you use the Font button, a dialog box for selection of the font will appear. Select the desired font<br />
and confirm the dialog with OK. With the Standard-Font button you can set the font that is selected in<br />
the project options ('Project' 'Options' 'Editor'). If the font is changed there, then this font will be<br />
displayed in all elements except in those elements for which another font has explicitly been selected<br />
by using the Font button.<br />
Textvariables<br />
In category Textvariables of the dialog for configuring visualization elements you can specify a<br />
variable which should dynamically set color and font of that string which is defined in category 'Text'.<br />
At best enter the variable name with the aid of the input assistant ().<br />
You can also use components of the structure VisualObjectType to set the text properties. For this<br />
see the description of category 'Programability'; there you will find the possible values of the particular<br />
structure components and their effect.<br />
Note:<br />
If there are corresponding static definitions in category 'Text', these will be overwritten by the dynamic<br />
parameter values.<br />
In case of multiple definition of an element property consider the specific order of precedence<br />
concerning according to which a value might be overwritten in online mode by another.<br />
<strong>The</strong> parameters of the dialog:<br />
Parameter: Meaning:<br />
Example entry of<br />
project variable:<br />
Example Usage of variable in<br />
program:<br />
corresponding<br />
component of structure<br />
VisualObjectType:<br />
Textcolor: Text color "plc_prg.var_textco<br />
lor"<br />
var_textcolor=16#FF00FF<br />
→ Farbe<br />
dwTextColor<br />
Textflags:<br />
Alignment<br />
(right, left,<br />
centered...)<br />
"plc_prg.textpos"<br />
textpos:=2<br />
→ Text right justified<br />
dwTextFlags<br />
Fontheight: Font height in<br />
Pixel<br />
".fonth"<br />
fonth:=16;<br />
→ Font height 16 pt<br />
ntFontHeight<br />
Fontname: Font name "vis1.fontn" fontn:=arial;<br />
→ Arial is used<br />
stFontName<br />
Fontflags:<br />
Font display<br />
(bold,<br />
underlined,<br />
italic...)<br />
"plc_prg.fontchar"<br />
fontchar:=2<br />
→ Text will be displayed bold<br />
dwFontFlags<br />
<strong>CoDeSys</strong> <strong>Visualization</strong> 2-15
<strong>Visualization</strong> Configuration<br />
Dialog for configuring visualization elements (category Textvariables)<br />
Line width<br />
In the dialog for configuring visualization elements, you can choose the line width for an element. As<br />
predefined options you find width settings from 1 to 5 pixel, additionally an other value can be entered<br />
manually (Other:), or a project variable (Variable for line width:) can be inserted. For the latter the<br />
input assistance (() can be used.<br />
Note:<br />
As soon as the parameter is additionally defined dynamically, i.e. by a structure variable (see below,<br />
category 'Programmability'), the static setting will be overwritten in online mode.<br />
Dialog Box for Configuring <strong>Visualization</strong> Elements (Line width category)<br />
Colors<br />
In the visualization element configuration dialog box, in the Color category you can select primary<br />
colors and alarm colors for the inside area and for the frame of your element. Chosing the options no<br />
color inside and no frame color you can create transparent elements.<br />
Note:<br />
As soon as the parameter is additionally defined dynamically by a variable, the static setting will be<br />
overwritten in online mode.<br />
In case of multiple definition of an element property consider the specific order of precedence<br />
concerning according to which a value might be overwritten in online mode by another.<br />
2-16<br />
<strong>CoDeSys</strong> <strong>Visualization</strong>
2 - <strong>The</strong> <strong>Visualization</strong> Editor in <strong>CoDeSys</strong><br />
Dialog Box for Configuring <strong>Visualization</strong> Elements (Color Category)<br />
If you now enter a Boolean variable in the Variables category in the Change Color field, then the<br />
element will be displayed in the Color set, as long as the variable is FALSE. If the variable is TRUE,<br />
then the element will be displayed in its Alarm Color.<br />
Note:<br />
<strong>The</strong> change color function only becomes active, if the PLC is in Online Mode!<br />
If you want to change the color of the frame, then press the Frame button, instead of the Inside<br />
button. In either case, the dialog box will open for selection of the color.<br />
Here can to choose the desired hue from the primary colors and the user-defined colors. By pressing<br />
the Define Colors you can change the user-defined colors.<br />
Color Variables<br />
Here you can enter project variables (e.g. PLC_PRG.color_inside), which should determine the<br />
particular property in online mode: <strong>The</strong>se property definitions also or additionally can be programmed<br />
with the aid of components of the structure VisualObjectType. <strong>The</strong>refore see the description on the<br />
"Programability" of a visualization element. <strong>The</strong>re you will find a list of the possible values and their<br />
effects.<br />
Note:<br />
<strong>The</strong> variables, entered in the Color Variables dialog, in online mode will overwrite the static values<br />
given in the 'Color' category as well as corresponding values given by a structure variable.<br />
In case of multiple definition of an element property consider the specific order of precedence<br />
concerning according to which a value might be overwritten in online mode by another.<br />
<strong>The</strong> parameters of the dialog::<br />
Parameter: Description: Example of an entry: Example for using the<br />
variable in the program:<br />
Fillcolor: fill color "plc_prg.var_fillcol" var_var_fillcol:=16#FF00FF<br />
→ fill color pink<br />
corresponding<br />
component of<br />
structure<br />
VisualObjectType:<br />
dwFillColor<br />
Fillcolor alarm: fill color if the<br />
'Change color'<br />
variable is TRUE<br />
"plc_prg.var_fillcol_a"<br />
var_fillcol_a:=16#FF00FF<br />
→ alarm fill color pink<br />
dwFillColorAlarm<br />
Framecolor: frame color "plc_prg.var_framecol" var_framecol::=16#FF00FF<br />
→ frame color pink<br />
dwFrameColor<br />
<strong>CoDeSys</strong> <strong>Visualization</strong> 2-17
<strong>Visualization</strong> Configuration<br />
Framecolor<br />
alarm:<br />
frame color if the<br />
'Change color'<br />
variable is TRUE<br />
"plc_prg.var_framecol" var_framecol:=16#FF00FF<br />
→ alarm frame color farbe<br />
pink<br />
dwFrameColorAlarm<br />
Fillflags:<br />
<strong>The</strong> current<br />
inside color<br />
configuration can<br />
be activated<br />
(FALSE) resp.<br />
deactivated<br />
(TRUE)<br />
"plc_prg.var_col_off"<br />
var_col_off:=1<br />
→ the color definition for the<br />
fill color will not be regarded,<br />
that for the frame remains<br />
valid<br />
dwFillFlags<br />
Frameflags:<br />
Display of the<br />
frame (solid,<br />
dotted etc.)<br />
"plc_prg.var_linetype"<br />
var_linetype:=2;<br />
→ frame will be displayed as<br />
dotted line<br />
dwFrameFlags<br />
Dialog Box for Configuring <strong>Visualization</strong> Elements (Category Colorvariables)<br />
Motion absolute<br />
In the visualization element configuration dialog box, in the Motion absolute category, X- or Y-Offset<br />
fields variables can be entered. <strong>The</strong>se variables can shift the element in the X or the Y direction,<br />
depending on the respective variable value. A variable in the Scale field will change the size of the<br />
element linear to its current value. This value, which is used as scaling factor, will be divided by 1000<br />
implicitely, so that it is not necessary to use REAL-variables in order to get a reduction of the element.<br />
<strong>The</strong> scaling always will refer to the balance point.<br />
A variable in the Angle field causes the element to turn on its turning point, depending on the value of<br />
the variable. (Positive Value = Mathematic Positive = Clockwise). <strong>The</strong> value is evaluated in degrees.<br />
With polygons, every point rotates; in other words, the polygon turns. With all other elements, the<br />
element rotates, in such a way, that the upper edge always remains on top.<br />
<strong>The</strong> turning point appears after a single click on the element, and is displayed as a small black circle<br />
with a white cross (<br />
). You can drag the turning point with a pressed left mouse button.<br />
Note:<br />
In online mode the variables which are set in the 'Motion absolute' dialog will override the values of<br />
structure components which additionally might be used to define the same property<br />
('Programability').<br />
In case of multiple definition of an element property consider the specific order of precedence<br />
concerning according to which a value might be overwritten in online mode by another.<br />
2-18<br />
<strong>CoDeSys</strong> <strong>Visualization</strong>
2 - <strong>The</strong> <strong>Visualization</strong> Editor in <strong>CoDeSys</strong><br />
<strong>Visualization</strong> Element Configuration Dialog Box (Motion Absolute Category)<br />
Motion relative<br />
In the dialog for configuring visualization elements in the Motion Relative category, you can assign<br />
variables to the individual element edges. Depending on the values of the variables, the<br />
corresponding element edges are then moved. <strong>The</strong> easiest way to enter variables into the fields is to<br />
use the Input Assistant ().<br />
<strong>The</strong> four entries indicate the four sides of your element. <strong>The</strong> base position of the corners is always at<br />
zero. A new value in the variables, in the corresponding column, shifts the boundary in pixels around<br />
this value. <strong>The</strong>refore, the variables that are entered ought to be INT variables.<br />
Note:<br />
Note:<br />
Positive values shift the horizontal edges downward, or, the vertical edges, to the right!<br />
In online mode the variables which are set in the 'Motion absolute' dialog will override the values of<br />
structure components which additionally might be used to define the same property<br />
('Programmability').<br />
In case of multiple definition of an element property consider the specific order of precedence<br />
concerning according to which a value might be overwritten in online mode by another.<br />
Dialog Box for Confi guration of <strong>Visualization</strong> Elements (Motion Relative Category)<br />
<strong>CoDeSys</strong> <strong>Visualization</strong> 2-19
<strong>Visualization</strong> Configuration<br />
Variables<br />
<strong>Visualization</strong> Element Configuration Dialog Box (Variables Category)<br />
You can enter the variables that describe the status of the visualization elements in the Variable<br />
category within the dialog box for configuring visualization elements. <strong>The</strong> simplest way to enter<br />
variables in the fields is to use the Input Assistant.<br />
Note:<br />
In online mode the variables which are set in the 'Motion absolute' dialog will override the values of<br />
structure components which additionally might be used to define the same property<br />
('Programability').<br />
In case of multiple definition of an element property consider the specific order of precedence<br />
concerning according to which a value might be overwritten in online mode by another.<br />
You can enter Boolean variables in the Invisible and Change color fields. <strong>The</strong> values in the fields<br />
determine their actions. If the variable of the Invisible field contains the value FALSE, the<br />
visualization element will be visible. If the variable contains the value TRUE, the element will be<br />
invisible.<br />
Disable input: If the variable entered here is TRUE, all settings of category 'Input' will be ignored.<br />
Change color: If the variable which is defined in this field, has the value FALSE, the visualization<br />
element will be displayed in its default color. If the variable is TRUE, the element will be displayed in<br />
its alarm color.<br />
Textdisplay:<br />
• If you have inserted a "%s" in the Content field of the Text category or if you have included "%s" in<br />
the textstring, then the value of the variable which is defined in 'Textdisplay' will be displayed in<br />
online mode in the visualization object. "%s" will be replaced by the value.<br />
• If you have inserted resp. included a "%" in the Content field of the Text category<br />
("PREFIX" must be a sequence of letters) eingegeben haben, then the variable resp. the numeric<br />
value which is entered here in 'Textdisplay' will be interpreted as an ID, which in combination with<br />
the prefix serves as a reference on a text, which is described in a XML-file. This text will be<br />
displayed in online mode instead of "%" in the visualization object. Thus a dynamic<br />
modification of the text display is possible. See further information in the description of the dialog<br />
'Settings', category Language.<br />
• If you want to edit the value of the variable in Online mode using the keyboard, you can do this via<br />
the 'Text input of variable' 'Textdisplay' in the Input category.<br />
Tooltip-display: Enter here a variable of type STRING whose value should be displayed in a tooltip<br />
for the element in online mode.<br />
2-20<br />
<strong>CoDeSys</strong> <strong>Visualization</strong>
2 - <strong>The</strong> <strong>Visualization</strong> Editor in <strong>CoDeSys</strong><br />
Input<br />
Dialog for configuring the visualization elements (Category Input)<br />
Toggle variable: If this option is activated, in online mode you will toggle the value of the variables<br />
which are located in the input field by each mouse click on the visualization element. You can obtain<br />
input assistance for data entry via . <strong>The</strong> value of the Boolean variable changes with each mouse<br />
click from TRUE to FALSE and then back to TRUE again at the next mouse click, etc.<br />
Tap Variable: If this option is activated, in online mode you can switch the value of the Boolean<br />
variable which is located in the input field, between TRUE and FALSE. Place the mouse cursor on the<br />
element, press the mousekey and hold it depressed. If option Tap FALSE is activated, the value is set<br />
to FALSE as soon as the mouse key is pressed, otherwise it is set to TRUE at this moment. <strong>The</strong><br />
variable changes back to its initial value as soon as you release the mouse key.<br />
Zoom to Vis...: If this option is activated, you can enter in the edit field the name of a visualization<br />
object of the same project to which you want to jump by a mouse-click on the element in online mode.<br />
In this case always first the window of the target visualization will be opened before that of the current<br />
one will be closed.<br />
<strong>The</strong> following entries are allowed:<br />
• <strong>The</strong> name of a visualization object of the current project (see Object Organizer)<br />
• If a visualization reference that contains placeholders is to be jumped to, the placeholders can be<br />
directly replaced by variable names or text when called up. For this purpose, conform to the<br />
following syntax:<br />
(:=, :=,..., :=)<br />
Example:<br />
Calling the visualization visu1, whereby the placeholders $var_ref1$ and $var_ref2$ used in visu1 are<br />
replaced by the variables PLC_PRG.var1 and PROG.var1 respectively:<br />
visu1(var_ref1:=PLC_PRG.var1, var_ref2:=PROG.var1)<br />
• If a program variable of the type STRING (e.g. PLC_PRG.xxx) has been entered instead of a<br />
visualization object, then this variable can be used to define the name of the visualization object<br />
(e.g. ,visu1') which the system should change to when a mouse click occurs (e.g. xxx:= ,visu1).<br />
• If you issue the command „ZOOMTOCALLER" in the Zoom to vis. field, a backward jump into the<br />
calling visualization is achieved in Online mode by a mouse click on the element, if such a<br />
constellation was configured.<br />
Note:<br />
<strong>The</strong> implicit variable CurrentVisu (type STRING) describes the name of the currently opened<br />
visualization object. For example it can be used in the application to control which visualization<br />
should be opened resp. to see which is the currently opened. But this will only work if the names of<br />
<strong>CoDeSys</strong> <strong>Visualization</strong> 2-21
<strong>Visualization</strong> Configuration<br />
the visualization objects are defined in capital letters (see chapter 2.1, Create a visualization object).<br />
Example: CurrentVisu:='PLC_VISU';<br />
Execute program: If this option is activated you can enter ASSIGN- or special "INTERN"-commands<br />
in the input field, which will be executed in online mode as soon as you perform a mouse-click on the<br />
element. Inter alia there is a command "PROGRAM" which can be used to call any executable<br />
programs. You get a selection list of possible command entries if you press button "...".<br />
Note:<br />
This feature especially is important if the visualization will be the only operating interface of a system<br />
(pure operating version). See a description of the commands: Special input possibilities for the<br />
<strong>CoDeSys</strong> operating version.<br />
If you select the Text input of variable 'Textdisplay', then in Online mode you will get the possibility<br />
to enter an value in this visualization element which will upon pressing be written to the<br />
variable that appears in the Textdisplay field of the Variables category.<br />
Select in the scroll box which kind of input should be possible later in online mode. Text: An edit field<br />
will open, where you can enter the value. Numpad resp. Keypad: A window will open showing an<br />
image of the numeric resp. alphabetic keypad, where you can enter a value by activating the<br />
appropriate key elements. This might be useful if the visualization must be operatable via a touch<br />
screen. <strong>The</strong> range of valid input values can be restricted by defining a minimum and a maximum value<br />
in the edit fields Min: and Max:.<br />
ToolTip<br />
Security<br />
<strong>The</strong> dialog Text for Tooltip offers an input field for text which appears in a text field as soon as the<br />
mouse cursor is passed over the object in online mode. <strong>The</strong> text can be formatted with line breaks by<br />
using the key combination + .<br />
It might be useful that different user groups get different operating possibilities and display of a<br />
visualization. This can be reached by assigning different access rights concerning particular<br />
visualization elements. You can do this for the eight user groups which are available in <strong>CoDeSys</strong> (see<br />
also 'Project' 'Object' 'Properties' resp. 'Project' 'User Group Passwords'). <strong>The</strong> access rights can be<br />
assigned by activating the appropriate option in the configuration dialog 'Access rights' for a<br />
visualization element:<br />
<strong>Visualization</strong> Element Configuration Dialog Box (Category Security)<br />
<strong>The</strong> access rights for a visualization element and their effect in online mode:<br />
No Access<br />
Element will not be visible<br />
2-22<br />
<strong>CoDeSys</strong> <strong>Visualization</strong>
2 - <strong>The</strong> <strong>Visualization</strong> Editor in <strong>CoDeSys</strong><br />
Read Access Element will be visible but not operatable (no inputs<br />
allowed)<br />
Full Access<br />
Element is not visible and not operatable<br />
If you want to assign the access rights also to all other elements of the visualization object, activate<br />
option Apply to all visual elements.<br />
Note:<br />
Please regard, that the access rights which are set for the visualization object in the 'Project''Object'<br />
'Properties' dialog, are independent on those of the particular visualization elements !<br />
Programability<br />
<strong>The</strong> properties of an visualization element can not only be defined by a static setting or by a "normal"<br />
project variable, but also by the components of a structure variable, which is exclusively used for<br />
programming visualization elements.<br />
For this purpose the structure VisualObjectType is available in the library SysLibVisu.lib. Its<br />
components can be used to define most of the element properties.<br />
Note:<br />
In case of multiple definition of a element property the value of the "normal" project variables will<br />
overwrite that of the structure variable and both will overwrite a static definition.<br />
In order to configure the element properties by using a structure variable, do the following:<br />
Open the configuration dialog, category 'Programmability' and enter a new, unique (!) variable name in<br />
the field Object Name:. For this purpose you must activate the option by a mouse-click in the<br />
checkbox. <strong>The</strong> variable automatically will be declared with type VisualObjectType, a structure which<br />
is contained in the library SysLibVisu.Lib. <strong>The</strong> declaration is done implicitely and not visible for the<br />
user. Make sure that the library is included in the library manager.<br />
After the next compile the newly assigned structure variable will be available in the project. (Hint:<br />
Activate the Intellisense functionality 'List components' in the project options, category Editor, in order<br />
to get the structure components in a selection list as soon as the variable name followed by a dot is<br />
entered).<br />
Example: If you have defined a Object Name "visu1_line" for a visualization element, then you can<br />
program the line width of this element by e.g. "visu1_line.nLIneWidth:=4".<br />
Dialog for configuring a visualization element (Category Programability)<br />
<strong>The</strong> strucure VisualObjectType:<br />
<strong>The</strong> following table will show you all components of the structure and references to the corresponding<br />
items in the different categories of the configuration dialog:<br />
<strong>CoDeSys</strong> <strong>Visualization</strong> 2-23
<strong>Visualization</strong> Configuration<br />
At the beginning of the component name the data type is integrated:<br />
n INT<br />
dw DWORD<br />
b BOOL<br />
st STRING<br />
Component<br />
(+Data type)<br />
Effect<br />
nXOffset : INT; Shift element in X-<br />
direction<br />
nYOffset : INT; Shift element in Y-<br />
direction<br />
Example<br />
(the Object Name "vis1" has been defined<br />
for the element)<br />
vis1.nXOffset:=val2;<br />
(element is set to position X=val2)<br />
vis1.nYOffset:=22;<br />
(element is set to position Y=val2)<br />
corresponding<br />
entries in<br />
configuration<br />
dialog:<br />
- Cat. Motion<br />
absolute: X-Offset<br />
- Cat. Motion<br />
absolute: Y-Offset<br />
nScale : INT; Change of the size vis1.nScale:=plc_prg.scale_var;<br />
(element size changes linear with change<br />
of value of plc_prg.scale_var)<br />
- Cat. Motion<br />
absolute: Scaling<br />
nAngle : INT;<br />
Rotating element<br />
around its center<br />
vis1.anglevar:=15;<br />
(element rotates clockwise by 15 )<br />
- Cat. Motion<br />
absolute: angle<br />
bInvisible : BOOL; Element is visible /<br />
invisible<br />
vis1.visible:=TRUE;<br />
(element is invisible)<br />
- Cat. Color: No color<br />
inside + No frame<br />
color<br />
- Cat. Colorvariables:<br />
Fillcolor +<br />
Framecolor<br />
stTextDisplay :<br />
STRING;<br />
Text is displayed in<br />
element<br />
vis1.TextDisplay:='ON / OFF';<br />
element is inscribed with this text<br />
- Cat. Text: entry at<br />
'Content'<br />
bToggleColor : BOOL; color change when<br />
toggling between<br />
TRUE and FALSE<br />
vis1.bToggleColor:=alarm_var;<br />
(As soon as alarm_var gets TRUE, the<br />
element gets the color defined via the<br />
components dwFillColorAlarm,<br />
dwFrameColorAlarm resp. via the settings<br />
in category 'Colorvariables' or 'Color'.<br />
- Cat. Input: Toggle<br />
variable +<br />
- Cat. Variables:<br />
Change color<br />
bInputDisabled:<br />
BOOL;<br />
if FALSE: Inputs in<br />
category 'Input' are<br />
ignored<br />
vis1.bInputDisabled:=FALSE;<br />
(no input is possible for this elementt)<br />
- Cat. Variables:<br />
'Disable Input'<br />
stTooltipDisplay:STRI<br />
NG;<br />
Text of the tooltip<br />
vis1.stTooltipDisplay:='Switch<br />
for .....';<br />
- Cat. Text for<br />
Tooltip: Entry in<br />
'Content:'<br />
dwTextFlags:DWORD; Text position:<br />
1 left justified<br />
2 right justified:<br />
4 centered horiz.<br />
8 top<br />
10 bottom<br />
20 centered<br />
vertically<br />
Note: Always set a<br />
horizontal and a<br />
vertical position<br />
(addition of values)!<br />
vis1.dwTextFlags:=24;<br />
(Text will be placed in the center of the<br />
element (4 + 20)<br />
- Cat. Text:<br />
Horizontal and<br />
Vertical options<br />
- Cat. Textvariables:<br />
Textflags<br />
dwTextColor :<br />
DWORD;<br />
Text color (definition<br />
of colors see<br />
vis1.dwTextColor :=<br />
16#00FF0000;<br />
- Cat. Text: Font |<br />
Color<br />
2-24<br />
<strong>CoDeSys</strong> <strong>Visualization</strong>
2 - <strong>The</strong> <strong>Visualization</strong> Editor in <strong>CoDeSys</strong><br />
subsequent to this<br />
table)<br />
(Text is blue-colored)<br />
- Cat. Textvariables:<br />
Textcolor<br />
nFontHeight : INT;<br />
Font height in Pixel.<br />
should be in range<br />
10-96<br />
vis1.nFontHeight:=16;<br />
(Text height is 16 pt)<br />
- Cat. Text: Font |<br />
Grad'<br />
- Cat. Textvariables:<br />
Font heigth<br />
dwFontFlags :<br />
DWORD;<br />
Font display.<br />
Available flags:<br />
1 italic<br />
2 fett<br />
4 underlined<br />
8 canceled<br />
vis1.dwFontFlags:=10;<br />
(Text is displayed blue and canceled)<br />
- Cat. Text: Schrift |<br />
Schriftschnitt<br />
- Cat. Textvariables:<br />
Fontflags<br />
+ combinations by<br />
adding values<br />
stFontName : STRING; Change font<br />
vis1.stFontName:=’Arial’;<br />
(Arial is used)<br />
- Cat. Text: Schrift |<br />
Schriftart<br />
- Cat. Textvariables:<br />
Fontname<br />
nLineWidth : INT;<br />
Line width of the<br />
frame (pixels)<br />
vis1.nLWidth:=3;<br />
(Frame width is 3 Pixels)<br />
- Cat. Line width<br />
dwFillColor : DWORD; Fill color (definition<br />
of colors see<br />
subsequent to this<br />
table)<br />
vis1.dwFillColor":=16#00FF0000;<br />
(Element ist im "Normalzustand" blau)<br />
- Cat. Color: Color |<br />
nside<br />
- Cat. Colorvariables:<br />
Inside<br />
dwFillColorAlarm :<br />
DWORD;<br />
Fill color as soon as<br />
bToggleColor gets<br />
TRUE, see above)<br />
(definition of colors<br />
see subsequent to<br />
this table)<br />
vis1.dwFillColorAlarm:=16#00808<br />
080;<br />
(as soon as Variable togglevar gets TRUE,<br />
the element will be displayed grey-colored)<br />
- Cat. Color: Alarm<br />
color | Inside<br />
- Cat. Colorvariables:<br />
Inside Alarm<br />
dwFrameColor:<br />
DWORD;<br />
Frame color<br />
(definition of colors<br />
see subsequent to<br />
this table)<br />
vis1.dwFrameColor:=16#00FF0000;<br />
(Frame is blue-colored)<br />
- Cat. Color: Color |<br />
Frame<br />
- Cat. Colorvariables:<br />
Frame<br />
dwFrameColorAlarm:<br />
DWORD;<br />
Fill color as soon as<br />
bFrameColor gets<br />
TRUE, see above<br />
(definition of colors<br />
see subsequent to<br />
this table)<br />
vis1.dwFrameColorAlarm:=16#0080<br />
8080; (as soon as Variable<br />
vis1.bToggleColor gets TRUE, the frame<br />
will be displayed grey-colored)<br />
- Cat. Color: Alarm<br />
color | Frame<br />
- Cat. Colorvariables:<br />
Frame Alarm<br />
dwFillFlags: DWORD;<br />
Color, as defined by<br />
the color variables,<br />
can be displayed or<br />
ignored<br />
0 = show color<br />
>0 = ignore setting<br />
vis1.dwFillFlags:=1;<br />
(element gets invisible)<br />
- Cat. Color: No color<br />
inside + No frame<br />
color<br />
- Cat. Colorvariables:<br />
Fillflags<br />
dwFrameFlags:<br />
DWORD;<br />
Display of frame:<br />
0 full<br />
1 dashed ( --- )<br />
2 dotted ( )<br />
3 dash-point ( _._._<br />
)<br />
vis1.FrameFlags:=1;<br />
(Frame will be displayed as dashed line)<br />
- Cat. Colorvariables:<br />
Frameflags<br />
<strong>CoDeSys</strong> <strong>Visualization</strong> 2-25
<strong>Visualization</strong> Configuration<br />
4 dash-point-point<br />
(_.._.. )<br />
8 blind out line<br />
Defining color values:<br />
Example: e1.dwFillColor := 16#00FF00FF;<br />
A color is entered as a hex number which is composed of the Blue/Green/Red (RGB) components.<br />
<strong>The</strong> first two zeros after "16#" should be set to in each case, to fill the DWORD size. For each color<br />
value 256 (0-255) colors are available.<br />
FF Blue component<br />
00 Green component<br />
FF Red component<br />
Example for a blinking visualization element:<br />
Define a global variable 'blink1' of type VisualObjectType in the configuration of a rectangle. In a program of<br />
function block the value of a component of the structure can be modified.<br />
PROGRAM PLC_PRG<br />
VAR<br />
n:INT:=0;<br />
bMod:BOOL:=TRUE;<br />
END_VAR<br />
(* Blinking element *)<br />
n:=n+1;<br />
bMod:= (n MOD 20) > 10;<br />
IF bMod THEN<br />
blinker.nFillColor := 16#00808080; (* Grau *)<br />
ELSE<br />
blinker.nFillColor := 16#00FF0000; (* Blau *)<br />
END_IF<br />
Table<br />
As soon as a table is inserted for the purpose of visualization of an array, the dialog Configure Table<br />
will be openend. Besides the categories 'Tooltip' and 'Security' which are also available for other<br />
visualization elements, the following categories will be available for configuring display and contents of<br />
the table:<br />
Category Table:<br />
Dialog for the configuration of a Tabl e, Category Table<br />
2-26<br />
<strong>CoDeSys</strong> <strong>Visualization</strong>
2 - <strong>The</strong> <strong>Visualization</strong> Editor in <strong>CoDeSys</strong><br />
Do the following table settings:<br />
Data array: Insert the name of an array which should be visualized in the table. It is recommended to<br />
use the input assistant () resp. the Intellisense function.<br />
Column header, Line header: Activate these options if you want to get displayed the titles in the<br />
table. <strong>The</strong> line title reflects the array index (first column of the table), the column title can be defined in<br />
category 'Columns'.<br />
Category Columns:<br />
Dialog for the configuration of a Table, Category Columns<br />
Here you define the table elements. In the left window you get al list of all elements, which are<br />
handled in the array per index. In case of an array of a structure these would be the structure<br />
components.<br />
Using the arrow button > you can transfer a selected component from the left window to the right<br />
window where you define the set of elements to be displayed in the table. Pressing button >> all<br />
elements will be transferred at a single blow. In the same manner you can remove elements from an<br />
already defined set (
<strong>Visualization</strong> Configuration<br />
structure component "iNo"). which you can change Furtheron the Column width (number of<br />
characters) can be set.<br />
Editing configuration parameters for all elements of a column:<br />
By default the table fields are displayed as simple rectangles and the entries are not editable. If you<br />
however activate the option Use template, a pre-defined set of parameters can be used, e.g. for the<br />
line width, the text input possibilities etc. To edit these parameters the common configuration dialogs<br />
as know for rectangles, bitmaps, buttons etc. are available, which you can access by a mouse-click<br />
on the button Edit template.<br />
In order to define online actions for all entries of a column, i.e. for all array-elements of one array<br />
dimension, use the placeholder [INDEX] when entering the array name in the configuration dialogs<br />
(e.g. PLC_PRG.arr1[INDEX] like used in the default column header).<br />
Example:<br />
You are visualizing an array "arr1 [0..2] of BOOL" (table with 1 column) and you want, that in online mode by a<br />
mouse-click on a table cell the cell gets red-colored and the corresponding array element will be toggled and<br />
vice versa.<br />
To reach this activate 'Use template' in the configuration dialog for the column and define the template as<br />
follows:<br />
Category 'Input', Action 'Toggle variable': "PLC_PRG.arr1[INDEX].<br />
Category 'Colors': Alarm color red.<br />
Category 'Variables', Action 'Change color': "PLC_PRG.arr1[INDEX].<br />
Category Rows:<br />
Row height: Insert the desired height in number of pixels.<br />
Category Selection:<br />
Here you can set the following parameters concerning the selection behaviour within the table:<br />
Selection color: Press this button to get the standard color dialog for choosing a color for selected<br />
cells.<br />
2-28<br />
<strong>CoDeSys</strong> <strong>Visualization</strong>
2 - <strong>The</strong> <strong>Visualization</strong> Editor in <strong>CoDeSys</strong><br />
Dialog for configuring a Table, Categorie Selection<br />
Selection type: Define which part of the table will be selected when you perform a mouse-click on<br />
one of the table fields in online mode:<br />
Select single cells: Only the cell will be selected.<br />
Select only rows: <strong>The</strong> whole line will be selected.<br />
Select only columns: <strong>The</strong> whole column will be selected.<br />
Select rows and columns: <strong>The</strong> whole column and line will be selected.<br />
Frame around selected cells: A selected cell gets surrounded by a frame.<br />
Variable for selection X, Variable for selection Y: Here you each can enter a project variable, which<br />
will indicate the X- resp. Y-Index of the selected table cell.<br />
Example: Create a table element visualizing the array of a structure:<br />
Define the following structure:<br />
TYPE strucTab :<br />
STRUCT<br />
iNo: INT;<br />
bDigi : BOOL;<br />
sText:STRING;<br />
byDummy: BYTE;<br />
END_STRUCT<br />
END_TYPE<br />
In PLC_PRG define the following array:<br />
arr1:ARRAY [1..5] OF strucTab;<br />
and the following variables:<br />
selX:INT;<br />
selY:INT;<br />
Create a visualization object and insert a table element. Configure like follows::<br />
Cat. Table: data array: "PLC_PRG.arr1"<br />
Cat. Columns: (Close the dialog which will open with YES) – Transfer the components iNo, bDigi, sText to the<br />
right window - In the right window perform a double-click on the first entry (PLC_PRG.arr1[INDEX].iNo) and in<br />
the dialog which will open, replace the default title by "Number". Confirm with OK and also define new column<br />
titles for the other two entries (e.g. "Value" and "Text"). – In category 'Spec.Table' enter at 'Variable Selection X':<br />
"PLC_PRG.selX" and at Variable Selection "Y: PLC_PRG.selY". Activate option 'Frame around selected cells'.<br />
Press button 'Selection color' and choose color 'yellow'. Close the configuration dialog with OK. <strong>The</strong> table<br />
element now should be displayed as shown in the following:<br />
<strong>CoDeSys</strong> <strong>Visualization</strong> 2-29
<strong>Visualization</strong> Configuration<br />
At the left border the numbers of the array index, at the top the titles of the selected structure components. You<br />
can modify the column widths by placing the cursor on the separator between two columns and moving the<br />
mouse as soon as the cursor appears as a horizontal double-arrow. .<br />
In online mode the current values of the array elements will be displayed in the table cells. As soon as you<br />
select a table cell by a mouse-click, it will get yellow-colored and surrounded by a frame.<br />
Example:<br />
Meter<br />
Dialog for the configuration of a Meter element<br />
This dialog will open automatically as soon as you insert a Meter into a visualization object. A Preview<br />
is part of the dialog, immediately showing how the element will look as a result of the currently set<br />
parameters:<br />
Arrowtype: Define the type of the arrow which will point at the current value on the Meter. Possible<br />
types: Normal arrow, Thin arrow, Wide arrow, Thin needle.<br />
Arrow start, Arrow end: Here you define the start and the end positions of the scale on a virtual<br />
circular arc in ° Degrees (angle). (Example: a Start angle of 180° and an End angle of 0° will<br />
define a upturned semicircle).<br />
2-30<br />
<strong>CoDeSys</strong> <strong>Visualization</strong>
2 - <strong>The</strong> <strong>Visualization</strong> Editor in <strong>CoDeSys</strong><br />
Arrow color: This button opens the standard dialog for choosing a color. Define the color of the<br />
pointer.<br />
Variable/Scale: This button opens the dialog Configure scale and variable:<br />
Dialog for Configuring the Scale and Variable for a Meter element<br />
Scale start, Scale end: lowest and highest value on the scale, e.g. "-4" and "4".<br />
Main scale: Define which intervals on the scale should be marked "with all", that means which<br />
should get a scale pitch and a label. If you insert e.g. "2", each second integer value will be<br />
indicated.<br />
Sub scale: In addtion to the main scale (Label + long pitch lines) here you can define a subscale<br />
which will be displayed as short pitch lines without any labels.<br />
Unit: Define here the scale unit, e.g. "cm" or "sec". <strong>The</strong> unit is indicated by a label at the origin<br />
of the pointer.<br />
Scale format (C-Syntax): According to the C-syntax you can define the display format of the<br />
scale labels; see the description concerning Category 'Text'.. Example: If you insert "%1.1f" the<br />
scale values will be indicated by a floating point number with one decimal place before and one<br />
after the comma (e.g. "12.0")<br />
Variable: Here you can define a variable which is assigned to the pointer position. (e.g.<br />
"PLC_PRG.posvar")<br />
Font selection: This button will open the standard dialog for defining the font used in the Meter<br />
element.<br />
Color areas: This button opens the dialog Configure color areas: Here you can define a separate<br />
color for each partition of the scale:<br />
Begin of area, End of area: Insert here the start and end values of the scale partition which<br />
should get the color defined in the following:<br />
Color selection: This button opens the standard dialog for choosing a color. Confirm your<br />
selection with OK, which will close the dialog, and press button Add, whereupon the color and the<br />
assigned partition of the scale will be added to the window 'Active areas'. In order to remove an<br />
already defined area, select the entry and press Delete.<br />
If the option Durable color areas is activated, the defined color ranges will be displayed<br />
permanently, otherwise in online mode just that partition of the scale will be colored which<br />
contains the current value of the respective value.<br />
Label: Depending on which of the options is activated (inside or outside), the scale labels are<br />
placed at the inside or the outside of the circular arc of the scale.<br />
<strong>CoDeSys</strong> <strong>Visualization</strong> 2-31
<strong>Visualization</strong> Configuration<br />
Dialog for the configuration of color areas for a Meter<br />
Bar Display<br />
Additional settings:<br />
Frame inside, Frame outside: If one or both of these options is/are activated, an inner or outer frame<br />
will be added to the scale arc.<br />
Additional arrow: In addition to the main pointer a little arrow will indicate the current value directly<br />
on the scale.<br />
Dialog for the configuration of a Bar Display element<br />
This dialog will be opened as soon as you insert a Meter element into a visualization object. A<br />
Preview is part of the dialog, immediately showing how the element will look as a result of the<br />
currently set parameters:<br />
Diagram type: Choose one of the options: 'Scale beside bar', 'Scale inside bar' und 'Bar inside<br />
scale'.<br />
Orientation: Define one of the options: Horizontal or Vertical bar.<br />
2-32<br />
<strong>CoDeSys</strong> <strong>Visualization</strong>
2 - <strong>The</strong> <strong>Visualization</strong> Editor in <strong>CoDeSys</strong><br />
Histogram<br />
Running direction: Choose whether the bar should be elongated corresponding to a growing value<br />
of the assigned variable in Left – Right or in Right – Left direction.<br />
Bar color: This button opens the standard dialog for choosing a color. Define a color for the bar in<br />
normal state (no alarm). If option 'Use color areas' (see below) is activated, no entries are possible.<br />
Alarm color: This button opens the dialog Configure alarm, where you define at which value the bar<br />
will be displayed in alarm color and which is the alarm color: Insert the desired limit value in the edit<br />
field and activate one of the Conditions greater than or lower than, in order to define whether<br />
values higher or lower than the limit value should set off an alarm. Press button Alarm color to open<br />
the standard color dialog for choosing an alarm color. Close both dialogs with OK in order to confirm<br />
the settings and to return to the main dialog for configuring the bar display. If the option 'Use color<br />
ranges' (see below) is activated, no entries are possible.<br />
Variable/Scale: This button opens the dialog Configure scale and variable, which corresponds to<br />
that used for the Meter element.<br />
Element frame: If this option is activated a frame will enclose the bar display.<br />
Bar background: If this option is activated, the whole display range will be indicated by a black bar in<br />
the background of the current values' bar, otherwise only the current values' bar will be displayed.<br />
Use color areas: If this option is activated, any settings defined in the dialogs for 'Bar color' and<br />
'Alarm color' (see above) will not be valid. In this case the color area definitions will be used, which<br />
have been made in the dialog 'Configure color areas'. This dialog can be opened by pressing button<br />
'Color areas' (see below)<br />
Color areas: This button opens the dialog Configure color areas where you can define a separate<br />
color for each partition of the scale. <strong>The</strong>se definitions will only be valid if the option 'Use color areas'<br />
(see above) is activated. Use the dialog as described for the Meter element.<br />
A histogram element can be used to visualize an array. <strong>The</strong> values of the array elements will be<br />
represented by bars or lines side by side, indicating the current values of the element by their heigth.<br />
Dialog for the configuration of a Histogram<br />
<strong>The</strong> configuration dialog will be opened as soon as you insert a histogram element into a visualization<br />
object. A Preview is part of the dialog, immediately showing how the element will look as a result of<br />
the currently set parameters:<br />
Presentation: Activate one of the options Barchart or Lines.<br />
<strong>CoDeSys</strong> <strong>Visualization</strong> 2-33
<strong>Visualization</strong> Configuration<br />
Show horizontal lines: If this option is activated, horizontal lines spanning the diagram will<br />
additionally display the scale gradation.<br />
Alarm color: This button opens the dialog Configure alarm, where you define at which value the bar<br />
will be displayed in alarm color and which is the alarm color: Insert the desired threshold value in the<br />
edit field and activate one of the Conditions greater than or less than, in order to define whether<br />
values higher or lower than the limit value should set off an alarm. Press button Alarm color to open<br />
the standard color dialog for choosing an alarm color. Close both dialogs with OK in order to confirm<br />
the settings and to return to the main dialog for configuring the histogram.<br />
Variable/Scale: This button opens the dialog Configure scale and variable, which can be filled like<br />
described for the Meter element.<br />
Color areas: This button opens the dialog Configure color areas: Here you can define a separate<br />
color for each partition of the scale. See the description of the Meter where the same dialog is<br />
available.<br />
Bar color: This button opens the standard dialog for choosing a color. Define a color for the bar in<br />
normal state (no alarm).<br />
Barcount: Insert the desired number of bars (e.g. corresonding to the number of elements of the<br />
array).<br />
Barwidth: Define the width of the bars in percent by the total width available for one bar.<br />
Example:<br />
See in the following picture an example of the online display (bars resp. lines) of a histogram which represents an array arr1<br />
[0..4] of INT. <strong>The</strong> number of bars appropriately was set to "5", the scale start to "–4", the scale end to "24", the main gradation<br />
was set to "2", the sub-gradation to "1" and the scale range 0 – 8 has got assigned another color (dark grey) than the rest of<br />
the scale range. Furtheron the bars should be displayed alarm-colored (blue) as soon as the value of the corresponding array<br />
element exceeds "8". You see the array elements arr1[2] and arr1[3] currently beeing in alarm state:<br />
Bitmap<br />
You can enter the options for a bitmap in the Bitmap category within the visualization element<br />
configuration dialog box.<br />
Enter the bitmap file and its path in the Bitmap field. You can use the ... button to open the standard<br />
Windows Browse dialog box from which you can select the desired bitmap.<br />
All other entries affect the frame of the bitmap.<br />
By selecting Anisotropic, Isotropic or Fixed you specify how the bitmap should react to changes in<br />
the size of the frame. Anisotropic means that the bitmap remains the same size as the frame which<br />
allows you to change the height and width of the bitmap independently. Isotropic means that the<br />
bitmap retains the same proportions even if the overall size is changed (i.e., the relationship between<br />
height and width is maintained). If Fixed is selected, the original size of the bitmap will be maintained<br />
regardless of the size of the frame.<br />
2-34<br />
<strong>CoDeSys</strong> <strong>Visualization</strong>
2 - <strong>The</strong> <strong>Visualization</strong> Editor in <strong>CoDeSys</strong><br />
If the Clip option is selected together with the Fixed setting, only that portion of the bitmap that is<br />
contained within the frame will be displayed.<br />
If you select the Draw option, the frame will be displayed in the color selected in the Color and Alarm<br />
color buttons in the color dialog boxes. <strong>The</strong> alarm color will only be used if the variable in the Change<br />
Color field in the Variable category is TRUE.<br />
In the selection list in the lower part of the dialog you can define whether the bitmap should be<br />
inserted in the project (Insert) or whether just a link to an external bitmap-file (path as entered above<br />
in the 'Bitmap' field) should be created (Link to file). It is reasonable to keep the bitmap file in the<br />
project directory, because then you can enter a relative path. Otherwise you would enter an absolute<br />
path and this might cause problems in case you want to trans fer the project to another working<br />
environment.<br />
<strong>Visualization</strong> Element Configuration Dialog Box (Bitmap Category)<br />
<strong>Visualization</strong><br />
When you insert a visualization as an element in another visualization, you are creating a "reference"<br />
of the visualization.<br />
<strong>The</strong> configuration of this reference can be done in the <strong>Visualization</strong> category within the visualization<br />
element configuration dialog box.<br />
<strong>Visualization</strong> Element Configuration Dialog Box ( <strong>Visualization</strong> Category)<br />
<strong>CoDeSys</strong> <strong>Visualization</strong> 2-35
<strong>Visualization</strong> Configuration<br />
Enter the object name for the visualization, which should be inserted, in the <strong>Visualization</strong> field. Use<br />
the ... button to open a dialog box containing the visualizations available in this project. Any<br />
visualization may be used with the exception of the current one.<br />
<strong>The</strong> following entries affect the visualization Frame:<br />
• If you select the Draw option, the frame will be displayed in the color selected in the Color and<br />
Alarm color buttons in the color dialog boxes. <strong>The</strong> alarm color will only be used if the variable in<br />
the Change Color field in the Variables category is TRUE.<br />
• If Isotropic is selected, the proportions of the visualization will be maintained even if the size<br />
changes (i.e., the relationship between height and width will remain the same). Otherwise the<br />
proportions can be changed.<br />
• If the Clip option is selected in Online mode, only the original portion of the visualization will be<br />
displayed. For example, if an object extends beyond the original display area, it will be clipped and<br />
may disappear from view completely in the visualization.<br />
<strong>The</strong> Placeholder button leads to the 'Replace placeholder' dialog. It lists in the 'Placeholder' column<br />
all the placeholders which had been inserted in the configuration dialogs of the "mother"-visualization<br />
and offers in the 'Replacements' column the possibility of replacing these for the current reference with<br />
a definite value. Which replacements are possible in a given case depends on whether a value group<br />
was predefined in the 'Extras' 'Placeholder list' dialog in the "mother"-visualization. If this is the case, it<br />
will be displayed in a combo box for selection. If nothing was pre-defined, double clicking on the<br />
corresponding field in the Replacements column opens an editing field which can be filled in as<br />
desired.<br />
A further possibility for replacing placeholders in references occurs directly when you define the call of<br />
a visualization by an entry into the Zoom to vis. option field in the configuration dialog ('Input'<br />
category).<br />
Note: No control of the chronological sequence of replacements is possible! <strong>The</strong>refore no placeholders<br />
should be replaced with text that also contains placeholders!<br />
Note: When using placeholders it is no longer possible to check for invalid entries in the configuration of the<br />
visualization element immediately upon compilation of the project. Hence the appropriate error<br />
messages are first issued in Online mode (...Invalid Watch expression..).<br />
Attention: Online behaviour of a visualization reference: If you insert a visualization and then select and<br />
configurate this reference, it will be regarded as a single object and in online mode will react to inputs<br />
correspondingly to its configuration. In contrast: if you do not configurate the reference, then in online<br />
mode its particular visualization elements will react exactly like those of the original visualization.<br />
Example of an application of the placeholder concept (also see chapter 2.7) :<br />
Instances of a function block can easily be displayed with the help of references of the same visualization. For<br />
example, in configuring the visualization visu, which visualizes the variables of function block, one could begin<br />
each variable entry with the placeholder $FUB$ (e.g. $FUB$.a). If a reference from visu is then used (by<br />
inserting visu in another visualization or by calling via 'Zoom to vis.'), then in the configuration of this reference<br />
the placeholder $FUB$ can then be replaced with the name of the function block instance to be visualized.<br />
This might look like shown in the following:<br />
In the project define a function block containing the following declarations:<br />
FUNCTION_BLOCK fu<br />
VAR_INPUT<br />
changecol : BOOL; (* should cause a color change in the visualization *`)<br />
END_VAR<br />
In PLC_PRG define two instances of 'fu':<br />
inst1_fu : fu;<br />
inst2_fu : fu;<br />
Create a visualization object 'visu'. Insert an element and open the configuration dialog, category 'Variables'.<br />
Enter in field 'Change color' the following: "$FUB$.changecol". Open category 'Input' and enter in field 'Tap<br />
Variable' "$FUB$.changecol". Open category 'Text' and enter"$FUB$ - change color ".<br />
Create another visualization object 'visu1'.<br />
Insert visualization 'visu' twice in 'visu1' (two references of 'visu').<br />
2-36<br />
<strong>CoDeSys</strong> <strong>Visualization</strong>
2 - <strong>The</strong> <strong>Visualization</strong> Editor in <strong>CoDeSys</strong><br />
Mark the first reference of 'visu' and open the configuration dialog of category '<strong>Visualization</strong>'. Press button<br />
'Placeholder', so that the placeholder list will be displayed. <strong>The</strong>re replace entry 'FUB' by 'PLC_PRG.inst_1'.<br />
Now mark the second reference of 'visu' and (like described for the first one) replace 'FUB' by<br />
'PLC_PRG.inst_2'.<br />
Now in online mode the values of the variables which are used to configure the two instances of 'fu' will be<br />
visualized in the corresponding reference of 'visu'.<br />
Of course the placeholder $FUB$ can be used at all places in the configuration of 'visu' where variables or text<br />
strings are entered.<br />
Special input possibilities for operating versions<br />
<strong>The</strong> <strong>CoDeSys</strong> visualization can target specifically be used with <strong>CoDeSys</strong> HMI or as Web- or Target-<br />
<strong>Visualization</strong> as a mere operating interface. <strong>The</strong>n no menus and status and tool bars will be available<br />
to the user and no possibility to modify the code.<br />
Thus, when a visualization is created with <strong>CoDeSys</strong> for the purpose of beeing used as a 'operating<br />
version' the principal control and monitoring functions in a project must be assigned to visualization<br />
elements thus making them accessible via mouse click or keyboard in Online mode.<br />
See in the following some special input possibilities to configure visualization elements for the purpose<br />
of beeing used in <strong>CoDeSys</strong> HMI. <strong>The</strong>y are available in the configuration dialog for a visualization<br />
element:<br />
In category Input enter internal commands in the field Execute program according to the following<br />
syntax (<strong>The</strong> dialog 'Configure Programs' is available for this purpose):<br />
INTERN [PARAMETER]*<br />
<strong>The</strong> following table shows the available internal commands. Some of them expect to receive several<br />
parameters, which are then entered separated by spaces. Optional parameters are enclosed in<br />
square brackets. For those commands which require that a Watch list be specified, a placeholder can<br />
be used instead of the direct name. If you enter several commands for one element, these are<br />
separated by commas.<br />
Command<br />
<strong>The</strong> equivalent in the<br />
programming version<br />
of <strong>CoDeSys</strong><br />
Explanation<br />
ASSIGN<br />
:=<br />
Assignment<br />
A variable or expression gets assigned to<br />
another<br />
variable.<br />
Example:<br />
INTERN ASSIGN PLC_PRG.ivar1:=PROG1.ivar+12;<br />
PROGRAM [Path<br />
of the file to be opened]<br />
Program call <strong>The</strong> program will be executed.<br />
Example:<br />
INTERN PROGRAM C:\programms \notepad.exe text.txt<br />
LANGUAGEDIALOG<br />
visualization settings <strong>The</strong> dialog for visualization settings which<br />
includes the category language gets openend.<br />
LANGUAGE <br />
visualization settings,<br />
Language<br />
<strong>The</strong> desired language is set without using the<br />
dialog for visualization settings.<br />
DEFINERECEIPT name Select watch lists A watch list is selected from the receipt manager<br />
which enters your name (name) when the<br />
command is given. <strong>The</strong> variables in this watch list<br />
are registered and displayed.<br />
READRECEIPT name 'Read receipt' In the defined watch list the pre-definition of the<br />
variables will be replaced by the current values.<br />
WRITERECEIPT name 'Write receipts' <strong>The</strong> name of a watch list of the receipt manager<br />
<strong>CoDeSys</strong> <strong>Visualization</strong> 2-37
<strong>Visualization</strong> Configuration<br />
is expected. <strong>The</strong> receipt of this watch list will be<br />
written. A previous execution of<br />
DEFINERECEIPT is not necessary.<br />
SAVEWATCH 'Save watch list' <strong>The</strong> receipt will be read into the current watch list<br />
which will be stored in a file. Important: call a<br />
previous DEFINERECEIPT to define the current<br />
receipt !<br />
LOADWATCH 'Load watch list'+<br />
'Write receipt'<br />
<strong>The</strong> standard window ‚File open' appears, from<br />
which a previously stored receipt can be<br />
selected. This receipt will be immediately written<br />
into the controller system.<br />
CHANGEUSERLEVEL - A dialog for setting the user group level will open.<br />
<strong>The</strong> eight <strong>CoDeSys</strong> user group levels are offered<br />
for selection.<br />
CHANGEPASSWORD cp. 'Project' 'User<br />
Group Passwords...'<br />
A dialog for changing the user group password<br />
will appear.<br />
SAVEPROJECT ‚File' 'Save' <strong>The</strong> project will be saved.<br />
EXITPROGRAM 'File' 'Close' <strong>The</strong> program will be exited.<br />
PRINT '‚File' 'Print' <strong>The</strong> current visualization will be printed out<br />
online.<br />
HELP Call of a help file Depending on which language is set for the<br />
visualization, a help file will be called which is<br />
entered for that language in the <strong>CoDeSys</strong>.ini file.<br />
(see 'Extras' 'settings')<br />
TRACE Open object trace<br />
recording<br />
Dialog for the trace recording in the operating version<br />
<strong>The</strong> window for trace recording (Sampling Trace)<br />
will be opened.<br />
<strong>The</strong> menu commands Trace Start, Read, Stop,<br />
Save, Load which are available in the full version<br />
of <strong>CoDeSys</strong> are available in this window.<br />
2-38<br />
<strong>CoDeSys</strong> <strong>Visualization</strong>
2 - <strong>The</strong> <strong>Visualization</strong> Editor in <strong>CoDeSys</strong><br />
2.4.2 <strong>Visualization</strong> Object, Configure...<br />
Besides the configuration of the individual visualization elements also the visualization object on the<br />
whole can get configured. This is possible concerning the settings for frame, language, grid,<br />
background etc. as well as the assignment of special hotkey definitions (keyboard usage), which<br />
should be valid for exactly one visualization object.<br />
'Extras' 'Settings' / Display, Frame, Grid, Language<br />
When this command is used, a dialog box will open in which you can make certain settings that affect<br />
the visualization.<br />
Note:<br />
<strong>The</strong> categories Display, Frame and Language also can be edited in the online mode.<br />
Category Display :<br />
Enter a zoom factor into the field Zoom of between 10 and 500 % in order to increase or decrease the<br />
size of the visualization display.<br />
Setting dialog for visualizations (Category Display)<br />
Category Frame: If Auto-scrolling is selected, the visible portion of the visualization window will move<br />
automatically when you reach the edge while drawing or moving a visualization element. If Best fit in<br />
Online mode is selected, the entire vi sualization including all elements will be shown in the window in<br />
Online mode regardless of the size of the window. When Include Background Bitmap is selected,<br />
the background bitmap will be fitted into the window as well, otherwise only the elements will be<br />
considered.<br />
Category Grid: Define here whether the grid points are visible in the offline mode, whereby the<br />
spacing between the visible points is at least 10 even if the entered size is smaller than that. In this<br />
case the grid points only appear with a spacing which is a multiple of the entered size. Selecting<br />
Active causes the elements to be placed on the snap grid points when they are drawn and moved.<br />
<strong>The</strong> spacing of the grid points is set in the field Size.<br />
Category Language : Here you can specify in which national language the text that you assigned to an<br />
element in the Text and Text for Tooltip options should be displayed. Additionally the option<br />
'Dynamic Texts' allows a dynamic change of the displayed text.<br />
Note:<br />
<strong>The</strong> text display changes only in Online mode!<br />
For a non-dynamic switch of the used language a language file can be used (project translation file<br />
*.tlt or *.txt, resp. a special visualization language file *vis).<br />
Alternatively dynamic texts can be used. Those allow to switch between different text version in the<br />
display of a visualization element, inclusively the change of language.<br />
Language file:<br />
<strong>CoDeSys</strong> <strong>Visualization</strong> 2-39
<strong>Visualization</strong> Configuration<br />
In order to select a translation or language file, activate the Language file option in the dialog<br />
and enter in the input field next to it the appropriate file path, or obtain the help of the standard<br />
file opening dialog via the<br />
button.<br />
Dialog for selection of a language file for a visualization<br />
In the selection window under Language you can now select among the options German and<br />
English in the example shown here.<br />
Regarding creating a translation file *.tlt, please see 'Project' 'Translate into other anguages'.<br />
For creating a special language file *.vis for the visualization, see here (This option is retained<br />
for reasons of compatibility with projects created under Version 2.1.):<br />
Creating a *.vis language file:<br />
In order to set up a new *.vis language file for the visualization, proceed as follows:<br />
Open likewise the Settings <strong>Visualization</strong> dialog, Language category. Choose option<br />
language file. In the associate input field enter where you want to store the file. <strong>The</strong><br />
extension is .vis. You also can use the dialog 'Open file' by pressing the button. If a<br />
language file with the extension .vis is already present, it will be offered to you here.<br />
In the input field next to Language you fill in a keyword for the language which is<br />
currently used in the visualization, i.e."german" (or "D"). then press the button Save. A<br />
file with the extension .vis will be created, which now can be edited by a normal text<br />
editor. For example you can open the file by NOTEPAD:<br />
Example of a language file for a visualisation (Category Language)<br />
2-40<br />
<strong>CoDeSys</strong> <strong>Visualization</strong>
2 - <strong>The</strong> <strong>Visualization</strong> Editor in <strong>CoDeSys</strong><br />
Dynamic texts:<br />
You get a list of the text variables for the language currently used in the visualization. It<br />
includes a reference to the title of this list, for example "1=german" as reference to the<br />
title [german]. You can extend the list by copying all lines, then replacing the German by<br />
English text and setting a new title [english]. Beyond the line 1=german you accordingly<br />
have to add 2=english.<br />
To view the visualization in one of the prepared languages, open the dialog Language<br />
again. In the option field beyond Language now you can choose between german and<br />
english (for the example described above).<br />
Dynamic texts allow to switch between different text versions for a visualization elements. <strong>The</strong><br />
text version is controlled by a Prefix-ID-combination, which is assigned to the text in a XML-file<br />
and which can be defined by a project variable (see chapter 2.5.2)<br />
'Extras' 'Select Background Bitmap'<br />
Use this command to open the dialog box for selecting files. Select a file with the extension "*.bmp".<br />
<strong>The</strong> selected bitmap will then appear as the background in your visualization.<br />
<strong>The</strong> bitmap can be removed with the command 'Extras' 'Clear Background Bitmap'.<br />
'Extras' 'Clear Background Bitmap'<br />
Use this command to remove the bitmap as the background for the current visualization.<br />
You can use the command 'Extras' 'Select Background Bitmap' to select a bitmap for the current<br />
visualization.<br />
'Extras' 'Keyboard usage'<br />
<strong>The</strong> use of hotkeys can optimize the pure keyboard operation of a visualization.<br />
In the configuration of a visualization object you can define hotkeys which will cause actions like<br />
visualization elements do. For example you could define that – if visualization 'xy' is active – in online<br />
mode the hotkey will stop the program, which also will happen as soon as element 'z' of<br />
visu 'xy' gets an input (by mouseclick or via touch screen).<br />
Anyway per default the keys will work in that way that in online mode<br />
each element of a visualization can be selected and activated.<br />
<strong>The</strong> dialog 'Keyboard usage: set possible keystrokes' can be called in the menu 'Extras' or in the<br />
context menu:<br />
Dialog 'Keyboard usage: set possible keystrokes'<br />
<strong>CoDeSys</strong> <strong>Visualization</strong> 2-41
<strong>Visualization</strong> Configuration<br />
In column Key a selection list offers the following keys to which an action can get assigned:<br />
VK_TAB<br />
VK_RETURN<br />
VK_SPACE<br />
VK_ESCAPE<br />
VK_INSERT<br />
VK_DELETE<br />
VK_HOME<br />
VK_END<br />
VK_PRIOR<br />
VK_NEXT<br />
Tab-Key<br />
Enter-Key<br />
Space-Key<br />
Esc-Key<br />
Insert-Key<br />
Delete-Key<br />
Pos1-Key<br />
Ende-Key<br />
Bild ()-Key<br />
Bild (↓)-Key<br />
VK_LEFT<br />
VK_RIGHT<br />
Arrow-Key (←)<br />
Arrow-Key (→)<br />
VK_UP Arrow-Key ()<br />
VK_DOWN<br />
Arrow-Key (↓)<br />
VK_F1-VK_F12 Function keys F1 to F12<br />
0-9 Keys 0 to 9<br />
A-Z<br />
VK_NUMPAD0<br />
-<br />
VK_NUMPAD9<br />
Keys A to Z<br />
Keys 0 to 9 of the numeric keypad<br />
VK_MULTIPLY Key* of the numeric keypad<br />
VK_ADD<br />
Key+ of the numeric keypad<br />
VK_SUBTRACT Key- of the numeric keypad<br />
VK_DIVIDE<br />
Key÷ of the numeric keypad<br />
In the columns Shift and Ctrl you can add the - and/or the -key to the already chosen<br />
key, so that a key combination will result.<br />
In column Action you define what should happen as soon as the key (combination) will be pressed.<br />
Select the desired action from the list and insert an appropriate expression. See in the following the<br />
available actions and valid expressions, corresponding to those which can be set in the configuration<br />
dialog of category 'Input':<br />
Action Meaning Expression<br />
Toggle Toggle variable Variable, e.g."plc_prg.tvar"<br />
Tap<br />
true<br />
Tap<br />
false<br />
Tap variable (set to<br />
TRUE)<br />
Tap variable (set to<br />
FALSE)<br />
Program variable, e.g. "plc_prg.svar"<br />
Program variable, e.g. "plc_prg.xvar"<br />
Zoom Zoom to Vis. Name of the visualization object to which you want to jump, e.g.<br />
"Visu1"<br />
2-42<br />
<strong>CoDeSys</strong> <strong>Visualization</strong>
2 - <strong>The</strong> <strong>Visualization</strong> Editor in <strong>CoDeSys</strong><br />
Exec Execute program Name of the executable file, e.g. "notepad C:\help.txt" (Notepad will<br />
start and open the file help.txt)<br />
Text<br />
Text input of variable<br />
'Textdisplay'<br />
Number of the element for which the text input is to be configured,<br />
e.g. "#2" (Display of element numbers can be switched on in<br />
'Extras' 'Settings'; also see 'Elementlist...')<br />
In column Expression you must enter – depending on the type of action – either a variable name, a<br />
INTERN-command, a visualization name of a text string, exactly like you would do in the configuration<br />
dialog of category 'Input' for the corresponding visualization element.<br />
Use button Add to add another empty line at the end of the table. Use the Delete button to remove<br />
the line where the cursor is positioned currently. OK resp. Cancel will save resp. not save the done<br />
settings and close the dialog.<br />
<strong>The</strong> keyboard usage can be configured separately for each visualization object. Thus the same key<br />
(combination) can start different actions in different visualization.<br />
Example:<br />
<strong>The</strong> following key configurations have been done for the visualizations VIS_1 and VIS_2:<br />
VIS_1:<br />
VIS_2:<br />
Shift Ctrl Action Key Expression<br />
x Toggle A PLC_PRG.automatic<br />
x Zoom Z VIS_2<br />
Shift Ctrl Action Key Expression<br />
Exec E INTERN LANGUAGE DEUTSCH<br />
x Zoom Z PLC_VISU<br />
If you now go online and set the focus to VIS_1, then pressing will cause that variable<br />
PLC_PRG.automatic will be toggled. will cause a jump from Visu1 to VIS_2.<br />
If VIS_2 is the active window, pressing key will cause that the language within the visualizatoin will switch<br />
to German. here will cause a jump to visualization PLC_VISU.<br />
2.5 Dynamic Texts<br />
2.5.1 Configuration<br />
You can control dynamically which text will be displayed in a visualization element in online<br />
mode by using prefix-ID-combinations, each pointing to another text defined in a XML-file (see<br />
chapter 2.5.2). Prefix and ID must be defined in the configuration dialogs of the visualization<br />
element, where the ID can be dynamically defined by using a project variable. <strong>The</strong> XML-file<br />
describing the assignment to a text, must be linked to the project. This is done in the<br />
visualization settings dialog.<br />
<strong>The</strong> XML-file must have a certain format, the particular texts are listed below the according<br />
Prefix-ID-combination and a language code is added. Thus the text display not only can switch<br />
between different contents but also between different languages. <strong>The</strong> desired language can be<br />
selected as described above for the Language file in the 'Settings' dialog, category 'Language':<br />
So in order to get a dynamic text display, the following entries have to be made in the different<br />
configuration dialogs of a visualization:<br />
1. Link the XML-file(s): Dialog 'Settings' category Language:<br />
Activate option Dynamic texts and press button Add, in order to link one or several XMLfiles,<br />
which are available on your system, to the project. <strong>The</strong> selected files will be listed in<br />
<strong>CoDeSys</strong> <strong>Visualization</strong> 2-43
Dynamic Texts<br />
the window below the button. Press button Delete if you want to remove a selected file from<br />
the list. If you want to get displayed just those visualization elements, for which a dynamic<br />
text replacement is done, then activate option Hide elements, if no text replacement took<br />
place.<br />
Selecting one of the language identifiers offered in the selection list at field Language will<br />
cause the display of that text versions (for the corresponding prefix-ID-combination) which<br />
are marked with that language identifier in the XML.-file.<br />
Configuration dialog Settings, category Language, for dynamic texts<br />
2. Define the ID in configuration dialog 'Variables' in field 'Textdisplay':<br />
Enter here a value (number) resp. a project variable which should define the ID of a text (as<br />
used in the XML-file).<br />
3. Define the text format in configuration dialog 'Text':<br />
In the Content field, insert a placeholder "%" at that position of the text, where<br />
you want to get displayed a dynamic text in online mode. Instead of "PREFIX" you can<br />
enter any desired string. See the description for the 'Text' configuration dialog.<br />
For each prefix-ID-combination, which is found in a linked XML-file, the assigned text will be displayed<br />
in the visualization element in online mode. If no appropriate entry is found, no replacement will be<br />
done.<br />
2.5.2 XML-File for Dynamic Texts<br />
For use of dynamic texts please see in chapter Fehler! Verweisquelle konnte nicht gefunden<br />
werden. the descripton of dialog 'Settings', category For a description how to use dynamic texts in the<br />
visualization see 'Settings', category Language. <strong>The</strong> basic file must be available in XML format (.xml). In this file texts are assigned to identifiers (which are a combination of a prefix and a ID),<br />
which can be entered in the configuration of a visualization element.<br />
<strong>The</strong> file lists all assignments in a list, which must follow the following format: <strong>The</strong> list must start with<br />
and end with .<br />
A text entry which is assigned to a Prefix-ID-combination must contain the following lines:<br />
2-44<br />
<strong>CoDeSys</strong> <strong>Visualization</strong>
2 - <strong>The</strong> <strong>Visualization</strong> Editor in <strong>CoDeSys</strong><br />
= " id=""<br />
]<br />
<br />
<br />
"PREFIX" corresponds to the used in the<br />
visualization element configuration (category Text); "ID"<br />
corresponds to the entry in category 'Variables',<br />
Textdisplay<br />
Use any string as an 'language' identifier (e.g. "english").<br />
This identifier will<br />
be displayed in the 'Settings' dialog , category Language<br />
of the visualization element<br />
in the selection list at 'Language'; instead of "TEXT"<br />
insert any text which then<br />
will be displayed instead of the above defined ID-prefixcombination<br />
in the visualization<br />
element.<br />
Abschluss der Definition<br />
For each prefix-ID-combination at least for 1 language a text entry must be available.<br />
e.g. in the file example shown below will indicate the start of the german version of a text,<br />
terminates the text.<br />
Dynamc texts on the one hand can serve to display Texts in different languages, but of course on<br />
the other hand they also can be used to change the content of a text (same language) display<br />
dynamically.<br />
Example:<br />
Define in PLC_PRG a variable ivar of type INT.<br />
Configure a visualization element as follows:<br />
Enter in category Text in the Content field: "Achtung, %"<br />
Enter in category Variables at Textdisplay: PLC_PRG.ivar<br />
Open dialog Settings, category Language: Activate option Dynamic texts, add the above<br />
shown file dynamictext1.xml, which you have available on your computer, to the file<br />
list.<br />
Go online with the project. Set the language in the visualization settings to "deu".<br />
Set PLC_PRG.ivar to 102. In the visualization element the following text should be<br />
displayed: "Fehlertext deutsch zu Prefix ABC Fehler 102". Set PLC_PRG.ivar to 101.<br />
<strong>The</strong> text should change to "Fehlertext deutsch zu Prefix ABC Fehler 102".<br />
(<strong>The</strong> change of language also could be managed by using the INTERN command 'LANGUAGE'<br />
by another visualization element.)<br />
<strong>CoDeSys</strong> <strong>Visualization</strong> 2-45
Calling up language-dependent Online Help via a visualization element<br />
Example: Part of an XML-Datei for dynamic texts:<br />
2.6 Calling up language-dependent Online Help via a visualization element<br />
<strong>The</strong> calling of a different Help file with a visualization element can be tied in with the language<br />
currently entered for the visualization. For this purpose, the command INTERN HELP must be entered<br />
for this element in the 'Configure element' dialog at the location 'Execute program', and a [Visu-<br />
Helpfiles] section must be present in the <strong>CoDeSys</strong> .ini file. Below this, the corresponding help files<br />
must be assigned to the languages available for selection in the visualization: e.g.:<br />
[Visu-Helpfiles]<br />
German=C:\PROGRAMME\HELP_D.HLP<br />
English=C:\PROGRAMME\HELP_E.HLP<br />
2.7 Placeholder Concept<br />
At each location in the configuration dialog at which variables or text are entered, a placeholder can<br />
be set in place of the respective variable or text. This makes sense if the visualization object is not to<br />
be used directly in the program, but is created to be inserted in other visualization objects as an<br />
"instance". When configuring such an Instance, the placeholders can be replaced with variable<br />
names or with text.<br />
2-46<br />
<strong>CoDeSys</strong> <strong>Visualization</strong>
2 - <strong>The</strong> <strong>Visualization</strong> Editor in <strong>CoDeSys</strong><br />
See in chapter 2.4.2 the paragraph describing the configuration of a visualization which has been<br />
inserted in another visualization. <strong>The</strong>re you also find an example of how to use placeholders.<br />
Any string enclosed in two dollar signs ($) is a valid placeholder (e.g. $variable1$, variable$x$). For<br />
each placeholder a „value group" can be defined as an input specification in the 'Placeholder list'<br />
dialog (called from 'Extras' 'Placeholder list'). With one of these values you can replace the<br />
placeholder when configuring an instance of the visualization object. A placeholder list will be<br />
available in the instance to do this replacements.<br />
'Extras' 'List of Placeholders...'<br />
This list is used at two places in <strong>CoDeSys</strong>: to manage placeholders and to configure them:<br />
• primarily you use the list when configuring a visualization object, which later should be inserted,<br />
which means instanced, in other visualization(s). For this reason you will use placeholders instead<br />
of or additonally to variables and strings in the configuration dialogs. You can open the dialog<br />
'Placeholders' by the command 'List of Placeholders' in the 'Extras' menu or in the context menu.<br />
<strong>The</strong> list shows three columns:<br />
Placeholder list for input of possible replacements for the placeholders<br />
• Column Placeholder will list all placeholders, which are currently used in the configuration of the<br />
visualization object. Column Element number shows the elements which contain a placeholder. In<br />
column Replacements you can enter one or several strings (text, variable, expression) which you<br />
want to get available later when replacing a placeholder during the configuration of an instance of<br />
the visualization object. <strong>The</strong> elements of the selection must be entered separated by commas. If no or an<br />
impossible replacement string is specified, then the placeholder can be replaced with any desired text later<br />
during the configuration of the visualization's reference.<br />
• later you use the list of placeholders when configuring an instance of the above mentioned<br />
visualization object, that means after this object has been inserted (as a 'reference') in another<br />
visualization by the command 'Insert' '<strong>Visualization</strong>'. For this purpose do the following to open the<br />
dialog: Select the inserted visualization, execute command 'Extras' 'Configure' and press button<br />
'Placeholders' in Category '<strong>Visualization</strong>'. In this case the dialog will only contain two columns:<br />
<strong>CoDeSys</strong> <strong>Visualization</strong> 2-47
<strong>Visualization</strong> in Online Mode...<br />
List of placeholders for replacing a placeholder in a visualization instance<br />
• Column Placeholder – like described above – shows all placeholders which have been defined for<br />
the primary visualization object. If additionally a selection of possible replacements had been<br />
defined, this list will now be available in column 'Replacement'. Select one of the entries to replace<br />
the placeholder in the present instance. If no replacements have been pre-defined then you can<br />
manually enter an expression or variable. For this purpose perform a mouse-click on the field in<br />
column Replacement to open an editor field.<br />
2.8 <strong>Visualization</strong> in Online Mode...<br />
Regard the following items concerning a visualization in online mode:<br />
• Order of evaluation:<br />
- Dynamically defined element properties (by variables) will overwrite the (static) base settings<br />
defined by options in the configuration dialogs.<br />
- If an element property is defined by a "normal" project variable as well as by the component of<br />
a structure variable (Programability), then primarily the value of the project variable will be<br />
regarded.<br />
- A visualization can be configured in that way that in online mode it can be operated solely by<br />
inputs via keyboard. This is an important feature especially for using the visualization with<br />
<strong>CoDeSys</strong> HMI, as Target- or as Web-<strong>Visualization</strong>.<br />
• <strong>The</strong> configuration settings for Display, Frame and Language can also be edited in online mode.<br />
• As long as a visualization "reference" is not configured explicitely, the particular elements of the<br />
reference in online mode will react on inputs like those of the original visualization ("mother" of the<br />
references).<br />
• When you switch the language ('Extras' 'Settings') this will only effect the display in online mode.<br />
• A visualization can be printed in online mode.<br />
Operation over the keyboard - in online mode<br />
In order to get independent from the mouse or a touch screen, it is useful to configure a visualization<br />
in a way that allows pure keyboard operation:<br />
Per default the following key (combinations) will work in online mode anyway (no special configuration<br />
necessary):<br />
Pressing the key selects the first element in the element list for which an input is<br />
configured. Each subsequent pressing of the key moves one to the next element in the list. Pressing<br />
the key while keeping the key depressed selects the previous element.<br />
<strong>The</strong> arrow keys can be used to change from a selected element to a neighbouring one in any<br />
direction.<br />
2-48<br />
<strong>CoDeSys</strong> <strong>Visualization</strong>
2 - <strong>The</strong> <strong>Visualization</strong> Editor in <strong>CoDeSys</strong><br />
<strong>The</strong> is used to execute an activity on the selected visualization element. If the element<br />
is one which has a text output variable, a text input field will be opened which displays the text<br />
contents of the variable. Pressing the key writes in this value.<br />
Additional key (combinations) for the online operation can be defined in the configuration dialog<br />
'Keyboard usage'. <strong>The</strong>re also the keys , and can get assigned another<br />
functions than the above described standards.<br />
<strong>The</strong> individual elements of references behave in Online mode identically to the corresponding ones in<br />
the visualization that is referenced. <strong>The</strong>y will therefore react the same way as individual elements to<br />
inputs and operation by mouse and keyboard; the display of tooltips in references is also elementdependent.<br />
When processing the element list, as for instance when jumping from one input element to<br />
the next using the tabulator, the processing of all individual elements of a reference proceeds from the<br />
location of the reference in the element list before jumping to the next element of the list.<br />
Note:<br />
Operation over the keyboard in online mode is of greatest significance, if the visualization should be<br />
used with <strong>CoDeSys</strong> HMI resp. as Target-<strong>Visualization</strong> or Web-<strong>Visualization</strong> !<br />
'File' 'Print' in online mode<br />
'File' 'Print'is used to print out the contents of the visualization window in online mode. <strong>Visualization</strong>s<br />
which stretch over the border of the window can lead to inconsistencies particularly when there are<br />
moving elements in the visualization.<br />
2.9 <strong>Visualization</strong>s in libraries...<br />
<strong>Visualization</strong>s can also be stored in libraries and thus be made available to projects in the form of<br />
library POUs. <strong>The</strong>y can be inserted as references or they can be called up via the command „Zoom to<br />
vis." in the input configuration of another visualization which is part of the project.<br />
Note:<br />
<strong>Visualization</strong>s used in a project must have unique names. It can be problematic if for instance a<br />
visualization from a library is called or referenced which has the same name as one present in the<br />
project. Because, in processing references or visualization calls in the program, first the visualizations<br />
in the project, and only thereafter the ones in the loaded libraries will be implemented.<br />
<strong>CoDeSys</strong> <strong>Visualization</strong> 2-49
3 - <strong>CoDeSys</strong> HMI<br />
3 <strong>CoDeSys</strong> HMI<br />
<strong>CoDeSys</strong> HMI is the run time system needed for the execution of the well known <strong>CoDeSys</strong><br />
visualisation. This system enables the user to create an inexpensive software for operating machines<br />
and plants using the visualisations generated in <strong>CoDeSys</strong>.<br />
<strong>CoDeSys</strong> HMI uses the already existent project file for the visualisation. Of course it is possible to<br />
protect the application program with a read-only protection. <strong>The</strong> masks then appear in the full-picture<br />
mode and merely the visualisation starting with the picture “PLC_VISU” is shown. All the other<br />
operational elements of <strong>CoDeSys</strong> like menus or the object organiser are not visible.<br />
By seamlessly integrating the development platform for the visualisation masks into the PLC<br />
programming system <strong>CoDeSys</strong> HMI offers advantages other visualisations simply cannot come up to:<br />
• A tag list of the variables to be used is not needed. It is possible to work directly with the <strong>CoDeSys</strong><br />
variables.<br />
• Variable values in input fields can be modified by expressions (e.g. “Variable1+ Variable2 * 12 +<br />
5”)<br />
• A mighty place-holder concept allows the user to create object-oriented masks. This means the<br />
user can build modules similar to the <strong>CoDeSys</strong> function blocks in the visualisation.<br />
<strong>The</strong> <strong>CoDeSys</strong> functions “Sampling Trace“ and “read/write recipe“ are also available in <strong>CoDeSys</strong> HMI.<br />
3.1 Installation, Start and Operating<br />
A setup is available for the installation of the full version of <strong>CoDeSys</strong> HMI. A time limited demo version<br />
can be installed with the setup of the <strong>CoDeSys</strong> programming system.<br />
<strong>CoDeSys</strong> HMI (<strong>CoDeSys</strong>HMI.exe) is started by a command line:<br />
In each case at least the desired <strong>CoDeSys</strong> project has to be given in the command line. If no further<br />
parameters are set there, <strong>CoDeSys</strong> HMI automatically will start with a visualization POU named<br />
PLC_VISU (if existant in the project) and on that target or simulation mode, which was set when the<br />
project had been saved last.<br />
Additionally as well the known command line and command file commands (see User Manual for<br />
<strong>CoDeSys</strong>) as the following special parameters can be used:<br />
"/simulation" resp. "/target"<br />
/visu <br />
/visudownload<br />
Per default it will be started in that mode which was set when the<br />
project was saved last. Using the parameter "/simulation" resp.<br />
"/target" in the command line it can be set explicitely whether the<br />
project should run in simulation mode or on the target.<br />
If the project contains a visualization POU named PLC_VISU, it<br />
will start automatically with this one. If another POU should be the<br />
entrance, it has to be set in the command line with "/visu ".<br />
Overrides the download lock:<br />
If the user tries to log in with a project, which is different to that on<br />
the PLC, per default a download of the new project (dialog) can<br />
be initiated. If however there is an entry "visudownload=no" in the<br />
codesys.ini file, then no download is possible. This lock can be<br />
overridden by the command line parameter "/visudownload".<br />
Example for a command line:<br />
D:\PROGRAMME \<strong>CoDeSys</strong>HMI /simulation D:\PROJECTS\PROJECT.PRO /visu overview<br />
<strong>The</strong> project project.pro will start in simulation mode and with the visualization POU 'overview'.<br />
Please regard: Paths containing spaces must be bordered by quotation marks (").<br />
<strong>CoDeSys</strong> <strong>Visualization</strong> 3-1
Installation, Start and Operating<br />
<strong>The</strong> project will start in full screen mode with the entrance POU.<br />
<strong>CoDeSys</strong> HMI can be operated corresponding to the functions of the visualization elements via<br />
keyboard and mouse.<br />
If there is no visualization element configured with a corresponding function, <strong>CoDeSys</strong> HMI at any<br />
time can be terminated by pressing .<br />
3-2<br />
<strong>CoDeSys</strong> <strong>Visualization</strong>
4 - Web-<strong>Visualization</strong><br />
4 Web-<strong>Visualization</strong><br />
<strong>The</strong> Web-<strong>Visualization</strong> is a target specific application of a <strong>CoDeSys</strong> visualization.<br />
<strong>CoDeSys</strong> can create XML descriptions of the visualization objects and download them to the PLC.<br />
<strong>The</strong>re a Web-Server will provide the PLC data in XML format too and thus can create a continuosly<br />
updated visualization which can be opened in the Web Browser of any computer which is connected<br />
via Internet, independently from the target platform (e.g. useful for remote maintenance purposes).<br />
Please regard: Due to the low tranfer rates of the Internet only about 100 variables per visualization window can<br />
be monitored.<br />
4.1 Preconditions<br />
• the target system must support the functionality; that means that in the target settings the option<br />
'Web-<strong>Visualization</strong>' must be activated. If defined in the target file, this can be done by the user in<br />
the 'General' target settings.<br />
• A WebServer must be started. (see below)<br />
• In order to get the Web-<strong>Visualization</strong> displayed on a computer, a Web-Browser (IE-Explorer oder<br />
Netscape) is required.<br />
• Operating system: Windows NT/2000, Windows CE, Linux, RTE<br />
4.2 Editing the WebVisu.htm file<br />
During <strong>CoDeSys</strong> installation the file WebVisu.htm (base-HTML-page for the Web-<strong>Visualization</strong>) gets<br />
copied to the subdirectory "visu" in the installation directory. <strong>The</strong> page can get edited there, before it<br />
gets downloaded to the target system together with the Web-<strong>Visualization</strong> project:<br />
If webvisu.htm is opened in a text editor, it shows the following structure::<br />
<br />
<br />
Applet HTML Page<br />
<br />
<br />
<strong>CoDeSys</strong> <strong>Visualization</strong> 4-1
Preparing a Web-<strong>Visualization</strong> in <strong>CoDeSys</strong><br />
<br />
<br />
<br />
<br />
<br />
<br />
<br />
<strong>The</strong> following parameters can be set to control the behaviour of the Web-<strong>Visualization</strong>:<br />
• STARTVISU - Definition of the start POU (Default: PLC_VISU)<br />
• UPDATETIME - Definition of the monitoring interval (msec)<br />
• USECURRENTVISU - Definition whether an automatic change to another visualization will be<br />
done, as soon as the system variable 'CurrentVisu' is changed by the PLC program.<br />
• <strong>The</strong> parameters „width“ and „heigth“ define the size of the screen (Regard the possibility to make<br />
visible this size already during creating a visualization in <strong>CoDeSys</strong>).<br />
4.3 Preparing a Web-<strong>Visualization</strong> in <strong>CoDeSys</strong><br />
• Create the visualization(s) for your PLC program as usual in the <strong>CoDeSys</strong> programming system. If<br />
you want a certain visualization to be called as starting object, then name it 'PLC_VISU'. It will be<br />
loaded automatically as soon as the visualization is called via the Internet.<br />
• For visualization objects, which should not be part of the web version of the visualization,<br />
deactivate option Web-<strong>Visualization</strong>' in the dialog 'Object' 'Properties' in category '<strong>Visualization</strong>'.<br />
• Perform command 'Project' 'Clean all', then 'Project' 'Build'.<br />
• Log in to the target system ('Project' 'Online' 'Login') and start the project on the PLC.<br />
4.4 Configuration and Start of the Web Server<br />
• <strong>The</strong> WebServer must be available as an appropriate executable file (*.exe) for the used target<br />
system.<br />
• <strong>The</strong> configuration of the server can be done by a configuration file or by parameters added in the<br />
command line when calling the server-exe. <strong>The</strong> definitions given by a configuration file will<br />
overwrite those of the command line.<br />
<strong>The</strong> possible parameters:<br />
webserver-port-nr<br />
Port, on which the WebServer expects<br />
requests of the client (Web-Browser)<br />
Default: 80<br />
target -port-nr Port of the runtime system Default: 1200<br />
target -ip-address IP-Address of the runtime system Default: localhost<br />
use-file-upload-dir<br />
If this flag is set to TRUE, additionally<br />
the file-upload-directory (see below, fileupload-dir)<br />
must be defined, where the<br />
*.xml, *.bmp, *.jpg, etc. files of the<br />
Web-Visualzation are stored on the<br />
target system and from where they are<br />
uploaded to the browser.<br />
Default:false<br />
file-upload-dir Directory for the Web-<strong>Visualization</strong> files Default:“”<br />
4-2<br />
<strong>CoDeSys</strong> <strong>Visualization</strong>
4 - Web-<strong>Visualization</strong><br />
Please regard: If you define a "file-upload" directory, where the controller can store the visualization download<br />
files, then the visualization files will be automatically updated at each download. <strong>The</strong> advantage of<br />
this upload-directory is that the controller is not involved and thus not strained. <strong>The</strong> Web Server gets<br />
the files directly from the directory and by this the data transfer is much quicker. This is es pecially of<br />
impact in case of a big amount of data.<br />
A configuration file for the Web Server must be available in XML-format and it must be named<br />
"webserver_conf.xml". It must be found in the directory where the webserver-exe is. If no<br />
configuration file is available, the above mentioned default settings will be used (if not changed by<br />
parameters added to the call of the server in a command line.)<br />
An example configuration in the webserver_conf.xml file could look as follows:<br />
<br />
8080 <br />
1200 <br />
localhost <br />
true <br />
C:\Programme\<strong>CoDeSys</strong>V23 <br />
<br />
A call in a command line must use the following syntax:<br />
WebServer [webserver-Port-nr] [target-port-nr] [target-IP-address] | [file-uploaddir]<br />
Thus a call corresponding to the above shown configuration example would look like follows:<br />
> webserver 8080 1200 localhost c:\Programme\<strong>CoDeSys</strong>V23<br />
Please regard: <strong>The</strong> parameter settings in the command line are without any effect, if there is a valid configuration<br />
file available.<br />
4.5 Calling a Web-<strong>Visualization</strong> via Internet<br />
• Insert the following address in the Browser:<br />
http://:/webvisu.htm<br />
• WebVisu is the default HTML-file. It contains a tag which will start the WebVisu-Applet.<br />
<strong>CoDeSys</strong> <strong>Visualization</strong> 4-3
5 - Target-<strong>Visualization</strong><br />
5 Target-<strong>Visualization</strong><br />
<strong>The</strong> Target-<strong>Visualization</strong> is one of the possible ways to use a <strong>CoDeSys</strong> <strong>Visualization</strong>. <strong>CoDeSys</strong> can<br />
create ST code (Structured Text) for the visualization objects of a project. This code can be<br />
downloaded to the PLC together with the normal project code.<br />
Thus, if it is supported by the target system and if an appropriate monitor is available, the visualization<br />
can be started directly on the PLC computer. It is not necessary any longer that the programming<br />
system is running in order to run the visualization. This means a considerable reduction of storage<br />
use.<br />
5.1.1 Preconditions<br />
• <strong>The</strong> target system must support the functionality; that means that in the target settings the option<br />
'Target -<strong>Visualization</strong>' must be activated. If defined in the target file, this can be done by the user in<br />
the 'General' target settings.<br />
• <strong>The</strong> library SysLibTargetVisu.lib (external) is required for implementing the visualization functions<br />
in the runtime system. It will be linked to the project as soon as the option 'Target-<strong>Visualization</strong>' is<br />
activated in the target settings. In the runtime system the SysLibTargetVisu.lib also must be<br />
implemented.<br />
• Operating system of the PLC computer: Windows NT/2000, Windows CE<br />
• <strong>The</strong> PLC computer needs devices for displaying and operating the visualization (monitor, keyboard<br />
etc.)<br />
5.1.2 Creating a Target-visualization<br />
1. Create a visualization in <strong>CoDeSys</strong>. In order to optimize the performance of the visualization, put as<br />
many elements, which are static (no movement, no dynamic texts, no dynamic color changes), to<br />
the back. Hint: Using 'Extras' 'Elementlist' several or all elements can be "Sent to back" or "Sent to<br />
front" in a single blow. (Explanation: All static elements only once will be drawn to a background<br />
bitmap. Thus the cyclic repaint time will be reduced. This will be profitable especially for complex<br />
polygons or bitmaps.)<br />
If there is a visualization object PLC_VISU, the Target-<strong>Visualization</strong> later will be started with this<br />
object. Otherwise it will start with that object which is the first one in the list of visualization objects<br />
in the Object Organizer.<br />
Please regard: For target computers running with Windows NT/2000, Windows CE the bitmaps of the<br />
visualization will be transferred as files.<br />
2. For each visualization object, which should not be part of the Target-<strong>Visualization</strong>, deactivate the<br />
option 'Target-<strong>Visualization</strong>' in the Object Properties dialog ('Project' 'Object' 'Properties') in<br />
category '<strong>Visualization</strong>'.<br />
3. Make sure that the option 'Optimized jumps' is deactivated in the target settings (Target Platform).<br />
4. A project which is intended to be used with the Target -<strong>Visualization</strong>, must be controlled by a task<br />
configuration. If the option 'Target-<strong>Visualization</strong>' is activated in the target settings, then you there<br />
also can define whether two or only one task should be created automatically in the task<br />
configuration. It is recommended to use two tasks (see below), but this is not possible with all types<br />
of target systems. <strong>The</strong> tasks: VISU_INPUT_TASK will do the processing of the user inputs,<br />
VISU_TASK will do the redrawing (update) of the visualization elements. See the default settings<br />
of the tasks in the example which is shown at the end of the paragraph. Of course the parameters<br />
can be modified. But: VISU_INPUT_TASK always should be processed before VISU_TASK in<br />
order to guarantee a useful interaction of user inputs and update of the visualization. That task,<br />
which calls the main program (e.g. PLC_PRG), should at least be processed as often as<br />
VISU_INPUT_TASK, ideally even with a higher priority, but it also could be added directly to<br />
VISU_INPUT_TASK.<br />
<strong>CoDeSys</strong> <strong>Visualization</strong> 5-1
Calling a Web-<strong>Visualization</strong> via Internet<br />
5. Load the project into the controller ('Online' 'Login')<br />
5.1.3 Starting the Target-<strong>Visualization</strong><br />
Start the loaded project on the PLC. Hereupon the visualization will start with the PLC_VISU<br />
object resp. – if no PLC_VISU is available – with that visualization object which is the last<br />
one in the list of visualization objects in the Object Organizer.<br />
5-2<br />
<strong>CoDeSys</strong> <strong>Visualization</strong>
6 - Index<br />
6 Index<br />
A<br />
Access rights in <strong>Visualization</strong> 2-22<br />
Align 2-9<br />
Angle 2-12<br />
B<br />
Bar Display 2-7<br />
Bar Display in <strong>Visualization</strong> 2-32<br />
Bitmap 2-6<br />
Bitmap in <strong>Visualization</strong> 2-34<br />
Button 2-6<br />
C<br />
Clear Background Bitmap 2-41<br />
<strong>CoDeSys</strong> HMI<br />
Special configuration possibilities in Visualisation<br />
2-37<br />
<strong>CoDeSys</strong> HMI 2-37<br />
Color Variables in <strong>Visualization</strong> 2-17<br />
Colors in <strong>Visualization</strong> 2-16<br />
Configuration of a Web-Server 4-2<br />
Create <strong>Visualization</strong> 2-4<br />
Curve 2-5<br />
D<br />
DEFINERECEIPT 2-37<br />
Display in visualization 2-39<br />
Dynamic texts 2-39<br />
E<br />
Element list 2-9<br />
Ellipse 2-5<br />
EXITPROGRAM 2-37<br />
Extras<br />
Select 2-8<br />
Extras Align 2-9<br />
Extras Clear Background Bitmap 2-41<br />
Extras Configure<br />
Extras Menu\Keyboard Usage 2-41<br />
Extras Configure 2-11<br />
Extras Element list 2-9<br />
Extras Placeholder list 2-47<br />
Extras Select All 2-8<br />
Extras Select Background Bitmap 2-41<br />
Extras Send to Back 2-9<br />
Extras Send to Front 2-9<br />
Extras Settings 2-39<br />
F<br />
File Print in online mode 2-49<br />
Frame 2-39<br />
G<br />
Grid 2-39<br />
Grouping elements in <strong>Visualization</strong> 2-8<br />
H<br />
HELP 2-37<br />
Histogram 2-7<br />
Histogram in <strong>Visualization</strong> 2-33<br />
Input 2-21<br />
Insert Bar Display 2-7<br />
Insert 'Bitmap' 2-6<br />
Insert Button 2-6<br />
Insert Curve 2-5<br />
Insert Ellipse 2-5<br />
Insert Histogram 2-7<br />
Insert Menu<br />
Rounded Rectangle 2-4<br />
Table 2-6<br />
Insert Meter 2-7<br />
Insert Pie 2-5<br />
Insert Polygon 2-5<br />
Insert Polyline 2-5<br />
Insert Rectangle 2-4<br />
Insert Rounded Rectangle 2-5<br />
Insert Table 2-6<br />
Insert <strong>Visualization</strong> 2-6<br />
Insert visualization elements<br />
Rectangle 2-4<br />
Insert WMF file 2-6<br />
I<br />
K<br />
Keyboard usage in <strong>Visualization</strong> 2-41<br />
L<br />
LANGUAGE 2-37<br />
Language in visualization 2-39<br />
Line width in <strong>Visualization</strong> 2-16<br />
LOADWATCH 2-37<br />
M<br />
Menu Extras<br />
Align 2-9<br />
Clear Background Bitmap 2-41<br />
Configure 2-11<br />
Element list 2-9<br />
Placeholder list 2-47<br />
Select All 2-8<br />
Select Background Bitmap 2-41<br />
Send to Back 2-9<br />
Send to Front 2-9<br />
Settings 2-39<br />
Menu Insert<br />
Bar Display 2-7<br />
Bitmap 2-4, 2-6<br />
Button 2-4, 2-6<br />
Curve 2-5<br />
Ellipse 2-4, 2-5<br />
Histogram 2-7<br />
Meta file 2-6<br />
Meter 2-7<br />
Pie 2-5<br />
<strong>CoDeSys</strong> <strong>Visualization</strong> 3
Calling a Web-<strong>Visualization</strong> via Internet<br />
Polygon 2-4, 2-5<br />
Polyline 2-5<br />
Rectangle 2-4<br />
Rounded Rectangle 2-5<br />
<strong>Visualization</strong> 2-4, 2-6<br />
WMF file 2-6<br />
Meter 2-7<br />
Meter element in <strong>Visualization</strong> 2-30<br />
Motion absolute in <strong>Visualization</strong> 2-18<br />
Motion relative in <strong>Visualization</strong> 2-19<br />
Online Mode<br />
<strong>Visualization</strong> 2-48<br />
Online Mode 2-48<br />
Operating version 2-37<br />
Pie 2-5<br />
Placeholder 2-11<br />
Placeholder List 2-47<br />
PLC_VISU 4-2<br />
Polygon 2-5<br />
Polyline 2-5<br />
PRINT 2-37<br />
Programmability 2-23<br />
Rectangle 2-4<br />
Reference 2-11<br />
Rounded Rectangle 2-5<br />
O<br />
P<br />
R<br />
S<br />
SAVEWATCH 2-37<br />
Security in Visualiszation 2-22<br />
Select Background Bitmap 2-41<br />
Selecting elements in Visualiziation 2-8<br />
Send to Back 2-9<br />
Send to Front 2-9<br />
Settings in visualization 2-39<br />
Shape 2-12<br />
Status bar 2-10<br />
SysLibTargetVisu.lib 5-1<br />
T<br />
Table 2-6<br />
Table element configuration 2-26<br />
Target-<strong>Visualization</strong> 5-1<br />
Text 2-13<br />
Text in <strong>Visualization</strong> 2-13<br />
Textvariables in <strong>Visualization</strong> 2-15<br />
ToolTip in <strong>Visualization</strong> 2-22<br />
TRACE 2-37<br />
Translation file<br />
<strong>Visualization</strong> texts 2-13<br />
Variables in <strong>Visualization</strong> 2-20<br />
Visualisation<br />
Input possibilities for <strong>CoDeSys</strong> HMI 2-37<br />
Visualisierung<br />
V<br />
Access rights 2-22<br />
Angle 2-12<br />
Security 2-22<br />
<strong>Visualization</strong><br />
Align 2-9<br />
Bar Display element 2-32<br />
Bitmap 2-34<br />
Changing the Selection and Insert Mode 2-8<br />
Clear Background Bitmap 2-41<br />
Color Variables 2-17<br />
Configure Colors 2-16<br />
Configure Input 2-21<br />
Configure Line width 2-16<br />
Configure Meter 2-30<br />
Configure Motion absolute 2-18<br />
Configure Motion relative 2-19<br />
Configure Shape 2-12<br />
Configure Text 2-13<br />
Configuring a <strong>Visualization</strong> - Overview 2-10<br />
Copying <strong>Visualization</strong> Elements 2-8<br />
Create 2-4<br />
Display 2-39<br />
Dragging <strong>Visualization</strong> Elements 2-8<br />
Editor 2-3<br />
Element list 2-9<br />
Execute program 2-21<br />
File – Print in online mode 2-49<br />
Frame 2-39<br />
Grid 2-39<br />
Grouping elements 2-8<br />
Histogram 2-33<br />
in libraries 2-49<br />
Insert Bar Display 2-7<br />
Insert Histogram 2-7<br />
Insert Meter 2-7<br />
Insert Pie 2-5<br />
Insert Table 2-6<br />
Insert WMF file 2-6<br />
Keyboard usage 2-41<br />
Language 2-39<br />
Modifying <strong>Visualization</strong> Elements 2-8<br />
Online Mode 2-48<br />
Operation over the keyboard in online mode 2-<br />
48<br />
Placeholder 2-11<br />
Programmability 2-23<br />
Reference 2-11<br />
Select 2-8<br />
Select All 2-8<br />
Select Background Bitmap 2-41<br />
Selecting <strong>Visualization</strong> Elements 2-7<br />
Send to Back 2-9<br />
Send to Front 2-9<br />
Status Bar 2-10<br />
Table 2-26<br />
Text input of variable 'Textdisplay' 2-21<br />
Textvariables 2-15<br />
Tip FALSE 2-21<br />
Tip variable 2-21<br />
Toggle variable 2-21<br />
Tooltip 2-22<br />
Variables 2-20<br />
<strong>Visualization</strong> Object<br />
Configure... 2-39<br />
<strong>Visualization</strong>\Settings 2-39<br />
Zoom to Vis. 2-21<br />
<strong>Visualization</strong> 2-10<br />
<strong>Visualization</strong> 2-21<br />
<strong>Visualization</strong> 2-41
Index<br />
<strong>Visualization</strong> as <strong>Visualization</strong> element 2-35<br />
<strong>Visualization</strong> Elements<br />
Configure 2-11<br />
<strong>Visualization</strong> Elements 2-4<br />
W<br />
Web Server<br />
Configuration and Start 4-2<br />
configuration file 4-2<br />
File upload directory 4-2<br />
WebVisu.htm 4-1<br />
Web-<strong>Visualization</strong><br />
PLC_VISU 4-2<br />
WebVisu.htm 4-1<br />
Web-<strong>Visualization</strong> 4-1<br />
WMF file 2-6<br />
WRITERECEIPT 2-37