reducing runoff losses or irrigation water by improving cultural ...
reducing runoff losses or irrigation water by improving cultural ...
reducing runoff losses or irrigation water by improving cultural ...

You also want an ePaper? Increase the reach of your titles
YUMPU automatically turns print PDFs into web optimized ePapers that Google loves.
REDUCING RUNOFF LOSSES OR IRRIGATION WATER BY IMPROVING CULTURAL<br />
PRACTICES<br />
Sowmya Mitra, Magdy Fam, Armen Malazian, Eudell Vis and Ramesh Kumar<br />
Department of Plant Science, Calif<strong>or</strong>nia State Polytechnic University, Pomona, CA 91768, Tel.:<br />
(909) 869 2989, fax: (909) 869 5036, e-mail: smitra@csupomona.edu<br />
Abstract<br />
Wetting agents are mainly used to manage <strong>water</strong> repellency in soils but they do provide other<br />
benefits like increase in <strong>water</strong> retention and reduction in physiological moisture stress in plants.<br />
Experiments were conducted at the Calif<strong>or</strong>nia State Polytechnic University, Pomona on a loamy<br />
sand soil situated on an 8% slope with an established turfgrass maintained under golf course<br />
fairway management conditions. The effect of <strong>cultural</strong> practices like c<strong>or</strong>e aerification followed<br />
<strong>by</strong> sand topdressing and application of a wetting agent in <strong>reducing</strong> <strong>runoff</strong> of <strong>irrigation</strong> <strong>water</strong> was<br />
evaluated. Runoff events after the <strong>cultural</strong> practices and the wetting agent treatment (Dispatch<br />
applied at 877 ml/ha) was repeated four times over a time period when the matric potential<br />
ranged from 15–40 kPa. An empirical f<strong>or</strong>mula based on H<strong>or</strong>ton’s equation was used to predict<br />
maximum runtime of sprinklers to prevent <strong>runoff</strong> from turf on slopes. Total <strong>irrigation</strong> <strong>runoff</strong> was<br />
calculated based on overspray, surface <strong>runoff</strong> and percolation <strong>or</strong> seepage over a specified period<br />
of time. When Dispatch was added to the <strong>irrigation</strong> <strong>water</strong> vertical movement of <strong>water</strong> was m<strong>or</strong>e<br />
pronounced than the control (<strong>water</strong> alone). The least <strong>runoff</strong> occurred when the soil had the<br />
highest matric potential. Dispatch treatments resulted in 43% and 55% higher total wetting<br />
surface area at 30 minutes and 60 minutes respectively compared to the <strong>water</strong> alone treatment.<br />
Cultural practices like c<strong>or</strong>e aerification, topdressing with sand and using a wetting agent reduced<br />
23 1
the volume of surface <strong>runoff</strong> <strong>by</strong> increasing the infiltration rate and the time period when visible<br />
surface <strong>runoff</strong> was first observed since the start of the <strong>irrigation</strong> event.<br />
Key w<strong>or</strong>ds: infiltration, <strong>runoff</strong>, wetting agent, aerification, topdressing<br />
Introduction<br />
The rate at which a particular soil can abs<strong>or</strong>b <strong>water</strong> is called the infiltration rate (IR). The<br />
infiltration rate depends on the soil texture, <strong>or</strong>ganic matter content, soil moisture content,<br />
compaction and other <strong>cultural</strong> practices which can affect soil physical properties. The rate at<br />
which an over-head sprinkler system applies <strong>water</strong> is called the precipitation rate (PR) of the<br />
sprinkler. The PR is calculated based on the total volume of <strong>water</strong> applied over a period of time<br />
at a specified pressure using a particular type of nozzle. If the PR is m<strong>or</strong>e than the IR f<strong>or</strong> a<br />
particular soil some of the applied <strong>irrigation</strong> <strong>water</strong> will collect on the surface creating a potential<br />
f<strong>or</strong> <strong>runoff</strong>. Runoff of <strong>irrigation</strong> <strong>water</strong> is not only a wastage of <strong>water</strong> but also leads to soil erosion<br />
and is a source of pollution since it can carry excess fertilizer, pesticides and other contaminants.<br />
Since <strong>runoff</strong> is closely related to IR several researchers have developed mathematical models to<br />
predict the infiltration capacity into the soil as a function of time. The most popular equation was<br />
developed <strong>by</strong> H<strong>or</strong>ton (HORTON, 1939) which can be used to predict cumulative infiltration:<br />
where, f<br />
p<br />
(t) is infiltration rate in a given time (t), f<br />
c<br />
is final equilibrium infiltration rate, f<br />
0<br />
=<br />
(1)<br />
initial infiltration rate at time t = 0, t is elapsed time, and k is decay coefficient.<br />
H<strong>or</strong>ton’s equation assumes an infinite <strong>water</strong> supply rate at the surface, that is, it assumes<br />
saturated conditions at the soil surface. Hence the cumulative infiltration that would occur under<br />
24 2
conditions of unlimited <strong>water</strong> supply at the surface could be predicted using a modified f<strong>or</strong>m of<br />
H<strong>or</strong>ton’s equation (HORTON, 1940):<br />
(2)<br />
where, F(t) is the cumulative infiltration over time (t) since the start of infiltration. The actual<br />
infiltration rate is less than <strong>water</strong> supply rate when the sprinklers are turned on and the actual<br />
infiltration rate does not decay as predicted <strong>by</strong> H<strong>or</strong>ton's equation. This is because H<strong>or</strong>ton's<br />
equation assumes that the supply rate exceeds the infiltration rate from the start of infiltration.<br />
Theref<strong>or</strong>e, in <strong>or</strong>der to determine the true infiltration rate at a given time we need to solve the<br />
following equation to first determine the time t p , the time at which <strong>water</strong> is starting to<br />
accumulate at the soil surface - (ponding time) and then evaluate f p (t p );<br />
(3)<br />
where, F(t) is the cumulative infiltration over time (t) since the start of infiltration and i(t) is the<br />
infiltration rate. Equation 3 represents the accumulated volume of actually infiltrated <strong>water</strong>; up to<br />
time t p (ponding time) if the actual rate of infiltration had been equal to the infiltration capacity.<br />
These equations were modified <strong>by</strong> researchers to develop a practical equation based on a<br />
series of maximum sprinkler <strong>irrigation</strong> runtime curves f<strong>or</strong> different sprinkler precipitation rates<br />
vs. soil types to maximize the sprinkler application efficiency and conserve <strong>water</strong> (HUNG &<br />
KRINIK, 1995). However, it is necessary to develop different infiltration capacity data f<strong>or</strong> various<br />
types of soil so that the equation can be applied in the field. The United States Department of<br />
Agriculture-National Resource Conservation Service (USDA-NRCS) published a series of<br />
infiltration data f<strong>or</strong> several soil families (CUENCA, 1989). An equation f<strong>or</strong> determining the<br />
25 3
maximum sprinkler <strong>irrigation</strong> runtime in <strong>or</strong>der to reduce <strong>runoff</strong> was developed <strong>by</strong> HUNG &<br />
KRINIK (1995). The following equation can be used to calculate maximum <strong>irrigation</strong> runtime:<br />
t max = {f o - P + f c [ln (f o - f c )/(P - f c )]} (4)<br />
Pb<br />
where, t max is maximum <strong>irrigation</strong> runtime without <strong>runoff</strong> (hours), P is average sprinkler<br />
precipitation rate, b is H<strong>or</strong>ton's constant, f o is initial infiltration rate at time t = 0, and f<br />
c<br />
is final<br />
equilibrium infiltration rate. In equation 4, the H<strong>or</strong>ton constant b can be obtained <strong>by</strong> solving<br />
H<strong>or</strong>ton's equation using the infiltration rate curves f<strong>or</strong> the particular soil textural class. The<br />
infiltration data obtained from the USDA-NRCS were based on 50% available soil <strong>water</strong><br />
depletion which has been used in <strong>irrigation</strong> applications in the United States f<strong>or</strong> almost a century.<br />
The relationship between infiltration rate and elapsed time in different soils has been rep<strong>or</strong>ted <strong>by</strong><br />
researchers (KOSTIAKOV, 1932; KUTILEK & NIELSEN, 1994.<br />
Wetting agents can wet hydrophobic surfaces and help carry <strong>or</strong> keep <strong>water</strong> available f<strong>or</strong><br />
turfgrass (RUITER, 2005). Furtherm<strong>or</strong>e, wetting agents reduce the surface tension of <strong>water</strong> and<br />
increase infiltration and percolation rates of root zones, which helps <strong>water</strong> to penetrate into soil<br />
and decreases moisture stress on turfgrasses (LEINAUER, 2002). M<strong>or</strong>eover, soil wetting agents are<br />
considered as a tool in turf management to improve <strong>irrigation</strong> efficiency and <strong>water</strong> conservation<br />
(KOSTKA et al., 2000). The objective of this research was to evaluate the effect of a wetting agent<br />
application on the wetting pattern, infiltration rate and <strong>runoff</strong> of <strong>irrigation</strong> <strong>water</strong>.<br />
Materials and methods<br />
Runoff collection<br />
Experiments were conducted at the Calif<strong>or</strong>nia State Polytechnic University, Pomona on a loamy<br />
sand soil with established hybrid bermudagrass (GN-1) turf maintained under fairway<br />
26 4
management conditions. The plot size was 0.03 hectare situated on an 8% slope. Runoff<br />
experiments were conducted over a matric potential range of 15–40 kPa in the soil to study the<br />
relationship between <strong>irrigation</strong> <strong>water</strong> <strong>runoff</strong> and matric potential. Based on the <strong>runoff</strong> experiment<br />
a matric potential range of 15–25 kPa was selected to further investigate the effect of the various<br />
treatments in <strong>reducing</strong> <strong>irrigation</strong> <strong>runoff</strong>. The treatments (<strong>cultural</strong> practice of aerification followed<br />
<strong>by</strong> topdressing with sand and the use of a wetting agent) were designed in a randomized block<br />
design with four replicates which were repeated over time under similar soil moisture conditions<br />
(15–25 kPa). Soil moisture sens<strong>or</strong>s (Watermark, Irrometer Co, Riverside, CA, U.S.A.) were<br />
buried in the soil at 10 and 20 cm from the soil surface. The sens<strong>or</strong>s measured the matric<br />
potential every 5 minutes bef<strong>or</strong>e and after the <strong>irrigation</strong> event till 24 hrs after each <strong>irrigation</strong><br />
event. The maximum <strong>irrigation</strong> runtime was calculated using the modified H<strong>or</strong>ton’s equation<br />
(equation 4, HUNG & KRINK, 1995). Extended <strong>irrigation</strong> runtimes were calculated to create<br />
<strong>runoff</strong>. Total <strong>runoff</strong> was monit<strong>or</strong>ed through surface <strong>runoff</strong> and subsurface seepage. The sum of<br />
surface <strong>runoff</strong> and surface flow <strong>or</strong> seepage of <strong>water</strong> till 1 h after the start of the <strong>irrigation</strong> event<br />
was rep<strong>or</strong>ted as total <strong>runoff</strong>. Surface <strong>runoff</strong> was measured <strong>by</strong> installing rain gutters which<br />
drained into a collection pit with a tipping bucket. The subsurface seepage was monit<strong>or</strong>ed<br />
through a collection bucket placed at the bottom of the collection pit. H<strong>or</strong>ton’s constant f<strong>or</strong><br />
loamy sand soil was used to calculate the maximum runtime f<strong>or</strong> sprinklers based on their<br />
precipitation rate (PR).<br />
Cultural practice<br />
Cultural practices like c<strong>or</strong>e aerification and top dressing with sand were done bef<strong>or</strong>e and after a<br />
set of <strong>runoff</strong> experiments. C<strong>or</strong>e aerification is a process of removing soil c<strong>or</strong>es from the soil to<br />
reduce compaction due to traffic on an established turfgrass surface in golf courses, sp<strong>or</strong>ts fields<br />
27 5
and landscapes to increase air and <strong>water</strong> movement in the soil profile. Aerification can be done<br />
with a solid tine when the soil c<strong>or</strong>es are not removed from the soil <strong>or</strong> <strong>by</strong> using hollow tines<br />
where the soil c<strong>or</strong>es are removed after the operation. The p<strong>or</strong>e spaces created <strong>by</strong> the solid tine<br />
after aerification can be filled in with sand to increase the p<strong>or</strong>osity of the soil. C<strong>or</strong>e aerification<br />
was done with a 10 cm hollow tine using a walk behind aerifier (John Deere Co, Moline, Illinois,<br />
U.S.A.). The c<strong>or</strong>es were picked up with a turf-vac and the turf was top dressed with sand.<br />
Wetting agent application<br />
A wetting agent (Dispatch applied at 877 ml/ha) was applied to the plots bef<strong>or</strong>e each of the four<br />
<strong>irrigation</strong> events. The <strong>cultural</strong> practice of aerification followed <strong>by</strong> topdressing with sand and the<br />
inc<strong>or</strong>p<strong>or</strong>ation of a wetting agent were two treatments in the experimental design which were<br />
repeated four times over a time period when the matric potential was 15-25 kPa. Runoff was<br />
monit<strong>or</strong>ed after each treatment f<strong>or</strong> all the four repeated <strong>irrigation</strong> events at the same site.<br />
Distribution unif<strong>or</strong>mity (DU)<br />
Fourty nine plastic cone shaped cans were placed on the plots in a grid pattern. Ring can-holders<br />
were used to place catch cans in upright position to avoid any can movement. The four cans in<br />
the c<strong>or</strong>ner of the plot were placed 1 m away from the sprinkler heads, while the others were<br />
placed approximately 2 m apart in a unif<strong>or</strong>m grid pattern throughout the plots. All the cans had a<br />
diameter of 11.5 cm, and a height of 15 cm. The sprinklers were run f<strong>or</strong> a total of 10 minutes f<strong>or</strong><br />
each plot, and the collected <strong>water</strong> in each catch can was rec<strong>or</strong>ded in milliliter (ml). Distribution<br />
unif<strong>or</strong>mity (DU) was calculated based on the low quartile distribution unif<strong>or</strong>mity (LQDU). The<br />
collected <strong>water</strong> reading in catch-cans was re-<strong>or</strong>dered from low to high. The lowest 25 percent of<br />
catch-can readings were averaged, and divided <strong>by</strong> the average of the overall can reading, and<br />
expressed in percentage.<br />
28 6
Percent of LQDU = Average catch in the low quartile x 100/Average catch overall (8)<br />
Infiltration rate<br />
The infiltration rate in the experimental area was measured with a double ring infiltrometer<br />
(Turf-Tec International, C<strong>or</strong>al Springs, Fl<strong>or</strong>ida, U.S.A.) at specified matric potential of 15–40<br />
kPa. Raw data of soil infiltration rates in a loamy sand soil was obtained from the USDA-NRCS<br />
and was compared to the infiltration tests in the experimental sites. The change in infiltration rate<br />
over a matric potential range of 15-25 kPa was plotted against the elapsed time (Fig. 1).<br />
Wetting area<br />
Experiments were conducted to study the wetting pattern of <strong>water</strong> with and without an added<br />
wetting agent in a plexiglass soil bin using the same soil as the field <strong>runoff</strong> experiment. The soil<br />
was loamy sand with a pH of 6.6, electrical conductivity (EC) of 1.8 dS/m and an <strong>or</strong>ganic matter<br />
content of 0.13%. Dispatch was added to the <strong>irrigation</strong> <strong>water</strong> at a rate of 877 ml/ha. Separate<br />
experiments were conducted using two drip emitters, one rated as 3.8 l/h and another at 1.9 l/h.<br />
The experiments were repeated four times. Actual flow rates were within 5% of the rated flow<br />
rates at the operation pressure (210 kPa). A micro tube of 45 cm length was attached to each<br />
emitter to facilitate the location of the emission point in the soil bin. The system was run f<strong>or</strong> 30<br />
minutes. A dye was not used in the experiment since the dry soil and the wet soil had contrasting<br />
col<strong>or</strong>s which could be easily seen through the plexiglass. Lines were drawn with a marker on the<br />
plexiglass to indicate the wetting pattern. Wetted areas measurements were taken at 15 and 30<br />
minutes. The 60 minute measurement was taken 30 minutes after the end of the run time (a total<br />
of 60 minutes from the beginning of the run time). Approximately 180 minutes after the<br />
beginning of the run time a cross section was made in the soil directly under the location of the<br />
emission point and perpendicular to the plexiglass in the front of the bin. The wetted areas were<br />
29 7
given in cm 2 and were calculated based on the shape of the wetted area <strong>or</strong> were measured with a<br />
planimeter.<br />
Statistical analysis<br />
The data was subjected to analysis of variance (ANOVA) program of SAS (SAS, 1988).<br />
Regression models were used to study the relationship f<strong>or</strong> continuous variables while mean<br />
separation techniques like protected least significant difference (LSD) test and Duncan New<br />
Multiple Range Test (DNMRT) (p = 0.05) were used to separate the means of discontinuous<br />
variables. Data f<strong>or</strong> treatments and interactions that were not significant at the p = 0.05 level were<br />
pooled to conduct an overall ANOVA analysis. The interactions that were significant were split<br />
and analyzed further using the proc glm program of SAS (SAS, 1988).<br />
Results and discussion<br />
Distribution unif<strong>or</strong>mity (DU)<br />
The low quartile distribution unif<strong>or</strong>mity (LQDU) ranged from 56% to 68% and the precipitation<br />
rate (PR) varied from 2 cm/h to 3 cm/h depending upon the wind direction and velocity during<br />
the <strong>runoff</strong> experiments. The mean matric potential between the different moisture sens<strong>or</strong>s ranged<br />
from 15–40 kPa. Least surface <strong>runoff</strong> occurred when the soil had the highest matric potential<br />
(Fig. 2). The wind direction and speed also influenced surface <strong>runoff</strong>; hence experiments were<br />
conducted at similar wind speeds. Wind speeds ranged f<strong>or</strong>m 4 to 6 km/h during the <strong>runoff</strong><br />
experiments.<br />
Infiltration rate<br />
The infiltration rate in a loamy sand soil was calculated based on raw data obtained from USDA-<br />
NRCS and then compared to the infiltration tests using a double ring infiltrometer. Cumulative<br />
30 8
infiltration f<strong>or</strong> the particular soil texture was obtained <strong>by</strong> the integration of the equation (3) f<strong>or</strong> a<br />
total elapsed time of 400 min. The infiltration rate f<strong>or</strong> a loamy sand soil was plotted in a graph<br />
against the elapsed time when the matric potential was 15-25 kPa (Fig 1). The infiltration rate in<br />
the loamy sand soil increased when a wetting agent (Dispatch) was applied on the turfgrass<br />
bef<strong>or</strong>e the <strong>runoff</strong> event compared to the untreated control plots. Highest infiltration rate was<br />
observed after the c<strong>or</strong>e aerification and topdressing program (Fig 3).<br />
Runoff<br />
A n<strong>or</strong>mal runtime f<strong>or</strong> the loamy sand soil f<strong>or</strong> a 15 cm root zone was 25 minutes to bring the root<br />
zone from 50% depletion to field capacity. A runtime of 60 minutes was used to ensure that<br />
<strong>runoff</strong> was observed f<strong>or</strong> the study; however the runtime had to be reduced to 40 minutes f<strong>or</strong><br />
several of the tests because the volume of <strong>runoff</strong> exceeded the <strong>runoff</strong> collection device capacity.<br />
The time from the beginning of the <strong>irrigation</strong> to the time f<strong>or</strong> surface <strong>water</strong> to be visible was<br />
rec<strong>or</strong>ded to compare with the T max as determined <strong>by</strong> equation 4. HUNG & KRINIK (1995) had<br />
rep<strong>or</strong>ted a maximum runtime approximately of 100 minutes using a H<strong>or</strong>ton constant of 2.48 f<strong>or</strong> a<br />
loamy sand soil on 6–8% slope (Table 1). The results from our infiltration tests using a double<br />
ring infiltrometer on the experimental area was used to calculate H<strong>or</strong>ton’s constant (Fig. 1).<br />
H<strong>or</strong>ton’s constant was found to be 5.89 in the loamy sand soil with an 8% slope. Modifying<br />
equation (4) with this H<strong>or</strong>ton’s constant resulted in a maximum <strong>irrigation</strong> runtime f<strong>or</strong> loamy sand<br />
soil as 42 minutes. The actual times f<strong>or</strong> surface <strong>water</strong> to be visible ranged from 15 to 29 minutes<br />
with a mean of 20 minutes in the untreated plots.<br />
On an average overall the wetting agent treated plots did not have any appreciable <strong>runoff</strong><br />
till 45 minutes of <strong>irrigation</strong> runtime while it took 60 minutes since initiating the <strong>irrigation</strong> event<br />
to observe any surface <strong>runoff</strong> after the aerficiation and topdressing with sand treatment was<br />
31 9
perf<strong>or</strong>med. The application of a wetting agent significantly reduced surface <strong>runoff</strong> of <strong>irrigation</strong><br />
<strong>water</strong> compared to the untreated check. The aerification followed <strong>by</strong> topdressing treatment<br />
resulted in the least surface <strong>runoff</strong> between all the treatments but the seepage <strong>losses</strong> were higher<br />
than the wetting agent treatments. Hence there was no statistical difference in the volume of total<br />
<strong>runoff</strong> between the wetting agent and aerification treatment (Fig. 4). The aerification program<br />
significantly reduced total <strong>runoff</strong> compared to the untreated control. The initial soil moisture<br />
levels affect the infiltration rate in soils and hence soil moisture would influence the length of<br />
time when first surface <strong>runoff</strong> would be observed (Fig. 2). These results from this research study<br />
would suggest that the H<strong>or</strong>ton’s equation over estimates the time bef<strong>or</strong>e <strong>runoff</strong> would begin.<br />
Wetting area<br />
Addition of a wetting agent (Dispatch) to <strong>water</strong> increased the vertical movement of <strong>water</strong><br />
compared to the <strong>water</strong> alone treatment in a loamy sand soil. The wetted soil surface area was<br />
determined <strong>by</strong> the contrast in col<strong>or</strong> between dry soil and wet soil. The wetted soil area in the<br />
h<strong>or</strong>izontal direction between the wetting agent treatment and <strong>water</strong> was not significantly<br />
different (Table 2). Dispatch treatments resulted in 43% and 55% higher total wetted surface area<br />
at 30 minutes and 60 minutes respectively compared to the <strong>water</strong> alone treatment (Table 2).<br />
Inc<strong>or</strong>p<strong>or</strong>ation of the wetting agent with <strong>water</strong> increased the vertical movement of <strong>water</strong> in the<br />
soil profile and the difference in wetted vertical soil surface between the wetting agent and the<br />
<strong>water</strong> alone treatment was m<strong>or</strong>e pronounced under unsaturated condition when the soil was dry.<br />
This difference during unsaturated condition may be pronounced since the moisture in soils is<br />
held at a higher tension <strong>or</strong> matric potential in a dry soil and the wetting agent may help in<br />
<strong>reducing</strong> the matric potential. Hence the addition of a wetting agent may facilitate movement of<br />
<strong>water</strong> in the vertical direction and increase the retention capacity of soil.<br />
10 32
References<br />
CUENCA, R.H. 1989. Irrigation System Design 71, Prentice Hall, New Jersey.<br />
HORTON, R.E. 1939. Analysis of <strong>runoff</strong> plot experiments with varying infiltration capacity.<br />
Trans. Am. Geoph. Union Part IV: 693-694.<br />
HORTON, R.E. 1940. An approach toward a physical interpretation of infiltration capacity. Soil<br />
Sci. Soc. Am. Proc. 5:399-417.<br />
HUNG, J.Y.T. & KRINIK, A. 1995. Maximum Run time F<strong>or</strong> Sprinkling Irrigation. In: Proc. 5 th Int.<br />
Micro<strong>irrigation</strong> Congress, X-1-L.<br />
LEINAUER, B. 2002. Wetting agents and their impact on <strong>water</strong> retention of turfgrass root zones.<br />
Aust. Turf Mangt. 4.1:17-19.<br />
KOSTIAKOV, A.N. 1932. On the dynamics of the coefficient of <strong>water</strong>-percolation in soils and on<br />
the necessity f<strong>or</strong> studying it from a dynamic point of view f<strong>or</strong> purposes of ameli<strong>or</strong>ation.<br />
Trans. 6th Comm. Intern. Soil Sci. Soc., Russia Part A:17-21.<br />
KOSTKA, S.J. 2000. Ameli<strong>or</strong>ation of <strong>water</strong> repellency in highly managed soils and the<br />
enhancement of turfgrass perf<strong>or</strong>mance through the systematic application of surfactants. J.<br />
Hydrol. 231-232:359-368.<br />
KUTILEK, M. & NIELSEN, D.R. 1994. Soil Hydrology. 1 st Ed. Catena, Cremlingen-Destedt, 370<br />
pp.<br />
RUITER, H.D. 2005. Surfactant blends effectively reduce <strong>water</strong>-repellency of soils. Adjuvant<br />
Newsletter. 2(7):1-3<br />
SAS, 1988. SAS/STAT user’s guide. Release 6.03 ed. SAS Institute Inc., Cary, N.C.<br />
11 33
Table 1. H<strong>or</strong>ton’s constant (b) f<strong>or</strong> the different soil textural classes (HUNG & KRINIK,1995).<br />
Soil Textural class<br />
H<strong>or</strong>ton’s Constant<br />
Sandy 2.76<br />
Loamy sand 2.48<br />
Loam 2.57<br />
Clay loam 2.60<br />
Clay 2.81<br />
Table 2. Mean wetting pattern of <strong>water</strong> with and without an added wetting agent (Dispatch 877<br />
ml/ha) in a loamy sand soil using a 1.9 l/hr emitter.<br />
Treatment<br />
H<strong>or</strong>izontal<br />
Vertical surface<br />
Total surface area<br />
Vertical cross<br />
surface area<br />
area (cm 2 )<br />
(cm 2 )<br />
section area<br />
(cm 2 )<br />
(cm 2 )<br />
Minutes 15 30 60 15 30 60 15 30 60 180<br />
Water alone 283 374 503 0 13 26 283 387 529 147<br />
Water + wetting<br />
302 412 555 45 142 264 347 554 819 287<br />
agent<br />
LSD (p = 0.05) 22.6 34.8 29.0 16.5 55 67.4 55.8 66.8 75.8 80.6<br />
12 34
20<br />
18<br />
16<br />
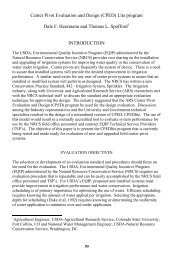
i(t) = 14.80 - 0.17 t - 7.50 t 2 - 1.11 t 3<br />
r 2 = 0.96<br />
Infiltration rate (cm/h)<br />
14<br />
12<br />
10<br />
8<br />
6<br />
4<br />
2<br />
0<br />
0 50 100 150 200 250 300 350<br />
Elapsed time (min)<br />
Fig. 1. Infiltration rate [i(t)] (cm/h) in a loamy sand soil as observed over a period of time since<br />
the start of infiltration (t). The matric potential was 15-25 kPa during the infiltration experiment.<br />
500<br />
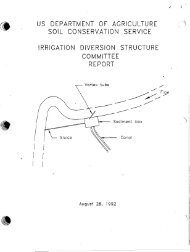
(l) = 576.8 - 14.07 (kPa)<br />
Surface <strong>runoff</strong> volume (l)<br />
400<br />
300<br />
200<br />
100<br />
r 2 = 0.82<br />
0<br />
10 15 20 25 30 35 40 45<br />
Matric potential (kPa)<br />
Fig. 2. Effect of matric potential on surface <strong>runoff</strong> (l) of <strong>irrigation</strong> <strong>water</strong> from a bermudagrass<br />
turf surface maintained under n<strong>or</strong>mal fairway management conditions on a loamy sand soil.<br />
Matric potential range was 15-40 kPa.<br />
13 35
Aerification<br />
Wetting agent<br />
Untreated<br />
0 2 4 6 8 10 12 14 16 18<br />
Infiltration rate (cm/h)<br />
Fig. 3. Mean infiltration rate in a loamy sand soil on an 8% slope with an established turf stand<br />
as affected <strong>by</strong> <strong>cultural</strong> practices like c<strong>or</strong>e aerification and topdressing with sand <strong>or</strong> application of<br />
a wetting agent (Dispatch applied at 877 ml/ha) every time bef<strong>or</strong>e the four repeated <strong>irrigation</strong><br />
events. The matric potential in soil was 15-25 kPa during the infiltration experiment. The err<strong>or</strong><br />
bars indicate the standard deviation.<br />
400<br />
a<br />
Surface <strong>runoff</strong><br />
Subsurface seepage<br />
Total <strong>irrigation</strong> <strong>runoff</strong> (l/h)<br />
300<br />
200<br />
100<br />
b<br />
b<br />
0<br />
Untreated<br />
Aeration<br />
Wetting agent<br />
Fig. 4. Mean <strong>irrigation</strong> <strong>runoff</strong> volume collected as surface <strong>runoff</strong> and subsurface seepage into the<br />
collection pit. The aeration and topdressing was done a week pri<strong>or</strong> to the <strong>runoff</strong> event. The<br />
wetting agent (Dispatch) was applied at 877 ml/ha rate 7 days bef<strong>or</strong>e the each of the four <strong>runoff</strong><br />
events The means were separated with Duncan’s New Multiple Range Test (DNMRT) at p =<br />
0.05 level. Bars with the same letter were not statistically different.<br />
14 36