Stabilized Landings - A Runway Excursion Prevention Tool - NBAA
Stabilized Landings - A Runway Excursion Prevention Tool - NBAA
Stabilized Landings - A Runway Excursion Prevention Tool - NBAA

You also want an ePaper? Increase the reach of your titles
YUMPU automatically turns print PDFs into web optimized ePapers that Google loves.
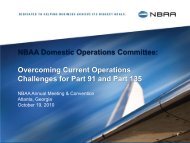
<strong>Stabilized</strong> <strong>Landings</strong><br />
A <strong>Runway</strong> <strong>Excursion</strong> <strong>Prevention</strong> <strong>Tool</strong><br />
<strong>NBAA</strong> Safety Committee – 2011 <strong>Runway</strong> <strong>Excursion</strong> <strong>Prevention</strong> Project
Safety Focus Project<br />
<strong>Runway</strong> <strong>Excursion</strong> <strong>Prevention</strong><br />
• Raise awareness of the issue<br />
• Promote the FSF <strong>Runway</strong> Safety Initiative (2009)<br />
– http://flightsafety.org/current-safetyinitiatives/runway-safety-initiative-rsi<br />
• Develop, communicate safe landing guidelines<br />
3
Introduction<br />
• <strong>Stabilized</strong> Approach Criteria has successfully elevated<br />
the in-cockpit awareness of risky approaches<br />
• Data reveals, though, runway accidents is still the<br />
leading cause of accidents<br />
• This presentation investigates the threat and presents<br />
strategies to prevent runway excursions<br />
4
<strong>Runway</strong> <strong>Excursion</strong><br />
• According to the Flight Safety Foundation, a runway<br />
excursion occurs when an aircraft on a runway surface<br />
departs the end or the side of that runway surface.<br />
• <strong>Runway</strong> excursions can occur on takeoff or landing<br />
– Veer Off – Depart the side of the runway<br />
– Overrun – Depart the end of the runway<br />
5
Approach and Landing Accidents, by Year<br />
100<br />
1995–2007 (1,007 accidents)<br />
Number of accidents<br />
90<br />
80<br />
70<br />
60<br />
93<br />
89<br />
90<br />
81<br />
81<br />
65<br />
76<br />
64<br />
76<br />
61<br />
78<br />
81<br />
72<br />
50<br />
40<br />
1995 1996 1997 1998 1999 2000 2001 2002 2003 2004 2005 2006 2007<br />
Year<br />
6
<strong>Runway</strong> <strong>Excursion</strong> Accidents<br />
Figure 2: Proportion of Fatal and Non Fatal Accidents (FSF, 2009, RSI Report, p. 5)<br />
7
Most Common Types of<br />
Approach and Landing Accidents<br />
1995–2007<br />
• Landing veer-off<br />
• Landing overrun<br />
• Unstabilized approach<br />
• Controlled flight into terrain (CFIT)<br />
• Collision with terrain, non-CFIT<br />
• <strong>Runway</strong> undershoot<br />
These comprise 77 percent of the<br />
total approach and landing accidents.<br />
8
FSF Data: All Approach and Landing<br />
Accidents 1995-2007<br />
Approach Final approach Landing Other Unknown<br />
Flight phase<br />
Figure 1: FSF ALAR Update - Killers in Aviation Update Pg. 5<br />
9
<strong>Runway</strong> <strong>Excursion</strong> Accidents<br />
<strong>Runway</strong> <strong>Excursion</strong>s 1995-2008<br />
45<br />
40<br />
35<br />
30<br />
25<br />
20<br />
15<br />
10<br />
5<br />
0<br />
Number of<br />
Accidents<br />
Trend<br />
1995<br />
1997<br />
1999<br />
2001<br />
2003<br />
2005<br />
2007<br />
Figure 3: <strong>Runway</strong> <strong>Excursion</strong>s 1995-2008 (FSF, 2009, RSI Report, p. 6)<br />
10
<strong>Runway</strong> <strong>Excursion</strong> Accidents<br />
<strong>Runway</strong> <strong>Excursion</strong>s 2004-2008<br />
50<br />
40<br />
30<br />
20<br />
Number of<br />
Accidents<br />
Trend<br />
10<br />
0<br />
2004 2005 2006 2007 2008<br />
Figure 4: <strong>Runway</strong> <strong>Excursion</strong>s 2004-2008 (FSF, 2009, RSI Report, p. 6)<br />
11
<strong>Runway</strong> <strong>Excursion</strong> Accidents<br />
<strong>Runway</strong> <strong>Excursion</strong>s - 1995-2008<br />
500<br />
400<br />
300<br />
200<br />
100<br />
21% 79%<br />
0<br />
Takeoff<br />
Landing<br />
Figure 5: <strong>Runway</strong> <strong>Excursion</strong> by Type (FSF, 2009, RSI Brief)<br />
12
<strong>Runway</strong> <strong>Excursion</strong> Factors<br />
• The FSF cites the major risk factors in landing<br />
excursions were:<br />
– go-around not conducted,<br />
– long landings,<br />
– ineffective braking (contaminated runways),<br />
– gear malfunctions, and<br />
– fast approaches and landings.<br />
13
Presentation Outline<br />
Jim Burin – Director of Technical Programs<br />
2010 – 2011 <strong>Runway</strong> <strong>Excursion</strong> Accident<br />
Review<br />
focus on three related accidents:<br />
Hawker – Owatonna<br />
Airbus – Toronto<br />
Boeing - Mangalore<br />
14
Presentation Outline<br />
Steve Charbonneau – Sr. Manager Training and Standards<br />
Landing Certification Concepts<br />
Consider the threats to safe landings<br />
Introduce the Safe Landing Guidelines<br />
15
Landing Certification<br />
• FAR Section 25.125 specifies the requirement to provide<br />
landing distances, defined as the horizontal distance<br />
necessary to land from a point 50 feet above a dry hard<br />
surface and come to a complete stop.<br />
• The aircraft must be in the landing configuration, having<br />
flown a stabilized approach at a speed of not less than VREF<br />
down to the 50 foot height, amongst other requirements.<br />
• The Flight Test Guide for the Certification of Transport<br />
Category Airplanes, Advisory Circular 25-7A, provides<br />
manufacturers with guidance to ensure compliance with the<br />
regulations.<br />
16
Landing Certification<br />
• Distances are treated in two parts:<br />
– the airborne distance from 50 feet to touchdown,<br />
and<br />
– the ground distance from touchdown to stop<br />
Airborne<br />
Ground<br />
17
Landing Certification<br />
• Airborne Distance<br />
– 3 or 3½ degree approach path<br />
– Sink rates as much as 8 feet per second at<br />
touchdown (480 fpm)<br />
18
Landing Certification<br />
• Ground Distance<br />
• Transition within 2 secs<br />
• Based on FULL Braking<br />
Figure 6 Landing Time Delays (AC 25-7a, p. 103)<br />
19
“Landing distances determined<br />
during certification are aimed at<br />
demonstrating the shortest landing<br />
distances… Therefore, the landing<br />
distances determined under FAR<br />
23.75 and 25.125 are much shorter<br />
than the landing distances achieved<br />
in normal operations”.<br />
(AC 91-79, App. 1, p. 8)
Threats to Safe <strong>Landings</strong><br />
According to AC 91-79:<br />
• Un-stabilized Approach<br />
• Excess Airspeed<br />
• Excess Threshold Crossing Height<br />
• Landing Long (Beyond the touchdown zone)<br />
• Adverse wind conditions<br />
• Failure to assess required landing distance<br />
RERR provides an excellent Threat Analysis presentation<br />
21
Un-stabilized Approach<br />
• There are strong associations with unstable approaches and<br />
long/hard/fast landings<br />
• However data exists to show that landing risks exist<br />
following both stabilized and un-stabilized approaches<br />
• Failure to Go-Around contributed to one-third of all landing<br />
excursion accidents.<br />
• Could be avoided by a go-around as required with stabilized<br />
approach criteria<br />
22
Un-stabilized Approach<br />
• Why do pilots continue to attempt to salvage un-stabilized<br />
approaches?<br />
• Four possible behaviors:<br />
– excessive confidence in a quick recovery;<br />
– excessive confidence because of runway or environmental<br />
conditions;<br />
– inadequate preparation or lack of commitment to conduct a goaround;<br />
or,<br />
– absence of decision because of fatigue or workload<br />
23
Excess Airspeed<br />
• Excess airspeed has been a cause factor in nearly 15% of<br />
landing excursion accidents<br />
• The performance data is normally based upon Vref not Vapp<br />
at a height of 50 feet above the threshold<br />
– Corrections to Vref are meant to be bled off to arrive at<br />
threshold on speed<br />
• Excess Speed affects either airborne or ground landing<br />
distances – or both<br />
24
Excess Airspeed<br />
• Airborne Landing Distance Effects:<br />
– 230 feet per knot of increased landing flare distance<br />
• Ground Landing Distance Effects (Dry):<br />
– 20-30 feet per knot of increased landing distance<br />
• Ground Landing Distance Effects (Wet):<br />
– 40-50 feet per knot of increased landing distance<br />
25
Excess Airspeed<br />
• A 10 knot excess airspeed has the potential of extending the<br />
landing distance by<br />
– 2300 feet with an extended float/flare; or<br />
– 200-300 feet (dry) with a fly on landing in the touchdown zone<br />
• Floating the landing has a 10X effect on landing distances<br />
26
Excess Threshold Crossing Height<br />
• Represents a high energy situation which logically will<br />
result in an extended airborne landing distance or ground<br />
roll out<br />
• AC 91-79 estimates that this distance is equivalent to 200<br />
feet for each 10 feet of excess TCH<br />
50’ TCH = 1000’<br />
100’ TCH = 2000’<br />
150’ TCH = 3000’<br />
27
Landing Long<br />
The Touchdown Zone<br />
• Most airplanes are certified to touchdown<br />
following a 3 or 3½ degrees approach slope with<br />
as much as an 8 foot per second sink rate (480<br />
FPM), giving<br />
• Touchdown points approximately 1000 feet from<br />
the threshold<br />
• Painted <strong>Runway</strong> Marking aim points are depicted<br />
at approximately 1000 feet from the threshold,<br />
which corresponds to most type certifications<br />
• Touchdown Zones – 1000-1500 from threshold –<br />
allows for cushioned landings<br />
28
Landing Long<br />
• Shallow approaches will also increase the airborne distance, as<br />
will a negative slope on the runway; approximately adding a<br />
10% penalty to landing distances<br />
• Pilots should seek to accomplish firm landings in the landing<br />
zone; which is defined as the first third, or 3000 feet of the<br />
runway whichever is less.<br />
29
Adverse wind conditions<br />
Tailwinds on Landing<br />
• Most aircraft are certified with 10 or 15 knots maximum<br />
tailwind<br />
• Tailwind conditions serve to increase the groundspeed<br />
which extends the airborne distance during the flare<br />
• Any tailwind on contaminated runways is not encouraged<br />
due to the inherent hazards<br />
30
Adverse wind conditions<br />
Crosswinds and Gusts on Landing<br />
• According to the RSI report, crosswinds, wind gusts and<br />
turbulence are also associated with runway excursion<br />
accidents.<br />
• Adverse wind conditions were involved in 33% of accidents<br />
between 1984-1997, and<br />
• When wet runways co-existed, adverse winds were involved<br />
in the majority of the runway excursions<br />
31
Adverse wind conditions<br />
Crosswinds and Wet/Contaminated <strong>Runway</strong><br />
• Assess the runway<br />
condition<br />
• Apply correction factors<br />
using chart<br />
• ALAR <strong>Tool</strong>kit provided<br />
detailed guidance<br />
concerning landings in<br />
crosswind conditions<br />
(ALAR, 8.7)<br />
32
Failure to assess required landing<br />
distance<br />
• 50 percent of the operators surveyed did not have<br />
adequate policies in place for assessing whether sufficient<br />
landing distance exists at the time of arrival at the<br />
destination airport (AC 91-79)<br />
• Two fundamental elements;<br />
– Correctly assessing the environmental conditions of the<br />
runway, and<br />
– Properly assessing the correct aircraft performance given the<br />
actual runway conditions<br />
33
Failure to assess required landing<br />
distance<br />
• Operators need to develop policies to compel flight crew to<br />
verify the runway condition prior to landing and apply<br />
sufficient safety margins to certified landing distances<br />
• The use of factored landing distances can assist with the<br />
ease of in-cockpit calculations (ALAR 8.3)<br />
• It is critical that pilots understand that AFM landing<br />
distances are based upon landings which are not normally<br />
operationally achievable and represent the starting point for<br />
determining accurate landing distances<br />
34
Consequences of Approach and Landing Accidents<br />
Loss of<br />
control<br />
in flight<br />
Ground<br />
collision<br />
with object<br />
Post-impact<br />
fire<br />
Undershoot<br />
Collision<br />
(non-CFIT)<br />
Accident consequence<br />
CFIT Overrun Veer-off<br />
CFIT = controlled flight into terrain<br />
35
Top Five Causal Factors of Approach and Landing<br />
Accidents<br />
Slow/<br />
delayed<br />
reaction<br />
Aircraft<br />
handling<br />
Failure<br />
in CRM<br />
Poor<br />
professional<br />
judgment/<br />
airmanship<br />
Omission<br />
of action/<br />
inappropriate<br />
action<br />
Causal factor<br />
36
Top Five Circumstantial Factors in Approach and<br />
Landing Accidents<br />
Training<br />
inadequate<br />
<strong>Runway</strong><br />
contamination<br />
Poor<br />
visibility<br />
Other<br />
weather<br />
factors<br />
CRM failure<br />
Circumstantial factor<br />
CRM = crew resource management<br />
37
<strong>Stabilized</strong> Landing<br />
• A landing conducted where the aircraft is<br />
positively controlled from a point 50 feet above<br />
the threshold to a full stop on the landing surface,<br />
without any unintended or adverse aircraft<br />
deviations from the planned and briefed<br />
maneuver.<br />
38
Safe Landing Guidelines<br />
The risk of an approach and landing accident is increased if any of the following<br />
guidelines is not met. If more than one guideline is not met, the overall risk is greatly<br />
increased<br />
• Fly a stabilized approach<br />
• Height at threshold crossing is 50’<br />
• Speed at threshold crossing is not more than Vref + 10 knots<br />
indicated airspeed and not less than Vref<br />
• Tailwind is no more than 10 knots for a non-contaminated runway,<br />
no more than 0 knots for a contaminated runway<br />
• Touchdown on runway centerline at the touchdown aim point<br />
• After touchdown, promptly transition to the desired deceleration<br />
configuration<br />
• Speed is less than 80 knots with 2,000 feet of runway remaining<br />
39
Safe Landing Guidelines<br />
Note: Once thrust reversers have<br />
been activated, a go-around is no<br />
longer an option.<br />
40
Presentation Outline<br />
JR Russell – Chairman ProActive Safety Systems Inc<br />
Strategies to reduce the risk of runway<br />
excursions:<br />
CRM<br />
Data Collection and Analysis<br />
How to move from being Reactive to<br />
Predictive<br />
41
Major References<br />
• Flight Safety Foundation. (2010) Approach and Landing<br />
Accident Reduction <strong>Tool</strong>kit Update<br />
• Flight Safety Foundation. (2009). Reducing the Risk of<br />
<strong>Runway</strong> <strong>Excursion</strong>s. <strong>Runway</strong> Safety Initiative Report<br />
• US DOT. Federal Aviation Administration. (11/06/07).<br />
Advisory Circular 91-79. <strong>Runway</strong> Overrun <strong>Prevention</strong><br />
• US DOT. Federal Aviation Administration. (6/3/99).Advisory<br />
Circular 25-7A Change 1. Flight Test Guide for the<br />
Certification of Transport Category Airplanes<br />
42
Contact Information<br />
• Steve.Charbonneau@altria.com<br />
– 804-218-9165<br />
43
Questions<br />
44
Reducing The Risk of<br />
<strong>Runway</strong> <strong>Excursion</strong>s<br />
Jim Burin<br />
Director of Technical Programs
Major Accidents<br />
Business Jets<br />
1 January 2010 to 31 December 2010<br />
Date Operator Aircraft Location Phase Fatal<br />
5 January Royal Air Freight Lear 35 Chicago, IL, USA Approach 2<br />
14 February Time Air Citation Bravo Schona, Germany Enroute 2<br />
15 July Prince Aviation Citation Bravo Bol, Croatia Landing 0<br />
12 August Ocean Air Taxi Lear 55 Rio de Janeiro, Brazil Landing 0<br />
31 August Trans Air Citation II Misima, PNG Landing 4<br />
6 October Aviones Taxi Citation I Veracruz, Mexico Enroute 8<br />
19 November Frandley Avn Ptn Citation I Birmingham, UK Landing 0<br />
19 December Windrose Air Hawker Premier St. Moritz, Switzerland Approach 2<br />
Source: Ascend
2010 Approach and Landing<br />
Accidents<br />
• Commercial Jets: 15 of 19 (80%)<br />
• Business Jets: 6 of 8 (75%)
<strong>Runway</strong> Safety Data<br />
1995–2009<br />
<strong>Runway</strong> <strong>Excursion</strong> Data<br />
• 36% of turbojet accidents<br />
• 24% of turboprop accidents
Major Accidents<br />
Business Jets<br />
1 January 2011 to 1 October 2011<br />
Date Operator Aircraft Location Phase Fatal<br />
6 January Priester Aviation Lear -35 Springfield, IL, USA Landing 0<br />
4 February Sky Lounge Hawker 900 Sulaymaniyah, Iraq Climb 7<br />
18 February Escuela de Aviacion Lear 24 Villasana, Mexico Landing 2<br />
28 March Hong Fei General Citation II Missing - China Enroute 3<br />
5 May Jorda LLC HS-125 Loreto Bay, Mexico Approach 0<br />
25 May Jet Suite Air EMB Phenom Sedona, AZ, USA Landing 0<br />
Source: Ascend
Landing <strong>Excursion</strong>s – Top 10 Factors<br />
40%<br />
35%<br />
30%<br />
25%<br />
20%<br />
15%<br />
10%<br />
5%<br />
0%
The Go-Around<br />
• Lack of go-arounds is a leading risk factor in<br />
approach and landing accidents<br />
• Lack of go-arounds is the #1 cause of landing<br />
runway excursions<br />
--However---<br />
• Many approach and landing accidents result<br />
from poorly executed go-arounds<br />
• When is it appropriate NOT to go around:<br />
- Wheels on the runway and<br />
- Thrust reversers activated
East Coast Jets<br />
Owatonna, MN<br />
July 31, 2008<br />
8 fatalities
Accident sequence<br />
• Wet runway, 8 knot tailwind<br />
• After touchdown, Captain delayed 7<br />
seconds before deploying lift dump<br />
• 17 seconds after touchdown, captain<br />
initiated go-around attempt<br />
- 1,200 feet from runway end<br />
- Approximately 75-80 Kts
The Go-Around<br />
The two primary issues with a go-around<br />
1. Making the decision to go-around<br />
2. Executing the go-around
LOSA Data<br />
• 4% of all approaches were unstable<br />
• 97% of unstable approaches are<br />
continued to landing<br />
– 10% result in abnormal landings<br />
• Only 3% of unstable approaches lead to<br />
a Go-Around<br />
• When a GA occurs – it is often poorly<br />
performed<br />
– Usually a surprise to the crew<br />
– Very rarely occurs at (the briefed) missed<br />
approach point
Data Study<br />
• Over 1 million flights analyzed<br />
• 3.5% of approaches are unstable<br />
(35,000)<br />
• Only 1.4% of them lead to a Go-Around<br />
(490)<br />
•Looked for <strong>Landings</strong> with High Risk events<br />
• Unstable 8.0 % (80,000)<br />
• Stable 6.2% (62,000)<br />
• This was not the expected result
Industry study on Go-Arounds<br />
Below 100ft<br />
13%<br />
Between 500ft<br />
and flare<br />
31%<br />
Above 500 ft<br />
56%
The Sad truth about the #1<br />
risk factor in ALA<br />
• 9 out of 10 unstbilized approaches<br />
do not go around
Air France A-340, Toronto<br />
309 onboard – no fatalities<br />
- Weather bad – tsm/lightning in vicinity<br />
- Fast/High on approach<br />
- Lost sight of runway in flare – landed left<br />
- Floated landing<br />
* landed 3,800 feet down 9,000 foot runway<br />
- Late Thrust reversers ( 12.8 sec, 16.3 sec)<br />
- Off end at 80 knots
Challenges<br />
• Approach and Landing accident Reduction<br />
Go arounds<br />
- Decision<br />
- Execution<br />
<strong>Excursion</strong>s<br />
- Success in raising awareness<br />
- Calculations and expectations<br />
Safe Landing Guidelines
Safe Landing Guidelines<br />
Note: The risk of an approach and landing accident is increased if any of the following guidelines<br />
is not met. If more than one guideline is not met, the overall risk is greatly increased<br />
1. Fly a stabilized approach<br />
2. Height at threshold crossing is 50 feet<br />
3. Speed at threshold crossing is not more than Vref + 10 knots indicated<br />
airspeed and not less than Vref<br />
4. Tailwind is no more than 10 knots for a non-contaminated runway, no<br />
more than 0 knots for a contaminated runway<br />
5. Touchdown on runway centerline at the touchdown aim point<br />
6. After touchdown, promptly transition to desired deceleration configuration<br />
- Brakes<br />
- Spoilers/speed brakes<br />
- Thrust reversers<br />
(Note: Once thrust reversers have been activated, a go-around is no longer an option)<br />
7. Speed is less than 80 knots with 2,000 feet of runway remaining
Air India Express<br />
Manglaor, India<br />
22 May 2010<br />
158 fatalities
Air India Express B-737<br />
158 fatalities<br />
- PIC asleep until 25 minutes from landing<br />
- Late descent clearance<br />
- Rate of descent > 4,000 fpm, still high<br />
- TCH 200 feet, speed 160 kts (50/144 normal)<br />
- Touchdown 5,000’ feet down 8,000’ runway<br />
- 3 calls from F/O to go around, EGPWS also<br />
- Touchdown, thrust reversers, braking<br />
- 6 seconds after touchdown, tried to go around
The keys to minimizing the risk of<br />
an approach and landing accident<br />
‣ Go arounds<br />
- Decision<br />
- Execution<br />
‣ Adoption of “Safe Landing” Guidelines
FSF Goal:<br />
Make Aviation Safer by Reducing<br />
The Risk of an Accident
Put Your SMS to Work<br />
• Look into your SMS toolbox to find ways to mitigate the risk<br />
of <strong>Runway</strong> <strong>Excursion</strong>s<br />
• The first step is communication – every SMS has the<br />
“communication tool” at it’s disposal – communicate the<br />
threats associated with <strong>Runway</strong> <strong>Excursion</strong>s:<br />
– Unstable approaches - Short runways<br />
– Landing long - Contaminated runways<br />
– Too fast - Fatigue<br />
– Too high - X/Winds<br />
To name a few…the point is…to get people<br />
thinking about these threats<br />
Pro-Active Safety Systems, Inc.
Put Your SMS to Work<br />
• Another tool is CRM<br />
– Make sure everyone is aware that their input<br />
is valued and to speak up if uncomfortable<br />
with a situation<br />
– Thorough departure and approach<br />
briefings are critical in mitigating the risk of<br />
<strong>Runway</strong> <strong>Excursion</strong>s<br />
Pro-Active Safety Systems, Inc.
Put Your SMS to Work<br />
• Safety data is another tool to utilize<br />
– Industry Data/News<br />
– Employee Reports<br />
– FOQA/FDM data<br />
Analyzing safety data will allow an operator to<br />
recognize negative trends developing. Do<br />
something before the negative trend leads to<br />
an incident or accident.<br />
Pro-Active Safety Systems, Inc.
In other words, become…<br />
Proactive<br />
and even<br />
Predictive
Risk Management Approaches<br />
INCREASING SAFETY<br />
REACTIVE<br />
PROACTIVE<br />
PREDICTIVE<br />
Reactive = Inefficient<br />
Proactive = Efficient<br />
Predictive = Very efficient<br />
REDUCING RISK
Reactive Safety<br />
Reactive… Focused on the outcome<br />
An unstable approach into XYZ led to a runway excursion. An<br />
investigation is done, and a report is generated with<br />
recommendations to prevent a similar incident.
Proactive…<br />
Hazards are identified from the information gleaned<br />
from safety data.<br />
Safety data indicates a rise in unstable approaches to runway<br />
28L at XYZ airport<br />
Further investigation reveals the glide-slope to 28L is OTS due<br />
to runway construction
Predictive…<br />
Ability to identify a potential hazard based<br />
on previous data/models/reports obtained.<br />
Unstable approaches trended upward when airport XYZ experienced runway<br />
construction, causing the glide slope to be unusable. Based on that<br />
knowledge, we can predict a rise in unstable approaches into airport ABC<br />
due to the proposed runway construction.
Thank you!<br />
Questions<br />
JR Russell<br />
Pro-Active Safety Systems, Inc.<br />
303-589-7430<br />
jrrussell@proactivesafetyinc.com
Safe Landing Guidelines<br />
(The risk of an approach and landing accident is increased if any of the following guidelines is not<br />
met. If more than one guideline is not met, the overall risk is greatly increased)<br />
1. Fly a stabilized approach 1<br />
2. Height at threshold crossing is 50 feet<br />
3. Speed at threshold crossing is not more than Vref + 10 knots indicated airspeed and not less<br />
than Vref<br />
4. Tailwind is no more than 10 knots for a non-contaminated runway, no more than 0 knots for a<br />
contaminated runway<br />
5. Touchdown on runway centerline at the touchdown aim point 2<br />
6. After touchdown, promptly transition to the desired deceleration configuration<br />
- Brakes<br />
- Spoilers/speed brakes<br />
- Thrust reversers<br />
(Note: Once thrust reversers have been activated, a go-around is no longer an option.)<br />
7. Speed is less than 80 knots with 2,000 feet of runway remaining<br />
Notes:<br />
1. <strong>Stabilized</strong> approach:<br />
Recommended Elements Of a <strong>Stabilized</strong> Approach<br />
All flights must be stabilized by 1,000 feet above airport elevation in instrument meteorological conditions (IMC)<br />
and by 500 feet above airport elevation in visual meteorological conditions (VMC). An approach is stabilized when<br />
all of the following criteria are met:<br />
1. The aircraft is on the correct flight path;<br />
2. Only small changes in heading/pitch are required to maintain the correct flight path;<br />
3. The aircraft speed is not more than VREF + 20 knots indicated airspeed and not less than VREF;<br />
4. The aircraft is in the correct landing configuration;<br />
5. Sink rate is no greater than 1,000 feet per minute; if an approach requires a sink rate greater than 1,000 feet<br />
per minute, a special briefing should be conducted;<br />
6. Power setting is appropriate for the aircraft configuration and is not below the minimum power for approach as<br />
defined by the aircraft operating manual;<br />
7. All briefings and checklists have been conducted;<br />
8. Specific types of approaches are stabilized if they also fulfill the following: instrument landing system (ILS)<br />
approaches must be flown within one dot of the glideslope and localizer; during a circling approach, wings should<br />
be level on final when the aircraft reaches 300 feet above airport elevation; and,<br />
9. Unique approach procedures or abnormal conditions requiring a deviation from the above elements of a<br />
stabilized approach require a special briefing.<br />
An approach that becomes unstabilized below 1,000 feet above airport elevation in IMC or below 500 feet above<br />
airport elevation in VMC requires an immediate go-around.<br />
2. Touchdown aim point (distance from runway threshold):<br />
- FAA: 1,000 feet<br />
- ICAO: Landing area available: 2,400m<br />
Touchdown point: 150m 250m 300m 400m<br />
The touchdown aim point markings start at the distance indicated above and are 150 foot<br />
long solid white rectangular stripes, one on each side of the runway centerline. The width<br />
of the aim point markings varies with the width of the runway.