Diabetes in pregnancy: are we providing the best care ... - HQIP
Diabetes in pregnancy: are we providing the best care ... - HQIP
Diabetes in pregnancy: are we providing the best care ... - HQIP

Create successful ePaper yourself
Turn your PDF publications into a flip-book with our unique Google optimized e-Paper software.
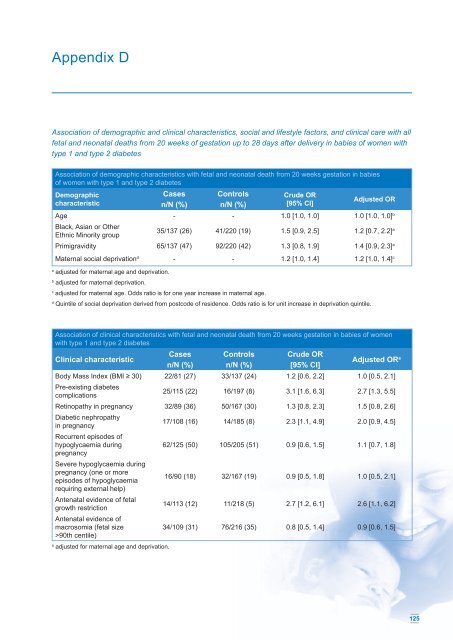
Appendix D<br />
Association of demographic and cl<strong>in</strong>ical characteristics, social and lifestyle factors, and cl<strong>in</strong>ical c<strong>are</strong> with all<br />
fetal and neonatal deaths from 20 <strong>we</strong>eks of gestation up to 28 days after delivery <strong>in</strong> babies of women with<br />
type 1 and type 2 diabetes<br />
Association of demographic characteristics with fetal and neonatal death from 20 <strong>we</strong>eks gestation <strong>in</strong> babies<br />
of women with type 1 and type 2 diabetes<br />
Demographic<br />
characteristic<br />
Cases<br />
n/N (%)<br />
Controls<br />
n/N (%)<br />
Crude OR<br />
[95% CI]<br />
Adjusted OR<br />
Age - - 1.0 [1.0, 1.0] 1.0 [1.0, 1.0] b<br />
Black, Asian or O<strong>the</strong>r<br />
Ethnic M<strong>in</strong>ority group<br />
35/137 (26) 41/220 (19) 1.5 [0.9, 2.5] 1.2 [0.7, 2.2] a<br />
Primigravidity 65/137 (47) 92/220 (42) 1.3 [0.8, 1.9] 1.4 [0.9, 2.3] a<br />
Maternal social deprivation d - - 1.2 [1.0, 1.4] 1.2 [1.0, 1.4] c<br />
a<br />
adjusted for maternal age and deprivation.<br />
b<br />
adjusted for maternal deprivation.<br />
c<br />
adjusted for maternal age. Odds ratio is for one year <strong>in</strong>crease <strong>in</strong> maternal age.<br />
d<br />
Qu<strong>in</strong>tile of social deprivation derived from postcode of residence. Odds ratio is for unit <strong>in</strong>crease <strong>in</strong> deprivation qu<strong>in</strong>tile.<br />
Association of cl<strong>in</strong>ical characteristics with fetal and neonatal death from 20 <strong>we</strong>eks gestation <strong>in</strong> babies of women<br />
with type 1 and type 2 diabetes<br />
Cl<strong>in</strong>ical characteristic<br />
Cases<br />
n/N (%)<br />
Controls<br />
n/N (%)<br />
Crude OR<br />
[95% CI]<br />
Adjusted OR a<br />
Body Mass Index (BMI ≥ 30) 22/81 (27) 33/137 (24) 1.2 [0.6, 2.2] 1.0 [0.5, 2.1]<br />
Pre-exist<strong>in</strong>g diabetes<br />
complications<br />
25/115 (22) 16/197 (8) 3.1 [1.6, 6.3] 2.7 [1.3, 5.5]<br />
Ret<strong>in</strong>opathy <strong>in</strong> <strong>pregnancy</strong> 32/89 (36) 50/167 (30) 1.3 [0.8, 2.3] 1.5 [0.8, 2.6]<br />
Diabetic nephropathy<br />
<strong>in</strong> <strong>pregnancy</strong><br />
17/108 (16) 14/185 (8) 2.3 [1.1, 4.9] 2.0 [0.9, 4.5]<br />
Recurrent episodes of<br />
hypoglycaemia dur<strong>in</strong>g<br />
62/125 (50) 105/205 (51) 0.9 [0.6, 1.5] 1.1 [0.7, 1.8]<br />
<strong>pregnancy</strong><br />
Severe hypoglycaemia dur<strong>in</strong>g<br />
<strong>pregnancy</strong> (one or more<br />
episodes of hypoglycaemia<br />
requir<strong>in</strong>g external help)<br />
16/90 (18) 32/167 (19) 0.9 [0.5, 1.8] 1.0 [0.5, 2.1]<br />
Antenatal evidence of fetal<br />
growth restriction<br />
Antenatal evidence of<br />
macrosomia (fetal size<br />
>90th centile)<br />
a<br />
adjusted for maternal age and deprivation.<br />
14/113 (12) 11/218 (5) 2.7 [1.2, 6.1] 2.6 [1.1, 6.2]<br />
34/109 (31) 76/216 (35) 0.8 [0.5, 1.4] 0.9 [0.6, 1.5]<br />
125