Multispectral Fluorescence Imaging of Ovarian Surface for ...
Multispectral Fluorescence Imaging of Ovarian Surface for ...
Multispectral Fluorescence Imaging of Ovarian Surface for ...

You also want an ePaper? Increase the reach of your titles
YUMPU automatically turns print PDFs into web optimized ePapers that Google loves.
<strong>Multispectral</strong> <strong>Fluorescence</strong> <strong>Imaging</strong> <strong>of</strong> <strong>Ovarian</strong> <strong>Surface</strong> <strong>for</strong><br />
Oncologic Tissue Characterization<br />
Timothy Renkoski, MS 1 , Urs Utzinger, PhD 2<br />
1 University <strong>of</strong> Arizona, College <strong>of</strong> Optical Sciences, Tucson, Arizona 85721, USA<br />
2 University <strong>of</strong> Arizona, Biomedical Engineering, Obstetrics & Gynecology, Electrical & Computer Engineering, College <strong>of</strong> Optical Sciences,<br />
Tucson, Arizona 85721, USA<br />
Email: renkoski@email.arizona.edu<br />
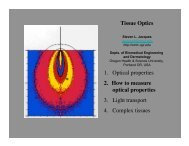
1. Problem<br />
<strong>Ovarian</strong> cancer causes more deaths than any other gynecological cancer. When ovarian cancer is diagnosed at the<br />
localized stage, it is highly treatable with 5-year survival rate <strong>of</strong> patients at 92%. However, only 19% <strong>of</strong> ovarian<br />
cancer cases are discovered at the localized stage, leading to a 5-year survival rate <strong>of</strong> only 45% [1]. At this time, no<br />
sufficiently accurate screening test exists <strong>for</strong> ovarian cancer. A reliable screening method <strong>for</strong> ovarian cancer would<br />
likely yield a significant reduction in fatalities associated with the disease. <strong>Multispectral</strong> imaging holds promise <strong>for</strong><br />
distinguishing cancerous and benign growth tissues from healthy tissue because <strong>of</strong> the fluorescence signatures <strong>of</strong><br />
cellular metabolic c<strong>of</strong>actors and extracellular matrix components. Ratios <strong>of</strong> endogenous fluorescent intensities at<br />
different wavelengths have been used to differentiate cancerous and normal ovarian epithelium[2]. Ramanujam and<br />
Wagnières have produced useful reviews on the application <strong>of</strong> fluorescence spectroscopy and imaging to oncologic<br />
tissue evaluation [3, 4].<br />
2. Methods<br />
In this study, we make use <strong>of</strong> a particular multispectral imaging system in attempt to differentiate between human<br />
ovarian tissues <strong>of</strong> normal, benign and cancerous pathologies. The images are <strong>of</strong> whole human ovaries obtained ex<br />
vivo from thirty consented study patients undergoing oophorectomy. In cases <strong>of</strong> women at high risk <strong>for</strong> ovarian<br />
cancer, ovary removal was prophylactic. In other cases removal was deemed necessary due to discovery <strong>of</strong> ovarian<br />
abnormality. Each ovary was imaged 5 to 15 minutes after disconnection <strong>of</strong> blood supply in an unlighted room.<br />
The imaging system used a fixed focal distance <strong>of</strong> 30 cm and a field <strong>of</strong> view <strong>of</strong> approximately 8 cm, and the whole<br />
ovaries ranged in size from 2 cm to 12 cm. Histopathology results were obtained on each ovary and used to classify<br />
particular ovaries in 1 <strong>of</strong> 4 categories (Normal, Cancer, Benign, or Endometriosis)<br />
3. Equipment<br />
The system used to acquire multispectral images <strong>of</strong> ovarian tissue was provided by Apogen Technologies (a<br />
subsidiary <strong>of</strong> QinetiQ North America). This system was produced <strong>for</strong> diagnostic imaging <strong>of</strong> surface epithelium. It<br />
captures two different sets <strong>of</strong> images, both fluorescence and reflectance, in rapid succession.<br />
For fluorescence images, illumination is accomplished via a filtered short arc mercury lamp providing excitation<br />
in a narrow band around 365 nm. Bandpass filters are used to allow capture <strong>of</strong> fluorescence images in 8 slightlyoverlapping<br />
wavelength bands. Together, four <strong>of</strong> these bands cover the spectrum from 400 nm to 500 nm. The four<br />
remaining filter bands cover the range from 500 nm to 630 nm. The imager produces simultaneous capture <strong>of</strong> four<br />
spectral images thanks to a novel optical system which splits and filters the collected light in four spatially-separate<br />
but identical images [5]. Each filtered image projects onto one <strong>of</strong> four quadrants <strong>of</strong> the camera CCD. (See Figures 1<br />
and 2.)<br />
For reflectance images, illumination is provided by a halogen lamp. This white light is polarized vertically prior<br />
to reaching the sample. Again, light is collected and split into four separate beams <strong>for</strong> independent filtering. In this<br />
case, the four filters used are wide, bandpass, and centered in the near-infrared (NIR), red, green, and blue spectral<br />
regions. These filters incorporate a polarizer along a fixed direction. Two sets <strong>of</strong> reflectance images are captured in<br />
succession. One with the collection polarization direction oriented at 90° (crossed) to the illumination polarization<br />
direction and a second with these polarization directions parallel.
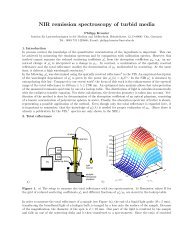
Figure 1. Layout <strong>of</strong> adjacent images on a single CCD<br />
enabling simultaneous multispectral image capture<br />
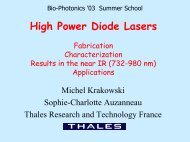
Figure 2. Rotating filter wheel <strong>for</strong> independent filtering <strong>of</strong><br />
each image quadrant<br />
4. Analysis<br />
Each set <strong>of</strong> raw image data from the CCD is 1024 by 1280 pixels and contains 4 images--one 512 by 640<br />
pixel image in each quadrant. A corresponding set <strong>of</strong> dark image data is captured <strong>for</strong> each image set. The<br />
first step involves separating the quad-image into 4 individual images. Then registration <strong>of</strong> the images and<br />
correction <strong>of</strong> distortion are per<strong>for</strong>med. Next, dark correction and flat field correction are applied. Scale<br />
factors correct <strong>for</strong> wavelength response and integration time.<br />
The preprocessed images can then be compared and analyzed both visually and quantitatively at certain<br />
regions <strong>of</strong> interest (ROI’s). ROI’s can be identified through multiple methods. The crossed polarizer<br />
reflectance images, viewed in RGB color, assist this process by reducing surface glare and allowing one to<br />
see just beneath the first tissue layer. The images at 8 fluorescence wavelengths can be compared, noting<br />
the relative fluorescence intensities in spatially coincident image regions. These fluorescence images can<br />
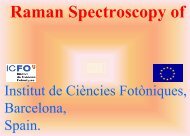
also be loaded in the RGB channels to produce a false color image with channels weighted to maximize<br />
contrast. (See Figure 3) <strong>Fluorescence</strong> image regions with comparatively low signal can be enhanced by<br />
multiplication <strong>of</strong> the image with (1-Refectance Image) mask.<br />
Figure 3. Sample reflectance and fluorescence ovary images<br />
If no perceptible visual difference in these images can be elucidated <strong>for</strong> tissue characterization, then<br />
quantitative measures must be implemented. Levels <strong>of</strong> fluorescent cellular components such as NADH and<br />
FAD are indicators <strong>of</strong> cellular metabolic rate and have been tied to onset <strong>of</strong> abnormal tissue growth and<br />
cancer [6-8]. Their spectra have been measured, and an applicable parallel-factor analysis <strong>for</strong> tissue
fluorescence spectroscopy results has been described [9]. The fluorescence images <strong>of</strong> this study give us<br />
relative fluorescent intensities <strong>for</strong> eight different narrow wavelength bands <strong>for</strong> all imaged regions <strong>of</strong> tissue.<br />
We can apply parallel factor analysis to the fluorescence image data or simply compose ratios <strong>of</strong><br />
fluorescent intensity in different bands in order to tie relative fluorescence levels to relative NADH and<br />
FAD levels. Then we group tissues and attempt to correlate the data to the normal, benign, and cancerous<br />
designations <strong>of</strong> the imaged tissue as determined by histopathology.<br />
5. Results and conclusions<br />
The results <strong>of</strong> this spectral image analysis will be presented at conference and include statistics such as the<br />
sensitivity and specificity achieved using histopathology results as the reference standard. Results will also<br />
include how a ROI is best chosen to yield reliable diagnostic results. Discussion would include how the<br />
results compare with what was expected to be observed based on current knowledge <strong>of</strong> endogenous<br />
fluorescence spectra such as that <strong>of</strong> collagen, NADH and FAD. Future work would be described, including<br />
how one might construct a minimally invasive device <strong>for</strong> in vivo diagnostic use.<br />
6. References<br />
[1] Cancer Facts & Figures 2008. Atlanta: American Cancer Society, 2008.<br />
[2] M. Brewer, U. Utzinger, E. Silva, D. Gershenson, R. C. Bast, Jr., M. Follen, and R. Richards-Kortum, "<strong>Fluorescence</strong><br />
spectroscopy <strong>for</strong> in vivo characterization <strong>of</strong> ovarian tissue," Lasers in Surgery & Medicine, vol. 29, pp. 128-35, 2001.<br />
[3] N. Ramanujam, "<strong>Fluorescence</strong> spectroscopy <strong>of</strong> neoplastic and non-neoplastic tissues," Neoplasia (New York), vol. 2, pp.<br />
89-117, 2000.<br />
[4] G. A. Wagnieres, W. M. Star, and B. C. Wilson, "In vivo fluorescence spectroscopy and imaging <strong>for</strong> oncological<br />
applications," Photochemistry & Photobiology, vol. 68, pp. 603-32, 1998.<br />
[5] M. D. Tocci, "US Patent 7,177,085: Multiple <strong>Imaging</strong> System and Method <strong>for</strong> Designing Same," USPTO, Ed., 2007.<br />
[6] R. Drezek, C. Brookner, I. Pavlova, I. Boiko, A. Malpica, R. Lotan, M. Follen, and R. Richards-Kortum,<br />
"Aut<strong>of</strong>luorescence microscopy <strong>of</strong> fresh cervical-tissue sections reveals alterations in tissue biochemistry with dysplasia,"<br />
Photochemistry & Photobiology, vol. 73, pp. 636-41, 2001.<br />
[7] R. Drezek, K. Sokolov, U. Utzinger, I. Boiko, A. Malpica, M. Follen, and R. Richards-Kortum, "Understanding the<br />
contributions <strong>of</strong> NADH and collagen to cervical tissue fluorescence spectra: modeling, measurements, and implications,"<br />
Journal <strong>of</strong> Biomedical Optics, vol. 6, pp. 385-96, 2001.<br />
[8] M. Brewer, U. Utzinger, Y. Li, E. N. Atkinson, W. Satterfield, N. Auersperg, R. Richards-Kortum, M. Follen, and R. Bast,<br />
"<strong>Fluorescence</strong> spectroscopy as a biomarker in a cell culture and in a nonhuman primate model <strong>for</strong> ovarian cancer<br />
chemopreventive agents," Journal <strong>of</strong> Biomedical Optics, vol. 7, pp. 20-6, 2002.<br />
[9] M. Michaelides, "Early Detection <strong>of</strong> <strong>Ovarian</strong> Cancer Using <strong>Fluorescence</strong> Spectroscopy and Parallel Factor Analysis," in<br />
Electrical and Computer Engineering. vol. Master <strong>of</strong> Science: University <strong>of</strong> Arizona, 2007.