2008 NursiNg ANNuAl report - Catholic Health System
2008 NursiNg ANNuAl report - Catholic Health System
2008 NursiNg ANNuAl report - Catholic Health System

Create successful ePaper yourself
Turn your PDF publications into a flip-book with our unique Google optimized e-Paper software.
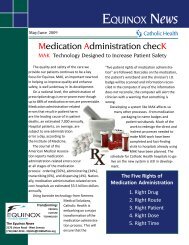
Quality in Nursing<br />
The nursing department tracks several nursing-sensitive quality indicators both independently and<br />
through the National Database for Nursing Quality Indicators (NDNQI). Indicators are measured,<br />
<strong>report</strong>ed and tracked at the unit level to be used for practice and process improvements using current<br />
evidence and best practice. Indicators that are monitored and <strong>report</strong>ed on include medication<br />
errors, patient falls, core measures for congestive heart failure and community acquired pneumonia,<br />
restraint use, and pressure ulcer prevalence. For the pressure ulcer prevalence and restraint<br />
use- skin rounds are done on<br />
the same day each month and<br />
Sisters Hospital Pressure Ulcer Prevalence Rate<br />
any patients in restraints are<br />
12.0%<br />
11.0%<br />
documented. The results are<br />
10.2%<br />
10.3%<br />
graphed for <strong>report</strong>ing to the<br />
10.0%<br />
units and up through the hospital<br />
quality committee. They 8.0%<br />
7.0%<br />
are also <strong>report</strong>ed through the<br />
6.0%<br />
6.0%<br />
5.7%<br />
5.8%<br />
National Database for Nursing<br />
5.1%<br />
5.0%<br />
Quality Indicators (NDNQI)<br />
4.4%<br />
4.2%<br />
3.9%<br />
4.0%<br />
for benchmarking nationally.<br />
These graphs show a trend of<br />
overall improvement for the<br />
use of restraints and pressure<br />
ulcer prevalence for <strong>2008</strong>.<br />
2.0%<br />
0.0%<br />
Jan-08 Feb-08 Mar-08 Apr-08 May-08 Jun-08 Jul-08 Aug-08 Sep-08 Oct-08 Nov-08 Dec-08<br />
Rate = Patients with H.A.ulcers /Total<br />
patients surveyed<br />
Total Hospital Rate<br />
Linear (Total Hospital Rate)<br />
The individual Unit Practice<br />
Councils are charged with<br />
analyzing the data and determining<br />
ways to improve<br />
outcomes for their unit. If<br />
successful, they will share their<br />
processes with the other units<br />
in the hospital. When an opportunity<br />
exists for improvement<br />
on all patient care units,<br />
a more global approach to the<br />
problem is developed with all<br />
units implementing the same<br />
improvement plan.<br />
12<br />
10<br />
3<br />
146<br />
# of Restraints<br />
8<br />
6<br />
4<br />
2<br />
0<br />
1<br />
140<br />
10158<br />
Total Restraints<br />
The results from all units are<br />
monitored and shared with the<br />
nurse managers with the expectation<br />
that results are then communicated to the staff for further analysis and idea sharing. The intent is to<br />
continue building our culture of patient safety and nursing excellence.<br />
4<br />
127<br />
130<br />
1 1<br />
133<br />
3<br />
126<br />
2<br />
143<br />
139<br />
1 1<br />
Jan-08 Feb-08 Mar-08 Apr-08 May-08 Jun-08 Jul-08 Aug-08 Sep-08 Oct-08 Nov-08 Dec-08<br />
Pts with Restraints Number of patietnts surveyed Linear (Pts with Restraints)<br />
120<br />
2<br />
127<br />
0<br />
96<br />
180<br />
160<br />
140<br />
120<br />
# of Patients<br />
100<br />
80<br />
60<br />
40<br />
20<br />
0<br />
12