earth mover's distance region-based image similarity modeling
earth mover's distance region-based image similarity modeling
earth mover's distance region-based image similarity modeling

Create successful ePaper yourself
Turn your PDF publications into a flip-book with our unique Google optimized e-Paper software.
Association of Metallurgical Engineers of Serbia<br />
AMES<br />
Scientific paper<br />
UDC:553.042.551.242-1.001.575=20<br />
EARTH MOVER’S DISTANCE REGION-BASED<br />
IMAGE SIMILARITY MODELING APPLIED TO MINERAL<br />
IMAGE RETRIEVAL<br />
MLADEN JOVIC*, YUTAKA HATAKEYAMA*,<br />
ZORAN STEJIC**, SRECKO STOPIC***, SEIDL THOMAS****,<br />
DRAGOMIRKA OLJACA*****, KAORU HIROTA*<br />
ABSTRACT<br />
Three variants of <strong>region</strong>-<strong>based</strong> <strong>image</strong> <strong>similarity</strong> models employing the Earth<br />
Mover's Distance (EMD) function for automated mineral recognition and identification<br />
in the field of mineralogy and metallurgy are presented. By allowing for comparison of<br />
<strong>image</strong>s with different number of <strong>region</strong>s, two models are proposed that take advantage<br />
of important characteristics of the EMD, that make it particularly suitable for the<br />
<strong>region</strong>-<strong>based</strong> <strong>image</strong> <strong>similarity</strong> <strong>modeling</strong>. A third model that takes into consideration<br />
five different <strong>region</strong>-<strong>based</strong> <strong>image</strong> <strong>similarity</strong> models and overcomes the limitations of<br />
the existing fixed-resolution <strong>image</strong> <strong>similarity</strong> models is further proposed. The three<br />
proposed variants share the <strong>image</strong> features but differ in the way the <strong>image</strong> feature <strong>based</strong><br />
flow matrix and feature distribution elements of the EMD are modeled. Empirical<br />
evaluation of the three variants on four test databases, containing 3,000 <strong>image</strong>s in 30<br />
semantic categories was carried out. The results obtained from the evaluation revealed<br />
that EMD cross-resolution <strong>image</strong> <strong>similarity</strong> <strong>modeling</strong> results in optimal retrieval<br />
performance, and provide information useful for adopting the EMD into a <strong>region</strong> <strong>based</strong><br />
<strong>image</strong> <strong>similarity</strong> <strong>modeling</strong>. The experimental evaluation presented may thus be helpful<br />
for improved mineral recognition and identification.<br />
Key words: <strong>image</strong>, retrieval, mineral<br />
* Department of Computational Intelligence and Systems Sciences, Interdisciplinary Graduate<br />
School of Science and Engineering, Tokyo Institute of Technology, G3-49, 4259 Nagatsuta,<br />
Midori-ward, Yokohama 226-8502, Japan<br />
** Ricoh Company, Ltd., Software R&D Group, 1-1-17 Koishikawa, Bunkyo-ward, Tokyo<br />
112-0002, Japan<br />
***Department of Process Metallurgy and Metal Recycling, RWTH Aachen University,<br />
Germany<br />
****Data Management and Exploration Group, RWTH Aachen University, Germany<br />
*****Faculty of Medicine, University of Banja Luka, Bosnia and Herzegovina
118<br />
MJoM<br />
METALURGIJA - JOURNAL OF METALLURGY<br />
1. INTRODUCTION<br />
The study of minerals using optical techniques, principally employing a optical<br />
microscope is most commonly undertaken to obtain information such as mineral<br />
identity, chemical composition, structural state and growth. (Optical) examination of<br />
mineral samples is typically required before more sophisticated techniques are<br />
employed, and thus optical identification of minerals is routinely done in the study of<br />
rocks and mineral deposits. While this information can be obtained by other more<br />
sophisticated techniques such as a X-ray diffraction, X-ray fluorescence or electron<br />
microscopy, the methods of optical mineralogy have an advantage that they are really<br />
simple, inexpensive, reliable, reasonably accurate and require small samples [4]. Until<br />
now, mineral identification and analysis is mostly done manually by fixing and<br />
collecting several optical properties of minerals under polarizing microscope [4], [3].<br />
Manual techniques for mineral recognition and (or) classification are mostly tedious<br />
and error prone and moreover time consuming.<br />
With an objective to overcome these limitations automatic mineral identification<br />
and retrieval <strong>based</strong> on the digital <strong>image</strong> analysis is desired. Image processing and<br />
retrieval techniques <strong>based</strong> on the <strong>image</strong> feature analysis are utilized. In terms to get the<br />
best method for automatic and more accurate mineral identification [4], [3], by allowing<br />
for comparison of <strong>image</strong>s with different number of <strong>region</strong>s, two models are proposed<br />
that take advantage of important characteristics of the Earth Mover's Distance (EMD)<br />
function [17], that make it particularly suitable for the <strong>region</strong>-<strong>based</strong> <strong>image</strong> <strong>similarity</strong><br />
<strong>modeling</strong>. A third model that takes into consideration five different <strong>region</strong>-<strong>based</strong> <strong>image</strong><br />
<strong>similarity</strong> models and overcomes the limitations of the existing fixed-resolution <strong>image</strong><br />
<strong>similarity</strong> models is further proposed. The three proposed variants share the <strong>image</strong><br />
features but differ in the way the <strong>image</strong> feature <strong>based</strong> flow matrix and feature<br />
distribution elements of the EMD are modeled. Thus overcoming both the fixed number<br />
of <strong>region</strong>s pre-determined by the <strong>image</strong> segmentation algorithm and the limitations of<br />
fixed-resolution <strong>image</strong> <strong>similarity</strong> models is achieved. The evaluation is carried out on a<br />
mineral <strong>image</strong> test database, containing 3,000 <strong>image</strong>s in 30 semantic categories. In<br />
total, over 900,000 queries are executed, <strong>based</strong> on which the (weighted) precision and<br />
average rank are computed.<br />
The reminder of the paper is organized as follows: In II, Image Similarity<br />
Modeling works in Mineral Processing are described. Image Sample Characteristics<br />
and Retrieval Strategy are presented in III. The experimental results concerning the<br />
effectiveness and efficiency of the proposed methods are outlined in IV.<br />
2. BACKGROUND: IMAGE SIMILARITY MODELING<br />
IN MINERAL PROCESSING<br />
Recognizing different mineralogical species is usually realized by means of optical<br />
microscopy, sometimes supplemented by electron microscopy and <strong>image</strong> analysis<br />
system [4], [7]. The analysist is usually an applied mineralogist with the great<br />
experience and patience in carrying out determinations. The work is very boring and
EARTH MOVER’S DISTANCE REGION-BASE IMAGE SIMILARITY … 119<br />
repetitive, and for this reason there is always the possibility of the introduction of errors<br />
in the determinations.<br />
Techniques for <strong>image</strong> processing and recognition have been successful in recent<br />
years due to the low cost of hardware devices for <strong>image</strong> acquisition and manipulation<br />
and an improvement in their technical characteristics (speed, resolution, processing<br />
time, etc.) [4], [5] and [6]. The possibility of using real color <strong>image</strong>s, characterized by<br />
triplet of information (three components: RGB), acquired optically, opens a new<br />
chapter in the field of process mineralogy. Such procedures in fact have lower costs<br />
than systems <strong>based</strong> on electron beam instruments. Thus a significant aid can be<br />
provided by <strong>image</strong> analysis and the related built-in recognition algorithms. The<br />
advantage of these procedures is linked to the fact that they are inexpensive and allow<br />
the acquisition, the processing and storing of a large number of <strong>image</strong>s, increasing the<br />
significance of the investigation results and replacing the experts in the analysis.<br />
As already mentioned, different research groups have tried to techniques for <strong>image</strong><br />
processing and recognition in mineral recognition purposes. Besides [4], [5] and [6]<br />
similar techniques were also developed out and used by Imperial College group [8],<br />
CSIRO [9] and CANMET [10]. However, the limitation of these methods are mainly<br />
<strong>based</strong> on <strong>image</strong> processing techniques where the signal source was not represented by a<br />
wavelength distribution (grey-level histogram) in the visible spectrum, but by a source<br />
X-rays. Thus it might be rather difcult to arrange and utilize them outside a high<br />
technological scientific environment. In other cases the <strong>image</strong> processing techniques<br />
are <strong>based</strong> on the black and white <strong>image</strong>s only [13].<br />
The problems of <strong>image</strong> processing and recognition techniques for mineral<br />
recognition purposes are addressed by <strong>modeling</strong> <strong>image</strong> <strong>similarity</strong> by allowing for<br />
comparison of <strong>image</strong>s with different number of <strong>region</strong>s. In such a way, two models are<br />
proposed that take advantage of important characteristics of the Earth Mover's Distance<br />
(EMD) function [17], that make it particularly suitable for the <strong>region</strong>-<strong>based</strong> <strong>image</strong><br />
<strong>similarity</strong> <strong>modeling</strong>. A third model that takes into consideration five different<br />
<strong>region</strong>-<strong>based</strong> <strong>image</strong> <strong>similarity</strong> models and overcomes the limitations of the existing<br />
fixed-resolution <strong>image</strong> <strong>similarity</strong> models is further proposed.<br />
3. IMAGE SAMPLE CHARACTERISTICS<br />
AND RETRIEVAL STRATEGY<br />
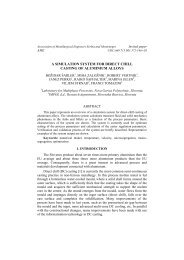
As a common approach, the mineral <strong>image</strong>s are transformed into high-dimensional<br />
feature vectors and the <strong>similarity</strong> is measured in terms of vicinity in the feature space.<br />
Such a system architecture is shown on Fig. 2. Although the Euclidean <strong>distance</strong> is a very<br />
common <strong>distance</strong> function for the high-dimensional feature vectors, such as a feature<br />
histograms, it exhibits sever limitations with respect to <strong>similarity</strong> measurements. In<br />
particular, the individual components of the feature vectors which correspond to the<br />
dimension of the feature space are assumed to be independent of each other [11]. No<br />
relationships of the components such as substitutability and compensability may be<br />
regarded. To overcome this limitation, <strong>image</strong> <strong>similarity</strong> is measured in terms of vicinity<br />
in the feature space by means of the Earth Movers Distance function, introduced by
120 MJoM METALURGIJA - JOURNAL OF METALLURGY<br />
Rubner et al. [17]. Accordingly, differences in the three model variants arise from the<br />
Kxm<br />
Kxn<br />
way in which the <strong>image</strong> feature distributions [17] ( X , w)<br />
∈ R and ( Y,<br />
u)<br />
∈ R<br />
are modeled and incorporated into the EMD <strong>region</strong>-<strong>based</strong> <strong>image</strong> <strong>similarity</strong> <strong>modeling</strong>.<br />
user<br />
query<br />
mineral<br />
database<br />
color<br />
shape<br />
texture<br />
search<br />
engine<br />
mineral<br />
identification<br />
Figure 1. Proposed System Architecture<br />
<strong>distance</strong> is a very common <strong>distance</strong> function for the high-dimensional feature vectors,<br />
such as a feature histograms, it exhibits sever limitations with respect to <strong>similarity</strong><br />
measurements. In particular, the individual components of the feature vectors which<br />
correspond to the dimension of the feature space are assumed to be independent of each<br />
other [11]. No relationships of the components such as substitutability and<br />
compensability may be regarded. To overcome this limitation, <strong>image</strong> <strong>similarity</strong> is<br />
measured in terms of vicinity in the feature space by means of the Earth Movers<br />
Distance function, introduced by Rubner et al. [17]. Accordingly, differences in the<br />
three model variants arise from the way in which the <strong>image</strong> feature distributions [17]<br />
Kxm<br />
( X ,w ) ∈ R and<br />
Kxn<br />
( Y ,u ) ∈ R are modeled and incorporated into the EMD<br />
<strong>region</strong>-<strong>based</strong> <strong>image</strong> <strong>similarity</strong> <strong>modeling</strong>.<br />
3.1. Sample Preparation and Data Acquisition<br />
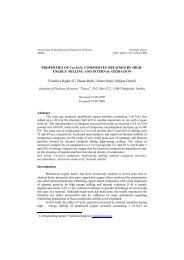
3000 mineral JPEG <strong>image</strong>s of different world-class specimen photos, from the<br />
Photo CD collection [2] have been used in the experimental evaluation. Mineral <strong>image</strong>s<br />
are 24 bit color depth and 1024 x 768 pixels high-quality of high resolution JPEG<br />
standard. Some of the database samples are shown in Fig. 1. Mineral identification from<br />
[2] is according to the mineral classification given in the Table I and has been given at<br />
[1]. According to [1], the identification key is <strong>based</strong> on simple mineralogical tests such<br />
as luster, hardness, color and physical description for the most common minerals an<br />
individual is likely to encounter. Minerals are ordered by their physical and optical
EARTH MOVER’S DISTANCE REGION-BASE IMAGE SIMILARITY … 121<br />
properties. The experimental evaluation is done on mineral species according to their<br />
color property (cf. Table I). This provides the ground truth necessary for the<br />
experimental evaluation.<br />
Figure 2. JPEG <strong>image</strong>s of different world-class specimen photos from Photo CD collection [2]<br />
Table 1 - Minerals by physical and optical properties table classified as in [1].<br />
Hardness,<br />
Streak, and<br />
Luster<br />
Metallic by<br />
Hardness and<br />
Streak<br />
Non-Metallic by<br />
Hardness and<br />
Streak<br />
With a Coloured<br />
Streak sorted by<br />
Streak Colour<br />
Physical Properties<br />
Cleavage<br />
and Fracture<br />
Density<br />
Optical Properties<br />
Refractive<br />
Index<br />
With No Cleavage Metallic by Density Isotropic<br />
With One Cleavage<br />
Non-Metallic by<br />
Density<br />
Uniaxial<br />
Colour<br />
Black<br />
Blue<br />
With Two Cleavages Biaxial . . . …<br />
With Three or more<br />
Cleavages<br />
Opaque<br />
Yellow<br />
3.2. Mineral Image Feature Representation<br />
Color features of mineral <strong>image</strong>s are represented by RGB color histograms,<br />
resulting in the 125-D feature vector. Similarity of the <strong>image</strong> <strong>region</strong>s is modeled in<br />
terms of <strong>similarity</strong> distributions of color distributions.<br />
Shape features of mineral <strong>image</strong>s are represented by the edge direction histogram<br />
[14], resulting in the 8-D feature vector. Similarity of the <strong>image</strong> <strong>region</strong>s is modeled in<br />
terms of <strong>similarity</strong> distributions of edge directions.<br />
Texture features of mineral <strong>image</strong>s are represented by the texture neighborhood<br />
[15], resulting in an 8-D feature vector. Similarity of the <strong>image</strong> <strong>region</strong>s is modeled in<br />
terms of <strong>similarity</strong> distribution of pixels brightness.<br />
3.3. Region-<strong>based</strong> Image Similarity Modeling<br />
Each sampled <strong>image</strong> is uniformly partitioned into <strong>region</strong>s (i.e., rectangular blocks<br />
of equal size) at five different resolutions, 1x1, 2x2, 3x3, 4x4 and 5x5<br />
(resolution ∈ {1,2,3,4,5 } . Accordingly, depending on the resolution, the number of<br />
<strong>region</strong>s per <strong>image</strong> for the above models is between 1 and 25 (number of
122<br />
MJoM<br />
METALURGIJA - JOURNAL OF METALLURGY<br />
<strong>region</strong>s ∈ {1,4,9,16,25 } . Each resolution corresponds to a different <strong>image</strong> <strong>similarity</strong><br />
model for each of the two EMD <strong>region</strong>-<strong>based</strong> model variants. More precisely, <strong>image</strong><br />
<strong>similarity</strong> is <strong>based</strong> on how to express the user's <strong>similarity</strong> criteria represented by means<br />
of low-level <strong>image</strong> feature representation (e.g. color, shape, texture etc.) and <strong>image</strong><br />
feature similarities (<strong>distance</strong> function, e.g. EMD, L 1 , L 2 etc.).<br />
3.4. Region-<strong>based</strong> Image Similarity Modeling Variants<br />
1) Image Area Model: When incorporating <strong>image</strong> feature distribution into EMD<br />
<strong>region</strong>-<strong>based</strong> <strong>image</strong> <strong>similarity</strong> <strong>modeling</strong>:<br />
• an <strong>image</strong> is described as the set of uniformly partitioned <strong>image</strong> <strong>region</strong>s, where each<br />
<strong>region</strong> is described by three finite discrete distributions of colour, shape and texture<br />
features.<br />
• for each <strong>image</strong> <strong>region</strong>, an element x i (1≤i≤25,x Є{color, shape, texture}) belonging<br />
to a vector x as a component of the histogram employed is equivalent to the<br />
“feature” defined in [17].<br />
• for each <strong>image</strong> <strong>region</strong>, w ( ∀ i,1 ≤ i ≤ 25,w ∈ [0,1 ]) corresponds to a percentage of<br />
i<br />
i<br />
the relative area of an <strong>image</strong> <strong>region</strong>, covered by the extracted feature vector x. It is<br />
equivalent to the “weight” defined in [17]. As all <strong>image</strong> <strong>region</strong>s cover the same<br />
percentage of the overall <strong>image</strong> area (in any resolution) and there are resolution x<br />
resolution <strong>image</strong> <strong>region</strong>s, all wi<br />
values are defined by:<br />
w<br />
i<br />
=<br />
tota<br />
1<br />
ln umberofreg<br />
ions<br />
m<br />
, ∑ w<br />
i = i<br />
i<br />
m<br />
= ∑ <strong>region</strong>area<br />
i = i<br />
i<br />
= 1 , ∀ i( 1 )<br />
representing the uniform weight's distribution of the <strong>image</strong> <strong>region</strong> areas within an<br />
<strong>image</strong>.<br />
• thus, an element describing the <strong>image</strong> <strong>region</strong> appears to be the feature vector (concatenation<br />
of the colour, shape and texture descriptors, feature vectors) of one <strong>region</strong>.<br />
element<br />
i<br />
= ( color<strong>region</strong><br />
+ shape<strong>region</strong><br />
+ texture<strong>region</strong><br />
,<strong>region</strong>area<strong>region</strong><br />
),<br />
1444444<br />
2444444<br />
3 144<br />
2443<br />
xi∈X<br />
wi<br />
∈W<br />
<strong>region</strong> ∈ { 1,...25 } .<br />
• the set of the vectors corresponding to all the <strong>region</strong>s of an <strong>image</strong> <strong>image</strong> is equivalent<br />
to the set:<br />
set<br />
Kxm<br />
<strong>image</strong> ( X ,w ) ∈ R ≡ { element } i<br />
≡ , i ∈ {1,...25 }.
EARTH MOVER’S DISTANCE REGION-BASE IMAGE SIMILARITY … 123<br />
the <strong>distance</strong> between two <strong>image</strong>s is the single EMD between two sets associated<br />
to the query <strong>image</strong> q, set q and a database <strong>image</strong> i and<br />
set EMD(<br />
q,i ) ≡ EMD( set set ) ≡ EMD({ element },{ element })<br />
i<br />
q,<br />
i<br />
q<br />
i<br />
When computing the EMD, <strong>region</strong>s having different positions in the two <strong>image</strong>s<br />
can be matched. This is not the case if a Lp<br />
<strong>distance</strong> functions are used between the<br />
long vectors grouping the feature vectors of all the <strong>region</strong>s in an <strong>image</strong>.<br />
1) Range Model: When incorporating <strong>image</strong> feature distribution into EMD<br />
<strong>region</strong>-<strong>based</strong> <strong>image</strong> <strong>similarity</strong> modelling, the following definitions are applied:<br />
• an <strong>image</strong> is described as the set of uniformly partitioned <strong>image</strong> <strong>region</strong>s, where each<br />
<strong>region</strong> is described by three finite discrete distributions of colour, shape and texture<br />
features.<br />
• for each <strong>image</strong> <strong>region</strong>, ( ∀ i,1 ≤ i ≤ 25, x ∈{ colour,shape,texture }) belonging to a<br />
w i<br />
vector X, as a component of the histogram employed is equivalent to the “weight”<br />
defined in [17].<br />
• for each <strong>image</strong> <strong>region</strong>, an element (1 ≤ i ≤ 25, x ∈{ color,shape,texture }) is<br />
x i<br />
equivalent to the “feature” defined in [17].<br />
• thus, an element describing the <strong>image</strong> <strong>region</strong> appears to be a component of the<br />
feature vector of either the colour, shape or texture descriptor of one <strong>region</strong> and a<br />
component of the vector: element ( x ,w ),( 5 )<br />
i<br />
i<br />
• the vector corresponding to a single <strong>image</strong> <strong>region</strong> of an <strong>image</strong> <strong>image</strong> is equivalent<br />
Kxm<br />
to the set : set ≡ ( X ,w ), ∈ R ≡ { element } (6 ) , i ∈ {1,...,25 }<br />
<strong>region</strong><br />
• for every <strong>region</strong>, <strong>distance</strong> between <strong>region</strong>s corresponding to the query <strong>image</strong> q and<br />
a database <strong>image</strong> i having same position is calculated as the average of the three<br />
EMD <strong>distance</strong>s computed for three discrete distributions. This implies that for each<br />
<strong>region</strong> and its feature, there is a single EMD calculated for each <strong>image</strong> feature.<br />
1<br />
EMD<strong>region</strong> ( q,i ) = ( EMDcolour<br />
( q,i ) + EMDshape( q,i ) + EMD<br />
3<br />
i<br />
i<br />
texture<br />
( q,i )),(7 )<br />
• the overall <strong>image</strong> <strong>distance</strong> between query <strong>image</strong> q and a database <strong>image</strong> i is<br />
calculated as the average of EMD <strong>distance</strong>s computed on the <strong>region</strong>s having same<br />
position.
124<br />
MJoM<br />
METALURGIJA - JOURNAL OF METALLURGY<br />
1 R<br />
EMD Range ( q,i ) ≡ ∑ EMDRe gion(<br />
q,i ), ∀R<br />
∈{1,4,9,16,25 },( 8 )<br />
R Re gion=<br />
1<br />
where R denotes number of segmented <strong>image</strong> <strong>region</strong>s. The reason for this is that the<br />
arithmetic mean (or more generally a subset of a class of the averaging operator) is<br />
employed by the most the most <strong>image</strong> <strong>similarity</strong> models.<br />
Thus, in contrast to IAM or Cross-resolution model but similar to Lp <strong>distance</strong><br />
functions, when computing the EMD, only <strong>region</strong>s having same positions in the two<br />
<strong>image</strong>s can be matched.<br />
1) Cross-Resolution Image Similarity Modelling Model:<br />
From the viewpoint of the number of <strong>region</strong>s used to represent an <strong>image</strong> content<br />
when approximating user's <strong>similarity</strong> criteria, most of the <strong>image</strong> <strong>similarity</strong> models [12],<br />
[16], [18], [19] are fixed ones, with a respect to a finite number of <strong>region</strong>s (objects)<br />
produced by different segmentation techniques. The limitation of such fixed <strong>image</strong><br />
<strong>similarity</strong> models is that the existing segmentation algorithms are inaccurate, i.e., the<br />
resulting <strong>region</strong>s are roughly, if at all, corresponding to the objects appearing in the<br />
<strong>image</strong>. To adequately combine the characteristics of different segmentations (expressed<br />
as a single <strong>image</strong> <strong>similarity</strong> model) such that negative peculiarities of the individual<br />
segmentations can be masked by others, a cross-resolution model as a special variant is<br />
proposed which takes into account all five <strong>region</strong>-<strong>based</strong> <strong>image</strong> <strong>similarity</strong> models<br />
simultaneously when computing the <strong>image</strong> <strong>similarity</strong>. Initially, each of the five<br />
<strong>region</strong>-<strong>based</strong> <strong>image</strong> <strong>similarity</strong> models represents an <strong>image</strong> when querying the <strong>image</strong>s<br />
within a database on its own as finite number of <strong>region</strong>s (objects). Next, a multi <strong>image</strong><br />
representation expressed as a set of multi <strong>image</strong> <strong>similarity</strong> models, each of which is in a<br />
different resolution is obtained as a mixture of all <strong>region</strong>s from all five <strong>region</strong>-<strong>based</strong><br />
<strong>image</strong> <strong>similarity</strong> models. All <strong>region</strong>s from five fixed-resolution <strong>region</strong>-<strong>based</strong> <strong>image</strong><br />
<strong>similarity</strong> models are represented as equally important. A single EMD computation is<br />
utilized on all <strong>region</strong>s to find out the <strong>distance</strong> between a set of <strong>region</strong>s providing an<br />
overall <strong>similarity</strong> between two <strong>image</strong>s. According to its definition, the match between<br />
two <strong>image</strong>s is obtained by mixing all <strong>region</strong>s at all different levels. Regions from each<br />
fixed-resolution are treated as a weighted point sets. The way in which cross-resolution<br />
is modelled is as following:<br />
• an <strong>image</strong> is described as the set of all uniformly partitioned <strong>image</strong> <strong>region</strong>s,<br />
provided by five uniform <strong>image</strong> partitionings. Each <strong>region</strong> is described by<br />
three finite discrete distributions of colour, shape and texture features.<br />
• for each <strong>image</strong> <strong>region</strong>, an element (1 ≤ i ≤ 25, x ∈{ color,shape,texture })<br />
belonging to a vector x as a component of the histogram employed is<br />
x i
EARTH MOVER’S DISTANCE REGION-BASE IMAGE SIMILARITY … 125<br />
equivalent to the “feature” defined in [17]. It is modeled in the same way as<br />
for IAM model, described in III-D.1.<br />
• thus, an element describing the <strong>image</strong> <strong>region</strong> in a single (fixed) resolution<br />
appears to be the feature vector (concatenation of the colour, shape and<br />
texture descriptors) of one <strong>region</strong>, just as modelled for the case of IAM model<br />
in III-D.1.<br />
• let a term Cross-Resolution Set denote the set of the vectors corresponding to<br />
all the <strong>image</strong> <strong>region</strong>s in a fixed resolutions:<br />
Cross − Re solutionSet ≡ {( elementi<br />
,<strong>region</strong>areai<br />
)}, ∀i<br />
∈{1,...,25 },resolution ∈{1,...,5 },( 9 )<br />
14444<br />
24444<br />
3<br />
fixedresolution<br />
thus each of the associated Cross-resolution Sets for both query <strong>image</strong> q and a database<br />
<strong>image</strong> i consists of five Resolution Sets, where each Resolution Set is a descriptor of an<br />
<strong>image</strong> in a fixed resolution.<br />
Cross − ResolutionSet( q ) ≡ {ResolutionSet1(<br />
q )},....,{ResolutionSet5(<br />
q )},<br />
1444<br />
24443<br />
1444<br />
24443<br />
144444444<br />
resolution1<br />
244444444<br />
resolution5<br />
3<br />
cross−resolution(<br />
q ))<br />
Cross −<br />
Re solutionSet( i )<br />
≡ {Re solutionSet ( i )},....,{Re solutionSet5( i )},<br />
1444<br />
2444<br />
1<br />
3 1444<br />
24443<br />
144444444<br />
resolution1<br />
244444444<br />
resolution5<br />
3<br />
cross−resolution(<br />
i ))<br />
• the <strong>distance</strong> between two <strong>image</strong>s is the single EMD between two sets associated<br />
to the query <strong>image</strong> q, Cross-Resolution Set(q) and a database <strong>image</strong> i,<br />
Cross-Resolution Set(i).<br />
EMD( q,i )<br />
≡ EMD{ Cross = Re solutionSet( q ),Cross = Re solutionSet( i )},(10 )<br />
14444<br />
24444<br />
3 14444<br />
24444<br />
3<br />
cross−resolution(<br />
q )<br />
cross−resolution(<br />
i )<br />
• when computing the EMD <strong>distance</strong> between two sets (associated to two <strong>image</strong>s<br />
q and database <strong>image</strong> i), <strong>region</strong>s at different resolutions can now be matched<br />
(though, weights appear to be different for different resolutions).<br />
When computing the EMD, <strong>region</strong>s having different positions in the two <strong>image</strong>s<br />
can be matched. This is not the case if a Lp<br />
<strong>distance</strong> functions are used between the<br />
long vectors grouping the feature vectors of all the <strong>region</strong>s in an <strong>image</strong>.
126<br />
MJoM<br />
METALURGIJA - JOURNAL OF METALLURGY<br />
4. EXPERIMENTAL EVALUATION<br />
All the experiments are performed on AMD Athlon 64-bit Processor Machine,<br />
with 256 MB RAM Memory. Mineral database [1] is used when conducting<br />
experiments, containing 3,000 <strong>image</strong>s divided into 30 semantic categories. Test<br />
database originate from the well-known mineral <strong>image</strong> collection [1], used for the<br />
evaluation of mineral <strong>image</strong> retrieval systems. Partitioning of each database into<br />
semantic categories is determined by the creators of the database <strong>based</strong> on the optical<br />
(color) characteristics of the minerals [1]. The query <strong>image</strong> and the set of candidate<br />
<strong>image</strong>s are both predefined by the testing database. The semantic categories define the<br />
ground truth so that, for a given query <strong>image</strong>, the relevant <strong>image</strong>s are considered to be<br />
those and only those that belong to the same semantic category as the query <strong>image</strong>. This<br />
implies that the number of relevant <strong>image</strong>s for a given query <strong>image</strong> equals the number<br />
of <strong>image</strong>s in the category to which that <strong>image</strong> belongs.<br />
The performance measures are: (1) precision [P.], (2) weighted precision [W.P.],<br />
(3) average rank [A.R.]. All the performance measures are computed for each query<br />
<strong>image</strong>, <strong>based</strong> on the given ground truth. Since each <strong>image</strong>, in each test database, is used<br />
as a query, all the performance measures are averaged for each test database<br />
(database-wise average performance). Having defined the computation method of the<br />
<strong>image</strong> <strong>similarity</strong> <strong>based</strong> on low-level <strong>image</strong> features, given a query <strong>image</strong>, all databases<br />
<strong>image</strong>s are ranked in ascending order with respect to their <strong>distance</strong> to the query <strong>image</strong>.<br />
For each query, all the performance measures are computed.<br />
4.1. Cross and Resolution wise comparison to Global EMD Models<br />
As shown in the Table II, it can be seen that, in terms of retrieval effectiveness<br />
measured by P., W.P. and A.R. that IAM model generally performs better than the<br />
Range model in all resolutions. In the case of the Range model, in most cases, global<br />
<strong>image</strong> representation (resolution 1x1) provides optimal retrieval performance. It is<br />
decreased by EMD <strong>region</strong>-<strong>based</strong> <strong>modeling</strong>. In case of the IAM model, the opposite is<br />
observed. Even though each pair of matching <strong>region</strong>s employs a single EMD<br />
computation, contrary to expectations, the IAM model outperforms the Range model in<br />
both global and <strong>region</strong>-<strong>based</strong> <strong>image</strong> <strong>similarity</strong> <strong>modeling</strong>. The first reason for the<br />
unexpected result is that, in the case of the Range model, the distribution of the<br />
extracted <strong>image</strong> feature values that are used as “weight“ is non-uniform. This is<br />
contrary to the first model, in which the distribution of such values is uniform.<br />
Furthermore, in terms of shape and texture <strong>image</strong> features, extracted feature values<br />
modeled as “weights“ show distribution of edge directions (texture neighborhood<br />
pixels) over eight quantized ranges. In the case of color, these are the distributions of<br />
<strong>image</strong> pixel values quantized over 125-D ranges. On the other hand, with respect to the<br />
first model, <strong>modeling</strong> “weight“ is completely independent of <strong>image</strong> visual content, as it
EARTH MOVER’S DISTANCE REGION-BASE IMAGE SIMILARITY … 127<br />
is not reflected throughout <strong>modeling</strong> the “weight“. Thus capturing underlying <strong>image</strong><br />
semantics is expected to be better approximated by the Range model than in the case<br />
when the “weight“ is modeled independently from the actual visual <strong>image</strong> content, and<br />
the overall EMD <strong>distance</strong> merely depends on the cost matrix predefined by the<br />
extracted feature values. However, the experimental results could be explained by the<br />
Range model high data dependency (extracted feature methods used) when <strong>modeling</strong><br />
feature distributions.<br />
When compared to the cross-resolution EMD model, both IAM and Range are<br />
outperformed (Table II). The difference between the cross-resolution model and the<br />
global IAM and Range models ranges between 10% and 30%. The integration of five<br />
<strong>region</strong>-<strong>based</strong> <strong>image</strong> <strong>similarity</strong> models (each one for different resolution, into the overall<br />
<strong>image</strong> <strong>similarity</strong> by EMD matching, accounts for better perceptual <strong>similarity</strong> than the<br />
IAM and Range models. Five fixed-resolution <strong>region</strong>-<strong>based</strong> <strong>image</strong> <strong>similarity</strong> models<br />
employed within the cross-resolution model provide additional information that is not<br />
available to the IAM and Range models. The higher discriminative power of the <strong>image</strong><br />
visual content is ordered by the simultaneous use of five resolutions when <strong>modeling</strong><br />
<strong>image</strong> <strong>similarity</strong>.<br />
As seen in Table II, IAM Model performs optimally when compared to city-block<br />
<strong>distance</strong> function both for global and <strong>region</strong>-<strong>based</strong> <strong>image</strong> <strong>similarity</strong> <strong>modeling</strong>. The<br />
difference in retrieval performance between the IAM model and Euclidean <strong>distance</strong> is<br />
smaller compared to the Range model.<br />
The larger drop in retrieval performance appears for the Range model compared to<br />
the Euclidean and city-block <strong>distance</strong>. In most cases, optimal retrieval performance for<br />
the Range model is provided by global <strong>image</strong> representation.<br />
In terms of the effect of <strong>region</strong>-<strong>based</strong> <strong>modeling</strong> on retrieval efficiency, it is noted<br />
that the Euclidean and city-block <strong>distance</strong>s have a tendency to behave between the IAM<br />
and Range models on the mineral database. The retrieval performance is slightly<br />
improved (decreased) by increasing the number of <strong>region</strong>s employed. As shown in<br />
Table II in a similar fashion to the Range model, the <strong>region</strong>-<strong>based</strong> <strong>modeling</strong> decreases<br />
retrieval performance when Euclidean or city-block <strong>distance</strong> functions are employed.<br />
Table 2 - Resoltion wise evaluation of the proposed emd <strong>region</strong>-<strong>based</strong> models on<br />
mineral <strong>image</strong> database: average values of the retreival precision (p.), weighted<br />
precision (w.p.), average rank are given. each value is an average of 3,000 queris<br />
evaluated over the mindeal <strong>image</strong> database<br />
Res City-block Euclidean IAM Range<br />
P.<br />
[%]<br />
W.P.<br />
[%]<br />
A.R.<br />
P<br />
[%]<br />
W.P.<br />
[%]<br />
A.R.<br />
P<br />
[%]<br />
W.P.<br />
[%]<br />
A.R. P.<br />
[%]<br />
W.P.<br />
[%]<br />
A.R.<br />
1x1 46.35 62.72 131.62 51.60 68.45 118.25 51.60 68.45 118.25 36.97 53.39 155.1<br />
2x2 44.74 60.81 137.37 49.88 66.29 123.74 52.59 69.39 116.17 35.11 50.66 183.25
128<br />
MJoM<br />
METALURGIJA - JOURNAL OF METALLURGY<br />
3x3 42.40 58.52 143.43 33.29 64.19 130.02 53.74 70.46 114.59 34.86 50.59 165.2<br />
4x4 40.4 56.35 149.6 32.92 43.63 136.93 54.38 71.13 113.14 33.15 48.69 170.98<br />
5x5 38.43 54.22 156.55 43.76 60.21 144.89 55.2 71.84 111.97 30.73 45.23 173.17<br />
P.<br />
[%]<br />
W.P.<br />
[%]<br />
A. R.<br />
C.R. 62.39 73.58 67.44<br />
5. CONCLUSION<br />
EMD <strong>region</strong>-<strong>based</strong> <strong>image</strong> <strong>similarity</strong> <strong>modeling</strong> and its effect on the retrieval<br />
performance applied to mineral <strong>image</strong> <strong>similarity</strong> <strong>modeling</strong> are investigated. By<br />
complementary modification of the way in which the cost matrix and feature<br />
distributions are modeled, two EMD <strong>region</strong>-<strong>based</strong> <strong>image</strong> <strong>similarity</strong> models are<br />
proposed. An additional special cross-resolution EMD <strong>region</strong> <strong>based</strong> <strong>image</strong> <strong>similarity</strong><br />
model is also proposed. Comparison and analysis of the <strong>image</strong> retrieval performance of<br />
the three EMD <strong>region</strong>-<strong>based</strong> <strong>image</strong> <strong>similarity</strong> models is performed. Comparison to<br />
representative <strong>region</strong>-<strong>based</strong> <strong>image</strong> <strong>similarity</strong> models employing Euclidean and<br />
city-block <strong>distance</strong> function is also performed.<br />
The evaluation is carried out on a test database, containing 3,000 <strong>image</strong>s in 30<br />
semantic categories. In total, over 900,000 queries are executed, <strong>based</strong> on which the<br />
(weighted) precision and average rank are computed.<br />
The research strategy in terms of the <strong>image</strong> <strong>similarity</strong> <strong>modeling</strong> applied to the<br />
selection of <strong>similarity</strong> criteria seems to be the most important aspect and strongly<br />
influences the quality of results derived from an analysis of this kind. When employed<br />
within the EMD <strong>region</strong>-<strong>based</strong> <strong>image</strong> <strong>similarity</strong> <strong>modeling</strong>, cross-resolution model<br />
provides optimal retrieval performance on mineral database. The difference in the<br />
average retrieval precision compared to the two other proposed EMD <strong>region</strong>-<strong>based</strong><br />
<strong>image</strong> <strong>similarity</strong> models is between 10% and 30%. Contrary to expectations, though<br />
possessing the highest computation complexity, the Range model shows the worst<br />
retrieval performance. The results of the evaluation suggest that, when <strong>modeling</strong><br />
<strong>region</strong>-<strong>based</strong> <strong>similarity</strong> <strong>modeling</strong> within an EMD framework, in terms of the low-level<br />
<strong>image</strong> features, the discretization of the point feature distribution provides better<br />
retrieval performance than when low-level <strong>image</strong> features are modeled as point<br />
weights. When <strong>modeling</strong> <strong>image</strong> <strong>similarity</strong>, by allowing different <strong>similarity</strong> criteria with<br />
a different number of <strong>region</strong>-<strong>based</strong> <strong>similarity</strong> models, EMD cross-resolution <strong>modeling</strong><br />
provides optimal retrieval performance. Such experimental evaluation might be helpful<br />
for further understanding of EMD <strong>region</strong>-<strong>based</strong> <strong>image</strong> <strong>similarity</strong> <strong>modeling</strong> in various<br />
industrial domains, such as mineral species recognition and identification.
EARTH MOVER’S DISTANCE REGION-BASE IMAGE SIMILARITY … 129<br />
5. REFERENCES<br />
[1] Mineral of the Month Club, http://webmineral.com/specimens.shtml<br />
[2] http://www.excaliburmineral.com/cdintro.htm<br />
[3] Pong T. C., Haralick R. M., Craig J.R., Yoon R. H., Choi W. Z., The application of<br />
<strong>image</strong> analysis techniques to mineral processing, Pattern Recognition Letters,<br />
Vol. 2 (2), (1983), pp. 117–123<br />
[4] Bonifazi G., Digital multispectral techniques and automated <strong>image</strong> analysis<br />
procedures for industrial ore <strong>modeling</strong>, Minerals Engineering, Vol. 8(7), (1995),<br />
pp. 779–794<br />
[5] Yan B., McJunkin T.R., Stoner D.L., Scott J.R., Validation of fuzzy logic method<br />
for automated mass spectral classification for mineral imaging, Applied Surface<br />
Science, Vol. 253(4), (2006), pp. 2011–2017<br />
[6] Gallagher M., Deacon P., Neural Networks and the Classification of Mineral<br />
Samples using X-Ray Spectra in Proc. of the 9th International Conference on<br />
Neural Information Processing, ICONIP 02. Vol. 5., 2002.<br />
[7] Wang W., Li L., Image Analysis and Computer Vision for Mineral Froth, in Proc.<br />
of the IEEE International Conference on Mechatronics & Automation,, Canada,<br />
2005.<br />
[8] Jones, M.P., Designing an X-ray <strong>image</strong> analyser for measuring mineralogical data,<br />
XIV Int. Min. Proc. Cong., Toronto, VIII-4.1 -4.17, 1982.<br />
[9] Miller, P.R., Reid, A.F., Zuiderwyk, M.A., QEM*SEM <strong>image</strong> analysis in the<br />
determination of modal essays, mineral association and mineral liberation, XIV<br />
Int. Min. Proc. Cong., Toronto, VIII-3.1 -3.20, 1982.<br />
[10] Petruk, W., The capabilities of the microprobe Kotron <strong>image</strong> analysis system:<br />
application to mineral analysis, in Scanning microscopy, Academic Press, New<br />
York, 1973.<br />
[11] Ankerst M., Kastenmueller G., Kriegel, H.P., Seidl, T., Nearest Neighbor<br />
Classification in 3D Protein Databases, in Proc. of 7th Intl. Conf. on Intelligent<br />
Systems for Molecular Biology, (ISMB99), 1999.<br />
[12] Jing F., Li M., Zhang H.J., Zhang B., An efficient and effective <strong>region</strong>-<strong>based</strong> <strong>image</strong><br />
retrieval framework in: IEEE Transactions on Image Processing, Vol. 13(5),<br />
(2004), pp. 699 - 709<br />
[13] Mengko, T.R., Susilowati, Y., Mengko, R., Leksono, B.E., Digital <strong>image</strong><br />
processing technique in rock forming minerals identification in: Circuits and<br />
Systems, 2000. IEEE APCCAS 2000. The 2000 IEEE Asia-Pacific Conference on<br />
4-6 Dec. (2000), pp. 441 - 444
130 MJoM METALURGIJA - JOURNAL OF METALLURGY<br />
[14] Brandt, S., Laaksonen, J., Oja, E., 2000. Statistical shape features in content-<strong>based</strong><br />
<strong>image</strong> retrieval. In: Proc. of 15th Int. Conf. on Pattern Recognition (ICPR-2000)<br />
Vol.2, Barcelona, Spain, pp. 1066-1069.<br />
[15] Laaksonen, J., Oja, E., Koskela, M., Brandt, S., Analyzing low-level visual<br />
features using content-<strong>based</strong> <strong>image</strong> retrieval, In: Proc. 7th Int. Conf. on Neural<br />
Information Processing (ICONIP'00), Taejon, Korea, (2000), pp. 1333–1338.<br />
[16] Natsev, A., Rastogi, R., Shim, K., WALRUS: A <strong>similarity</strong> retrieval algorithm for<br />
<strong>image</strong> databases, In: Proc. of ACM SIGMOD Int. Conf. on Management of Data,<br />
Philadephia, USA, (1999), pp. 395–406.<br />
[17] Rubner, Y., Tomasi, C., Guibas, J.L., The Earth Mover's Distance as a Metric for<br />
Image Retrieval, International Journal of Computer Vision 40(2), (2000), pp.<br />
99–121.<br />
[18] Stejić, Z., Takama, Y., Hirota, K., Comprehensive Comparison of Region-Based<br />
Image Similarity Models, FQAS 2004., 390–403.<br />
[19] Wang, J. Z., Lia J., Wiederhold, G., SIMPLIcity: Semantics-sensitive Integrated<br />
Matching for Picture LIbraries, IEEE Trans. Pattern Analysis and Machine<br />
Intelligence 23(9), (2001), pp. 947–963.