GEOMORPHOLOGY REPORT - CRC LEME
GEOMORPHOLOGY REPORT - CRC LEME GEOMORPHOLOGY REPORT - CRC LEME
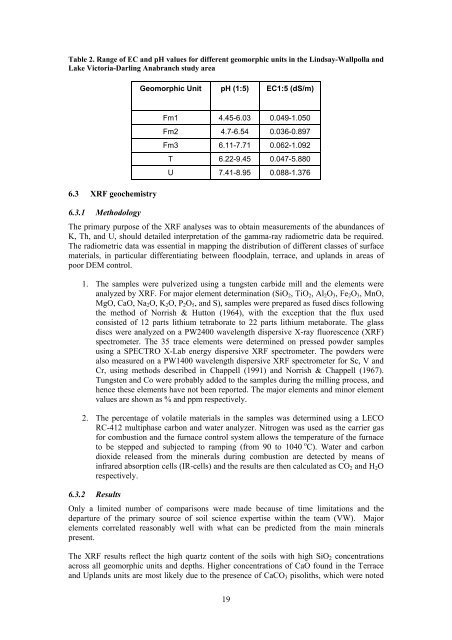
Table 2. Range of EC and pH values for different geomorphic units in the Lindsay-Wallpolla and Lake Victoria-Darling Anabranch study area Geomorphic Unit pH (1:5) EC1:5 (dS/m) 6.3 XRF geochemistry 6.3.1 Methodology Fm1 4.45-6.03 0.049-1.050 Fm2 4.7-6.54 0.036-0.897 Fm3 6.11-7.71 0.062-1.092 T 6.22-9.45 0.047-5.880 U 7.41-8.95 0.088-1.376 The primary purpose of the XRF analyses was to obtain measurements of the abundances of K, Th, and U, should detailed interpretation of the gamma-ray radiometric data be required. The radiometric data was essential in mapping the distribution of different classes of surface materials, in particular differentiating between floodplain, terrace, and uplands in areas of poor DEM control. 1. The samples were pulverized using a tungsten carbide mill and the elements were analyzed by XRF. For major element determination (SiO 2 , TiO 2 , Al 2 O 3 , Fe 2 O 3 , MnO, MgO, CaO, Na 2 O, K 2 O, P 2 O 5 , and S), samples were prepared as fused discs following the method of Norrish & Hutton (1964), with the exception that the flux used consisted of 12 parts lithium tetraborate to 22 parts lithium metaborate. The glass discs were analyzed on a PW2400 wavelength dispersive X-ray fluorescence (XRF) spectrometer. The 35 trace elements were determined on pressed powder samples using a SPECTRO X-Lab energy dispersive XRF spectrometer. The powders were also measured on a PW1400 wavelength dispersive XRF spectrometer for Sc, V and Cr, using methods described in Chappell (1991) and Norrish & Chappell (1967). Tungsten and Co were probably added to the samples during the milling process, and hence these elements have not been reported. The major elements and minor element values are shown as % and ppm respectively. 2. The percentage of volatile materials in the samples was determined using a LECO RC-412 multiphase carbon and water analyzer. Nitrogen was used as the carrier gas for combustion and the furnace control system allows the temperature of the furnace to be stepped and subjected to ramping (from 90 to 1040 o C). Water and carbon dioxide released from the minerals during combustion are detected by means of infrared absorption cells (IR-cells) and the results are then calculated as CO 2 and H 2 O respectively. 6.3.2 Results Only a limited number of comparisons were made because of time limitations and the departure of the primary source of soil science expertise within the team (VW). Major elements correlated reasonably well with what can be predicted from the main minerals present. The XRF results reflect the high quartz content of the soils with high SiO 2 concentrations across all geomorphic units and depths. Higher concentrations of CaO found in the Terrace and Uplands units are most likely due to the presence of CaCO 3 pisoliths, which were noted 19
when sampling. This is also reflected in the higher pH of the Terrace and Uplands units (Table 3). The K, U, and Th concentrations generally reflect that seen in airborne gamma ray radiometric data illustrated in Appendix 4, with higher concentrations of the three radioelements in the units found within the Murray River Trench, and lower concentrations in the Uplands. 6.4 XRD mineralogy 6.4.1 Methods X-Ray defraction is an effective way of accurately determining mineralogy. Mineralogy is important to the study the mineral suite can influence conductivity and clay types effect porosity and permeability and surface recharge behaviour. Samples were analysed using both semi-quantitative XRD and qualitative PIMA methods. Samples for XRD were scanned on a Siemens D500 Diffractometer, from 2° to 70° 2θ, in 1° increments, 2 seconds per degree, using a Cu anode X-ray tube. Minerals were identified using Bruker Diffrac plus and Siroquant V3 was used to quantify minerals. The samples are characterised by simple scans, containing predominant Quartz peaks with accessory mica (probably Muscovite), feldspar and clay (probably Kaolin). Specific feldspars have been identified according to best-fit of peaks. Further petrological work would be required to conclusively identify feldspars. 6.4.2 Results XRD shows that the samples all contain quartz, muscovite, and microcline. Kaolinite and albite are present in almost all. These results are consistent with the samples being composed of two sediment types, a slightly feldspathic micaceous quartz sand and kaolinitic quartz silt with very fine-grained detrital muscovite. The relationship between distribution of clay species and provenance would be worth further investigation (c.f. Ginegle and de Deckker 2004). However it is beyond the scope of this investigation as it would require clay-specific mineral separates to be prepared. Table 3. Mean values of selected XRF analyses Geomorphic Unit Fm1 Fm2 Fm3 T U Depth Al2O CaO Cl Fe2O3 K2O Na2O S (%) SiO2 Th (%) U (%) (m) 3 (%) (%) (%) (%) (%) (%) (%) 0.0-0.1 10.75 0.44 0.548 3.24 2.07 0.46 0.460 72.26 0.01960 0.00722 0.1-0.2 10.13 0.38 0.367 2.83 2.09 0.49 0.281 76.99 0.01160 0.00410 0.2-0.3 9.60 0.36 0.361 2.66 1.97 0.50 0.195 78.64 0.01320 0.00494 0.0-0.1 14.31 0.47 1.296 4.74 2.22 0.50 0.283 64.75 0.01400 0.00670 0.1-0.2 13.91 0.45 0.955 4.51 2.19 0.57 0.206 66.91 0.02050 0.00535 0.2-0.3 14.10 0.45 0.822 4.59 2.18 0.58 0.199 66.44 0.02000 0.00540 0.0-0.1 10.36 0.49 0.172 2.93 2.20 0.58 0.160 75.47 0.01925 0.00708 0.1-0.2 11.02 0.50 0.371 3.23 2.21 0.58 0.151 74.62 0.01325 0.00565 0.2-0.3 11.52 0.53 0.639 3.45 2.24 0.61 0.163 73.54 0.01750 0.00465 0.0-0.1 12.64 1.81 2.440 4.63 1.99 0.51 0.329 66.52 0.01460 0.00084 0.1-0.2 10.99 1.83 2.303 3.98 1.77 0.51 0.300 70.38 0.01720 0.00556 0.2-0.3 10.63 1.67 3.319 3.85 1.74 0.62 0.280 71.86 0.01140 0.00292 0.0-0.1 5.23 3.48 0.082 1.92 0.99 0.00 0.244 79.92 0.01025 0.00243 0.1-0.2 4.97 3.71 0.473 1.81 0.93 0.07 0.209 81.08 0.01375 0.00388 0.2-0.3 4.91 5.65 0.532 1.80 0.87 0.07 0.296 76.15 0.00650 0.00213 20
- Page 1 and 2: CRCLEME Cooperative Research Centre
- Page 3 and 4: This report (CRC LEME Open File Rep
- Page 5 and 6: Lindsay and Wallpolla Creeks are si
- Page 7 and 8: TABLE OF CONTENTS _Toc224538156 1 I
- Page 9 and 10: List of Tables Table 1. Association
- Page 11 and 12: The main objective of the studies r
- Page 13 and 14: 4. Identification of the high recha
- Page 15 and 16: The SRTM was used as to provide the
- Page 17 and 18: Figure 6. Compartmentalisation of t
- Page 19 and 20: Dune on terrace Alluvial terrace Yo
- Page 21 and 22: Intermediate floodplain Modern floo
- Page 23 and 24: Locations of sample sites are given
- Page 25 and 26: 6.1 Granulometry 6.1.1 Methodology
- Page 27: Table 2). Mean pH and EC profiles a
- Page 31 and 32: Figure 12. SPOT image of Wallpolla
- Page 33 and 34: REFERENCES Bowler, J.M. and Harford
- Page 35 and 36: APPENDIX 1. ASTER data and interpre
- Page 37 and 38: APPENDIX 2. SPOT Data and interpret
- Page 39 and 40: APPENDIX 3. DEM data and interpreta
- Page 41 and 42: APPENDIX 4. Gamma-ray data 500000 (
- Page 43 and 44: APPENDIX 6. Site Descriptions and D
- Page 45 and 46: Site 3 South Settlement road, ~20 m
- Page 47 and 48: Site 5 Western end of Keera Road, s
- Page 49 and 50: Site 7 Eastern end of Old Mail Rd t
- Page 51 and 52: Site 12 Further to west along Old M
- Page 53 and 54: Site 14 Dedmens drive, across aband
- Page 55 and 56: Site 16 Same area as previous sampl
- Page 57 and 58: Site 18 Same location as 17, interm
- Page 59 and 60: Site 20 Adjacent to previous site C
- Page 61 and 62: Site 22 2 km east of Finnegans brid
- Page 64 and 65: APPENDIX 7: Analytical Results Appe
- Page 66 and 67: Appendix 7.2: Lindsay-Wallpolla Las
- Page 68 and 69: Appendix 7.3: Lindsay-Wallpolla XRF
- Page 70 and 71: 16 200709 1929587 20-30 Fm1 7 0.611
- Page 72 and 73: Site Number Depth LEME ID Sample #
Table 2. Range of EC and pH values for different geomorphic units in the Lindsay-Wallpolla and<br />
Lake Victoria-Darling Anabranch study area<br />
Geomorphic Unit pH (1:5) EC1:5 (dS/m)<br />
6.3 XRF geochemistry<br />
6.3.1 Methodology<br />
Fm1 4.45-6.03 0.049-1.050<br />
Fm2 4.7-6.54 0.036-0.897<br />
Fm3 6.11-7.71 0.062-1.092<br />
T 6.22-9.45 0.047-5.880<br />
U 7.41-8.95 0.088-1.376<br />
The primary purpose of the XRF analyses was to obtain measurements of the abundances of<br />
K, Th, and U, should detailed interpretation of the gamma-ray radiometric data be required.<br />
The radiometric data was essential in mapping the distribution of different classes of surface<br />
materials, in particular differentiating between floodplain, terrace, and uplands in areas of<br />
poor DEM control.<br />
1. The samples were pulverized using a tungsten carbide mill and the elements were<br />
analyzed by XRF. For major element determination (SiO 2 , TiO 2 , Al 2 O 3 , Fe 2 O 3 , MnO,<br />
MgO, CaO, Na 2 O, K 2 O, P 2 O 5 , and S), samples were prepared as fused discs following<br />
the method of Norrish & Hutton (1964), with the exception that the flux used<br />
consisted of 12 parts lithium tetraborate to 22 parts lithium metaborate. The glass<br />
discs were analyzed on a PW2400 wavelength dispersive X-ray fluorescence (XRF)<br />
spectrometer. The 35 trace elements were determined on pressed powder samples<br />
using a SPECTRO X-Lab energy dispersive XRF spectrometer. The powders were<br />
also measured on a PW1400 wavelength dispersive XRF spectrometer for Sc, V and<br />
Cr, using methods described in Chappell (1991) and Norrish & Chappell (1967).<br />
Tungsten and Co were probably added to the samples during the milling process, and<br />
hence these elements have not been reported. The major elements and minor element<br />
values are shown as % and ppm respectively.<br />
2. The percentage of volatile materials in the samples was determined using a LECO<br />
RC-412 multiphase carbon and water analyzer. Nitrogen was used as the carrier gas<br />
for combustion and the furnace control system allows the temperature of the furnace<br />
to be stepped and subjected to ramping (from 90 to 1040 o C). Water and carbon<br />
dioxide released from the minerals during combustion are detected by means of<br />
infrared absorption cells (IR-cells) and the results are then calculated as CO 2 and H 2 O<br />
respectively.<br />
6.3.2 Results<br />
Only a limited number of comparisons were made because of time limitations and the<br />
departure of the primary source of soil science expertise within the team (VW). Major<br />
elements correlated reasonably well with what can be predicted from the main minerals<br />
present.<br />
The XRF results reflect the high quartz content of the soils with high SiO 2 concentrations<br />
across all geomorphic units and depths. Higher concentrations of CaO found in the Terrace<br />
and Uplands units are most likely due to the presence of CaCO 3 pisoliths, which were noted<br />
19


