GEOMORPHOLOGY REPORT - CRC LEME
GEOMORPHOLOGY REPORT - CRC LEME
GEOMORPHOLOGY REPORT - CRC LEME

You also want an ePaper? Increase the reach of your titles
YUMPU automatically turns print PDFs into web optimized ePapers that Google loves.
<strong>CRC</strong><strong>LEME</strong><br />
Cooperative Research Centre for<br />
Landscape Environments<br />
and Mineral Exploration<br />
OPEN FILE<br />
<strong>REPORT</strong><br />
SERIES<br />
<strong>GEOMORPHOLOGY</strong> AND<br />
SURFACE MATERIALS:<br />
LINDSAY-WALLPOLLA AND<br />
LAKE VICTORIA-ANABRANCH<br />
J. Clarke, V. Wong, C. Pain, H. Apps, D. Gibson,<br />
J. Luckman and K. Lawrie<br />
<strong>CRC</strong> <strong>LEME</strong> OPEN FILE <strong>REPORT</strong> 237<br />
December 2008<br />
<strong>CRC</strong><strong>LEME</strong><br />
(<strong>CRC</strong> <strong>LEME</strong> Restricted Report 261R, 2007<br />
2nd Impression 2008)<br />
<strong>CRC</strong> <strong>LEME</strong> is an unincorporated joint venture between CSIRO-Exploration & Mining, and Land & Water, The Australian<br />
National University, Curtin University of Technology, University of Adelaide, Geoscience Australia, Primary Industries<br />
and Resources SA, NSW Department of Primary Industries and Minerals Council of Australia, established and supported<br />
under the Australian Government’s Cooperative Research Centres Program.
<strong>CRC</strong><strong>LEME</strong><br />
Cooperative Research Centre for<br />
Landscape Environments<br />
and Mineral Exploration<br />
<strong>GEOMORPHOLOGY</strong> AND<br />
SURFACE MATERIALS:<br />
LINDSAY-WALLPOLLA AND<br />
LAKE VICTORIA-ANABRANCH<br />
J. Clarke, V. Wong, C. Pain, H. Apps, D. Gibson,<br />
J. Luckman and K. Lawrie<br />
<strong>CRC</strong> <strong>LEME</strong> OPEN FILE <strong>REPORT</strong> 237<br />
December 2008<br />
(<strong>CRC</strong> <strong>LEME</strong> Restricted Report 261R, 2007<br />
2nd Impression 2008)<br />
<strong>CRC</strong> <strong>LEME</strong> 2007<br />
<strong>CRC</strong> <strong>LEME</strong> is an unincorporated joint venture between CSIRO-Exploration & Mining, and Land & Water, The Australian<br />
National University, Curtin University of Technology, University of Adelaide, Geoscience Australia, Primary Industries and<br />
Resources SA, NSW Department of Primary Industries and Minerals Council of Australia.<br />
Headquarters: <strong>CRC</strong> <strong>LEME</strong> c/o CSIRO Exploration and Mining, PO Box 1130, Bentley WA 6102, Australia
This report (<strong>CRC</strong> <strong>LEME</strong> Open File Report 237) is a reprinting of <strong>CRC</strong> <strong>LEME</strong> Restricted Report<br />
261R, first issued in 2007 as part of the <strong>CRC</strong> <strong>LEME</strong>/Geoscience Australia River Murray Corridor<br />
(South Australian Border To Gunbower) Victorian AEM Mapping Project.<br />
Electronic copies of the publication in PDF format can be downloaded from the <strong>CRC</strong> <strong>LEME</strong><br />
website: http://crcleme.org.au/Pubs/OFRSindex.html. Information on this or other <strong>LEME</strong><br />
publications can be obtained from http://crcleme.org.au.<br />
Hard copies will be retained in the Australian National Library, the J. S. Battye Library of West<br />
Australian History, and the CSIRO Library at the Australian Resources Research Centre,<br />
Kensington, Western Australia.<br />
Reference:<br />
Clarke, J. Wong, V., Pain, C., Apps, H., Gibson, D., Luckman, J., and Lawrie, K. 2007.<br />
Geomorphology and Surface Materials: Lindsay-Wallpolla and Lake Victoria-Anabranch. <strong>CRC</strong><br />
<strong>LEME</strong> Restricted Report 261R, 74 pp. (Reissued as Open File Report 237, <strong>CRC</strong> <strong>LEME</strong>, Perth,<br />
2008).<br />
Keywords: 1. Regolith materials 2. Geomorphology - Victoria 3. Salinity 4. River Murray<br />
ISSN 1329-4768<br />
ISBN 978 0 643 09673 8<br />
Addresses and affiliations of Authors:<br />
J. Clarke, V. Wong, C. Pain, H. Apps, D. Gibson, J. Luckman and K. Lawrie<br />
Geoscience Australia<br />
PO Box 378<br />
CANBERRA<br />
ACT 2601<br />
Published by: <strong>CRC</strong> <strong>LEME</strong><br />
c/o CSIRO Exploration and Mining<br />
PO Box 1130, Bentley, Western Australia 6102.<br />
Disclaimer<br />
The user accepts all risks and responsibility for losses, damages, costs and other consequences<br />
resulting directly or indirectly from using any information or material contained in this report. To the<br />
maximum permitted by law, <strong>CRC</strong> <strong>LEME</strong> excludes all liability to any person arising directly or<br />
indirectly from using any information or material contained in this report.<br />
© This report is Copyright of the Cooperative Research Centre for Landscape Environments and<br />
Mineral Exploration 2007, which resides with its Core Participants: CSIRO Exploration and Mining<br />
and Land and Water, the Australian National University, Curtin University of Technology, the<br />
University of Adelaide, Geoscience Australia, Primary Industries and Resources South Australia,<br />
New South Wales Department of Primary Industries and Mineral Council of Australia.<br />
Apart from any fair dealing for the purposes of private study, research, criticism or review, as<br />
permitted under Copyright Act, no part may be reproduced or reused by any process whatsoever,<br />
without prior written approval from the Core Participants mentioned above.
EXECUTIVE SUMMARY<br />
In early 2007, an airborne electromagnetic (AEM) survey was acquired along a 450 km reach<br />
of the River Murray Corridor (RMC) in SE Australia. This aim of this survey, carried out<br />
under the auspices of the Australian Government’s Community Stream Sampling and Salinity<br />
Mapping Project (CSSSMP), and managed by the Bureau of Rural Sciences (BRS), is to<br />
provide information vital for addressing salinity, land management and groundwater resource<br />
issues. The study area stretches from where the Murray River crosses the South Australian<br />
border eastwards and south along the Murray River to Torrumbarry Weir. A total of 24,000<br />
line km of AEM data were acquired. The survey area encompasses iconic wetland areas,<br />
national and state forest parks, and areas of irrigation and dryland farming.<br />
Within the Lindsay-Wallpolla and Lake Victoria-Darling Anabranch project area key land<br />
management questions include: 1) What is the potential for salt mobilisation during Living<br />
Murray inundation actions? 2) How is salt delivered to the river? 3) How are the drivers of<br />
floodplain health with respect to groundwater processes to be understood? 4) How are the<br />
high recharge areas in the floodplain to be indentified? 5) What is the extent and thickness of<br />
the Blanchetown Clay and the Coonambidgal Formation? 6) Where is salt stored in the<br />
unsaturated zone?<br />
To address many of these questions, maps of the distribution of salt stores, saline and fresh<br />
groundwater and the hydraulic properties of soil and regolith materials in the shallow subsurface<br />
are required. These are required to provide a 3-D understanding of how salt stores and<br />
saline groundwaters connect to the surface waterways and land surface. Sub-surface<br />
interpretations in the survey areas are hampered by a low density of useful borehole data in<br />
the floodplain in particular, and by a paucity of soil and landscape surface mapping at<br />
appropriate scales throughout the project area. New maps of surface materials, and a new<br />
geomorphic understanding of the RMC project area is required to constrain the interpretation<br />
of the AEM surveys, and address the land management questions.<br />
This report documents the results of new surface materials mapping in the Lindsay-Wallpolla<br />
and Lake Victoria-Darling Anabranch survey area, the methodology used to produce the<br />
maps, and supporting analyses. These data inform interpretation of the surface layer of the<br />
AEM products and provide an understanding of the geomorphic evolution of the landscape.<br />
The Murray River in the Lindsay-Wallpolla Islands reach runs though a valley incised<br />
through a Late Cainozoic succession consisting of the Blanchetown and Loxton-Parilla<br />
Formations. These are mantled by Pleistocene aeolian sands of the Woorinen Formation.<br />
The modern floodplain consists of three distinct generations of meander belt sediments with<br />
scroll bars and oxbow billabongs. A conventional fine-grained floodplain is absent because<br />
of the meander belt sediments extend across the full width of the floodplain within the<br />
confines of the incised valley. However, older meander deposits are draped by floodplain silty<br />
clays with the thicknesses increasing to more than a metre on the oldest deposits. The oldest<br />
floodplain deposits also show distinctively longer meander wavelengths and wide channels<br />
than the modern channel, indicating a diminished flow over time. The soils vary markedly in<br />
salinity and pH, with a general trend of increasing pH and salinity with increasing age.<br />
An extensive terrace occurs along both sides of the incised valley of the Murray River. The<br />
terrace is mantled by aeolian silts and sands and have local outlying dunes of the Woorinen<br />
Formation. Ghosts of channels and billabongs are visible in satellite imagery suggesting an<br />
environment similar to from that which formed the modern floodplain. The soils are potassic,<br />
alkaline, and moderately saline.<br />
iii
Lindsay and Wallpolla Creeks are sinuous fixed-channel anastomosing channels. While these<br />
channels may partly follow abandoned channels of the Murray River, they are incised into the<br />
floodplain and are inferred to be related to drainage during high water levels. These channels<br />
and the oxbow billabongs from abandoned meander loops of the Murray River are clay-lined,<br />
with water flow either non-existent or very slow. It is these channels that are flooded during<br />
the artificial watering process.<br />
Distal to the river are several clay pans with associated lunettes. The largest of these is Lake<br />
Victoria, followed by Lake Wallawalla. These abut the rise forming the edge of the incised<br />
valley or against the terrace. In their natural state, they are several metres lower than the rest<br />
of the floodplain, forming evaporation basins for water draining off the proximal floodplains<br />
along the fixed channels. Engineering works have resulted in Lake Victoria being used for<br />
permanent water storage and Lake Wallawalla for temporary storage. Both lakes are<br />
interpreted as modified meander loops of the Murray River.<br />
Ken Lawrie<br />
Project Leader<br />
iv
ABBREVIATIONS<br />
ACRES<br />
AEM<br />
ASTER<br />
BC<br />
BRS<br />
CF<br />
CMA<br />
<strong>CRC</strong> <strong>LEME</strong><br />
DEM<br />
GA<br />
GMW<br />
LIDAR<br />
MDBC<br />
MS<br />
PS<br />
RGB<br />
RMC<br />
SF<br />
SPOT<br />
STRM<br />
VNIR<br />
WF<br />
XRD<br />
XRF<br />
Australian Centre for Remote Sensing<br />
Airborne Electromagnetics<br />
Advanced Spaceborne Thermal Emission and Reflection Radiometer<br />
Blanchetown Clay<br />
Bureau of Rural Sciences<br />
Coonambidgal Formation<br />
Catchment Management Authority<br />
Cooperative Research Centre for Landscape Environments and<br />
Mineral Exploration<br />
Digital elevation model<br />
Geoscience Australia<br />
Goulbourn-Murray Water<br />
Light Detection and Ranging<br />
Murray-Darling Basin Commission<br />
Monoman Sands<br />
Parilla Sands<br />
Red, Green, Blue<br />
River Murray Corridor<br />
Shepparton Formation<br />
Satellite Pour l'Observation de la Terre<br />
Shuttle Radar Terrain Model<br />
Very near infrared radiation<br />
Woorinen Formation<br />
X Ray Diffraction<br />
X Ray Fluorescence<br />
v
TABLE OF CONTENTS<br />
_Toc224538156<br />
1 INTRODUCTION............................................................................................................ 1<br />
2 PREVIOUS STUDIES..................................................................................................... 2<br />
3 KEY LAND MANAGEMENT QUESTIONS ................................................................ 3<br />
4 METHODOLOGY........................................................................................................... 5<br />
4.1 Basic method and rationale ...................................................................................... 5<br />
4.2 Data Availability and Quality .................................................................................. 5<br />
4.2.1 Satellite imagery .................................................................................................. 5<br />
4.2.2 Digital Elevation Models..................................................................................... 5<br />
4.2.3 Gamma-ray data................................................................................................... 6<br />
4.3 Satellite image Processing ....................................................................................... 6<br />
4.4 Fieldwork ................................................................................................................. 7<br />
5 RESULTS ........................................................................................................................ 7<br />
5.1 Regolith Landform Units ......................................................................................... 7<br />
5.1.1 Uplands................................................................................................................ 8<br />
5.1.2 Alluvial terrace .................................................................................................... 8<br />
5.1.3 Floodplain............................................................................................................ 9<br />
5.2 Vegetation .............................................................................................................. 11<br />
5.2.1 Uplands.............................................................................................................. 12<br />
5.2.2 Alluvial Terrace................................................................................................. 12<br />
5.2.3 Floodplain.......................................................................................................... 13<br />
6 ANALYTICAL DATA.................................................................................................. 13<br />
6.1 Granulometry ......................................................................................................... 16<br />
6.1.1 Methodology...................................................................................................... 16<br />
6.1.2 Results ............................................................................................................... 16<br />
6.2 EC and pH.............................................................................................................. 17<br />
6.2.1 Methodology...................................................................................................... 17<br />
6.2.2 Results ............................................................................................................... 17<br />
6.3 XRF geochemistry ................................................................................................. 19<br />
6.3.1 Methodology...................................................................................................... 19<br />
6.3.2 Results ............................................................................................................... 19<br />
6.4 XRD mineralogy.................................................................................................... 20<br />
6.4.1 Methods ............................................................................................................. 20<br />
6.4.2 Results ............................................................................................................... 20<br />
7 IMPLICATIONS............................................................................................................ 21<br />
7.1 Hydrogeological issues .......................................................................................... 21<br />
7.1.1 Flow................................................................................................................... 21<br />
7.1.2 Recharge ............................................................................................................ 21<br />
7.1.3 Relevance to land management questions ......................................................... 22<br />
REFERENCES........................................................................................................................ 24<br />
APPENDIX 1. ASTER data and interpretation....................................................................... 26<br />
APPENDIX 2. SPOT Data and interpretation........................................................................ 28<br />
APPENDIX 3. DEM data and interpretation........................................................................... 30<br />
APPENDIX 4. Gamma-ray data.............................................................................................. 32<br />
APPENDIX 5. Surface materials ............................................................................................ 33<br />
APPENDIX 6. Site Descriptions and Data.............................................................................. 34<br />
APPENDIX 7: Analytical Results........................................................................................... 55<br />
Appendix 7.1 Lindsay-Wallpolla soil EC and pH data....................................................... 55<br />
Appendix 7.2: Lindsay-Wallpolla Laser Grainsize............................................................. 57<br />
Appendix 7.3: Lindsay-Wallpolla XRF results................................................................... 59<br />
Appendix 7.4: Lindsay-Wallpolla XRD Mineralogy.......................................................... 62<br />
vi
List of Figures<br />
Figure 1. The Lindsay-Wallpolla and Lake Victoria-Darling Anabranch study area ............... 1<br />
Figure 2. Typical landscape close to Murray River on Wallpolla Island .................................. 1<br />
Figure 3. Conceptual model (cross-section) and geophysical targets in the Lindsey – Walpolla<br />
area:................................................................................................................................... 4<br />
Figure 4. Schematic hydrogeological cross-section representing the Lindsay Island reach of<br />
the Murray River Floodplain. ........................................................................................... 4<br />
Figure 5. Coverage of digital elevation model types................................................................. 6<br />
Figure 6. Compartmentalisation of the Murray River incised valley fill into terrace and<br />
floodplain deposits of different ages. .............................................................................. 8<br />
Figure 7. Diagrammatic representation of relationships between geomorphic and stratigraphic<br />
units................................................................................................................................... 9<br />
Figure 8. Oblique projection of part of LIDAR DEM showing geomorphic elements. ......... 10<br />
Figure 9. Vertical view of part of LIDAR DEM showing geomorphic elements. .................. 11<br />
Figure 10. Further vertical view of part of LIDAR DEM showing geomorphic elements...... 12<br />
Figure 11. Terrace vegetation and materials. .......................................................................... 12<br />
Figure 12. Modern floodplain (right) with well developed river red gum forest. Intermediate<br />
floodplain (left) with black box woodland,..................................................................... 13<br />
Figure 13. Oldest floodplain (left) with black box and Lignum-saltbush savannah. Riparian<br />
vegetation (right) of bulrushes, lilies, and macroalgae, Horseshoe Lagoon, .................. 13<br />
Figure 14. Location of soil sample sites western end of Lindsay-Wallpolla and Lake Victoria-<br />
Darling Anabranch.......................................................................................................... 15<br />
Figure 15. Location of soil sample sites eastern end of Lindsay-Wallpolla and Lake Victoria-<br />
Darling Anabranch.......................................................................................................... 15<br />
Figure 16. Sand and clay percentage from each geomorphic unit........................................... 16<br />
Figure 17. Mean pH profiles from each geomorphic unit. ...................................................... 18<br />
Figure 18. Mean EC profiles from each geomorphic unit....................................................... 18<br />
Figure 19. SPOT image of Wallpolla Creek (containing water at time imaged) and clay-lined<br />
nature of dried up channel of Wallpolla Creek as seen at ground level.......................... 22<br />
vii
List of Tables<br />
Table 1. Associations between regolith landform units, vegetation and surface materials ..... 14<br />
Table 2. Range of EC and pH values for different geomorphic units in the Lindsay-Wallpolla<br />
and Lake Victoria-Darling Anabranch study area .......................................................... 19<br />
Table 3. Mean values of selected XRF analyses ..................................................................... 20<br />
viii
1 INTRODUCTION<br />
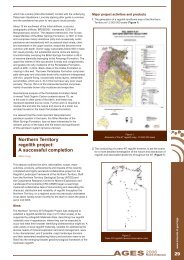
This study covers the River Murray Corridor (RMC) between Merbein and the South<br />
Australian Border (Figure 1).<br />
Figure 1. The Lindsay-Wallpolla and Lake Victoria-Darling Anabranch study area. Green boxes<br />
from left to right are for Figures 10, 9, 19, and 8, respectively.<br />
The two main areas of interest are Lindsay and Wallpolla “islands”, areas of the floodplain<br />
largely isolated by secondary anastomosing channels branching off from the Murray River,<br />
and the matching floodplain on the New South Wales side of the River. The area was visited<br />
by the authors between the 17 th and 26 th of January (Figure 2). The aim of this visit was to<br />
validate landforms units mapped on the DEM and satellite imagery and to collect soil samples<br />
for ground truthing of the physical and chemical properties of the surface materials..<br />
Figure 2. Typical landscape close to Murray River on Wallpolla Island<br />
1
The main objective of the studies reported here is to provide information for constrained<br />
inversion of AEM data as a first step in interpreting those data to provide answers to land use<br />
questions posed by the Malee and Lower Murray-Darling Catchment Management<br />
Authorities (CMAs) for the area. The studies also provide a materials framework within<br />
which to assess the utility of the airborne electromagnetic (AEM) data to help answer the land<br />
management questions.<br />
2 PREVIOUS STUDIES<br />
There has been a paucity of geomorphic studies undertaken on the Murray Floodplain<br />
downstream Swan Hill. Those which have been undertaken relate largely to the geology and<br />
its evolution in the region, and soils and pedogenesis (Brown and Stephenson 1991; Gill<br />
1973; Macumber 1977; Hills 1975). However, a number of studies have been undertaken in<br />
the Riverine Plain of Victoria and NSW, and extrapolated to the Murray floodplain region due<br />
to similarities in their evolutionary histories (Bowler and Harford 1966; Butler et al. 1973;<br />
Pels 1966). More recently, studies have focused on the ecological or vegetation health (Jolly<br />
et al. 1993; Thoms et al. 1999) of the native vegetation. There have been few highly<br />
integrated studies in which geology, geophysics, soils, and geomorphology have been used to<br />
address questions of land management, with perhaps the study by Rowan and Downes (1963)<br />
being a notable exception. This is particularly important given that the floodplain of the<br />
Murray River in this region acts as an interface between the river and the regional<br />
groundwater systems, with the potential to mobilise large stores of salt under altered<br />
hydrological regimes.<br />
The soils of the Murray Basin are closely related to the Quaternary geology. Grey and brown<br />
soils of the Riverine Plain and solonised brown soils of the Mallee region predominate. The<br />
grey and brown soils overlie mainly the fluvial Shepparton and Coonambidgal Formations,<br />
while the solonised brown soils overlie a variety of aeolian units including the Woorinen<br />
Formation (Brown and Stephenson 1991).<br />
Previous geomorphological studies in the region have identified a number of terraces<br />
(Kotsonis et al. 1999) in the Murray Floodplain. Thoms et al. (1999) recognise that the<br />
present day channels and rivers in this region are inset within intermediate channel systems,<br />
and are therefore associated with relict floodplain surfaces that contain numerous palaeochannels<br />
and oxbow lakes. Gill (1973) named the oldest terrace the Rufus Formation.<br />
While the Riverine Plain consists of thick lacustrine and fluvatile sediments deposited mainly<br />
in the late Tertiary and Quaternary, the Mallee is a semi-arid region with extensive aeolian<br />
deposits overlying Either the Pleistocene lacustrine Blanchetown Clay or intermediate<br />
Cainozoic marine sands of the Loxton-Parilla Formation. The aeolian deposits occur in the<br />
form of two types of dunes in the Mallee. The first is a regular series of linear dunes with an<br />
east-west trend stabilised by vegetation except for the very local active sand patches. The<br />
dunes generally have calcareous B horizons, with buried palaeosols. The material of which<br />
the east-west dunes are composed of a pale to dark reddish-brown calcareous sand with some<br />
clay fraction of the Woorinen Formation (Hills 1975). The second type of dune is a complex<br />
set of parabolic and transverse dunes which are found outside of the study area.<br />
On the New South Wales side of the river Lake Victoria is a giant oxbow system lying on an<br />
anabranch formed by Frenchman’s Creek and the Rufus River, and has acted as sand trap to<br />
form a large lunette on its eastern bank which has been emplaced and remodelled over 20 000<br />
years (Gill 1973) of deflation. The river banks and sides of Lake Victoria are subjected to<br />
erosion with extensive blowouts and sandfalls, while the lunette associated with the lake is<br />
unusually wide with horizontal bedding (Gill 1973). Several salt pans exist in the vicinity of<br />
Lake Victoria, which may be relicts of a former single large lake indicated by a shallow<br />
gypsiferous layer above the Blanchetown Formation, with groundwater occurring within a<br />
2
metre of the ground surface (Chen 1995). The Darling River and its Anabranch also enter the<br />
Murray River in this reach at Wentworth, and approximately 15 km west of Wentworth,<br />
respectively.<br />
3 KEY LAND MANAGEMENT QUESTIONS<br />
The main identified issue in this iconic reach of the Murray River is the downstream impact<br />
of salt mobilisation during flood recessions. Research to date indicates that the Lindsay and<br />
Wallpolla Islands accumulate large amounts of salt during low flow periods and that<br />
significant floods could act to liberate much of this salt, moving it downriver where it could<br />
severely affect agricultural areas in South Australia. Accordingly, the key identified<br />
requirements are the design of an environmental watering regime and planning of<br />
revegetation strategies to optimise floodplain health and limit the salinity impact on the<br />
Murray River. This will entail gaining a more detailed understanding of the floodplain<br />
characteristics, including flush zones and salt stores. Identification of major salt influxes to<br />
the river and possible interception zones is also desired. These concerns can be expressed in<br />
the following questions (from Lawrie 2006), with conceptual geophysical targets shown in<br />
Figure 3. Figure 4 shows a cross-section of the Murray River floodplain and Wallpolla Island.<br />
1. What is the potential for salt mobilisation during Living Murray inundation actions?<br />
This requires identifying holes in the Coonambidgal Formation – target 1. Salt stored<br />
in the sub-surface (targets 2 and 5 in the model below) may be mobilised through<br />
connected pathways to the river and surface (through targets 1 and 3). This question<br />
addresses the act of mobilisation and is therefore concerned with the source or initial<br />
position of the salt and what is causing it to move. This requires identifying high salt<br />
stores that are at risk of being mobilised. Therefore, we need to identify high<br />
conductivity salt stores, particularly in the Coonambidgal Formation and upper<br />
Monoman Formation (target 5), and we need to identify low conductivity zones<br />
where water preferentially feeds into the floodplain sediments to potentially mobilise<br />
these salt stores, namely flush zones (target 3) and floodplain recharge areas (target<br />
1). In the model below. Questions 2 and 3, below, deal with the destination of the<br />
mobilised salt. See Figure 3.<br />
2. Delivery of salt to the river. How salt is being delivered to the river requires<br />
identification of high salinity zones (similar to previous question) and relatively<br />
permeable zones or pathways for groundwater movement back to the river or<br />
anabranches once the flood recedes – targets 5, 4 and 2 in Figure 3. Salt being<br />
delivered to the river now will be interpreted from mapping salt stores (eg targets 2<br />
and 5) and their connection to the river either directly or indirectly through<br />
preferential flow paths. Additionally, salt being delivered to the river will also be<br />
mapped by identifying areas where Blanchetown Clay is thin or absent, giving rise to<br />
potential higher saline influxes to the river from saline groundwaters in the Loxton-<br />
Parilla Sands (target 4 in Figure 3).<br />
3. Understanding of the drivers of floodplain health with respect to groundwater<br />
processes. This is matter of identifying elements of floodplain and groundwater<br />
processes – targets 1, 2, 3 and 4 in the model below. This is a matter of identifying<br />
elements of floodplain composition (including salt), groundwater levels and<br />
groundwater processes. AEM can provide important baseline data in resolving this<br />
question by defining the distribution of fine and coarse grain floodplain lithologies<br />
(target: whole of floodplain, particularly top 5 metres), high salinity zones (target 5),<br />
high recharge zones (target 1), flush zones (target 3), permeable pathways delivering<br />
salt to prone areas such as anabranches and other depressions (target 2) and exposure<br />
to saline fluxes from the Parilla Sand (target 4). Recharge zones (target 1), salt stores<br />
(2 and 5) and flush zones (target 3) are conceptualised in Figure 3.<br />
3
4. Identification of the high recharge areas in the floodplain? This relates to question 1,<br />
and means identifying areas of the floodplain where water can most easily enter from<br />
the surface i.e. high porosity permeability (sand) connected to subsurface – targets 1<br />
and 2 in Figure 3.<br />
5. What is the extent and thickness of the Blanchetown Clay and the Coonambidgal<br />
Formation? Extent and thickness of the Blanchetown Clay can be modelled in areas<br />
adjacent to the incised valley (targets 4 & 6a in Figure 3) and beneath the incised<br />
valley (targets 4 & 6b) where the conductivity contrasts between the Blanchetown<br />
Clay and the overlying Monoman Formation are high enough. Targets 1 and 2<br />
(Figure 3) can assist in the determination of the thickness and extent of<br />
Coonambidgal Formation. Drill-hole and geomorphic information will be used in the<br />
interpretation of the extent and thickness of the Coonambidgal Formation.<br />
6. Where is salt stored in the unsaturated zone? Target 7 in Figure 3.<br />
Figure 3. Conceptual model (cross-section) and proposed geophysical targets in the Lindsey –<br />
Walpolla area: WF = Woorinen Formation, CF = Coonambidgal Formation, MS = Monoman<br />
Sands, BC = Blanchetown Clay, PS = Parilla Sand (Lawrie 2006).<br />
Figure 4. Schematic hydrogeological cross-section representing the Lindsay Island reach of the<br />
Murray River Floodplain (from SKM 2004).<br />
4
4 METHODOLOGY<br />
4.1 Basic method and rationale<br />
Mapping was done on transparent overlays at 1:25,000 scale and digitally converted into<br />
electronic maps. The main presentation of the data was at 1:100,000 scale, mapping at<br />
1:25,000 scale ensured that there was sufficient detail.<br />
Landform mapping was carried out primarily by one of us (JC) using the LIDAR DEM where<br />
possible. This was supplemented by lower resolution DEM data when the LIDAR was not<br />
available, and compared against satellite imagery. DG carried out most of the mapping in the<br />
areas with lower resolution. The landforms provided information on the spatial and<br />
chronological relationships between different surface units.<br />
Surface properties were mapped using ASTER by another one of us (VW), who also mapped<br />
vegetation patterns from SPOT images. Gamma ray ternary radiometric images were used by<br />
JC to differentiate surface material types where interpretation was difficult. Surface materials<br />
provide information in the hydrologic properties, in particular recharge and salt load.<br />
The polygons were field checked by JC and V Wong by vehicular traverses along various<br />
tracks. Soil pits were dug and sampled, with field descriptions providing preliminary data on<br />
soil properties (Appendix 6). These were followed by quantitative analyses (Appendix 7).<br />
The maps were entered into the GIS by HA and JL, and the work was scientifically reviewed<br />
by CP and KL.<br />
4.2 Data Availability and Quality<br />
4.2.1 Satellite imagery<br />
The primary satellite images used to compile surface polygons were those from ASTER and<br />
SPOT. LANDSAT images were used for comparison and infill, but were not normally<br />
interpreted as SPOT and ASTER coverage was generally adequate for the project area.<br />
ASTER interpretation is shown in Appendix 1), while SPOT interpretation is shown in<br />
Appendix 2.<br />
Three ASTER scenes (with 15m resolution) covered most of the Lindsay-Wallpolla and Lake<br />
Victoria-Darling Anabranch area. The scenes, the only ones available, were acquired from<br />
ACRES in GA. Two scenes were dated 14 Jan 2001 and one was dated 20 Nov 2000, with the<br />
last scene unfortunately having a large section of cloud cover. The ASTER is displayed as a<br />
composite RGB image using the visible and near infrared radiation (VNIR) bands 3, 2 and 1.<br />
Four pan-sharpened pseudo natural colour SPOT scenes (with 2.5m resolution) dated 09 Jan<br />
2005, 25 Feb 2005, 5 July 2005 and 24 Nov 2004 were also acquired from GA. Bands 3, 2<br />
and 1 were displayed in a composite RGB image. Two Landsat-7 ETM ortho-corrected<br />
images (30m resolution) used in the project were acquired on the 15 Mar 2002 and 4 April<br />
2001.<br />
4.2.2 Digital Elevation Models<br />
DEM coverages are shown in Figure 5. Three coverages were used:<br />
• LIDAR<br />
• Elevation models fro digitised topographic maps<br />
• SRTM data<br />
5
The SRTM was used as to provide the base DEM where other data was not available. At a<br />
scale of 1:25,000 the vertical and spatial resolution is too low while the noise level is too high<br />
in the Shuttle Radar DEM for mapping purposes, and hence, has been used for infill only.<br />
High resolution (2 and 5 m) LIDAR DEMs were used for the primary interpretation<br />
(Appendix 3). The Lindsay and Wallpolla LIDAR data were supplied by SunRISE 21 in xyz<br />
format (134 & 74 files respectively). These were imported and gridded in Intrepid and then<br />
exported to ERMapper format as 1m and 5m grids. The LIDAR data on the eastern part of the<br />
project area were supplied by MDBC. The tiles, at 2m resolution, were mosaiced together in<br />
Arc Info. There are two DEMs derived from digitised contour maps; one at 10 m resolution<br />
and the other at 20 m resolution (Figure ). The 20 m DEM data was provided by ACRES in<br />
ERMapper format. The 10m DEM data was supplied as 175 xyz ascii files by SunRISE 21 on<br />
behalf of the Mallee CMA. The ascii files were imported into Intrepid, saved in ERMapper<br />
format, and clipped to the project area. The 10m grid has a stated vertical accuracy of 2m<br />
AHD. These were used as infill when other data were not available.<br />
Figure 5. Coverage of digital elevation model types.<br />
4.2.3 Gamma-ray data<br />
Airborne ternary gamma-ray images were used to supplement areas with poor coverage of<br />
high resolution DEM (Appendix 4). This is effective because the materials of the terrace<br />
formed by the Rufus Formation (Gill 1973) are distinct from those of the active floodplain on<br />
ternary gamma-ray images, as described in more detail below. The distribution of this<br />
material was used when absence of LIDAR coverage precluded mapping of the position of<br />
terraces by more accurate means.<br />
4.3 Satellite image Processing<br />
The ASTER level 1B scenes were supplied by ACRES in .hdf format. They were corrected<br />
for crosstalk (caused by signal leakage from band 4 into adjacent bands 5 and 9) and imported<br />
into ERMapper. Importing was carried out in three steps with bands of similar resolution. The<br />
VNIR bands 1-3 at 15m resolution, SWIR (shortwave infrared radiation) bands 5 – 9 at 30m<br />
resolution and TIR (thermal infrared radiation) bands 10 – 14 at 90m resolution. All bands<br />
were rotated, calibrated for radiance, by rescaling digital values to observed top of<br />
atmosphere radiance values, and had dark pixel corrections. Resultant ERMapper datasets<br />
were displayed as composite RGB images.<br />
6
SPOT 5 images were supplied by GA and had already been processed by Geoimage Pty Ltd<br />
for NSW Department of Infrastructure Planning and Natural Resources. LANDSAT 7 data<br />
have passed ACRES Quality Assessment and was supplied with all processing complete.<br />
The ASTER, SPOT and LIDAR images were printed at 1:25,000 scale and interpreted by<br />
mapping unit boundaries onto a registered stable transparent overlay using mapping pens.<br />
The interpreted line work was then digitally scanned and the polygons attributed. The<br />
finished images were then printed for checking.<br />
4.4 Fieldwork<br />
The area was visited by two of the authors (JC and VW) between the 17 th and 26 th of January<br />
(Figure 1). The aim of this visit was to validate interpretations of the DEM and satellite<br />
imagery interpretation and to collect soil samples for ground truthing. Twenty sites for<br />
selected for sampling and 16 actually excavated, some of these lay outside the final study area<br />
as the field trip was done before these have been fully defined. These were all located on<br />
road reserves. Shallow pits 30 cm deep were dug adjacent to roads in the Lindsay-Wallpolla<br />
and Lake Victoria-Darling Anabranch region and sampled at 0-10, 10-20, 20-30 cm intervals.<br />
These pits provided information of the near-surface stratigraphy and characteristics of the<br />
regolith materials and also provided information on the soil structure of the site. The soils<br />
were described according to McDonald and Isbell (1998). Samples were analysed for<br />
mineralogy using X-Ray Diffraction (XRD), for grain size using laser granulometry, and for<br />
elemental chemistry using X-Ray Fluorescence (XRF). The site and the pits were photodocumented<br />
and the soil profiles and samples described in the field. The holes were filled in<br />
on completion. Results of the field tests and soil descriptions are contained in Appendix 6 and<br />
discussed in section 6.<br />
5 RESULTS<br />
5.1 Regolith Landform Units<br />
The incised valley of the Murray River (the upstream equivalent of the Murray River Gorge<br />
of Twidale et al. 1978) contains several mappable geomorphic units and their accompanying<br />
sediments (Figure 6, Figure and Appendix 5). These are the alluvial terrcae, raised several<br />
metres above the modern floodplain, the modern scroll plain inundated by floods, composed<br />
of three mappable meander tracts, and a number of individual features such as dunes, lakes,<br />
and lunettes<br />
Geomorphic differentiation of incised valley fill into terrace and floodplain deposits matches<br />
the distinct airborne gamma patterns which show that the terrace units (Rufus Formation) are<br />
comparatively richer in K than in Th or U, whereas the floodplains (Coonambidgal<br />
Formation) all show an equally strong signal in all three radioelements. The quartz sand dunecovered<br />
uplands showed a very low signature in all three radiogenic elements.<br />
7
Figure 6. Compartmentalisation of the Murray River incised valley fill into terrace and<br />
floodplain deposits of different ages. Upper terrace is composed of Rufus Formation.<br />
5.1.1 Uplands<br />
The uplands have sandy regolith, slightly more clayey in the swales, developed on the dunes<br />
of the Woorinen Formation (Figure , Figure 8). Soils are well-drained and sandy to sandy<br />
loams, with moderate amounts of carbonate in the intermediate dunes. Generally these areas<br />
are cleared for cropping (Figure 1, Figure 8).<br />
5.1.2 Alluvial terrace<br />
This unit consists of clay and fine sandy alluvium, and is composed of the Rufus Formation of<br />
Gill (1973). The terrace surface has a discontinuous cover of sand dunes (~Woorinen<br />
Formation). It is about 60,000 years old (Rogers and Gatehouse 1990). The terrace is very<br />
flat, with local orange sand dunes and sand sheets. Where there is no sand the surface of the<br />
terrace consists of olive-khaki silty clays. Most soils are slightly to moderately saline. Loamy<br />
sands of relict dunes locally overlay the floodplain clays (Figure ).<br />
8
Figure 7. Diagrammatic representation of relationships between geomorphic and stratigraphic<br />
units.<br />
5.1.3 Floodplain<br />
The floodplain is formed on sediments on the Coonambidgal Formation (Butler 1958), and<br />
consists of three discrete meander belts with well developed scroll bars (Appendix 3).<br />
The oldest floodplain meander belt has a degraded scroll bar morphology. Amplitude of the<br />
scroll bars and the meander wavelength is greater for this unit that for the younger meander<br />
belts, indicating different hydraulic conditions during deposition. This unit is characterised by<br />
olive-khaki silty clay drapes over degraded scroll bars with a relief of about 2 m (Figure 8,<br />
Figure, 10). There are thin (>2 m) source bordering dunes of grey sand.<br />
There is an intermediate floodplain meander belt that has rounded morphology, with scroll<br />
bars are not as distinct as on the modern floodplain in the LIDAR DEM. Olive-khaki silty<br />
clay drapes over lower relief (~1 m) scroll bars are found in this unit. Source bordering dunes<br />
also occur on this unit.<br />
The modern floodplain consists of meander belts and high relief (2-3 m) scroll bars with crisp<br />
morphology and little or no clay draped over the surface. Scroll bars are distinct in the<br />
LIDAR DEM. Surface sediments consist largely of yellow sand.<br />
9
Dune on terrace<br />
Alluvial terrace<br />
Youngest floodplain<br />
Oldest floodplain<br />
Uplands<br />
Intermediate floodplain<br />
Figure 8. Oblique projection looking west from the Murray River at Merbein showing part of<br />
LIDAR DEM showing geomorphic elements. Width of image ~5 km.<br />
The floodplain has a number of channels, which consist of several morphological types. The<br />
main Murray River channel sustains active flow and consists of a typical migrating<br />
meandering channel. Abandoned channels of the Murray River consist of broad oxbow<br />
billabongs and sustain semipermanent water. There are also anastomosing channels that are<br />
sinuous and have fixed banks. These channels have been superimposed on the intermediate<br />
floodplain deposits, sometimes exploiting previous abandoned channels, elsewhere cutting<br />
across scroll bar and floodplain deposits. Flow in these is determined by water level, and<br />
during the period of observation some were flowing, others were stagnant or dry, and lined<br />
with clay.<br />
Most soils on the floodplain are slightly to moderately saline (see Section 6.2 and Appendix 7<br />
for details). Loamy sands of relict dunes locally overlie the floodplain clays. Clays within the<br />
floodplain are typically smectitic and sodic. They are highly dispersive and make an<br />
impermeable seal after modest rain. Minor variations in floodplain elevation can significantly<br />
affect soil development. Scroll bars found on the oldest and intermediate floodplain units<br />
(Coonambidgal Formation) exhibit more profile development with heavier textures and are<br />
highly structured in swales compared to the corresponding crest than are those on the<br />
youngest scroll bar sets. Due to the formation of a surface seal, water infiltration is limited to<br />
the upper layer of the soil profile, leading to surface ponding after rainfall and then lost<br />
through evaporation. While in the field we experienced a 50-150 mm rainfall event and<br />
observed only 10-30 cm of moisture penetration below ground surface afterwards.<br />
10
Uplands<br />
Murray River<br />
Alluvial terrace<br />
Oldest floodplain<br />
meander belt<br />
Figure 9. Vertical view of part of LIDAR DEM showing geomorphic elements. Width of image ~5<br />
km. North to top.<br />
The above geomorphic units correlate well with vegetation densities and soil types.<br />
5.2 Vegetation<br />
Billabong<br />
The distribution of different vegetation units and their relative health are critical for the<br />
identification of land management issues, soil types, and indications as to the effectiveness of<br />
management strategies. SPOT, LANDSAT and ASTER satellite imagery proved especially<br />
effective in mapping the distribution of these associations, which also corresponded well with<br />
vegetation structural units described in Specht (1981) and used to map units shown in<br />
Appendix 2. Within the Mallee region, the valleys of the Murray River, Darling River and<br />
Darling Anabranch are comparatively well vegetated with dense stands of trees and shrubs<br />
(Brown and Stephenson 1991).<br />
In the Lindsay-Wallpolla and Lake Victoria-Darling Anabranch region, the following<br />
associations were observed on the equivalent geomorphic units. The regolith landform units<br />
correlate well with vegetation densities, and with soil types (for soil type relationship see<br />
Figure 7).<br />
11
Intermediate floodplain<br />
Modern floodplain<br />
Dune on terrace<br />
Oldest floodplain<br />
Figure 10. Further vertical view of part of LIDAR DEM showing geomorphic elements. Width of<br />
image ~5 km. North to top.<br />
5.2.1 Uplands<br />
The vegetation of the uplands have largely been cleared for cropping. The remaining native<br />
vegetation is predominantly a saltbush (Atriplex sp.) shrubland with isolated Eucalyptus spp.<br />
trees.<br />
5.2.2 Alluvial Terrace<br />
On the terrace the vegetation is predominantly Saltbush (Atriplex sp.) shrubland (Figure 11).<br />
Figure 5. Terrace vegetation and materials. Silty clay and saltbush (left), sand dunes and<br />
saltbush (right), Lindsay-Wallpolla and Lake Victoria-Darling Anabranch reach.<br />
12
5.2.3 Floodplain<br />
Vegetation on the modern floodplain consists of River Red Gum (E. camaldulensis) open<br />
forest or woodland (Figure 5). The intermediate floodplain has Black Box (E. largiflorens)<br />
woodland or low open woodland (Figure 6), while the oldest floodplain has Saltbush-Lignum<br />
(Muehlenbeckia florulenta) shrubland and Black Box savannah (Figure 7).<br />
River Red Gum low open woodland or woodland occurs along most water courses, with<br />
Black Box woodland along smaller, drier courses. Riparian vegetation consists of macroalgae,<br />
water lilies and bull rushes in slower flowing or stagnant water (Figure 7).<br />
Figure 6. Modern floodplain (right) with well developed river red gum forest. Intermediate<br />
floodplain (left) with black box woodland, Lindsay-Wallpolla and Lake Victoria-Darling<br />
Anabranch reach.<br />
Figure 7. Oldest floodplain (left) with black box and Lignum-saltbush savannah. Riparian<br />
vegetation (right) of bulrushes, lilies, and macroalgae, Horseshoe Lagoon, Lindsay – Wallpolla<br />
reach.<br />
Correlations between vegetation, geomorphic unit, and surface materials are shown in<br />
Table 1.<br />
6 ANALYTICAL DATA<br />
16 soil pits were excavated to a depth of 30 cm and sampled at 10 cm intervals in the survey<br />
area. No samples were taken from the northern boundary to Wakool Junction section of this<br />
survey area as units were similar to those already described in the Robinvale-Liparoo,<br />
Lindsay-Walpolla, and Robinvale-Boundary Bend reaches (Clarke et al. 2007a, b. c). The<br />
new geomorphic units mapped south of Wakool Junction were extensively sampled, with a<br />
minimum of five sites from each unit. The soil pits provided qualitative data on the soil<br />
profiles in each unit, shown in Appendix 6. Analytical results are contained in Appendix 7.<br />
13
Locations of sample sites are given in Figure 8 and Figure 9. Location of soil sample sites<br />
eastern end of Lindsay-Wallpolla and Lake Victoria-Darling Anabranch<br />
Table 1. Associations between regolith landform units, vegetation and surface materials<br />
Regolith Landform Unit Vegetation Surface Material<br />
Uplands (U)<br />
Alluvial terrace (Ta, Td))<br />
Oldest floodplain scroll bars<br />
(Fm3)<br />
Intermediate floodplain scroll<br />
bars (Fm2)<br />
Modern floodplain scroll bars<br />
(Fm1)<br />
Native vegetation primarily<br />
cleared for cropping<br />
Saltbush (Atriplex sp.)<br />
shrubland<br />
Saltbush-Lignum<br />
(Muehlenbeckia florulenta)<br />
shrubland and Black Box (E.<br />
largiflorens) savannah<br />
Black Box (E. largiflorens)<br />
woodland or low open<br />
woodland<br />
River Red Gum (E.<br />
camaldensis) open forest or<br />
woodland<br />
Sandy regolith, slightly more<br />
clayey in the swales,<br />
developed on dunes of the<br />
Woorinen Formation<br />
Olive-grey clay-rich silts,<br />
with local veneers and low<br />
dunes of orange-coloured<br />
aeolian sand<br />
Olive-khaki silty clay drapes<br />
~3 m thick over degraded<br />
sandy scroll bars of the<br />
Coonambidgal Formation<br />
Olive-khaki silty clay ~2 m<br />
thick drapes over degraded<br />
sandy scroll bars of the<br />
Coonambidgal Formation<br />
Yellow sand with little or no<br />
clay draped over the sandy<br />
surface of the scroll bars.<br />
These comprise the<br />
Coonambidgal Formation<br />
14
Figure 8. Location of soil sample sites western end of Lindsay-Wallpolla and Lake Victoria-<br />
Darling Anabranch.<br />
Figure 9. Location of soil sample sites eastern end of Lindsay-Wallpolla and Lake Victoria-<br />
Darling Anabranch. Note that some lie outside the defined survey area, as they were collected<br />
prior to the southern limits being finally decided.<br />
15
6.1 Granulometry<br />
6.1.1 Methodology<br />
Granulometrey provides a quantitative measurement of the particle size distribution in a soil<br />
or sediment. As a result much more accurate modelling of parameters such as porosity and<br />
permeability, recharge, and salt load can be made. It also provides a check on the accuracy of<br />
field estimates of soil texture.<br />
The grainsize was determined using a Malvern Instruments Mastersizer 2000 instrument. The<br />
laser diffraction instrument consists of three parts, a laser source (He-Ne gas or diodes<br />
emitter), detectors, and sample chamber that allows suspended particles to recirculate in front<br />
of the laser beam. The Mie theory (Rawle, 2001) was used to solve the equations for<br />
interaction of light with matter and calculates the volume of the particle. This technique<br />
calculates the % volume of a range of particle sizes (0.05 – 2000 μm), and the results are<br />
grouped according to the Wentworth scale. To standardise with other analytical data, SI units<br />
(μm) were reported instead of Phi units.<br />
6.1.2 Results<br />
Samples from each site had fairly similar distributions, indicating that within the sampled<br />
depth range there were only minor differences in grainsize distribution. Some surface<br />
samples were less sandy than those at depth, indicating more abundant silt and clay at the<br />
surface. This is interpreted to be from the draping of older land surfaces by fine-grained<br />
material deposited by flood waters. Overall, however the samples were of silty clays to clayey<br />
silts, usually with minor sand. This is consistent with deposition by overbank flow during<br />
river floods for all geomorphic units including floodplains, levee banks, and channel plugs.<br />
Particle size analysis showed a general trend of fining with distance from the main river<br />
channel within the Murray River Trench (Figure 10). Soils were generally sandier on the Fm1<br />
unit and more clay-rich on the Terrace unit. The particle size distribution of the Uplands unit<br />
is most likely the result of mixing of sediments from a number of sources, including windblown<br />
sand from dunes.<br />
90<br />
Sand (%)<br />
80<br />
70<br />
60<br />
50<br />
40<br />
30<br />
20<br />
10<br />
0<br />
0 10 20 30 40 50 60<br />
Clay (%)<br />
Fm1<br />
Fm2<br />
Fm3<br />
T<br />
U<br />
Figure 10. Sand and clay percentage from each geomorphic unit.<br />
16
6.2 EC and pH<br />
6.2.1 Methodology<br />
Soil electrical conductivities were measured to determine the conductivity, salt content and<br />
salt load of the surface materials within 30 cm of the surface. Conductivity also provided a<br />
measure of soil development in landform units of different ages. Measuring pH quantitatively<br />
provides a cross check on field determinations and another way of determining soil evolution<br />
in differently aged landform units.<br />
Measuring salinity and pH in soil was carried out using the 1:5 method. With this method,<br />
10ml of distilled water is placed in a measuring container and small soil particles added until<br />
the volume of the contents of the container increased by 5ml to bring the volume to 15ml.<br />
Additional water is then added to bring the total volume to 30ml. the sample is shaken<br />
intermittently for five minutes and allow it to settle for five minutes. EC and pH probes are<br />
dipped into the solution and readings taken.<br />
6.2.2 Results<br />
The measured EC values ranged between 0.036 and 4.4 dS/m, with the majority (all but<br />
seven) falling below 1.0 dS/m. There is no good trend between conductivity and geomorphic<br />
unit relatively high conductivities (>1.0) are found in units Fs, Fm1, Fm3, and T. However,<br />
the terrace (T) units are on average more saline than those of the floodplain and uplands.<br />
Measured pH values range between 4.45 and 9.45, with the majority of the samples being<br />
acidic. There is a clear trend between increasing age of geomorphic unit and increasing pH.<br />
The youngest geomorphic units are almost entirely acidic, including almost all examples of<br />
unit Fm1. Soils from the terrace unit and uplands are near neutral to alkaline (<br />
17
Table 2).<br />
Mean pH and EC profiles are shown in Figure 11 and Figure , respectively. pH was lowest in<br />
the Fm1 unit at all depths, and increased with increasing age of floodplain units. This may be<br />
due to leaching of base cations as a result of the sandier textures of the Fm1 unit. The Uplands<br />
had the highest pH at all depths. EC was highly variable within each geomorphic unit and<br />
between geomorphic units (Figure 3). However, the Terrace unit showed the highest EC at all<br />
depths.<br />
0<br />
pH 1:5<br />
3 4 5 6 7 8 9<br />
Depth (m)<br />
0.1<br />
0.2<br />
Fm1<br />
Fm2<br />
Fm3<br />
T<br />
U<br />
0.3<br />
Figure 11. Mean pH profiles from each geomorphic unit. Note: horizontal bars indicate the<br />
standard error or the mean.<br />
0<br />
EC 1:5 (dS/m)<br />
0.0 0.5 1.0 1.5 2.0 2.5 3.0 3.5 4.0<br />
Depth (m)<br />
0.1<br />
0.2<br />
0.3<br />
Fm1<br />
Fm2<br />
Fm3<br />
T<br />
U<br />
Figure 18. Mean EC profiles from each geomorphic unit. Note: horizontal bars indicate the<br />
standard error of the mean.<br />
18
Table 2. Range of EC and pH values for different geomorphic units in the Lindsay-Wallpolla and<br />
Lake Victoria-Darling Anabranch study area<br />
Geomorphic Unit pH (1:5) EC1:5 (dS/m)<br />
6.3 XRF geochemistry<br />
6.3.1 Methodology<br />
Fm1 4.45-6.03 0.049-1.050<br />
Fm2 4.7-6.54 0.036-0.897<br />
Fm3 6.11-7.71 0.062-1.092<br />
T 6.22-9.45 0.047-5.880<br />
U 7.41-8.95 0.088-1.376<br />
The primary purpose of the XRF analyses was to obtain measurements of the abundances of<br />
K, Th, and U, should detailed interpretation of the gamma-ray radiometric data be required.<br />
The radiometric data was essential in mapping the distribution of different classes of surface<br />
materials, in particular differentiating between floodplain, terrace, and uplands in areas of<br />
poor DEM control.<br />
1. The samples were pulverized using a tungsten carbide mill and the elements were<br />
analyzed by XRF. For major element determination (SiO 2 , TiO 2 , Al 2 O 3 , Fe 2 O 3 , MnO,<br />
MgO, CaO, Na 2 O, K 2 O, P 2 O 5 , and S), samples were prepared as fused discs following<br />
the method of Norrish & Hutton (1964), with the exception that the flux used<br />
consisted of 12 parts lithium tetraborate to 22 parts lithium metaborate. The glass<br />
discs were analyzed on a PW2400 wavelength dispersive X-ray fluorescence (XRF)<br />
spectrometer. The 35 trace elements were determined on pressed powder samples<br />
using a SPECTRO X-Lab energy dispersive XRF spectrometer. The powders were<br />
also measured on a PW1400 wavelength dispersive XRF spectrometer for Sc, V and<br />
Cr, using methods described in Chappell (1991) and Norrish & Chappell (1967).<br />
Tungsten and Co were probably added to the samples during the milling process, and<br />
hence these elements have not been reported. The major elements and minor element<br />
values are shown as % and ppm respectively.<br />
2. The percentage of volatile materials in the samples was determined using a LECO<br />
RC-412 multiphase carbon and water analyzer. Nitrogen was used as the carrier gas<br />
for combustion and the furnace control system allows the temperature of the furnace<br />
to be stepped and subjected to ramping (from 90 to 1040 o C). Water and carbon<br />
dioxide released from the minerals during combustion are detected by means of<br />
infrared absorption cells (IR-cells) and the results are then calculated as CO 2 and H 2 O<br />
respectively.<br />
6.3.2 Results<br />
Only a limited number of comparisons were made because of time limitations and the<br />
departure of the primary source of soil science expertise within the team (VW). Major<br />
elements correlated reasonably well with what can be predicted from the main minerals<br />
present.<br />
The XRF results reflect the high quartz content of the soils with high SiO 2 concentrations<br />
across all geomorphic units and depths. Higher concentrations of CaO found in the Terrace<br />
and Uplands units are most likely due to the presence of CaCO 3 pisoliths, which were noted<br />
19
when sampling. This is also reflected in the higher pH of the Terrace and Uplands units<br />
(Table 3).<br />
The K, U, and Th concentrations generally reflect that seen in airborne gamma ray<br />
radiometric data illustrated in Appendix 4, with higher concentrations of the three<br />
radioelements in the units found within the Murray River Trench, and lower concentrations in<br />
the Uplands.<br />
6.4 XRD mineralogy<br />
6.4.1 Methods<br />
X-Ray defraction is an effective way of accurately determining mineralogy. Mineralogy is<br />
important to the study the mineral suite can influence conductivity and clay types effect<br />
porosity and permeability and surface recharge behaviour.<br />
Samples were analysed using both semi-quantitative XRD and qualitative PIMA methods.<br />
Samples for XRD were scanned on a Siemens D500 Diffractometer, from 2° to 70° 2θ, in 1°<br />
increments, 2 seconds per degree, using a Cu anode X-ray tube. Minerals were identified<br />
using Bruker Diffrac plus and Siroquant V3 was used to quantify minerals. The samples are<br />
characterised by simple scans, containing predominant Quartz peaks with accessory mica<br />
(probably Muscovite), feldspar and clay (probably Kaolin). Specific feldspars have been<br />
identified according to best-fit of peaks. Further petrological work would be required to<br />
conclusively identify feldspars.<br />
6.4.2 Results<br />
XRD shows that the samples all contain quartz, muscovite, and microcline. Kaolinite and<br />
albite are present in almost all. These results are consistent with the samples being composed<br />
of two sediment types, a slightly feldspathic micaceous quartz sand and kaolinitic quartz silt<br />
with very fine-grained detrital muscovite.<br />
The relationship between distribution of clay species and provenance would be worth further<br />
investigation (c.f. Ginegle and de Deckker 2004). However it is beyond the scope of this<br />
investigation as it would require clay-specific mineral separates to be prepared.<br />
Table 3. Mean values of selected XRF analyses<br />
Geomorphic<br />
Unit<br />
Fm1<br />
Fm2<br />
Fm3<br />
T<br />
U<br />
Depth Al2O CaO Cl Fe2O3 K2O Na2O S (%) SiO2 Th (%) U (%)<br />
(m) 3 (%) (%) (%) (%) (%) (%)<br />
(%)<br />
0.0-0.1 10.75 0.44 0.548 3.24 2.07 0.46 0.460 72.26 0.01960 0.00722<br />
0.1-0.2 10.13 0.38 0.367 2.83 2.09 0.49 0.281 76.99 0.01160 0.00410<br />
0.2-0.3 9.60 0.36 0.361 2.66 1.97 0.50 0.195 78.64 0.01320 0.00494<br />
0.0-0.1 14.31 0.47 1.296 4.74 2.22 0.50 0.283 64.75 0.01400 0.00670<br />
0.1-0.2 13.91 0.45 0.955 4.51 2.19 0.57 0.206 66.91 0.02050 0.00535<br />
0.2-0.3 14.10 0.45 0.822 4.59 2.18 0.58 0.199 66.44 0.02000 0.00540<br />
0.0-0.1 10.36 0.49 0.172 2.93 2.20 0.58 0.160 75.47 0.01925 0.00708<br />
0.1-0.2 11.02 0.50 0.371 3.23 2.21 0.58 0.151 74.62 0.01325 0.00565<br />
0.2-0.3 11.52 0.53 0.639 3.45 2.24 0.61 0.163 73.54 0.01750 0.00465<br />
0.0-0.1 12.64 1.81 2.440 4.63 1.99 0.51 0.329 66.52 0.01460 0.00084<br />
0.1-0.2 10.99 1.83 2.303 3.98 1.77 0.51 0.300 70.38 0.01720 0.00556<br />
0.2-0.3 10.63 1.67 3.319 3.85 1.74 0.62 0.280 71.86 0.01140 0.00292<br />
0.0-0.1 5.23 3.48 0.082 1.92 0.99 0.00 0.244 79.92 0.01025 0.00243<br />
0.1-0.2 4.97 3.71 0.473 1.81 0.93 0.07 0.209 81.08 0.01375 0.00388<br />
0.2-0.3 4.91 5.65 0.532 1.80 0.87 0.07 0.296 76.15 0.00650 0.00213<br />
20
7 IMPLICATIONS<br />
7.1 Hydrogeological issues<br />
7.1.1 Flow<br />
The geomorphological interpretation of the data suggests that shallow groundwater flow may<br />
be strongly compartmentalised along the Murray River between different aged floodplain<br />
units, and possibly between different sedimentary units within each of the three mapped<br />
floodplain units. At depth, where similar sandy units of different ages may be juxtaposed,<br />
cross flow between meander belts of different ages is possible.<br />
It also appears that materials filling the incised valley of the River Murray are inset within<br />
intermediate Murray basin units (in this reach the Blanchetown Clay, which is covered by<br />
dunes and slope deposits). Similarly, the Coonambigdal Formation is inset within the Rufus<br />
Formation (as suggested by Gill (1973), and shown in cross sections by Rogers and<br />
Gatehouse 1990). Modern, intermediate and oldest floodplain units and deposits<br />
compartmentalise the Coonambigdal Formation, as suggested above. Different ages of the<br />
units mean that they have different properties, especially in the amount of clay at the surface,<br />
which in turn has important implications for recharge (see below). These differences occur<br />
across the axis of the floodplain, because of poor interconnections between morphosedimentary<br />
units, and possibly down axis, within morpho-sedimentary units.<br />
7.1.2 Recharge<br />
As a result of the points discussed in the last section, we predict the following recharge<br />
characteristics:<br />
• All but the youngest floodplain sediments are sealed by dispersive clays; hence there<br />
will be little or no recharge on intermediate floodplain and terrace units.<br />
• Active channels have sand bottoms, but once flow stops and they become inactive,<br />
they become clay-lined (Figure 12), with the result that there is no recharge via<br />
abandoned channels. Cracking clays are of limited extent, and only in abandoned<br />
channel. There is limited bypassing of surface clays by water in initial heavy rainfall<br />
events through these cracks.<br />
• The presence of sand dunes on the terrace means there is localised high infiltration,<br />
which in turn results in local perching of water on underlying floodplain clays. For<br />
the source bordering dunes on the older floodplain meander belts there may be a<br />
direct connection between the dunes and the underlying scroll bars, bypassing the<br />
clay drapes. However, the spatial extent of the dunes is insignificant.<br />
Width of vegetation zones also helps in the assessment of recharge:<br />
• Zones of healthy vegetation (red in ASTER images – Appendix 1) are widest on<br />
modern floodplain units where the scroll bars consist of exposed sand, suggesting<br />
extensive flushing of saline water from runoff, infiltration, and through flowing river<br />
waters.<br />
• These zones are much narrower in abandoned or inset channels (e.g. Wallpolla<br />
Creek), indicating less flushing, possibly due to isolation of water in channels from<br />
surrounding floodplain by the clay seal at the bottom.<br />
21
Figure 12. SPOT image of Wallpolla Creek (containing water at time imaged) and clay-lined<br />
nature of dried up channel of Wallpolla Creek as seen at ground level. Width of image is ~10 km,<br />
north to top.<br />
7.1.3 Relevance to land management questions<br />
The results of the study to date can be compared back against the six land management<br />
questions raised by Lawrie (2006). We make the following conclusions with respect to each.<br />
Question 1: What is the potential for salt mobilisation during Living Murray inundation<br />
actions?<br />
To answer this question will require integration of the surface data (LIDAR DEM, soil pits,<br />
and satellite imagery) with the results of the AEM survey and bore hole data. Integrated<br />
products relating to salt mobilisation potential are found in the GIS and Atlas, in particular the<br />
Flush Zone Thickness, Flush Zone Conductivities, Extent of Flush Zones, Groundwater<br />
Recharge, Conductive Groundwater, Conductive Soils, Surface Salinity, Salinity Hazard, and<br />
Salt Store maps.<br />
Question 2: Delivery of salt to the river<br />
To answer this question will likewise require integration of the surface data (LIDAR DEM,<br />
soil pits, and satellite imagery) with the results of the AEM survey and bore hole data to<br />
identify various potential pathways, in particular the channels along which surface and<br />
groundwater is most likely to flow. Integrated products relating to salt mobilisation potential<br />
are found in the GIS and Atlas again include the Flush Zone Thickness, Flush Zone<br />
Conductivities, Extent of Flush Zones, Groundwater Recharge, Conductive Groundwater,<br />
Conductive Soils, Surface Salinity, Salinity Hazard, and Salt Store maps.<br />
22
Question 3: Understanding of the drivers of floodplain health with respect to groundwater<br />
processes<br />
The combined LIDAR and SPOT/ASTER interpretation assisted in mapping floodplain health<br />
and allowed prediction of the geomorphic, soil, and sedimentologic parameters influencing<br />
associated with salt stores and recharge, important to the health of floodplain vegetation.<br />
Integrated products relating to floodplain health are found in the GIS and Atlas and include<br />
the Conductive Groundwater, Conductive Soils, Surface Salinity, Salinity Hazard, and Salt<br />
Store maps.<br />
Question 4: Identification of the high recharge areas in the floodplain?<br />
ASTER and LIDAR interpretation we predict will identify potential areas on the basis of<br />
abandoned or stagnant river channels or scroll bars lacking an impermeable clay drape. These<br />
will need to be field verified, however, especially as stagnant or abandoned channels may<br />
well have their bottoms sealed by clay. This would leave only the youngest meander scroll<br />
bars which lack the pervasive clay drape, or where the clay drape is very thin, as areas of high<br />
potential recharge on the floodplain. Mapping surface recharge are found in the GIS and<br />
Atlas include the Flush Zone Thickness, Flush Zone Conductivities, Extent of Flush Zones,<br />
and Groundwater Recharge maps.<br />
Question 5: What is the extent and thickness of the Blanchetown Clay and the Coonambidgal<br />
Formation?<br />
We can’t answer this question in this area from surface exposures as imaged by satellites or<br />
scanned to form DEMS. Nor are they visible in preliminary field observations. We regard<br />
this question as answerable only through a combination of AEM and bore hole data, as<br />
showing the Thickness of Quaternary Alluvium, Extent of Quaternary Alluvium, and Depth<br />
to Top of Blanchetown Clay maps in the GIS and Atlas.<br />
Question 6: Where is salt stored in the unsaturated zone?<br />
We predict that contextualised analysis of surface soil samples will help identify these areas<br />
of salt storage, backed up by analysis of shallow (above the water table) borehole samples.<br />
integrated products relating to salt stores Conductive Groundwater, Conductive Soils, Surface<br />
Salinity, Salinity Hazard, and Salt Store maps in the GIS and Atlas.<br />
23
REFERENCES<br />
Bowler, J.M. and Harford, L.B. 1966. Quaternary tectonics and the evolution of the riverine<br />
plain near Echuca, Victoria. Journal of the Geological Society of Australia 13(2), 339-<br />
354.<br />
Brown, C.M. and Stephenson, A.E. 1991. Geology of the Murray Basin, southeastern<br />
Australia. BMR Bulletin 235.<br />
Butler, B.E. 1958. Depositional systems of the riverine plain of south-eastern Australia in<br />
relation to soils. Commonwealth Scientific and Industrial Research Organisation, Soil<br />
Publication 10, 35p.<br />
Butler, B.E., Blackburn, G., Bowler, J.M., Lawrence, C.R., Newell, J.W., Pels, S. 1973. A<br />
Geomorphic Map of the Riverine Plain of South-eastern Australia. Australian National<br />
University Press, Canberra.<br />
Chappell, B.W. 1991. Trace element analysis of rocks by X-ray spectrometry. Advances in X-<br />
Ray Analysis 34, 263-276.<br />
Chen, X.Y. 1995. Geomorphology, stratigraphy and thermoluminescence dating of the lunette<br />
dune at Lake Victoria, western New South Wales. Palaeogeography,<br />
Palaeoclimatology, Palaeoecology 113, 69-86.<br />
Gill, E.D. 1973. Geology and geomorphology of the Murray River region between Mildura<br />
and Renmark, Australia. Memoirs of the National Museum of Victoria 34, 1-97.<br />
Gingele, F.X. and De Deckker, P. 2004. Fingerprinting Australia's rivers with clay minerals<br />
and the application for the marine record of climate change. Australian Journal of<br />
Earth Sciences 51(3), 339-348.<br />
Hills, E.S. 1975. Physiography of Victoria; an Introduction to Geomorphology. Whitcombe<br />
& Tombs Pty. Ltd., Australia, 373p.<br />
Jolly, I.D., Walker, G.R., and Thorburn, P.J. 1993. Salt accumulation in semi-arid floodplain<br />
soils with implications for forest health. Journal of Hydrology, 150(2-4), 589-614.<br />
Knighton, A.D. and Nanson, G.C. 2000. Waterhole form and process in the anastomosing<br />
channel system of Cooper Creek, Australia Geomorphology, 35(1-2), 101-117.<br />
Kotsonis, A., Cameron, K.J., Bowler, J.M., and Joyce, E.B. 1999. Geomorphology of the<br />
Hattah Lakes region on the River Murray, southeastern Australia; a record of late<br />
Quaternary climate change. Proceedings of the Royal Society of Victoria, 111(1), 27-<br />
42.<br />
Lawrie. K. 2006 (comp.) Report by technical working group chair on proposed River Murray<br />
corridor (South Australian border to Gunbower) Victorian AEM mapping project. <strong>CRC</strong><br />
<strong>LEME</strong> Restricted Report 265R.<br />
McDonald RC and Isbell RF (1998) Soil Profile. In "Australian Soil and Land Survey" (Eds<br />
RC McDonald, RF Isbell, JG Speight, J Walker and MS Hopkins) pp. 103-152.<br />
(CSIRO: Australia).<br />
24
Macumber, P.G. 1977. The geology and palaeohydrology of the Kow Swamp fossil hominid<br />
site, Victoria, Australia. Journal of the Geological Society of Australia, 24(6), p.307-<br />
320.<br />
Norrish, K. and Chappell, B. W. 1967. X-ray fluorescence spectrography. In Zussman, J.<br />
(ed.) Physical methods in determinative mineralogy. Academic Press, London.<br />
Norrish and Hutton 1969. 1969. An accurate X-ray spectrographic method for the analysis of<br />
a wide range of geological samples. Geochimica et Ccosmochica. Acta 33 431-453.<br />
Pels, S. 1966. Late Quaternary chronology of the riverine plain of southeastern Australia.<br />
Journal of the Geological Society of Australia 13(1), 27-40.<br />
Rawle, A.F. 2003. Method development for particle size measurement by laser diffraction.<br />
Particulates Systems Analysis Conference (2003), Harrogate, UK<br />
Reid, M. 2007. Hydrogeological Review of the Victorian Side of the Murray River<br />
Floodplain Site (Gunbower Island to Lindsay Wallpolla). <strong>CRC</strong> <strong>LEME</strong> Restricted<br />
Report 257R, 71pp.<br />
Rogers, P.A. and Gatehouse, C.G. 1990. Late Quaternary stratigraphy of the Roonka<br />
archaeological sites. Quarterly Geological Notes - Geological Survey of South<br />
Australia, 113, 6-14.<br />
Rowan, J.N. and Downes, R.G. 1963 A study of the land in North-Western Victoria. Soil<br />
Conservation Authority of Victoria Technical Communication No.2. (Government<br />
Printer, Melbourne).<br />
SKM (2004). Lindsay River Groundwater Interception Investigation – summary report.<br />
Version: Final 1, August 2004. Project WC00817.<br />
Specht, R.L. 1981. Foliage projective cover and standing biomass. In Vegetation<br />
classification in Australia. (Eds AN Gillison, DJ Anderson) pp. 10-21. (CSIRO &<br />
ANU: Canberra).<br />
Thoms, M.C., Ogden, R.W., and Reid, M.A. (1999). Establishing the condition of lowland<br />
floodplain rivers: a palaeo-ecological approach. Freshwater Biology 41, 407-425.<br />
Twidale, C.R., Lindsay, J.M., and Bourne, J.A. 1978. Age and origin of the Murray River and<br />
gorge in South Australia. Proceedings of the Royal Society of Victoria, 90 (1), 27-42.<br />
25
APPENDIX 1. ASTER data and interpretation<br />
26
Surface properties map interpreted from ASTER data<br />
27
APPENDIX 2. SPOT Data and interpretation<br />
28
Vegetation map interpreted from SPOT data<br />
29
APPENDIX 3. DEM data and interpretation<br />
30
Landforms interpreted from DEM data<br />
31
APPENDIX 4. Gamma-ray data<br />
500000<br />
(m)<br />
100<br />
40<br />
500000<br />
520000<br />
520000<br />
540000<br />
560000<br />
580000<br />
600000<br />
540000<br />
560000<br />
580000<br />
600000<br />
32<br />
6200000<br />
6220000<br />
6240000<br />
6200000<br />
6220000<br />
6240000<br />
Lindsay - Wallpolla<br />
±<br />
Ternary - gamma ray<br />
0 10 20 km
APPENDIX 5. Surface materials<br />
33
APPENDIX 6. Site Descriptions and Data<br />
Site 1<br />
Corner of Keera and Old Mail roads<br />
Coordinates<br />
MGA94 54H 0559602E 6215494N<br />
Location description<br />
Upper terrace. Scattered saltbush (Atriplex spp) and grasses<br />
Site description<br />
Thin residual aeolian sand ~10 cm thick.<br />
Soil Profile<br />
Depth (cm) Munsell Field Texture Structure Comments<br />
colour<br />
0-10 7.5YR 3/4 Loamy sand Angular-blocky Extensive roots<br />
10-20 7.5YR 4/6 Medium clay Massive Compacted red clay;<br />
roots present<br />
20-30 7.5YR 5/6 Medium clay Massive Compacted red clay;<br />
roots present<br />
34
Site 2<br />
Along Keera Road<br />
Coordinates<br />
0559983E 6214068N<br />
Location description<br />
Terrace<br />
Saltbush (Atriplex sp.) shrubland with minor pig face and microbiotic soil crust on surface; Black Box<br />
(Eucalyptus largiflorens) savannah in distance.<br />
Site description<br />
Soil Profile<br />
Depth (cm) Munsell<br />
colour<br />
0-10 7.5YR 5/2 Sandy loam Sub-angular<br />
blocky<br />
Field Texture Structure Comments<br />
10-20 10YR 5/2 Clay loam Sub-angular<br />
blocky<br />
20-30 10YR 5/3 Clay loam Sub-angular<br />
blocky<br />
Cryptogamic crust on<br />
surface; extensive fine<br />
roots; some charcoal<br />
present<br />
Fine roots present<br />
Fine roots present<br />
35
Site 3<br />
South Settlement road, ~20 m S of main highway.<br />
Coordinates<br />
0508922E 6207161N<br />
Location description<br />
Uplands<br />
Low, degraded dunes, grass, herbaceous ephemerals, saltbush shrubland, microbiotic crust<br />
Site description<br />
Sampled 1 day after ~150 mm rain, only top 25 mm is moist.<br />
Soil Profile<br />
Depth (cm) Munsell Field Texture Structure Comments<br />
colour<br />
0-10 5YR 3/4 Loamy sand Weak Extensive roots; calcrete<br />
throughout<br />
10-20 5YR 3/4 Loamy sand Weak Extensive roots; calcrete<br />
throughout<br />
20-30 5YR 4/6 Loamy sand Weak Some roots present;<br />
calcrete throughout<br />
36
Site 4<br />
Corner Irwin road and highway, ~3 km E of Meringur, ~30 m S of highway.<br />
Coordinates<br />
Not collected.<br />
Location description<br />
Uplands. Undulating red dunes, road reserve surrounded by cultivated wheat. Sample collected under<br />
mallee gum with scattered saltbush, microbiotic crust<br />
Site description<br />
Soil Profile<br />
Depth (cm) Munsell Field Texture Structure Comments<br />
colour<br />
0-20 5YR 3/4 Loamy sand Weak Fine roots present; thick<br />
layer of leaf litter; minor<br />
occurrences of charcoal<br />
10-20 10R 3/4 Loamy sand Weak Clear boundary at 16 cm<br />
to possible former soil<br />
topsoil horizon; minor<br />
occurrences of charcoal<br />
20-30 2.5YR 5/1 Loamy sand Sub-angular<br />
blocky<br />
Extensive charcoal<br />
37
Site 5<br />
Western end of Keera Road, south side.<br />
Coordinates<br />
0567539E 6209595N<br />
Location description<br />
Uplands, degraded sand dunes<br />
Site description<br />
Vegetated road reserve surrounded by cultivated wheat. Native vegetation largely cleared for wheat,<br />
remnants along road corridor of mallee with saltbush understorey and microbiotic crust, soil moist to<br />
10 cm<br />
Soil Profile<br />
Depth (cm) Munsell Field Texture Structure Comments<br />
colour<br />
0-10 2.5YR 3/3 Loamy sand Weak Cryptogamic crust on<br />
surface; loamy sand;<br />
roots present; minor<br />
occurrences of charcoal<br />
10-20 7.5YR 5/6 Loamy sand Sub-angular<br />
blocky<br />
10-30 10YR 5/8 Loamy sand Sub-angular<br />
blocky<br />
Clear boundary;<br />
extensive carbonate<br />
pisoliths<br />
Extensive carbonate<br />
pisoliths<br />
38
Site 6<br />
20 E of intersection of highway and Pratt road, south side of road, opposite sand quarry.<br />
Coordinates<br />
0585156E 62909373N<br />
Location description<br />
Uplands, in swale of degraded dunes. Vegetated road reserve; native vegetation largely cleared for<br />
wheat. Mallee gums and scattered salt bush, minor microbiotic crust<br />
Site description<br />
Soil Profile<br />
Depth (cm) Munsell Field Texture Structure Comments<br />
colour<br />
0-20 5YR 3/4 Clay loam Angular blocky Roots throughout; minor<br />
occurrences of charcoal<br />
10-20 2.5YR 3/4 Clay loam Angular blocky Roots present; minor<br />
occurrences of charcoal<br />
20-30 5YR 3/4 Medium clay Angular blocky Diffuse boundary; roots<br />
present<br />
39
Site 7<br />
Eastern end of Old Mail Rd to the north of road edge.<br />
Coordinates<br />
0588350E 6220011N<br />
Location description<br />
Terrace; saltbush shrubland<br />
Site description<br />
Soil Profile<br />
Depth (cm) Munsell Field Texture Structure Comments<br />
colour<br />
0-10 7.5YR 4/2 Sandy loam Weak Fine roots throughout;<br />
weakly structured<br />
10-20 10YR 5/2 Sandy loam Weak Boundary at 10 cm; fine<br />
roots throughout<br />
20-30 2.5Y 5/2 Clay loam Angular-blocky Fewer fine roots than<br />
previous layer<br />
40
Site 8<br />
Along Mail road towards Walpolla Island, about 1 km E of Dedmens Road turnoff, to N of road<br />
Coordinates<br />
0578099E 6218940N<br />
Location description<br />
Terrace. Scattered mallee Eucalyptus trees (savannah-like) with saltbush shrubland and pigface<br />
understorey<br />
Site description<br />
Soil Profile<br />
Depth (cm) Munsell Field Texture Structure Comments<br />
colour<br />
0-10 10YR 4/2 Medium clay Angular-blocky Fine roots throughout<br />
10-20 2.5Y4/2 Medium clay Angular-blocky Fine roots present<br />
20-30 2.5Y 3/2 Medium clay Angular-blocky Fine roots present<br />
41
Site 12<br />
Further to west along Old Mail Rd; west of Dedman’s Track<br />
Coordinates<br />
None collected.<br />
Location description<br />
Terrace, residual aeolian sand, with scattered salt bush and areas of local deflation barren of<br />
vegetation. Scattered saltbush and pigface<br />
Site description<br />
Orange sand on surface formed by winnowing. Site interpreted as a dune over the flood plain clays.<br />
Soil Profile<br />
Depth (cm) Munsell Field Texture Structure Comments<br />
colour<br />
0-10 7.5YR 4/6 Loamy sand Weak Fine roots present<br />
10-20 7.5YR 4/6 Sandy loam Weak Yellow mottles present;<br />
fine roots present<br />
20-30 10YR 4/6 Light clay Sub-angular<br />
blocky<br />
Red mottles; diffuse<br />
boundary; coarse and<br />
fine roots present<br />
42
Site 13<br />
Murray river bank between Lindsay and Wallpolla islands.<br />
Coordinates<br />
0547327E 6213755N<br />
Location description<br />
Modern flood plain abutted against cut bank of upper terrace. Flood plain is very narrow (less than 30<br />
m) and may be an erosional rather than depositional surface. Site lies next to straight stretch of river –<br />
no scroll bars. Open forest of river gums with grassy understorey<br />
Site description<br />
Soil Profile<br />
Depth (cm) Munsell<br />
colour<br />
0-10 10YR 3/3 Sandy loam Sub-angular<br />
blocky<br />
Field Texture Structure Comments<br />
10-20 2.5YR 5/3 Loamy sand Sub-angular<br />
blocky<br />
Boundary between<br />
sandy loam and loamy<br />
sand at 7 cm; fine and<br />
coarse roots present<br />
Slightly bleached layer<br />
7-17 cm; fine and coarse<br />
roots present<br />
20-30 10YR 5/4 Light clay Angular-blocky Fine and coarse roots<br />
present<br />
43
Site 14<br />
Dedmens drive, across abandoned channel near turnoff from mail road.<br />
Coordinates<br />
0577046E 6219157N<br />
Location description<br />
Intermediate flood plain meander belt. Very flat surface of Black Box open woodland, understorey of<br />
saltbush and other small shrubs, and groundcover of herbaceous ephemerals and pigface. Some<br />
microbiotic crusts.<br />
Site description<br />
Soil Profile<br />
Depth (cm) Munsell<br />
colour<br />
0-10 10YR 5/2 Loamy sand Sub-angular<br />
blocky<br />
Field Texture Structure Comments<br />
10-20 10YR 4/3 Clay loam Sub-angular<br />
blocky<br />
10-30 2.5YR 4/4 Clay loam Sub-angular<br />
blocky<br />
Cryptogamic surface<br />
crust; fine roots<br />
throughout<br />
Boundary at 10 cm; fine<br />
roots present; some<br />
coarse roots<br />
Fine roots present; some<br />
coarse roots<br />
44
Site 15<br />
Location known as “River access 10”<br />
Coordinates<br />
05732613E 6224797N<br />
Location description<br />
Modern flood plain meander belt, inside of meander loop, with well developed scroll bars. Well<br />
developed river red gum open forest, trees somewhat smaller than on intermediate scroll bar sites.<br />
Limited ground cover apart from some sedges.<br />
Site description<br />
Youngest scroll bar, no leaf litter on ground, soil sandy micaceous silt. Contacts in pit parallel to<br />
riverward sloping surface.<br />
Soil Profile<br />
Depth (cm) Munsell<br />
colour<br />
0-10 10YR 4/6 Loamy sand Sub-angular<br />
blocky<br />
Field Texture Structure Comments<br />
10-20 2.5Y 6/6 Loamy sand Sub-angular<br />
blocky<br />
20-30 10YR 6/4 Loamy sand Sub-angular<br />
blocky<br />
Sandy; fine roots<br />
throughout; some coarse<br />
roots present; clay layer<br />
3-7 cm; yellow mottles<br />
present<br />
Fine and coarse roots<br />
present; mottling; clay<br />
layer 14-16 cm<br />
Mottling; fine and<br />
coarse roots present;<br />
mottling<br />
45
Site 16<br />
Same area as previous sample<br />
Coordinates<br />
0573642E 6224709N<br />
Location description<br />
Modern flood plain, inside of meander loop, with well developed scroll bars. Well developed River<br />
Red Gum open forest, trees somewhat smaller than on intermediate scroll bar sites. Limited ground<br />
cover apart from some sedges.<br />
Site description<br />
Youngest scroll bar swale, no leaf litter on ground, soil sandy micaceous silt. Contacts in pit parallel<br />
to surface. Soil profile more developed than to Site 15.<br />
Soil Profile<br />
Depth (cm) Munsell<br />
colour<br />
0-10 10YR 6/6 Loamy sand Sub-angular<br />
blocky<br />
Field Texture Structure Comments<br />
Darker organic layer (0-<br />
2 cm); fine and coarse<br />
roots present; lighter<br />
mottles present<br />
10-20 10YR 7/4 Loamy sand Weak Fine roots present; Clay<br />
layer slightly bleached<br />
(15-18 cm)<br />
20-30 10YR 6/4 Clayey sand Sub-angular<br />
blocky<br />
Coarse and fine roots<br />
present<br />
46
Site 17<br />
Sample location as previous two sites<br />
Coordinates<br />
0573613E 6224767N<br />
Location description<br />
Modern flood plain, inside of meander loop, with well developed scroll bars. Well developed river red<br />
gum forest, with large trees. No understorey and ground covered with thick layer of dark, branch and<br />
leaf litter.<br />
Site description<br />
Crest of old scroll bar. Pit wall profile consists of 0-5 cm A horizon, 5-26 cm grey-yellow sand, 26-35<br />
cm orange-grey mottled clayey sand.<br />
Soil Profile<br />
Depth (cm) Munsell<br />
colour<br />
0-10 10YR 5/4 Sandy loam Sub-angular<br />
blocky<br />
Field Texture Structure Comments<br />
10-20 10YR 5/3 Clay loam Sub-angular<br />
blocky<br />
10-30 10YR 5/4 Clay loam Sub-angular<br />
blocky<br />
Darker organic layer to 5<br />
cm; extensive coarse<br />
roots; charcoal present;<br />
organic material<br />
incorporated<br />
Diffuse boundary at 10<br />
cm; mottles present;<br />
some coarse roots;<br />
extensive fine roots<br />
Mottles present; some<br />
coarse roots; extensive<br />
fine roots<br />
47
Site 18<br />
Same location as 17, intermediate swale.<br />
Coordinates<br />
0573619E 6224730N<br />
Location description<br />
Modern flood plain, inside of meander loop, with well developed scroll bars. Well developed river red<br />
gum open forest. No understorey and ground covered thick layer of dark, branches, twigs, and general<br />
litter.<br />
Site description<br />
Intermediate swale to scroll bar of site 17.<br />
Soil Profile<br />
Depth (cm) Munsell<br />
colour<br />
0-10 10YR 6/4 Loamy sand Sub-angular<br />
blocky<br />
Field Texture Structure Comments<br />
10-20 10YR 5/4 Clayey sand Sub-angular<br />
blocky<br />
20-30 10YR 3/6 Clayey sand Sub-angular<br />
blocky<br />
Organic topsoil to 3 cm;<br />
extensive coarse and<br />
fine roots; yellow<br />
mottles<br />
Fine and coarse roots<br />
throughout; red mottles<br />
present<br />
Mottled with grey and<br />
red clay; fine and coarse<br />
roots throughout<br />
48
Site 19<br />
Dedmens Track, just to east of Lily lagoon<br />
Coordinates<br />
0575312E 622426N 35 m<br />
Location description<br />
Intermediate floodplain meander belt, covered by black box woodland and minor river gum.<br />
Understorey of saltbush and prickly shrubs. Groundcover of pigface.<br />
Site description<br />
Wetting front visible in pit at 10 cm depth, with surface 10 cm dry and deeper material moist.<br />
Soil Profile<br />
Depth (cm) Munsell<br />
colour<br />
0-10 10YR 5/3 Clay loam Sub-angular<br />
blocky<br />
Field Texture Structure Comments<br />
10-20 10YR 3/2 Light clay Sub-angular<br />
blocky<br />
20-30 10YR 3/2 Light clay Sub-angular<br />
blocky<br />
Thin layer of litter and<br />
organic layer to depth of<br />
20 cm; extensive fine<br />
and coarse roots; red<br />
mottles<br />
Extensive fine and<br />
coarse roots; red mottles<br />
Red and yellow mottles;<br />
charcoal present<br />
49
Site 20<br />
Adjacent to previous site<br />
Coordinates<br />
0575309E 6223397N 33m<br />
Location description<br />
Swale immediately to South of site 19. Intermediate floodplain meander belt, covered by black box<br />
low woodland with occasional river red gum trees and an understorey of saltbush and prickly shrubs;<br />
groundcover of pigface.<br />
Site description<br />
Wetting front visible at 10 cm depth in pit, with surface 10 cm dry and deeper material moist.<br />
Soil Profile<br />
Depth (cm) Munsell<br />
colour<br />
0-10 10YR 5/2 Sandy loam Sub-angular<br />
blocky<br />
Field Texture Structure Comments<br />
Surface crust; surface<br />
layer of 0-3 cm most<br />
likely depositional<br />
material; extensive fine<br />
and coarse roots present<br />
10-20 10YR 3/2 Medium clay Angular blocky Diffuse boundary at 10<br />
cm; coarse and fine<br />
roots present with some<br />
large roots<br />
20-30 10YR 3/2 Medium clay Angular blocky Coarse and fine roots<br />
present with some large<br />
roots<br />
50
Site 21<br />
1 km east of Finnegans Bridge along Dedmans drive<br />
Coordinates<br />
0577135E 6221589N 32 m<br />
Location description<br />
Oldest floodplain meander belt, abandoned channel to south. Low open woodland of Black Box with<br />
occasional Acacia trees, saltbush understorey and pigface groundcover. Local areas bare of vegetation<br />
– possible salt scalds<br />
Site description<br />
Slight surface rise, possible residual source bordering dune on north side of abandoned channel.<br />
Soil Profile<br />
Depth (cm) Munsell<br />
colour<br />
0-10 10YR 4/3 Loamy sand Sub-angular<br />
blocky<br />
Field Texture Structure Comments<br />
10-20 10YR 6/2 Clay loam Sub-angular<br />
blocky<br />
10-30 10YR 6/2 Clay loam Sub-angular<br />
blocky<br />
Surface crust; extensive<br />
fine roots; some coarse<br />
roots present; loamy<br />
sand; sub-angular<br />
blocky structure<br />
Fine and coarse roots<br />
present<br />
Fine and coarse roots<br />
present<br />
51
Site 22<br />
2 km east of Finnegans bridge along Dedmans drive<br />
Coordinates<br />
05771298E 6220569N 32 m<br />
Location description<br />
Oldest floodplain meander belt with low open woodland of black box with saltbush understorey and<br />
groundcover of ephemeral herbs and pigface. Microbiotic crust.<br />
Site description<br />
Oldest floodplain meander belt, moist at depth.<br />
Soil Profile<br />
Depth (cm) Munsell<br />
colour<br />
0-10 2.5Y 5/2 Sandy loam Sub-angular<br />
blocky<br />
Field Texture Structure Comments<br />
10-20 10YR 4/2 Clay loam Sub-angular<br />
blocky<br />
20-30 10YR 3/2 Clay loam Sub-angular<br />
blocky<br />
Cryptogamic crust on<br />
surface; fine roots<br />
present<br />
Fine roots present<br />
Fine roots present<br />
52
Site 23<br />
3 km east of Finnegans bridge along Dedmans drive<br />
Coordinates<br />
0577110E 6219599N 36 m<br />
Location description<br />
Oldest floodplain meander belt with low open woodland of black box with saltbush understorey and<br />
groundcover of ephemeral herbs and pigface. Microbiotic crust.<br />
Site description<br />
Oldest floodplain meander belt<br />
Soil Profile<br />
Depth (cm) Munsell<br />
colour<br />
0-10 10YR 4/2 Sandy clay<br />
loam<br />
Field Texture Structure Comments<br />
Sub-angular<br />
blocky<br />
Cryptogamic crust on<br />
surface; fine and coarse<br />
roots present<br />
3-10cm 2.5Y 4/2 Clay loam Angular blocky Fine roots present; some<br />
coarse roots<br />
10-30 2.5Y 4/2 Clay loam Angular blocky Slightly bleached clay<br />
loam; fine roots present;<br />
some coarse roots;<br />
53
APPENDIX 7: Analytical Results<br />
Appendix 7.1 Area A soil EC and pH data<br />
Site<br />
No.<br />
Easting Northing Zone Geomorphic Unit Sample no Sample id<br />
Top Depth<br />
(m)<br />
Base<br />
Depth (m)<br />
pH (1:5)<br />
EC1:5<br />
(dS/m)<br />
Moisture<br />
content (%)<br />
Moisture<br />
content<br />
Apparent<br />
Conductivity (mS/m)<br />
1 559602 6215494 54 T 1929545 2007735000003 0.2 0.3 8.07 0.047 1.9 0.019 0.4415<br />
1 559602 6215494 54 T 1929544 2007735000002 0.1 0.2 7.77 0.093 4.3 0.043 1.9859<br />
1 559602 6215494 54 T 1929543 2007735000001 0 0.1 6.87 0.154 8.6 0.086 6.6359<br />
2 559983 6214068 54 T 1929552 2007735002001 0 0.1 7.69 0.141 15.1 0.151 10.6730<br />
2 559983 6214068 54 T 1929553 2007735001001 0 0.1 6.46 3.560 8.2 0.082 146.5999<br />
2 559983 6214068 54 T 1929554 2007735001002 0.1 0.2 6.95 4.400 10.0 0.100 219.9104<br />
3 508922 6207161 54 U 1929557 2007735002003 0.2 0.3 8.23 0.088 4.4 0.044 1.9356<br />
3 508922 6207161 54 U 1929555 2007735001003 0.2 0.3 7.41 0.121 9.6 0.096 5.7950<br />
3 508922 6207161 54 U 1929556 2007735002002 0.1 0.2 7.48 0.143 9.3 0.093 6.6842<br />
4 54 U 1929558 2007735003001 0 0.1 7.77 0.280 12.0 0.120 16.7899<br />
4 54 U 1929559 2007735003002 0.1 0.2 7.85 0.337 5.6 0.056 9.4394<br />
4 54 U 1929560 2007735003003 0.2 0.3 7.9 0.649 4.5 0.045 14.5530<br />
5 567539 6209595 54 U 1929561 2007735004001 0 0.1 8.32 0.172 14.2 0.142 12.1909<br />
5 567539 6209595 54 U 1929562 2007735004002 0.1 0.2 8.24 1.376 7.5 0.075 51.4535<br />
5 567539 6209595 54 U 1929563 2007735004003 0.2 0.3 8.71 1.396 5.0 0.050 34.9336<br />
6 585156 6209373 54 U 1929564 2007735005001 0 0.1 8.3 0.131 12.4 0.124 8.1391<br />
6 585156 6209373 54 U 1929565 2007735005002 0.1 0.2 8.46 0.132 12.4 0.124 8.1628<br />
6 585156 6209373 54 U 1929566 2007735005003 0.2 0.3 8.95 0.146 9.3 0.093 6.7402<br />
7 588350 6220011 54 T 1929567 2007735006001 0 0.1 8.23 0.383 16.5 0.165 31.6738<br />
7 588350 6220011 54 T 1929569 2007735006003 0.2 0.3 7.63 1.958 9.8 0.098 96.3224<br />
7 588350 6220011 54 T 1929568 2007735006002 0.1 0.2 7.44 2.720 8.5 0.085 116.1743<br />
8 578099 6218940 54 T 1929570 2007735007001 0 0.1 7.08 4.430 14.4 0.144 319.6108<br />
8 578099 6218940 54 T 1929571 2007735007002 0.1 0.2 6.48 5.280 12.2 0.122 322.9645<br />
8 578099 6218940 54 T 1929572 2007735007003 0.2 0.3 6.22 5.880 12.8 0.128 377.1160<br />
12 54 T 1929573 2007735008001 0 0.1 8.4 0.136 14.5 0.145 9.8353<br />
12 54 T 1929574 2007735008002 0.1 0.2 9.45 0.313 19.1 0.191 29.8550<br />
12 54 T 1929575 2007735008003 0.2 0.3 9.42 0.644 17.2 0.172 55.5301<br />
13 547327 6213755 54 Fm1 1929578 2007735009003 0.2 0.3 6.03 0.103 7.6 0.076 3.9314<br />
13 547327 6213755 54 Fm1 1929577 2007735009002 0.1 0.2 5.48 0.219 7.4 0.074 8.1425<br />
13 547327 6213755 54 Fm1 1929576 2007735009001 0 0.1 5.78 0.432 17.3 0.173 37.4592<br />
14 577046 6219157 54 Fm2 1929579 2007735010001 0 0.1 6.54 0.036 5.9 0.059 1.0647<br />
14 577046 6219157 54 Fm2 1929581 2007735010003 0.2 0.3 6.54 0.064 4.2 0.042 1.3375<br />
14 577046 6219157 54 Fm2 1929580 2007735010002 0.1 0.2 6.46 0.072 8.5 0.085 3.0321<br />
15 573613 6224797 54 Fm1 1929584 2007735011003 0.2 0.3 5.17 0.049 1.9 0.019 0.4777<br />
15 573613 6224797 54 Fm1 1929583 2007735011002 0.1 0.2 5.17 0.121 4.0 0.040 2.3938<br />
15 573613 6224797 54 Fm1 1929582 2007735011001 0 0.1 5.44 0.274 4.1 0.041 5.5749<br />
16 573642 6224709 54 Fm1 1929586 2007735012002 0.1 0.2 4.96 0.065 1.1 0.011 0.3733<br />
16 573642 6224709 54 Fm1 1929587 2007735012003 0.2 0.3 4.49 0.151 11.8 0.118 8.8813<br />
16 573642 6224709 54 Fm1 1929585 2007735012001 0 0.1 4.96 0.306 7.1 0.071 10.8724<br />
17 573613 6224767 54 Fm1 1929590 2007735013003 0.2 0.3 4.64 0.305 10.7 0.107 16.3014<br />
17 573613 6224767 54 Fm1 1929589 2007735013002 0.1 0.2 4.55 0.319 10.3 0.103 16.4784<br />
17 573613 6224767 54 Fm1 1929588 2007735013001 0 0.1 4.68 0.420 9.2 0.092 19.3826<br />
18 573619 6224730 54 Fm1 1929593 2007735014003 0.2 0.3 5.38 0.837 9.0 0.090 37.6448<br />
18 573619 6224730 54 Fm1 1929592 2007735014002 0.1 0.2 5.12 0.880 10.4 0.104 45.5714<br />
18 573619 6224730 54 Fm1 1929591 2007735014001 0 0.1 4.45 1.050 7.7 0.077 40.2715<br />
55
19 575312 6223426 54 Fm2 1929596 2007735015003 0.2 0.3 5.43 0.655 17.0 0.170 55.7158<br />
19 575312 6223426 54 Fm2 1929595 2007735015002 0.1 0.2 5.02 0.765 14.6 0.146 55.9986<br />
19 575312 6223426 54 Fm2 1929594 2007735015001 0 0.1 4.7 0.897 10.2 0.102 45.5330<br />
20 575309 6223397 54 Fm2 1929598 2007735016002 0.1 0.2 5.5 0.580 14.5 0.145 41.9638<br />
20 575309 6223397 54 Fm2 1929599 2007735016003 0.2 0.3 5.63 0.629 14.2 0.142 44.7195<br />
20 575309 6223397 54 Fm2 1929597 2007735016001 0 0.1 5.04 0.860 14.3 0.143 61.6493<br />
21 577135 6221589 54 Fm3 1929602 2007735017003 0.2 0.3 6.89 0.062 2.7 0.027 0.8520<br />
21 577135 6221589 54 Fm3 1929601 2007735017002 0.1 0.2 6.92 0.120 2.8 0.028 1.7017<br />
21 577135 6221589 54 Fm3 1929600 2007735017001 0 0.1 7.71 0.194 7.3 0.073 7.0851<br />
22 577129 6220569 54 Fm3 1929603 2007735018001 0 0.1 6.12 0.135 10.2 0.102 6.8579<br />
22 577129 6220569 54 Fm3 1929604 2007735018002 0.1 0.2 6.44 0.337 14.9 0.149 25.1013<br />
22 577129 6220569 54 Fm3 1929605 2007735018003 0.2 0.3 7.33 1.092 15.0 0.150 81.7332<br />
23 577110 6219599 54 Fm3 1929606 2007735019001 0 0.1 6.9 0.333 17.0 0.170 28.2659<br />
23 577110 6219599 54 Fm3 1929607 2007735019002 0.1 0.2 6.35 0.633 8.5 0.085 27.0221<br />
23 577110 6219599 54 Fm3 1929608 2007735019003 0.2 0.3 6.11 0.735 7.3 0.073 26.7368<br />
56
Appendix 7.2: Lindsay-Wallpolla Laser Grainsize<br />
Site No. Easting Northing Zone Geomorphic Unit Sample No. Sample ID<br />
Top Depth<br />
(m)<br />
Base Depth<br />
(m)<br />
% Clay (0.01-<br />
3.9um)<br />
% Silt (3.9-<br />
62.5um)<br />
% Sand (62.5-<br />
2000um)<br />
1 559602 6215494 54 T 1929543 2007735000001 0 0.1 49.013625 40.44339 10.542985 sandy silty clay<br />
1 559602 6215494 54 T 1929544 2007735000002 0.1 0.2 31.653135 35.105124 33.241741 clayey sandy silt<br />
1 559602 6215494 54 T 1929545 2007735000003 0.2 0.3 13.170829 28.151205 58.677967 clayey silty sand<br />
2 559983 6214068 54 T 1929553 2007735001001 0 0.1 38.702773 45.744681 15.552547 clayey sandy silt<br />
2 559983 6214068 54 T 1929554 2007735001002 0 0.1 38.812612 42.575983 18.611405 clayey sandy silt<br />
2 559983 6214068 54 T 1929555 2007735001003 0.1 0.2 43.46684 39.548039 16.985121 sandy silty clay<br />
3 508922 6207161 54 U 1929552 2007735002001 0.2 0.3 14.606886 21.289683 64.103431 clayey silty sand<br />
3 508922 6207161 54 U 1929556 2007735002002 0.1 0.2 14.26649 21.401724 64.331786 clayey silty sand<br />
3 508922 6207161 54 U 1929557 2007735002003 0.2 0.3 13.999694 27.122449 58.877858 clayey silty sand<br />
4 54 U 1929558 2007735003001 0 0.1 8.782439 20.907837 70.309724 clayey silty sand<br />
4 54 U 1929559 2007735003002 0.1 0.2 7.258914 13.010814 79.730272 clayey silty sand<br />
4 54 U 1929560 2007735003003 0.2 0.3 11.932722 31.660088 56.40719 clayey silty sand<br />
5 567539 6209595 54 U 1929561 2007735004001 0 0.1 23.622183 38.39483 37.982987 clayey sandy silt<br />
5 567539 6209595 54 U 1929562 2007735004002 0.1 0.2 25.299803 41.459818 33.240379 clayey sandy silt<br />
5 567539 6209595 54 U 1929563 2007735004003 0.2 0.3 19.422158 42.689089 37.888752 clayey sandy silt<br />
6 585156 6209373 54 U 1929564 2007735005001 0 0.1 24.531784 33.777051 41.691165 clayey silty sand<br />
6 585156 6209373 54 U 1929565 2007735005002 0.1 0.2 22.14742 33.67954 44.173041 clayey silty sand<br />
6 585156 6209373 54 U 1929566 2007735005003 0.2 0.3 21.486941 28.196652 50.316407 clayey silty sand<br />
7 588350 6220011 54 T 1929567 2007735006001 0 0.1 34.485996 43.646518 21.867486 sandy clayey silt<br />
7 588350 6220011 54 T 1929568 2007735006002 0.1 0.2 41.640062 35.911533 22.448405 silty sandy clay<br />
7 588350 6220011 54 T 1929569 2007735006003 0.2 0.3 36.858926 37.880844 25.26023 sandy silty clay<br />
8 578099 6218940 54 T 1929570 2007735007001 0 0.1 39.98115 40.63147 19.38738 sandy clayey silt<br />
8 578099 6218940 54 T 1929571 2007735007002 0.1 0.2 48.58403 35.377212 16.038758 sandy silty clay<br />
8 578099 6218940 54 T 1929572 2007735007003 0.2 0.3 49.946529 38.071546 11.981925 sandy silty clay<br />
12 54 T 1929573 2007735008001 0 0.1 32.503183 43.873865 23.622952 sandy clayey silt<br />
12 54 T 1929574 2007735008002 0.1 0.2 38.396651 34.884857 26.718492 sandy silty clay<br />
12 54 T 1929575 2007735008003 0.2 0.3 40.208695 35.400252 24.391052 sandy silty clay<br />
13 547327 6213755 54 Fm1 1929576 2007735009001 0 0.1 23.604778 51.087638 25.307585 clayey sandy silt<br />
13 547327 6213755 54 Fm1 1929577 2007735009002 0.1 0.2 26.125816 50.83291 23.041273 sandy clayey silt<br />
13 547327 6213755 54 Fm1 1929578 2007735009003 0.2 0.3 23.993866 42.181638 33.824496 clayey sandy silt<br />
14 577046 6219157 54 Fm2 1929579 2007735010001 0 0.1 13.202443 35.20898 51.588576 clayey silty sand<br />
14 577046 6219157 54 Fm2 1929580 2007735010002 0.1 0.2 21.584786 38.256587 40.158627 clayey silty sand<br />
14 577046 6219157 54 Fm2 1929581 2007735010003 0.2 0.3 22.047362 42.788564 35.164074 clayey sandy silt<br />
15 573613 6224797 54 Fm1 1929582 2007735011001 0 0.1 12.827616 36.880752 50.291633 clayey silty sand<br />
15 573613 6224797 54 Fm1 1929583 2007735011002 0.1 0.2 8.633833 25.831817 65.53435 silty sand<br />
15 573613 6224797 54 Fm1 1929584 2007735011003 0.2 0.3 5.304469 16.088957 78.606575 clayey silty sand<br />
16 573642 6224709 54 Fm1 1929585 2007735012001 0 0.1 12.012201 37.572623 50.415175 clayey silty sand<br />
16 573642 6224709 54 Fm1 1929586 2007735012002 0.1 0.2 5.071161 15.758901 79.169939 silty sand<br />
16 573642 6224709 54 Fm1 1929587 2007735012003 0.2 0.3 8.886184 26.999305 64.11451 silty sand<br />
17 573613 6224767 54 Fm1 1929588 2007735013001 0 0.1 19.744624 61.107202 19.148174 sandy clayey silt<br />
17 573613 6224767 54 Fm1 1929589 2007735013002 0.1 0.2 22.841994 57.299451 19.858555 sandy clayey silt<br />
17 573613 6224767 54 Fm1 1929590 2007735013003 0.2 0.3 23.722923 56.493711 19.783366 sandy clayey silt<br />
18 573619 6224730 54 Fm1 1929591 2007735014001 0 0.1 21.598942 60.259311 18.141748 sandy clayey silt<br />
18 573619 6224730 54 Fm1 1929592 2007735014002 0.1 0.2 26.21844 59.547105 14.234455 sandy clayey silt<br />
18 573619 6224730 54 Fm1 1929593 2007735014003 0.2 0.3 26.032841 56.585 17.382159 sandy clayey silt<br />
19 575312 6223426 54 Fm2 1929594 2007735015001 0 0.1 26.266812 59.618873 14.114314 sandy clayey silt<br />
19 575312 6223426 54 Fm2 1929595 2007735015002 0.1 0.2 29.631681 62.955823 7.412496 clayey silt<br />
19 575312 6223426 54 Fm2 1929596 2007735015003 0.2 0.3 33.51295 58.110959 8.376091 clayey silt<br />
57
20 575309 6223397 54 Fm2 1929597 2007735016001 0 0.1 40.72107 53.285863 5.993067 clayey silt<br />
20 575309 6223397 54 Fm2 1929598 2007735016002 0.1 0.2 41.608892 50.578808 7.8123 clayey silt<br />
20 575309 6223397 54 Fm2 1929599 2007735016003 0.2 0.3 44.831448 50.20324 4.965313 clayey silt<br />
21 577135 6221589 54 Fm3 1929600 2007735017001 0 0.1 14.861491 44.963318 40.175191 clayey silty sand<br />
21 577135 6221589 54 Fm3 1929601 2007735017002 0.1 0.2 15.2158 41.866588 42.917611 clayey silty sand<br />
21 577135 6221589 54 Fm3 1929602 2007735017003 0.2 0.3 16.566359 40.417336 43.016305 clayey silty sand<br />
22 577129 6220569 54 Fm3 1929603 2007735018001 0 0.1 29.260707 54.712465 16.026827 sandy clayey silt<br />
22 577129 6220569 54 Fm3 1929604 2007735018002 0.1 0.2 36.087475 46.237564 17.674961 clayey silty sand<br />
22 577129 6220569 54 Fm3 1929605 2007735018003 0.2 0.3 48.389037 42.122517 9.488446 silty clay<br />
23 577110 6219599 54 Fm3 1929606 2007735019001 0 0.1 43.872234 46.742235 9.38553 clayey silt<br />
23 577110 6219599 54 Fm3 1929607 2007735019002 0.1 0.2 45.877999 45.28752 8.834482 silty clay<br />
23 577110 6219599 54 Fm3 1929608 2007735019003 0.2 0.3 42.124149 47.852695 10.023157 sandy clayey silt<br />
58
Appendix 7.3: Lindsay-Wallpolla XRF results<br />
Site Batch No Sample ID Depth (cm) Morphology Al2O3 As Ba CaO Ce Cl Co Cr Cu F Fe2O3T K2O La MgO MLOI Calculate MnO W Y<br />
1 200709 1929543 0-10 Terrace 18.103 9.1 344 0.506 72 92 14 78 29 1129 6.989 2.411 39 2.073 11.343 0.063 3 29<br />
1 200709 1929544 10-20 Terrace 9.134 5.7 317 0.266 47 107 7 49 11 779 3.419 1.452 22 0.921 5.71 0.046 2 21<br />
1 200709 1929545 20-30 Terrace 4.963 4.9 224 0.141 35 27 3 35 8 871 1.78 1.041 22 0.352 1.897 0.031 -2 16<br />
2 200709 1929552 0-10 Uplands 5.01 5.2 176 0.293 19 44 3 35 9 703 1.931 0.941 16 0.422 3.142 0.044 -2 15<br />
2 200709 1929553 10-20 Terrace 11.799 7.2 375 0.602 61 145 12 67 15 1024 4.409 1.972 35 1.058 7.652 0.064 9 26<br />
2 200709 1929554 20-30 Terrace 13.435 8.2 340 0.645 65 5269 12 72 20 853 5.089 2.062 37 1.278 8.562 0.076 3 27<br />
3 200709 1929555 0-10 Terrace 12.679 7 483 0.691 63 6148 11 62 19 1098 4.743 1.971 32 1.236 8.094 0.071 4 28<br />
3 200709 1929556 10-20 Uplands 4.8 2 182 0.429 23 78 5 43 -1 744 1.79 0.878 9 0.413 3.84 0.038 -2 8<br />
3 200709 1929557 20-30 Uplands 4.873 4.3 141 3.52 12 54 2 32 7 911 1.805 0.844 14 0.605 4.578 0.034 4 14<br />
4 200709 1929558 0-10 Uplands 3.698 7.2 149 1.171 31 138 3 29 2 678 1.247 0.707 11 0.373 5.644 0.014 -2 12<br />
4 200709 1929559 10-20 Uplands 2.955 3.7 130 0.875 18 209 -1 24 4 748 0.994 0.573 11 0.297 2.246 0.009 -2 10<br />
4 200709 1929560 20-30 Uplands 3.25 6.5 140 5.08 10 469 4 23 8 1073 1.083 0.638 11 1.112 13.468 0.015 2 11<br />
5 200709 1929561 0-10 Uplands 5.817 5.2 206 8.917 45 90 6 44 19 1107 2.187 1.143 28 1.093 11.727 0.073 -2 21<br />
5 200709 1929562 10-20 Uplands 5.716 5.2 179 10.154 27 1517 5 43 17 1118 2.128 1.107 19 1.222 12.408 0.061 -2 19<br />
5 200709 1929563 20-30 Uplands 5.285 5.9 167 13.133 38 1497 2 33 21 1308 1.968 0.959 21 1.694 13.449 0.039 8 17<br />
6 200709 1929564 0-10 Uplands 6.398 5.9 187 3.538 54 54 4 37 13 893 2.321 1.17 30 0.812 8.054 0.052 3 23<br />
6 200709 1929565 10-20 Uplands 6.41 5.6 196 3.376 25 87 5 40 15 857 2.325 1.179 17 0.766 6.049 0.055 5 24<br />
6 200709 1929566 20-30 Uplands 6.222 8.9 170 0.876 29 106 3 43 12 615 2.341 1.031 17 0.538 4.063 0.069 4 18<br />
7 200709 1929567 0-10 Terrace 10.294 6.6 311 3.25 53 225 10 53 19 811 3.738 1.862 33 1.342 8.875 0.064 -2 34<br />
7 200709 1929568 10-20 Terrace 11.394 11.3 383 0.578 61 3670 12 71 18 814 4.173 1.688 32 1.08 7.661 0.084 -2 31<br />
7 200709 1929569 20-30 Terrace 11.526 5.5 364 1.206 56 2677 13 60 19 1082 4.234 1.785 36 1.142 7.468 0.068 -2 30<br />
8 200709 1929570 0-10 Terrace 11.969 9.3 538 0.349 81 5646 13 67 17 1115 3.91 2.037 45 0.999 7.214 0.062 -2 37<br />
8 200709 1929571 10-20 Terrace 13.315 6.9 552 0.293 66 7484 11 66 19 1098 4.389 2.171 37 1.127 7.609 0.043 -2 31<br />
8 200709 1929572 20-30 Terrace 13.811 7 546 0.249 61 8196 12 68 17 928 4.604 2.219 31 1.181 8.003 0.081 -2 32<br />
12 200709 1929573 0-10 Terrace 10.135 5.7 419 4.237 34 89 8 60 21 1180 3.774 1.666 9 2.052 9.681 0.052 -2 23<br />
12 200709 1929574 10-20 Terrace 9.297 7.4 543 7.392 57 111 10 55 18 1200 3.485 1.571 28 1.816 12.032 0.044 -2 20<br />
12 200709 1929575 20-30 Terrace 9.412 8.8 301 6.129 46 428 9 54 26 1359 3.545 1.595 24 1.62 10.082 0.053 6 22<br />
13 200709 1929576 0-10 Fm1 11.091 4.9 379 0.478 58 327 9 74 19 965 3.655 1.858 27 0.783 11.856 0.043 8 28<br />
13 200709 1929577 10-20 Fm1 11.419 7 401 0.387 79 301 12 73 13 1025 3.75 1.847 39 0.805 7.313 0.042 -2 31<br />
13 200709 1929578 20-30 Fm1 8.805 6.3 341 0.302 38 124 5 46 12 668 2.747 1.521 30 0.632 5.484 0.026 3 29<br />
14 200709 1929579 0-10 Fm3 7.817 5.7 356 0.382 75 58 3 60 7 876 1.714 2.122 34 0.393 1.856 0.027 4 38<br />
14 200709 1929580 10-20 Fm3 9.703 4.6 377 0.485 67 106 8 62 11 844 2.773 2.232 39 0.629 5.071 0.07 -2 35<br />
14 200709 1929581 20-30 Fm3 10.04 3.8 367 0.538 66 49 9 54 10 1122 3 2.228 38 0.708 4.773 0.056 5 30<br />
15 200709 1929582 0-10 Fm1 8.099 8.1 379 0.358 58 275 6 56 5 936 2.077 2.055 25 0.418 3.487 0.03 4 27<br />
15 200709 1929583 10-20 Fm1 7.515 9 367 0.332 55 114 6 39 2 975 1.721 2.122 29 0.368 1.591 0.017 -2 26<br />
15 200709 1929584 20-30 Fm1 5.992 7.8 310 0.265 25 79 4 24 -1 754 1.096 1.905 21 0.234 1.988 0.008 -2 25<br />
16 200709 1929585 0-10 Fm1 8.633 7.9 368 0.385 65 320 8 52 11 891 2.375 2.008 31 0.492 5.226 0.043 2 31<br />
16 200709 1929586 10-20 Fm1 5.753 4.1 356 0.267 32 99 4 38 -1 887 0.952 2.013 15 0.204 0.688 0.007 -2 25<br />
16 200709 1929587 20-30 Fm1 7.771 8.1 377 0.348 75 142 2 55 5 951 1.789 2.011 41 0.392 1.482 0.013 19 38<br />
17 200709 1929588 0-10 Fm1 12.666 9 412 0.428 75 449 11 83 12 892 3.958 2.193 39 0.828 10.851 0.051 -2 41<br />
17 200709 1929589 10-20 Fm1 12.776 6.3 434 0.398 77 383 8 70 16 1104 3.734 2.23 37 0.803 8.277 0.034 5 37<br />
17 200709 1929590 20-30 Fm1 12.396 5.5 435 0.382 77 374 9 71 13 1131 3.536 2.21 43 0.784 6.641 0.026 4 39<br />
18 200709 1929591 0-10 Fm1 13.242 8.9 399 0.56 86 1371 11 76 19 1127 4.12 2.225 44 0.921 13.493 0.042 9 35<br />
18 200709 1929592 10-20 Fm1 13.175 7.3 452 0.505 71 939 10 80 11 1029 3.979 2.236 40 0.909 9.504 0.051 10 38<br />
18 200709 1929593 20-30 Fm1 13.034 7.5 468 0.483 90 1086 11 71 16 1280 4.112 2.215 44 0.91 8.006 0.045 6 37<br />
19 200709 1929594 0-10 Fm2 13.706 6.1 477 0.449 76 1392 9 77 18 1162 4.197 2.236 38 0.932 11.41 0.02 10 37<br />
19 200709 1929595 10-20 Fm2 13.258 5.7 534 0.403 80 1039 10 82 21 1047 4.071 2.213 39 0.832 8.594 0.022 4 36<br />
19 200709 1929596 20-30 Fm2 13.716 5.6 407 0.405 80 811 9 71 16 931 4.346 2.202 44 0.868 9.718 0.023 8 35<br />
20 200709 1929597 0-10 Fm2 14.91 9.2 392 0.481 80 1199 15 88 22 1166 5.275 2.194 34 1.025 9.796 0.076 7 38<br />
59
20 200709 1929598 10-20 Fm2 14.562 6.7 366 0.49 86 870 16 82 22 887 4.943 2.163 46 0.982 9.775 0.131 13 38<br />
20 200709 1929599 20-30 Fm2 14.481 7.7 419 0.493 98 833 15 74 17 900 4.842 2.156 53 0.953 9.105 0.104 8 40<br />
21 200709 1929600 0-10 Fm3 9.027 4.7 415 0.596 69 102 7 51 6 888 2.334 2.347 41 0.611 5.882 0.042 4 39<br />
21 200709 1929601 10-20 Fm3 8.519 4.1 428 0.504 63 124 6 57 8 979 1.782 2.399 32 0.493 2.491 0.018 -2 39<br />
21 200709 1929602 20-30 Fm3 8.815 6 444 0.466 81 100 4 57 5 937 1.888 2.448 45 0.533 2.936 0.017 6 37<br />
22 200709 1929603 0-10 Fm3 11.329 4.9 439 0.457 78 156 7 59 15 1019 3.416 2.252 50 0.811 7.445 0.038 10 39<br />
22 200709 1929604 10-20 Fm3 12.078 8.2 369 0.508 74 405 9 78 20 847 3.954 2.197 40 0.959 7.954 0.047 -2 35<br />
22 200709 1929605 20-30 Fm3 13.663 8.9 650 0.623 74 1407 11 76 22 1013 4.647 2.291 45 1.264 8.456 0.059 6 32<br />
23 200709 1929606 0-10 Fm3 13.256 7.4 489 0.518 75 370 11 78 15 1050 4.254 2.08 36 1.025 9.608 0.056 11 35<br />
23 200709 1929607 10-20 Fm3 13.76 6.7 568 0.491 67 848 12 76 15 1060 4.391 2.018 28 0.991 8.553 0.026 3 36<br />
23 200709 1929608 20-30 Fm3 13.56 7.9 515 0.485 71 1001 8 75 13 988 4.283 2.004 41 0.949 8.31 0.016 -2 37<br />
Site Batch No Sample ID Depth (cm) Morphology Mo Na2O Nb Nd Ni P2O5 Pb Rb S Sc SiO2 Sr Th TiO2 U V Zn Zr<br />
1 200709 1929543 0-10 Terrace -1 0.222 10 31 40 0.092 22 109.1 257 15 57.096 111.9 13 0.823 -1 111 95 185<br />
1 200709 1929544 10-20 Terrace 3 0.172 13 22 18 0.053 24 67.8 149 13 78.076 70.2 13 0.545 7.9 61 52 252<br />
1 200709 1929545 20-30 Terrace 5 0.137 8 12 8 0.039 13 45.8 118 11 89.034 44.2 1 0.405 -1 35 33 267<br />
2 200709 1929552 0-10 Uplands 3 -0.01 6 -5 13 0.044 12 40.9 151 3 87.679 52.6 7 0.338 -1 31 28 231<br />
2 200709 1929553 10-20 Terrace -1 0.3 15 29 29 0.05 23 95.2 174 13 71.134 85.3 28 0.696 7.6 78 64 299<br />
2 200709 1929554 20-30 Terrace -1 0.779 15 22 22 0.043 26 102.7 182 16 66.509 93.8 21 0.764 10.7 87 68 264<br />
3 200709 1929555 0-10 Terrace -1 0.877 14 33 20 0.044 29 99.9 271 9 67.97 92 33 0.734 2.1 88 64 256<br />
3 200709 1929556 10-20 Uplands -1 -0.01 9 7 14 0.045 24 40.5 164 3 87.326 54.6 32 0.312 9.7 32 27 202<br />
3 200709 1929557 20-30 Uplands 1 -0.01 7 5 19 0.061 18 40 171 -1 83.167 143 5 0.325 3.2 32 26 215<br />
4 200709 1929558 0-10 Uplands -1 -0.01 4 18 5 0.06 7 33.3 252 11 86.734 77.6 20 0.226 2.5 26 31 104<br />
4 200709 1929559 10-20 Uplands -1 -0.01 5 13 6 0.036 14 26.7 170 8 91.745 61.6 8 0.189 -1 23 24 99<br />
4 200709 1929560 20-30 Uplands -1 -0.01 1 -5 9 0.053 11 32.5 514 -1 74.852 355.8 14 0.191 7.3 26 30 122<br />
5 200709 1929561 0-10 Uplands -1 0.04 6 12 21 0.112 14 46.6 322 8 68.243 296 -1 0.398 1 41 42 196<br />
5 200709 1929562 10-20 Uplands -1 0.25 7 11 18 0.1 15 47.2 317 10 66.066 351.3 8 0.395 3.6 42 40 190<br />
5 200709 1929563 20-30 Uplands -1 0.281 5 16 16 0.076 14 43.9 369 6 62.315 481.1 1 0.372 -1 40 32 195<br />
6 200709 1929564 0-10 Uplands -1 -0.01 8 18 19 0.069 21 46.5 251 9 77.005 127.8 15 0.382 7.2 44 42 168<br />
6 200709 1929565 10-20 Uplands 1 0.034 6 9 19 0.058 17 49.4 186 6 79.169 117.5 7 0.388 3.2 45 39 186<br />
6 200709 1929566 20-30 Uplands 2 0.035 5 10 18 0.046 8 48 128 5 84.255 63.2 6 0.376 -1 41 42 170<br />
7 200709 1929567 0-10 Terrace 1 0.292 15 26 19 0.064 23 92.2 245 11 69.344 188.5 12 0.619 -1 69 57 312<br />
7 200709 1929568 10-20 Terrace 1 0.612 13 22 25 0.036 17 100.4 193 8 71.468 97.1 15 0.631 4.3 77 61 271<br />
7 200709 1929569 20-30 Terrace -1 0.462 12 22 26 0.041 30 100.6 181 13 70.889 124.7 14 0.654 6.9 80 57 293<br />
8 200709 1929570 0-10 Terrace 2 1.011 14 33 21 0.045 21 118.3 616 16 70.801 93.6 16 0.709 2 81 62 329<br />
8 200709 1929571 10-20 Terrace -1 1.211 15 25 24 0.038 24 132.4 621 14 67.993 97.3 14 0.738 5.2 89 65 266<br />
8 200709 1929572 20-30 Terrace 3 1.323 14 34 22 0.038 27 135.3 554 16 66.624 93.5 22 0.752 -1 88 72 253<br />
12 200709 1929573 0-10 Terrace -1 0.157 11 14 22 0.08 20 76.1 258 -1 67.364 137.8 -1 0.532 2.1 55 58 257<br />
12 200709 1929574 10-20 Terrace -1 0.273 11 29 22 0.074 23 72.9 364 10 63.208 189.5 16 0.498 2.8 77 57 235<br />
12 200709 1929575 20-30 Terrace -1 0.413 9 17 25 0.069 21 74.7 366 8 66.251 157.8 -1 0.503 -1 79 55 223<br />
13 200709 1929576 0-10 Fm1 -1 0.361 14 25 13 0.122 34 105 444 14 68.757 73.9 26 0.695 9 72 68 268<br />
13 200709 1929577 10-20 Fm1 2 0.344 14 31 18 0.096 25 102 264 12 72.949 71.2 12 0.752 1.2 79 60 323<br />
13 200709 1929578 20-30 Fm1 -1 0.292 12 13 17 0.05 18 81.5 159 10 79.322 59.1 15 0.615 3.5 57 50 301<br />
14 200709 1929579 0-10 Fm3 4 0.596 12 28 8 0.054 20 102.1 89 6 84.26 65.2 8 0.54 3.1 36 43 475<br />
14 200709 1929580 10-20 Fm3 4 0.488 15 23 19 0.054 23 119.5 114 10 77.673 71 17 0.58 9.4 47 53 413<br />
14 200709 1929581 20-30 Fm3 -1 0.478 17 26 18 0.046 27 120.4 108 -1 77.304 74.7 20 0.57 6.1 42 50 366<br />
15 200709 1929582 0-10 Fm1 4 0.539 14 25 9 0.067 23 102.2 202 9 82.126 62.4 17 0.474 6.9 43 43 419<br />
15 200709 1929583 10-20 Fm1 5 0.604 12 20 10 0.053 16 99.7 136 3 85.027 60.5 5 0.413 3.8 34 34 372<br />
15 200709 1929584 20-30 Fm1 1 0.496 8 10 3 0.037 19 85.1 87 4 87.495 51.5 8 0.302 6.3 27 29 283<br />
16 200709 1929585 0-10 Fm1 2 0.505 14 24 7 0.081 19 100.1 257 11 79.438 64.6 11 0.539 6.6 45 48 397<br />
16 200709 1929586 10-20 Fm1 4 0.485 9 10 3 0.035 24 87.5 84 7 89.117 54 -1 0.28 -1 21 24 269<br />
60
16 200709 1929587 20-30 Fm1 7 0.611 13 26 9 0.052 19 97.8 130 6 84.775 61.5 4 0.491 3.9 41 37 535<br />
17 200709 1929588 0-10 Fm1 2 0.433 16 29 20 0.1 24 132.4 433 17 67.387 71 23 0.778 7.4 79 74 380<br />
17 200709 1929589 10-20 Fm1 2 0.492 17 40 24 0.071 28 136 333 12 70.05 72 22 0.799 6.3 81 77 394<br />
17 200709 1929590 20-30 Fm1 -1 0.531 20 20 22 0.062 28 128.8 250 11 72.307 72.2 24 0.795 4.9 77 67 419<br />
18 200709 1929591 0-10 Fm1 -1 0.443 20 28 23 0.105 27 136.8 963 15 63.573 80.7 21 0.781 6.2 89 82 323<br />
18 200709 1929592 10-20 Fm1 1 0.526 20 20 25 0.083 29 136.4 586 14 67.816 80.2 20 0.806 10.2 82 76 372<br />
18 200709 1929593 20-30 Fm1 2 0.568 17 36 26 0.079 29 130.9 349 10 69.309 77.9 15 0.81 6.1 86 72 383<br />
19 200709 1929594 0-10 Fm2 2 0.536 17 30 15 0.071 26 137 363 19 65.129 78.8 16 0.869 4.6 91 77 316<br />
19 200709 1929595 10-20 Fm2 -1 0.625 20 29 15 0.056 24 137.6 254 18 68.66 78.5 24 0.872 2.5 84 74 336<br />
19 200709 1929596 20-30 Fm2 -1 0.616 19 35 14 0.059 28 142.4 222 17 66.846 78.4 24 0.857 5.6 85 72 315<br />
20 200709 1929597 0-10 Fm2 -1 0.473 18 32 35 0.092 24 143.9 203 16 64.372 79.6 12 0.899 8.8 100 85 303<br />
20 200709 1929598 10-20 Fm2 -1 0.507 20 34 21 0.06 29 145 158 18 65.165 81.4 17 0.883 8.2 100 80 316<br />
20 200709 1929599 20-30 Fm2 -1 0.542 18 43 22 0.054 25 143.3 175 20 66.031 81.2 16 0.892 5.2 99 83 326<br />
21 200709 1929600 0-10 Fm3 2 0.656 17 25 9 0.092 28 106.3 176 8 77.542 78.3 22 0.609 6.4 44 50 488<br />
21 200709 1929601 10-20 Fm3 5 0.655 16 23 10 0.055 24 111 122 11 82.221 74.1 9 0.595 3.9 37 40 512<br />
21 200709 1929602 20-30 Fm3 6 0.624 16 29 8 0.054 20 118.1 100 13 81.343 70.7 19 0.614 5.8 45 42 455<br />
22 200709 1929603 0-10 Fm3 -1 0.547 20 28 14 0.076 33 117 178 8 72.54 87.5 27 0.811 10.1 69 65 319<br />
22 200709 1929604 10-20 Fm3 -1 0.559 17 23 20 0.047 20 115.9 158 11 70.642 88.9 12 0.781 3.9 76 68 296<br />
22 200709 1929605 20-30 Fm3 -1 0.726 18 25 23 0.047 22 127.1 254 13 66.946 115.2 9 0.847 5.4 88 78 275<br />
23 200709 1929606 0-10 Fm3 2 0.519 16 34 23 0.046 23 134.1 198 18 67.535 84.6 20 0.787 8.7 87 67 309<br />
23 200709 1929607 10-20 Fm3 2 0.607 16 32 22 0.04 24 132.1 210 13 67.939 82.9 15 0.813 5.4 90 70 299<br />
23 200709 1929608 20-30 Fm3 2 0.612 17 24 21 0.038 20 132.2 189 17 68.561 87.2 22 0.813 1.3 88 68 305<br />
61
Appendix 7.4: XRD Mineralogy Area A. Note: Halloysite is most likely to be smectite due to method of analysis<br />
Site<br />
Number<br />
Depth <strong>LEME</strong> ID Sample #<br />
Minerals<br />
Present<br />
Corrected<br />
Weight %<br />
Site<br />
Number<br />
Depth <strong>LEME</strong> ID Sample #<br />
Minerals<br />
Present<br />
Corrected<br />
Weight %<br />
Site<br />
Number<br />
Depth <strong>LEME</strong> ID Sample #<br />
1 0-10 2007735000001 1929543 Halloysite 54.8 3 20-30 2007735002003 1929557 Quartz 77 6 0-10 2007735005001 1929564 Quartz 72<br />
Quartz 27.8 Halloysite 10.8 Halloysite 15.1<br />
Muscovite 14 Calcite 10 Calcite 7<br />
Microcline 3.4 Microcline 1.7 Albite 3.4<br />
100 Muscovite 0.5 Muscovite 1.5<br />
100 Orthoclase 1.1<br />
1 10-20 2007735000002 1929544 Quartz 67.3 100.1<br />
Halloysite 21.4 4 0-10 2007735003001 1929558 Quartz 83.3<br />
Muscovite 7.3 Halloysite 12.9 6 10-20 2007735005002 1929565 Quartz 74.4<br />
Microcline 4 Calcite 2.5 Halloysite 14.7<br />
100 Microcline 1.1 Calcite 6.6<br />
Muscovite 0.2 Microcline 3.7<br />
1 20-30 2007735000003 1929545 Quartz 90.2 100 Muscovite 0.6<br />
Albite 4.5 100<br />
Halloysite 4.4 4 10-20 2007735003002 1929559 Quartz 90.4<br />
Microcline 1 Halloysite 5.3 6 20-30 2007735005003 1929566 Quartz 78.7<br />
100.1 Microcline 3 Halloysite 16.8<br />
Calcite 0.9 Albite 2.1<br />
2 0-10 2007735002001 1929552 Quartz 86.7 Muscovite 0.5 Calcite 1<br />
Halloysite 10 100.1 Microcline 0.8<br />
Albite 2.3 Muscovite 0.6<br />
Microcline 1 4 20-30 2007735003003 1929560 Quartz 81.7 100<br />
100 Halloysite 8.9<br />
Calcite 5.5 7 0-10 2007735006001 1929567 Quartz 56.2<br />
2 10-20 2007735001001 1929553 Quartz 54.2 Dolomite 2.6 Halloysite 25.3<br />
Halloysite 29.3 Muscovite 1.3 Muscovite 10.2<br />
Muscovite 11 100 Calcite 5.6<br />
Albite 5.6 Orthoclase 2.8<br />
100.1 5 0-10 2007735004001 1929561 Quartz 57.7 100.1<br />
Calcite 23.3<br />
2 20-30 2007735001002 1929554 Quartz 48 Halloysite 15.5 7 10-20 2007735006002 1929568 Quartz 52.6<br />
Halloysite 30.4 Microcline 3.2 Halloysite 24.9<br />
Muscovite 11.7 Muscovite 0.4 Microcline 9.8<br />
Microcline 5.6 100.1 Muscovite 8.4<br />
Albite 4.3 Albite 4.2<br />
100 5 10-20 2007735004002 1929562 Quartz 56.6 99.9<br />
Calcite 25.7<br />
3 0-10 2007735001003 1929555 Quartz 47.2 Halloysite 14.4 7 20-30 2007735006003 1929569 Quartz 61<br />
Halloysite 31.3 Microcline 3 Halloysite 25.2<br />
Muscovite 10.4 Muscovite 0.3 Muscovite 8.1<br />
Microcline 7.7 100 Albite 3.5<br />
Albite 3.3 Calcite 1.5<br />
99.9 5 20-30 2007735004003 1929563 Quartz 52.4 Microcline 0.7<br />
Calcite 32.1 100<br />
3 10-20 2007735002002 1929556 Quartz 84.1 Halloysite 13.8<br />
Halloysite 9.2 Albite 1.6 8 0-10 2007735007001 1929570 Quartz 54.5<br />
Microcline 5 Microcline 0.1 Halloysite 23.6<br />
Muscovite 1.7 100 Muscovite 9.4<br />
100 Microcline 7.3<br />
Albite 5.2<br />
100<br />
Minerals<br />
Present<br />
Corrected<br />
Weight %<br />
62
Site<br />
Number<br />
Depth <strong>LEME</strong> ID Sample #<br />
Minerals<br />
Present<br />
Corrected<br />
Weight %<br />
Site<br />
Number<br />
Depth <strong>LEME</strong> ID Sample #<br />
Minerals<br />
Present<br />
Corrected<br />
Weight %<br />
Site<br />
Number<br />
Depth <strong>LEME</strong> ID Sample #<br />
8 10-20 2007735007002 1929571 Quartz 48.5 13 10-20 2007735009002 1929577 Quartz 60 15 20-30 2007735011003 1929584 Quartz 70.5<br />
Halloysite 28.7 Halloysite 23.7 Microcline 15.3<br />
Muscovite 11.9 Muscovite 6.6 Albite 5.8<br />
Albite 6.2 Orthoclase 5.1 Halloysite 5.3<br />
Orthoclase 4.7 Albite 4.6 Muscovite 3.2<br />
100 100 100.1<br />
Minerals<br />
Present<br />
Corrected<br />
Weight %<br />
8 20-30 2007735007003 1929572 Quartz 48.2 13 20-30 2007735009003 1929578 Quartz 73.6 16 0-10 2007735015001 1929594 Quartz 50.9<br />
Halloysite 29.6 Halloysite 20.6 Halloysite 25.8<br />
Muscovite 12.1 Albite 4.3 Muscovite 12.4<br />
Microcline 4.9 Microcline 1.6 Albite 5.7<br />
Albite 4.4 100.1 Microcline 5.3<br />
Sodium<br />
Chloride 0.8 100.1<br />
100 14 0-10 2007735010001 1929579 Quartz 65.7<br />
Halloysite 11.4 16 10-20 2007735012002 1929586 Quartz 72.7<br />
12 0-10 2007735008001 1929573 Quartz 50.2 Microcline 10.6 Microcline 11.2<br />
Halloysite 26.7 Muscovite 6.6 Halloysite 7.4<br />
Calcite 8.9 Albite 5.8 Albite 5.9<br />
Muscovite 8.4 100.1 Muscovite 2.7<br />
Microcline 5.8 99.9<br />
100 14 10-20 2007735010002 1929580 Quartz 63.2<br />
Halloysite 14.1 1929587 Quartz 70.8<br />
12 10-20 2007735008002 1929574 Quartz 49.4 Muscovite 8.4 16 20-30 2007735012003 Microcline 9.2<br />
Halloysite 22.7 Microcline 8.1 Muscovite 7.3<br />
Calcite 19.9 Albite 6.3 Halloysite 7.1<br />
Muscovite 4.4 100.1 Albite 5.6<br />
Albite 2.2 100<br />
Orthoclase 1.5 14 20-30 2007735010003 1929581 Quartz 58.4<br />
100.1 Halloysite 15 17 0-10 2007735013001 1929588 Quartz 52.2<br />
Microcline 14.6 Halloysite 22.9<br />
12 20-30 2007735008003 1929575 Quartz 53 Muscovite 6.3 Muscovite 11.3<br />
Halloysite 23.3 Albite 5.7 Microcline 8.5<br />
Calcite 14.9 100 Albite 5.1<br />
Muscovite 3.8 100<br />
Albite 3.4 15 0-10 2007735012001 1929585 Quartz 67.3<br />
Orthoclase 1.6 Halloysite 10.7 17 10-20 2007735013002 1929589 Quartz 55.3<br />
100 Microcline 9.9 Halloysite 22.3<br />
Muscovite 7.5 Muscovite 10.5<br />
13 0-10 2007735009001 1929576 Quartz 55.8 Albite 4.7 Microcline 6.4<br />
Halloysite 26.1 100.1 Albite 5.5<br />
Muscovite 9.1 100<br />
Albite 5.2 15 10-20 2007735011002 1929583 Quartz 70.7<br />
Orthoclase 3.7 Microcline 9.3<br />
99.9 Albite 8.6<br />
Muscovite 6.6<br />
Halloysite 4.8<br />
100<br />
63
Site<br />
Number<br />
Depth <strong>LEME</strong> ID Sample #<br />
Minerals<br />
Present<br />
Corrected<br />
Weight %<br />
Site<br />
Number<br />
Depth <strong>LEME</strong> ID Sample #<br />
Minerals<br />
Present<br />
Corrected<br />
Weight %<br />
Site<br />
Number<br />
Depth <strong>LEME</strong> ID Sample #<br />
17 20-30 2007735013003 1929590 Quartz 59.7 19 0-10 2007735016001 1929597 Quartz 45.4 22 0-10 2007735018001 1929603 Quartz 61.8<br />
Halloysite 18.5 Halloysite 32.3 Halloysite 13.3<br />
Muscovite 11 Muscovite 13.6 Muscovite 10.6<br />
Microcline 6.4 Albite 5 Microcline 7.6<br />
Albite 4.3 Microcline 3.7 Albite 6.6<br />
99.9 100 99.9<br />
Minerals<br />
Present<br />
Corrected<br />
Weight %<br />
18 0-10 2007735014001 1929591 Quartz 52.3 20 10-20 2007735016002 1929598 Quartz 50 22 10-20 2007735018002 1929604 Quartz 57.5<br />
Halloysite 24.4 Halloysite 27.2 Halloysite 17.3<br />
Muscovite 12.4 Muscovite 13.3 Muscovite 11.4<br />
Microcline 6.5 Albite 5.6 Microcline 9<br />
Albite 4.3 Microcline 4 Albite 4.8<br />
99.9 100.1 100<br />
18 10-20 2007735014002 1929592 Quartz 56.4 20 20-30 2007735016003 1929599 Quartz 47.9 22 20-30 2007735018003 1929605 Quartz 54.1<br />
Muscovite 10.9 Albite 6.9 Muscovite 13.8<br />
Albite 5.4 Microcline 2.8 Albite 5.1<br />
Microcline 4.9 Muscovite 12.9 Microcline 4.2<br />
100 100 100<br />
18 20-30 2007735014003 1929593 Quartz 59.5 21 0-10 2007735017001 1929600 Quartz 63.9 23 0-10 2007735019001 1929606 Quartz 48.3<br />
Halloysite 24.1 Microcline 10.7 Halloysite 28.6<br />
Muscovite 10.5 Halloysite 10.2 Muscovite 12.8<br />
Albite 4.6 Albite 8.6 Microcline 5.2<br />
Microcline 1.4 Muscovite 6.6 Albite 5.1<br />
100.1 100 100<br />
19 10-20 2007735015002 1929595 Quartz 51.5 21 10-20 2007735017002 1929601 Quartz 70.4 23 10-20 2007735019002 1929607 Quartz 47.3<br />
Halloysite 23.1 Albite 8.6 Halloysite 31.1<br />
Muscovite 12.1 Muscovite 7.3 Muscovite 10.5<br />
Albite 8 Halloysite 7 Albite 5.6<br />
Microcline 5.3 Microcline 6.7 Microcline 5.5<br />
100 100 100<br />
19 20-30 2007735015003 1929596 Quartz 48.4 21 20-30 2007735017003 1929602 Quartz 67.4 23 20-30 2007735019003 1929608 Quartz 46.5<br />
Halloysite 25.2 Microcline 11.1 Halloysite 31.1<br />
Muscovite 12.8 Halloysite 8.3 Muscovite 10.8<br />
Albite 8.6 Albite 6.8 Microcline 6.7<br />
Microcline 5 Muscovite 6.4 Albite 5<br />
100 100 100.1<br />
64