

UOB Annual Report 2002 - United Overseas Bank
UOB Annual Report 2002 - United Overseas Bank
UOB Annual Report 2002 - United Overseas Bank

Create successful ePaper yourself
Turn your PDF publications into a flip-book with our unique Google optimized e-Paper software.
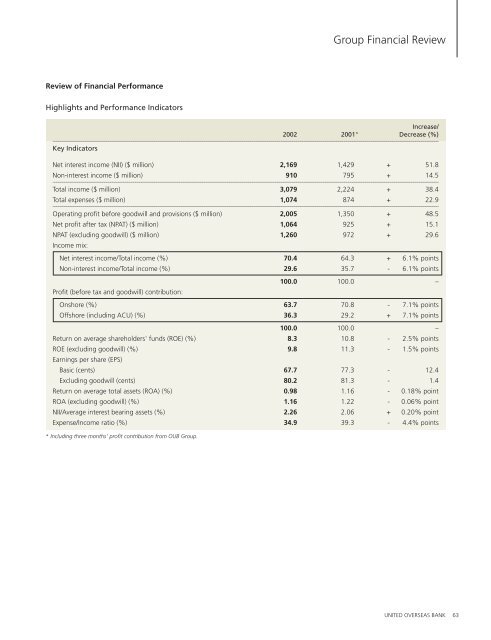
Group Financial Review<br />
Review of Financial Performance<br />
Highlights and Performance Indicators<br />
Increase/<br />
<strong>2002</strong> 2001* Decrease (%)<br />
–––––––––––––––––––––––––––––––––––––––––––––––––––––––––––––––––––––––––––––––––––––––––––––––––––––––––––––––––––––––––––––––––––––––––––––––––––––––––––––––––––––––––––––––––––––––––––––––––––––––––<br />
Key Indicators<br />
Net interest income (NII) ($ million) 2,169 1,429 + 51.8<br />
Non-interest income ($ million) 910 795 + 14.5<br />
–––––––––––––––––––––––––––––––––––––––––––––––––––––––––––––––––––––––––––––––––––––––––––––––––––––––––––––––––––––––––––––––––––––––––––––––––––––––––––––––––––––––––––––––––––––––––––––––––––––––––<br />
Total income ($ million) 3,079 2,224 + 38.4<br />
Total expenses ($ million) 1,074 874 + 22.9<br />
–––––––––––––––––––––––––––––––––––––––––––––––––––––––––––––––––––––––––––––––––––––––––––––––––––––––––––––––––––––––––––––––––––––––––––––––––––––––––––––––––––––––––––––––––––––––––––––––––––––––––<br />
Operating profit before goodwill and provisions ($ million) 2,005 1,350 + 48.5<br />
Net profit after tax (NPAT) ($ million) 1,064 925 + 15.1<br />
NPAT (excluding goodwill) ($ million) 1,260 972 + 29.6<br />
Income mix:<br />
Net interest income/Total income (%) 70.4 64.3 + 6.1% points<br />
Non-interest income/Total income (%) 29.6 35.7 - 6.1% points<br />
100.0 100.0 –<br />
Profit (before tax and goodwill) contribution:<br />
Onshore (%) 63.7 70.8 - 7.1% points<br />
Offshore (including ACU) (%) 36.3 29.2 + 7.1% points<br />
100.0 100.0 –<br />
Return on average shareholders' funds (ROE) (%) 8.3 10.8 - 2.5% points<br />
ROE (excluding goodwill) (%) 9.8 11.3 - 1.5% points<br />
Earnings per share (EPS)<br />
Basic (cents) 67.7 77.3 - 12.4<br />
Excluding goodwill (cents) 80.2 81.3 - 1.4<br />
Return on average total assets (ROA) (%) 0.98 1.16 - 0.18% point<br />
ROA (excluding goodwill) (%) 1.16 1.22 - 0.06% point<br />
NII/Average interest bearing assets (%) 2.26 2.06 + 0.20% point<br />
Expense/Income ratio (%) 34.9 39.3 - 4.4% points<br />
* Including three months’ profit contribution from OUB Group.<br />
UNITED OVERSEAS BANK 63


