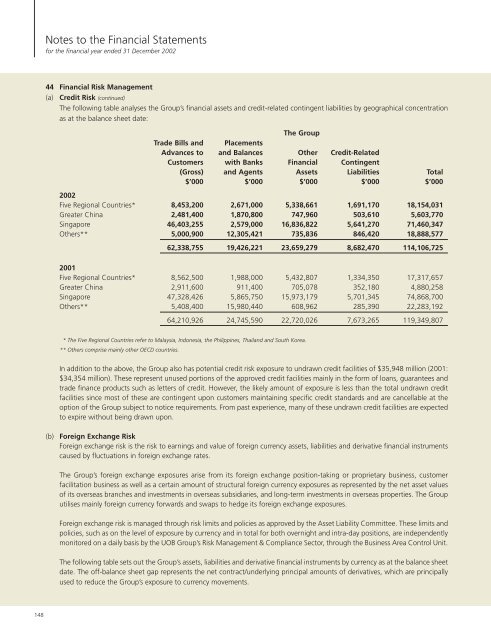
Notes to the Financial Statements for the financial year ended 31 December <strong>2002</strong> 44 Financial Risk Management (a) Credit Risk (continued) The following table analyses the Group’s financial assets and credit-related contingent liabilities by geographical concentration as at the balance sheet date: The Group Trade Bills and Placements Advances to and Balances Other Credit-Related Customers with <strong>Bank</strong>s Financial Contingent (Gross) and Agents Assets Liabilities Total $’000 $’000 $’000 $’000 $’000 <strong>2002</strong> Five Regional Countries* 8,453,200 2,671,000 5,338,661 1,691,170 18,154,031 Greater China 2,481,400 1,870,800 747,960 503,610 5,603,770 Singapore 46,403,255 2,579,000 16,836,822 5,641,270 71,460,347 Others** 5,000,900 12,305,421 735,836 846,420 18,888,577 62,338,755 19,426,221 23,659,279 8,682,470 114,106,725 2001 Five Regional Countries* 8,562,500 1,988,000 5,432,807 1,334,350 17,317,657 Greater China 2,911,600 911,400 705,078 352,180 4,880,258 Singapore 47,328,426 5,865,750 15,973,179 5,701,345 74,868,700 Others** 5,408,400 15,980,440 608,962 285,390 22,283,192 64,210,926 24,745,590 22,720,026 7,673,265 119,349,807 * The Five Regional Countries refer to Malaysia, Indonesia, the Philippines, Thailand and South Korea. ** Others comprise mainly other OECD countries. In addition to the above, the Group also has potential credit risk exposure to undrawn credit facilities of $35,948 million (2001: $34,354 million). These represent unused portions of the approved credit facilities mainly in the form of loans, guarantees and trade finance products such as letters of credit. However, the likely amount of exposure is less than the total undrawn credit facilities since most of these are contingent upon customers maintaining specific credit standards and are cancellable at the option of the Group subject to notice requirements. From past experience, many of these undrawn credit facilities are expected to expire without being drawn upon. (b) Foreign Exchange Risk Foreign exchange risk is the risk to earnings and value of foreign currency assets, liabilities and derivative financial instruments caused by fluctuations in foreign exchange rates. The Group’s foreign exchange exposures arise from its foreign exchange position-taking or proprietary business, customer facilitation business as well as a certain amount of structural foreign currency exposures as represented by the net asset values of its overseas branches and investments in overseas subsidiaries, and long-term investments in overseas properties. The Group utilises mainly foreign currency forwards and swaps to hedge its foreign exchange exposures. Foreign exchange risk is managed through risk limits and policies as approved by the Asset Liability Committee. These limits and policies, such as on the level of exposure by currency and in total for both overnight and intra-day positions, are independently monitored on a daily basis by the <strong>UOB</strong> Group’s Risk Management & Compliance Sector, through the Business Area Control Unit. The following table sets out the Group’s assets, liabilities and derivative financial instruments by currency as at the balance sheet date. The off-balance sheet gap represents the net contract/underlying principal amounts of derivatives, which are principally used to reduce the Group’s exposure to currency movements. 148
The Group – <strong>2002</strong> Hong Singapore US Malaysian Kong Australian Dollars Dollars Ringgit Dollars Dollars Thai Baht Others Total $’000 $’000 $’000 $’000 $’000 $’000 $’000 $’000 Assets Cash and balances with central banks 2,178,006 27,110 1,529,513 2,968 8,104 28,597 439,160 4,213,458 Government treasury bills and securities 8,260,989 50,883 73,757 48,840 39,052 747,157 373,259 9,593,937 Placements and balances with banks and agents 2,976,417 10,865,952 630,182 707,554 956,826 20,618 3,198,395 19,355,944 Trade bills and advances to customers 38,808,810 7,928,389 5,466,862 1,386,682 1,721,819 1,000,815 2,570,630 58,884,007 Investment securities 1,341,025 1,423,365 33,651 51,121 19,374 11,105 249,359 3,129,000 Investments in associates 1,197,741 2 73,987 – – – 2,515 1,274,245 Goodwill 3,556,184 – – – – 9,389 100,473 3,666,046 Others 4,050,897 1,123,617 570,363 68,907 113,197 124,682 401,283 6,452,946 62,370,069 21,419,318 8,378,315 2,266,072 2,858,372 1,942,363 7,335,074 106,569,583 Assets attributable to SPE 899,838 Total assets 107,469,421 Liabilities Current, fixed, savings accounts and other deposits of non-bank customers 41,028,457 13,930,267 5,431,283 760,697 1,920,685 1,551,163 3,296,029 67,918,581 Deposits and balances of banks and agents 3,411,755 11,226,120 741,514 995,957 616,653 281,564 2,028,495 19,302,058 Bills and drafts payable 94,856 11,089 45,860 665 189 7,328 3,878 163,865 Debts issued 1,294,399 – – – – – – 1,294,399 Other liabilities 3,327,582 436,923 1,019,908 82,854 25,480 37,793 160,867 5,091,407 49,157,049 25,604,399 7,238,565 1,840,173 2,563,007 1,877,848 5,489,269 93,770,310 Liabilities attributable to SPE 896,838 Total liabilities 94,667,148 On-balance sheet open position 13,213,020 (4,185,081) 1,139,750 425,899 295,365 64,515 1,845,805 Off-balance sheet open position (3,187,522) 4,777,273 365,624 (406,175) (212,663) (136,639) (1,199,898) Net open position 10,025,498 592,192 1,505,374 19,724 82,702 (72,124) 645,907 Net structural position – 43,564 769,579 (654) 111,302 6,870 338,018 UNITED OVERSEAS BANK 149
- Page 1 and 2:
ANNUAL REPORT 2002 United for Growt
- Page 3 and 4:
Our Mission To be a premier bank in
- Page 5 and 6:
Performance in Brief Profit For The
- Page 7 and 8:
Profit growth was derived mainly fr
- Page 9 and 10:
Financial Highlights Group Assets 2
- Page 11 and 12:
Group Return On Average Shareholder
- Page 13 and 14:
Corporate Information Honorary Life
- Page 15 and 16:
Left to right: Koh Beng Seng, Ngiam
- Page 17 and 18:
Left to right: Tan Kok Quan, Prof L
- Page 19 and 20:
Mr Francis Lee Chin Yong Managing D
- Page 21 and 22:
The Bank has a budget for directors
- Page 23 and 24:
independent and non-executive direc
- Page 25 and 26:
work of each of the banking subsidi
- Page 27 and 28:
Risk Management Credit and Country
- Page 29 and 30:
The composition of loans and advanc
- Page 31 and 32:
Group Non-Performing Loans (NPLs) a
- Page 33 and 34:
Group NPLs and Cumulative Provision
- Page 35 and 36:
Group Specific Provision by Region
- Page 37 and 38:
Collateral Types The majority of th
- Page 39 and 40:
Exposure to the Five Regional Count
- Page 41 and 42:
Cross-Border Exposure to the Five R
- Page 43 and 44:
Complementing the static analysis i
- Page 45 and 46:
Sources of Deposits The Group has a
- Page 47 and 48:
The VaR calculations are performed
- Page 49 and 50:
Group Daily VaR Distribution for 20
- Page 51 and 52:
As part of the Group's comprehensiv
- Page 53 and 54:
The celebratory light-up linking UO
- Page 55 and 56:
services so as to meet the increasi
- Page 57 and 58:
Our subsidiary, UOB Asset Managemen
- Page 59 and 60:
Grow our services In line with the
- Page 61 and 62:
exercise, achieved well ahead of th
- Page 63 and 64:
processes in place that will suppor
- Page 65 and 66:
Group Financial Review Review of Fi
- Page 67 and 68:
Group Profits The Group achieved a
- Page 69 and 70:
Analysis of Changes in Net Interest
- Page 71 and 72:
Cost Savings from Integration The G
- Page 73 and 74:
Overview of Balance Sheet Assets Mi
- Page 75 and 76:
Gross Customer Loans Analysed by Cu
- Page 77 and 78:
Capital Adequacy Ratios The Capital
- Page 79 and 80:
Directors’ Report for the financi
- Page 81 and 82:
In addition, the following subsidia
- Page 83 and 84:
Arrangements to Enable Directors to
- Page 85 and 86:
Ability to Meet Obligations No cont
- Page 87 and 88:
Share Options of the Bank (a) From
- Page 89 and 90:
(d) (e) (f) No options have been gr
- Page 91 and 92:
Statement by Directors for the fina
- Page 93 and 94:
Income Statements for the financial
- Page 95 and 96:
The Group The Bank Note 2002 2001 2
- Page 97 and 98:
The Group 2001 Non- Share of Share
- Page 99 and 100: The Bank 2001 Non- Share Share Dist
- Page 101 and 102: Notes to the Financial Statements f
- Page 103 and 104: (e) Investments (i) Singapore Gover
- Page 105 and 106: (k) Derivative Financial Instrument
- Page 107 and 108: 4 Interest Expense The Group The Ba
- Page 109 and 110: (c) Equity Compensation Benefits Op
- Page 111 and 112: 11 Directors’ Fees and Other Remu
- Page 113 and 114: 14 Tax (a) The tax charge to the in
- Page 115 and 116: 2002 2001 Fair Value of Depreciable
- Page 117 and 118: Deferred tax assets and liabilities
- Page 119 and 120: 18 Non-Distributable Reserves (a) T
- Page 121 and 122: 19 Revenue Reserves (a) The Group 2
- Page 123 and 124: (c) The interim dividend paid in sp
- Page 125 and 126: 23 Debts Issued The Group The Bank
- Page 127 and 128: (b) Included in other government tr
- Page 129 and 130: (c) Total gross trade bills and adv
- Page 131 and 132: 29 Other Assets The Group The Bank
- Page 133 and 134: 32 Investments in Subsidiaries (a)
- Page 135 and 136: 33 Movements in the Provisions for
- Page 137 and 138: 34 Fixed Assets (a) The Group 2002
- Page 139 and 140: (e) Certain freehold and leasehold
- Page 141 and 142: 39 Derivative Financial Instruments
- Page 143 and 144: (c) Derivative financial instrument
- Page 145 and 146: The Group - 2001 Individual Institu
- Page 147 and 148: (b) Secondary Reporting Format - Ge
- Page 149: Discussions on the main financial r
- Page 153 and 154: Other foreign exchange exposures of
- Page 155 and 156: The Group - 2002 Non- Over 7 Over O
- Page 157 and 158: The Group - 2001 Non- Over 7 Over O
- Page 159 and 160: The Group - 2002 Over 7 Over Over O
- Page 161 and 162: The Group - 2001 Over 7 Over Over O
- Page 163 and 164: Where quoted and observable market
- Page 165 and 166: Percentage of Paid-Up Capital Held
- Page 167 and 168: Percentage of Paid-Up Capital Held
- Page 169 and 170: Percentage of Paid-Up Capital Held
- Page 171 and 172: Investor Reference Financial Highli
- Page 173 and 174: 1998 1997 1996 1995 1994 1993 1992
- Page 175 and 176: 1998 1997 1996 1995 1994 1993 1992
- Page 177 and 178: Statistics of Shareholdings as at 1
- Page 179 and 180: Changes in Share Capital The follow
- Page 181 and 182: Our International Network Banking S
- Page 183 and 184: United Overseas Bank (Malaysia) Bhd
- Page 185 and 186: UOB Venture Management (Shanghai) C
- Page 187 and 188: Notes to Resolutions 4, 6, 7, 8, 9,
- Page 189: Notes: 1 Please insert the number o