Children - Terre des Hommes
Children - Terre des Hommes
Children - Terre des Hommes

Create successful ePaper yourself
Turn your PDF publications into a flip-book with our unique Google optimized e-Paper software.
155<br />
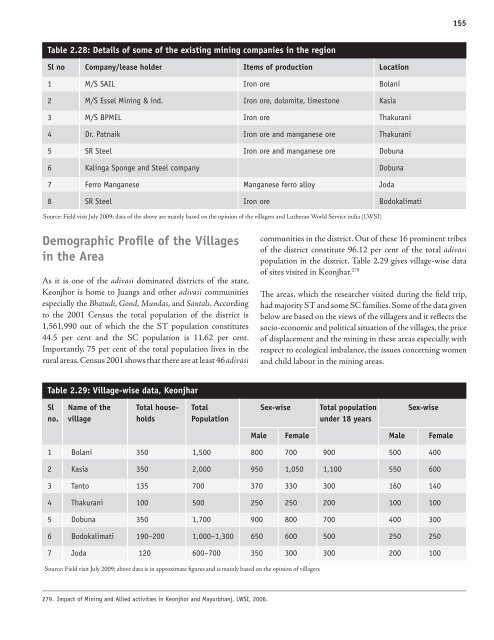
Table 2.28: Details of some of the existing mining companies in the region<br />
Sl no Company/lease holder Items of production Location<br />
1 M/S SAIL Iron ore Bolani<br />
2 M/S Essel Mining & ind. Iron ore, dolomite, limestone Kasia<br />
3 M/S BPMEL Iron ore Thakurani<br />
4 Dr. Patnaik Iron ore and manganese ore Thakurani<br />
5 SR Steel Iron ore and manganese ore Dobuna<br />
6 Kalinga Sponge and Steel company Dobuna<br />
7 Ferro Manganese Manganese ferro alloy Joda<br />
8 SR Steel Iron ore Bodokalimati<br />
Source: Field visit July 2009; data of the above are mainly based on the opinion of the villagers and Lutheran World Service india (LWSI)<br />
Demographic Profile of the Villages<br />
in the Area<br />
As it is one of the adivasi dominated districts of the state,<br />
Keonjhor is home to Juangs and other adivasi communities<br />
especially the Bhatudi, Gond, Mundas, and Santals. According<br />
to the 2001 Census the total population of the district is<br />
1,561,990 out of which the the ST population constitutes<br />
44.5 per cent and the SC population is 11.62 per cent.<br />
Importantly, 75 per cent of the total population lives in the<br />
rural areas. Census 2001 shows that there are at least 46 adivasi<br />
communities in the district. Out of these 16 prominent tribes<br />
of the district constitute 96.12 per cent of the total adivasi<br />
population in the district. Table 2.29 gives village-wise data<br />
of sites visited in Keonjhar. 279<br />
The areas, which the researcher visited during the field trip,<br />
had majority ST and some SC families. Some of the data given<br />
below are based on the views of the villagers and it reflects the<br />
socio-economic and political situation of the villages, the price<br />
of displacement and the mining in these areas especially with<br />
respect to ecological imbalance, the issues concerning women<br />
and child labour in the mining areas.<br />
Table 2.29: Village-wise data, Keonjhar<br />
Sl Name of the Total house- Total Sex-wise Total population Sex-wise<br />
no. village holds Population under 18 years<br />
Male Female Male Female<br />
1 Bolani 350 1,500 800 700 900 500 400<br />
2 Kasia 350 2,000 950 1,050 1,100 550 600<br />
3 Tanto 135 700 370 330 300 160 140<br />
4 Thakurani 100 500 250 250 200 100 100<br />
5 Dobuna 350 1,700 900 800 700 400 300<br />
6 Bodokalimati 190–200 1,000–1,300 650 600 500 250 250<br />
7 Joda 120 600–700 350 300 300 200 100<br />
Source: Field visit July 2009; above data is in approximate figures and is mainly based on the opinion of villagers<br />
279. Impact of Mining and Allied activities in Keonjhor and Mayurbhanj, LWSI, 2006.