2011 Annual Statistical Report on United Nations ... - UNOPS
2011 Annual Statistical Report on United Nations ... - UNOPS 2011 Annual Statistical Report on United Nations ... - UNOPS
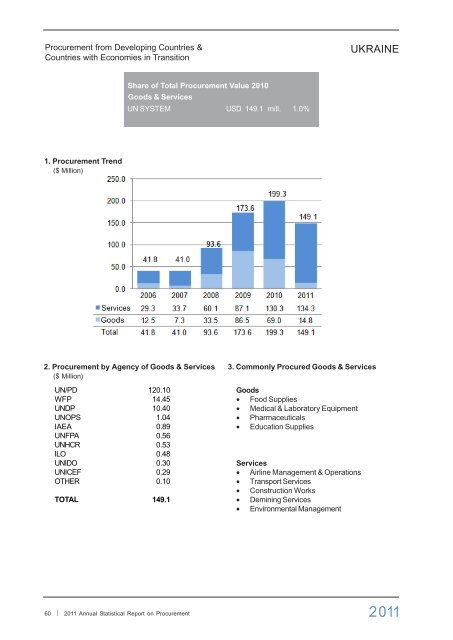
Procurement from Developing Countries & Countries with Economies in Transition UKRAINE Share of Total Procurement Value 2010 Goods & Services UN SYSTEM USD 149.1 mill. 1.0% 1. Procurement Trend ($ Million) 2. Procurement by Agency of Goods & Services ($ Million) UN/PD 120.10 WFP 14.45 UNDP 10.40 UNOPS 1.04 IAEA 0.89 UNFPA 0.56 UNHCR 0.53 ILO 0.48 UNIDO 0.30 UNICEF 0.29 OTHER 0.10 TOTAL 149.1 3. Commonly Procured Goods & Services Goods • Food Supplies • Medical & Laboratory Equipment • Pharmaceuticals • Education Supplies Services • Airline Management & Operations • Transport Services • Construction Works • Demining Services • Environmental Management 60 ⏐
Procurement from Developing Countries & Countries with Economies in Transition UNITED ARAB EMIRATES Share of Total Procurement Value
- Page 13 and 14: Top 20 developing countries and cou
- Page 15 and 16: Year Total of UN Procurement (milli
- Page 17 and 18: Figure 13 Sustainability reporting
- Page 19 and 20: Figure 16 on waste production and m
- Page 21 and 22: Procurement profiles of the DAC mem
- Page 23 and 24: Procurement from DAC Member Countri
- Page 25 and 26: Procurement from DAC Member Countri
- Page 27 and 28: Procurement from DAC Member Countri
- Page 29 and 30: Procurement from DAC Member Countri
- Page 31 and 32: Procurement from DAC Member Countri
- Page 33 and 34: Procurement from DAC Member Countri
- Page 35 and 36: Procurement from DAC Member Countri
- Page 37 and 38: Procurement from DAC Member Countri
- Page 39 and 40: Procurement from DAC Member Countri
- Page 41 and 42: Procurement from DAC Member Countri
- Page 43 and 44: Procurement from DAC Member Countri
- Page 45 and 46: Procurement profiles of the top 20
- Page 47 and 48: Procurement from Developing Countri
- Page 49 and 50: Procurement from Developing Countri
- Page 51 and 52: Procurement from Developing Countri
- Page 53 and 54: Procurement from Developing Countri
- Page 55 and 56: Procurement from Developing Countri
- Page 57 and 58: Procurement from Developing Countri
- Page 59 and 60: Procurement from Developing Countri
- Page 61 and 62: Procurement from Developing Countri
- Page 63: Procurement from Developing Countri
- Page 67 and 68: Total Procurement of Goods by Suppl
- Page 69 and 70: Total Procurement of Goods by Suppl
- Page 71 and 72: Procurement of Goods by Supplier Co
- Page 73 and 74: Procurement of Goods by Supplier Co
- Page 75 and 76: Total Procurement of Goods by Agenc
- Page 77 and 78: Total Procurement of Goods by Agenc
- Page 79 and 80: Total Procurement of Goods by Agenc
- Page 81 and 82: Total Procurement of Goods by Agenc
- Page 83 and 84: Total Procurement of Goods by Agenc
- Page 85 and 86: Total Procurement of Goods by Agenc
- Page 87 and 88: Total Procurement of Goods by Agenc
- Page 89 and 90: Procurement of Services and Works b
- Page 91 and 92: Procurement of Services and Works b
- Page 93 and 94: Total Procurement of Services and W
- Page 95 and 96: Total Procurement of Services and W
- Page 97 and 98: Total Procurement of Services and W
- Page 99 and 100: Total Procurement of Services and W
- Page 101 and 102: Total Procurement of Services and W
- Page 103 and 104: Total Procurement of Services and W
- Page 105 and 106: Total Procurement of Services and W
- Page 107 and 108: Top 10 items (goods and services) -
- Page 109 and 110: Top Ten Items (Goods and Services)
- Page 111 and 112: Top Ten Items (Goods and Services)
- Page 113 and 114: Top Ten Items (Goods and Services)
Procurement from Developing Countries &<br />
Countries with Ec<strong>on</strong>omies in Transiti<strong>on</strong><br />
UKRAINE<br />
Share of Total Procurement Value 2010<br />
Goods & Services<br />
UN SYSTEM USD 149.1 mill. 1.0%<br />
1. Procurement Trend<br />
($ Milli<strong>on</strong>)<br />
2. Procurement by Agency of Goods & Services<br />
($ Milli<strong>on</strong>)<br />
UN/PD 120.10<br />
WFP 14.45<br />
UNDP 10.40<br />
<strong>UNOPS</strong> 1.04<br />
IAEA 0.89<br />
UNFPA 0.56<br />
UNHCR 0.53<br />
ILO 0.48<br />
UNIDO 0.30<br />
UNICEF 0.29<br />
OTHER 0.10<br />
TOTAL 149.1<br />
3. Comm<strong>on</strong>ly Procured Goods & Services<br />
Goods<br />
• Food Supplies<br />
• Medical & Laboratory Equipment<br />
• Pharmaceuticals<br />
• Educati<strong>on</strong> Supplies<br />
Services<br />
• Airline Management & Operati<strong>on</strong>s<br />
• Transport Services<br />
• C<strong>on</strong>structi<strong>on</strong> Works<br />
• Demining Services<br />
• Envir<strong>on</strong>mental Management<br />
60 ⏐ <str<strong>on</strong>g>2011</str<strong>on</strong>g> <str<strong>on</strong>g>Annual</str<strong>on</strong>g> <str<strong>on</strong>g>Statistical</str<strong>on</strong>g> <str<strong>on</strong>g>Report</str<strong>on</strong>g> <strong>on</strong> Procurement


