2009 Annual Statistical Report on United Nations Procurement
2009 Annual Statistical Report on United Nations Procurement 2009 Annual Statistical Report on United Nations Procurement
Procurement from DAC Member Countries DENMARK Share of Total Procurement Value
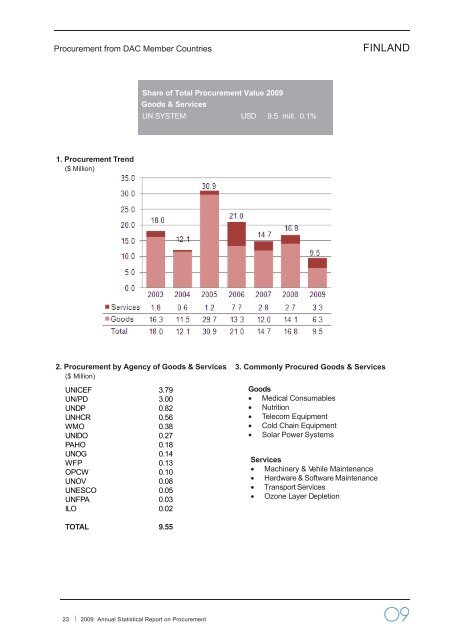
Procurement from DAC Member Countries FINLAND Share of Total Procurement Value
- Page 1 and 2: 2009 Annua
- Page 3 and 4: Table of Contents Introduction.....
- Page 5 and 6: Introduction United Nations procure
- Page 7 and 8: Executive Summary Total procurement
- Page 9 and 10: Procurement by UN agencies in 2008-
- Page 11 and 12: Procurement from developing countri
- Page 13 and 14: Top 20 developing countries and cou
- Page 15 and 16: Global Compact Geographical Origin
- Page 17 and 18: However, some agencies are already
- Page 19 and 20: Finally, the third table shows the
- Page 21 and 22: Procurement profiles of the DAC mem
- Page 23 and 24: Procurement from DAC Member Countri
- Page 25: Procurement from DAC Member Countri
- Page 29 and 30: Procurement from DAC Member Countri
- Page 31 and 32: Procurement from DAC Member Countri
- Page 33 and 34: Procurement from DAC Member Countri
- Page 35 and 36: Procurement from DAC Member Countri
- Page 37 and 38: Procurement from DAC Member Countri
- Page 39 and 40: Procurement from DAC Member Countri
- Page 41 and 42: Procurement from DAC Member Countri
- Page 43 and 44: Procurement from DAC Member Countri
- Page 45 and 46: Procurement from Developing Countri
- Page 47 and 48: Procurement from Developing Countri
- Page 49 and 50: Procurement from Developing Countri
- Page 51 and 52: Procurement from Developing Countri
- Page 53 and 54: Procurement from Developing Countri
- Page 55 and 56: Procurement from Developing Countri
- Page 57 and 58: Procurement from Developing Countri
- Page 59 and 60: Procurement from Developing Countri
- Page 61 and 62: Procurement from Developing Countri
- Page 63 and 64: Procurement from Developing Countri
- Page 65 and 66: Procurement of goods and services -
- Page 67 and 68: Total Procurement of Goods by Suppl
- Page 69 and 70: Total Procurement by Agency: 2008-<
- Page 71 and 72: Procurement of Goods by Supplier Co
- Page 73 and 74: Total Procurement of Goods by Agenc
- Page 75 and 76: Total Procurement of Goods by Agenc
<strong>Procurement</strong> from DAC Member Countries<br />
FINLAND<br />
Share of Total <strong>Procurement</strong> Value <str<strong>on</strong>g>2009</str<strong>on</strong>g><br />
Goods & Services<br />
UN SYSTEM USD 9.5 mill. 0.1%<br />
1. <strong>Procurement</strong> Trend<br />
($ Milli<strong>on</strong>)<br />
2. <strong>Procurement</strong> by Agency of Goods & Services<br />
($ Milli<strong>on</strong>)<br />
UNICEF 3.79<br />
UN/PD 3.00<br />
UNDP 0.82<br />
UNHCR 0.56<br />
WMO 0.38<br />
UNIDO 0.27<br />
PAHO 0.18<br />
UNOG 0.14<br />
WFP 0.13<br />
OPCW 0.10<br />
UNOV 0.08<br />
UNESCO 0.05<br />
UNFPA 0.03<br />
ILO 0.02<br />
3. Comm<strong>on</strong>ly Procured Goods & Services<br />
Goods<br />
• Medical C<strong>on</strong>sumables<br />
• Nutriti<strong>on</strong><br />
• Telecom Equipment<br />
• Cold Chain Equipment<br />
• Solar Power Systems<br />
Services<br />
• Machinery & Vehile Maintenance<br />
• Hardware & Software Maintenance<br />
• Transport Services<br />
• Oz<strong>on</strong>e Layer Depleti<strong>on</strong><br />
TOTAL 9.55<br />
23 ⏐ <str<strong>on</strong>g>2009</str<strong>on</strong>g> <str<strong>on</strong>g>Annual</str<strong>on</strong>g> <str<strong>on</strong>g>Statistical</str<strong>on</strong>g> <str<strong>on</strong>g>Report</str<strong>on</strong>g> <strong>on</strong> <strong>Procurement</strong>


