THE UNITED NATIONS 8th SURVEY OF CRIME TRENDS AND ...
THE UNITED NATIONS 8th SURVEY OF CRIME TRENDS AND ...
THE UNITED NATIONS 8th SURVEY OF CRIME TRENDS AND ...

Create successful ePaper yourself
Turn your PDF publications into a flip-book with our unique Google optimized e-Paper software.
VALIDATION <strong>OF</strong> RESPONSES TO TABLES 1-4<br />
<strong>THE</strong> <strong>UNITED</strong> <strong>NATIONS</strong> 8 th <strong>SURVEY</strong> <strong>OF</strong> <strong>CRIME</strong> <strong>TRENDS</strong> <strong>AND</strong> OPERATIONS <strong>OF</strong><br />
CRIMINAL JUSTICE SYSTEMS<br />
2001-2002<br />
Prepared for<br />
The United Nations Office of Drugs and Crime<br />
Prepared by:<br />
John Jay College of Criminal Justice<br />
The City University of New York<br />
445 West 59th Street<br />
New York, NY 10019<br />
November 2005
This report was prepared by faculty and graduate students of John Jay College of Criminal<br />
Justice under the auspices of the John Jay College Office for the Advancement of Research. We<br />
thank John Jay College President Jeremy Travis, Dean of Research and Graduate Studies James<br />
Levine, and Director of Sponsored Programs Jacob Marini for their enthusiastic support and for<br />
providing the funds to carry out the project. We thank Provost Basil Wilson whose help was<br />
instrumental in the planning stages of the project. Thanks also go to Poline Haralambopoulos and<br />
Caroline McMahon for their administrative assistance on the project, to Sinead Keegan for her<br />
editorial comments and assistance and to Adam S. Wandt for his technical assistance.<br />
Project Participants<br />
Faculty<br />
Dr. Marilyn Rubin, Project Director<br />
Dr. Jeanne Marie Col<br />
Dr. Richard Culp<br />
Dr. Joshua Freilich<br />
Dr. Peter Mameli<br />
Prof. Fred Palm<br />
Dr. Karen Terry<br />
Prof. Michael Walker<br />
Graduate Students<br />
Janet Ho<br />
Junior Benjamin<br />
Meredith Dank<br />
Meredith Patten<br />
Sheetal Ranjan
TABLE <strong>OF</strong> CONTENTS<br />
SECTION TITLE<br />
PAGE<br />
1.0 Overview and Summary 1<br />
2.0 Africa 23<br />
3.0 Asia 31<br />
4.0 Europe 44<br />
5.0 Latin America (Caribbean, Central America and South America) 79<br />
6.0 North America 91<br />
7.0 Oceania 97
1.0: VALIDATION <strong>OF</strong> RESPONSES TO TABLES 1-4<br />
OVERVIEW <strong>AND</strong> SUMMARY
1.1 Introduction<br />
In August 2003, the 8 th United Nations (UN) Survey on Crime Trends and the Operations of<br />
Criminal Justice Systems was sent to Ministers of Foreign Affairs of 191 UN member nations.<br />
The survey, administered periodically by the UN, asks members to report data pertaining to<br />
crime trends and to various components of their criminal justice systems. The four most recent<br />
survey sweeps – the 5 th through 8 th surveys – cover the period between 1995 and 2002. The<br />
United Nations Office of Drugs and Crime (UNODC) received responses from 66 nations to the<br />
8 th survey, covering 2001 and 2002. UNODC has asked John Jay College of Criminal Justice to<br />
validate individual country responses to Part I of the 8 th survey which focuses on police statistics.<br />
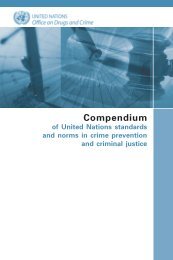
This report has been prepared by John Jay in response to the UNODC request. The 58 nations<br />
included in the report are those for whom 8 th survey responses were received by John Jay in<br />
electronic or paper format from UNODC. Of the 58, six are from Africa, ten from Asia, 28 from<br />
Europe, three from North America, nine from Latin America, and two from Oceania (Figure 1)<br />
Ecuador, Egypt, the Republic of Korea, and Syria are not included since John Jay did not receive<br />
information for these four countries. The response from the Holy See (Vatican City State) is also<br />
not included. The constituent parts of the United Kingdom – England & Wales, Northern<br />
Ireland, and Scotland – are treated as a “single nation” in the response counts for each item as<br />
discussed below. Data for each country are, however, analyzed separately in the discussion of the<br />
United Kingdom in Section 4 of this report (see p 74).<br />
Figure 1: Nations in the John Jay College Analysis of Responses to the UN 8 th<br />
Survey of Crime Trends and Operations of Criminal Justice Systems, by Region<br />
Latin America<br />
16%<br />
Oceania<br />
3%<br />
Africa<br />
10%<br />
North<br />
America<br />
5%<br />
Asia<br />
17%<br />
Europe<br />
49%<br />
1
This section of the report summarizes responses of the 58 nations to the 8 th survey. A detailed<br />
analysis of responses by individual nations, by UN region, is presented in Sections 2 through 7.<br />
Section 2: Africa<br />
Section 3: Asia<br />
Section 4: Europe<br />
Section 5: Latin America (Caribbean, Central America and South America)<br />
Section 6: North America<br />
Section 7: Oceania<br />
Part I of the 8 th survey includes four tables. They are:<br />
‣ Table 1: Police personnel, by sex, and financial resources<br />
‣ Table 2: Crimes recorded in criminal (police) statistics, by type of crime, including attempts<br />
to commit crimes<br />
‣ Table 3: Persons brought into initial formal contact with the police and/or the criminal justice<br />
system, by type of crime, where initial formal contact might include being suspected,<br />
arrested, cautioned, etc.<br />
‣ Table 4: Persons brought into formal contact with the criminal justice system, by sex and age<br />
group, where formal contact might include being suspected, arrested, cautioned, etc.<br />
1.2 Responses to Tables 1-4<br />
There are 48 data items in Tables 1-4: four in Table 1, eighteen in Table 2, eighteen in Table 3,<br />
and eight in Table 4. More nations provided data for items in Table 2 than for any of the other<br />
three tables. Of the 58 nations included in the report, 52 provided data for at least one item in<br />
Table 2. Forty-eight provided either complete or partial data for items in Table 1 and forty-one<br />
provided either complete or partial data for items in Table 4, while forty countries provided<br />
complete or partial data for items in Table 3.<br />
There was no survey item in any of the four tables for which all nations provided a response. The<br />
three items with the largest number of responses were total recorded crimes (Item 2.1), total<br />
recorded rapes (Item 2.8), and recorded total thefts (Item 2.11), all of which received responses<br />
from 50 countries. The survey items that received the greatest number of responses are shown in<br />
Figure 2 below.<br />
2
Figure 2: Survey Items with the Largest Number of Reponses to Tables 1-4<br />
(Number of Responses)<br />
40 42 44 46 48 50 52<br />
Total crimes (Item 2.1)<br />
Total rapes (Item 2.8)<br />
Total thefts (Item 2.11)<br />
Completed homicides (Item 2.2)<br />
Total assaults (Item 2.7)<br />
Frauds (Item 2.14)<br />
Robberies (Item 2.9)<br />
Drug crimes (Item 2.16)<br />
Auto thefts (Item 2.12)<br />
Attempted homicides (Item 2.3)<br />
1.3 Non-response to Tables 1-4<br />
Nine of the items with the largest number of non-responses were in Table 3, another four were in<br />
Table 4, and one was in Table 2. The survey items with the largest number of non-responses are<br />
shown in Figure 3 below.<br />
Figure 3: Survey Items with the Largest Number of Non-responses to Tables 1-4<br />
(Number of Responses)<br />
Firearm homicide suspects (Item 3.4)<br />
Theft suspects (Item 3.10)<br />
Major theft (Item 2.10)<br />
Attempted homicide suspects (Item 3.3)<br />
Embezzlement suspects (Item 3.15)<br />
Bribery/corruption suspects (Item 3.17)<br />
Kidnapping suspects (Item 3.18)<br />
Non-intentional homicide suspects (Item 3.5)<br />
Burglary suspects (Item 3.13)<br />
Major assault suspects (Item 3.6)<br />
Adult female suspects (Item 4.4)<br />
Adult male suspects (Item 4.5)<br />
Juvenile female suspects (Item 4.7)<br />
Juvenile male suspects (Item 4.8)<br />
0 10 20 30 40 50<br />
3
1.4 Responses and Non-responses by Table<br />
Table 1. (See Summary Table 1, p.12) Of the 58 nations, 31 provided data for all items in<br />
Table 1. Another 17 provided data for at least one of the four items. Ten provided no data for any<br />
item. The item with the largest number of responses in Table 1 was total police personnel (Item<br />
1.1). The items with the largest number of non-responses were female police personnel (Item<br />
1.2) and total police budget/financial resources (Item 1.4).<br />
Table 2 (See Summary Table 2, p.14). Of the 58 nations,, eight provided data for all items in<br />
Table 2. Another 44 provided data for at least one of the items and six provided no data for any<br />
item. The items with the largest number of responses were total recorded crimes (Item 2.1), total<br />
recorded rapes (Item 2.8), and recorded total thefts (Item 2.11). The item with the largest number<br />
of non-responses was major thefts (Item 2.10).<br />
Table 3 (See Summary Table 3, p.17). Of the 58 nations, five provided data for all items in<br />
Table 3. Another 35 provided data for at least one of the items and 18 provided no data for any<br />
item. The item with the largest number of responses was all persons brought into initial formal<br />
contact with the criminal justice system (Item 3.1). The item with the largest number of nonresponses<br />
was intentional homicide committed with a firearm suspects (Item 3.4).<br />
Table 4 (See Summary Table 4, p.20). Of the 58 nations, 30 provided data for all items in<br />
Table 4. Eleven provided data for at least one of the items and 17 provided no data for any item.<br />
The items with the largest number of responses were total female suspects (Item 4.1), total male<br />
suspects (Item 4.2), total adult suspects (Item 4.3), and total juvenile suspects (Item 4.6). The<br />
items with the largest number of non-responses were adult female suspects (Item 4.4), adult male<br />
suspects (Item 4.5), juvenile female suspects (Item 4.7), and juvenile male suspects (Item 4.8).<br />
1.5 Responses and Non-responses to Tables 1-4 by Region<br />
1.51 Africa<br />
Seven (13%) of the 53 UN member nations from Africa responded to the 8 th survey. However,<br />
Egypt, one of the 66 nations on the UNODC list of respondents, is not included in the John Jay<br />
analysis since no electronic or paper form for this country was received by us. The six nations<br />
included in the analysis are:<br />
Algeria*<br />
Ethiopia*<br />
Morocco<br />
Namibia<br />
South Africa<br />
Tunisia<br />
*Paper survey form used in the analysis<br />
.<br />
Table 1. Two of the six nations provided data for all items in Table 1 for 2001 and/or 2002. Four<br />
did not provide any data.<br />
4
Table 2. None of the six provided data for all items in Table 2 for 2001 and/or 2002. Two<br />
provided no data for any of the 18 items in Table 2. The items with the largest number of nonresponses<br />
were intentional homicide committed with a firearm (Item 2.4) and total recorded<br />
burglaries (Item 2.13).<br />
Table 3. None of the six provided data for all items in Table 3 for 2001 and/or 2002. Four of the<br />
six provided no data for any of the 18 items. None provided data for intentional homicide<br />
committed with a firearm suspects (Item 3.4) and burglary suspects (Item 3.13).<br />
Table 4. Only one of the six submitted data for Table 4.<br />
1.52 Asia<br />
Twelve (27%) of the 45 UN member nations from Asia responded to the 8 th survey. However,<br />
the Republic of Korea and Syria, two of the 66 nations on the UNODC list of respondents, are<br />
not included in the John Jay analysis since no electronic or paper form was received by us for<br />
either. The ten nations included in the analysis are:<br />
Azerbaijan<br />
Japan<br />
Jordan<br />
Kuwait<br />
Maldives<br />
Myanmar<br />
Nepal<br />
Oman<br />
Philippines<br />
Saudi Arabia<br />
Table 1. Four of the ten nations provided data for all items in Table 1 and three of the ten<br />
provided no data. The items with the largest number of non-responses were female police<br />
personnel (Item 1.2) and total police budget/financial resources (Item 1.4).<br />
Table 2. One of the ten provided data for all items in Table 2 and one of the ten provided no<br />
data. The items with the largest number of non-responses were total recorded burglaries (Item<br />
2.13) and total recorded bribery crimes (Item 2.17).<br />
Table 3. One of the ten provided data for all items in Table 3. Three of the ten provided no<br />
responses to any items. The item with the largest number of non-responses was intentional<br />
homicide committed with a firearm suspects (Item 3.4).<br />
Table 4. All ten provided at least partial data for 2001 and 2002. Five of the ten provided data<br />
for all items in Table 4. The items with the largest number of non-responses were adult female<br />
suspects (Item 4.4), adult male suspects (Item 4.5), juvenile female suspects (Item 4.7), and<br />
juvenile male suspects (Item 4.8).<br />
5
1.53 Europe<br />
Twenty-eight (65%) of the 43 UN member nations from Europe responded to the 8 th survey. The<br />
28 nations were:<br />
Albania<br />
Austria<br />
Belarus<br />
Belgium<br />
Croatia<br />
Cyprus<br />
Czech Republic<br />
Denmark<br />
Finland<br />
Germany<br />
Hungary<br />
Iceland<br />
Italy<br />
Latvia<br />
Lithuania<br />
Luxembourg<br />
Malta<br />
Netherlands<br />
Poland<br />
Portugal<br />
Republic of Moldova<br />
Romania<br />
Slovakia<br />
Slovenia<br />
Sweden<br />
Switzerland<br />
Turkey<br />
United Kingdom<br />
(England & Wales, Northern Ireland and Scotland<br />
are counted as one “nation” in the analysis of responses)<br />
Table 1. Sixteen of the 28 nations provided data for all items in Table 1. One of the 28 provided<br />
no data. The survey item with the largest number of non-responses was female police personnel<br />
(Item 1.2).<br />
Table 2. Seven of the 28 provided data for all items in Table 2. One of the 28 provided no<br />
responses to any of the 18 items. The survey item with the largest number of non-responses was<br />
major theft (Item 2.10).<br />
Table 3. Two of the 28 provided data for all items in Table 3. Six provided no data. The two<br />
survey items with the largest number of non-responses were intentional homicides committed<br />
with a firearm suspects (Item 3.4) and major theft suspects (Item 3.10).<br />
Table 4. Sixteen of the 28 provided data for all items in Table 4. Seven of the 28 provided no<br />
data. The survey items with the largest number of non-responses were adult female suspects<br />
(Item 4.4), adult male suspects (Item 4.5), juvenile female suspects (Item 4.7), and juvenile male<br />
suspects (Item 4.8).<br />
1.54 Latin America (The Caribbean, Central America and South America)<br />
Ten (31%) of the 32 UN member nations from the Caribbean, Central America and South<br />
America (together referred to as Latin America) responded to the 8 th survey. None of the<br />
respondents were from the Caribbean. Ecuador, one of the 66 nations on the UNODC list of<br />
respondents, is not included in the John Jay analysis since no electronic or paper form for this<br />
country was received by us. The nine nations included in the analysis are:<br />
6
Argentina<br />
Bolivia<br />
Chile<br />
Costa Rica<br />
El Salvador*<br />
Panama<br />
Peru<br />
Uruguay<br />
Venezuela<br />
* Paper survey form used in the analysis<br />
Table 1. Seven of the nine nations provided data for all items in Table 1. Two of the nine<br />
provided no data.<br />
Table 2. None of the nine provided data for all items in Table 2. One of the nine provided no<br />
data for any of the survey items. The survey item with the largest number of non-responses was<br />
major thefts (Item 2.10).<br />
Table 3. Two of the nine provided responses to all of the Table 3 items. Three of the nine<br />
provided no data. The survey items with the largest number of non-responses were attempted<br />
intentional homicide suspects (Item 3.3), major assault suspects (Item 3.6), and major theft<br />
suspects (Item 3.10).<br />
Table 4. Five of the nine provided data for all items in Table 4 for 2001 and/or 2002. Three of<br />
the nine provided no data for 2001 and/or 2002 and one provided partial data. Six of the nine<br />
provided responses to all items in Table 4 with the exception of total adult suspects (Item 4.3),<br />
adult female suspects (Item 4.4), adult male suspects (Item 4.5), total juvenile suspects (Item<br />
4.6), juvenile female suspects (Item 4.7), and juvenile male suspects (Item 4.8).<br />
1.55 North America<br />
All three UN member nations from North America responded to the 8 th survey. They were:<br />
Canada<br />
Mexico<br />
United States<br />
Table 1. Canada and Mexico provided data for all items in Table 1. The United States provided<br />
partial data.<br />
Table 2. All three nations provided partial data for Table 2. None provided data for<br />
embezzlements (Item 2.15) and total recorded bribery crimes (Item 2.17).<br />
Table 3. All three provided partial data for Table 3. The survey items with the largest number of<br />
non-responses were attempted intentional homicide suspects (Item 3.3), intentional homicide<br />
committed with a firearm suspects (Item 3.4), major theft suspects (Item 3.10), embezzlement<br />
suspects (Item 3.15), and bribery/corruption suspects (Item 3.17).<br />
7
Table 4. All three responded to the eight survey items in Table 4.<br />
1.56 Oceania<br />
Two (14%) of the 14 UN member nations from Oceania responded to the 8 th survey. They were:<br />
Australia<br />
New Zealand<br />
Table 1. Both Australia and New Zealand provided partial data for Table 1 for 2001 and 2002.<br />
Both provided data for total police personnel (Item 1.1), female police personnel (Item 1.2), and<br />
male police personnel (Item 1.3). New Zealand provided no data for total police budget/financial<br />
resources (Item 1.4) and Australia provided data for this item only for 2001.<br />
Table 2. Australia provided no data for any of the 18 survey items in Table 2. New Zealand<br />
provided no data for total recorded crimes (Item 2.1) and major thefts (Item 2.10).<br />
Table 3. Neither nation provided data for Table 3.<br />
Table 4. Neither provided data for Table 4.<br />
1.6 Validity of the responses to the UN 8 th Survey<br />
The analysis of responses by 58 nations to Tables 1 through 4 in the 8 th survey is presented in<br />
detail in Sections 2 through 7 of this report. This analysis shows that there were inconsistencies<br />
regarding responses to just about all items in Tables 1 through 4 when these responses were<br />
compared with responses to the 5 th , 6 th and 7 th UN surveys. These inconsistencies, which varied<br />
across nation and item, are “flagged” in the individual country analyses. The flag indicates that<br />
there has been a substantial increase or decrease in the numbers reported for 2001 and/or 2002<br />
over previous years and/or that there has been substantial fluctuation in the numbers over the<br />
1995 to 2002 period. Overall, the responses for automobile theft (Item 2.12) and embezzlement<br />
(Item 2.15) are flagged for seven nations, the highest for any individual item, followed by total<br />
assaults (Item 2.7) which is flagged for six. When an item has been flagged, it is suggested that<br />
one or both of the following questions (as applicable) be submitted to individual nations for<br />
clarification.<br />
‣ What explains the fluctuations in the numbers over the period between 1995 and 2002?<br />
‣ Is the increase or decrease observed in 2001 and/or 2002 data reflective of an actual change<br />
in conditions, or is it attributable to a change in definition, reporting or other factors?<br />
A few of the 58 nations reported a total number of crimes (Item 2.1) that was greater than the<br />
calculated sum of crimes reported in Table 2, while a little over half (35) reported a total number<br />
of crimes that was less than 85% of the calculated sum of crimes. Both of these cases are noted<br />
in the nation-specific discussions presented in Sections 2 through 7 and should be clarified.<br />
8
1.7 Methodology<br />
Several nations that responded to the 8 th survey but did not submit data for 2001 and 2002 were<br />
omitted from the analysis. For all countries that submitted 2001 and/or 2002 data:<br />
1) For each item in Tables 1-4, the numerical responses for 2001 and 2002 were<br />
compared with responses to that same item for a minimum of three years from 1995 to<br />
2000. The mean response and standard deviation for each item were calculated and used<br />
to inform this comparison. If the 2001 and 2002 reported numbers were significantly<br />
different than (greater than or less than) numbers reported for earlier years, the item was<br />
flagged for attention. If less than three years of data were available for a specific item, no<br />
comparison was made for that item.<br />
2) In Table 2, the sum of all reported crimes was calculated and compared with the<br />
reported number of total crimes (Item 2.1). If the calculated sum was greater than the<br />
reported sum, the item was flagged for attention. If the calculated sum was less than<br />
85% of the reported sum, the total was also flagged for attention.<br />
1.8 Potential explanations of non-responses and inconsistencies in reported data<br />
There are several possible explanations for a nation’s non-response to a specific item in the UN<br />
survey or for inconsistencies in the data reported for 2001 and 2002 compared with data reported<br />
for earlier years. The following are some potential explanations, other than reporting errors, for<br />
the omissions and inconsistencies. These explanations, which are not necessarily mutually<br />
exclusive or jointly exhaustive, were not offered by any nation but are put forth by the John Jay<br />
College research team for consideration. Additional research is needed to match responses from<br />
specific nations to these or other explanations for non-responses or inconsistent reporting in the<br />
8 th survey.<br />
1) Ongoing or sporadic civil unrest and wars in a country. Both wars and civil<br />
unrest could destroy infrastructure, reduce communications, distract officials<br />
from routine crime data record keeping, and encourage shifts in criminal<br />
behavior, including new types of criminal behavior.<br />
2) Administrative changes. Changes in the administrative structure of a nation,<br />
including adjustments in the relationship between the national and subnational<br />
governments, could disrupt the collection and reporting of crime statistics.<br />
3) Statistical capabilities. Expansion of a reporting government’s statistical<br />
capabilities and/or increased internal communication could improve the<br />
collection and reporting of crime data. This is particularly a possibility in<br />
island nations or in large sparsely-populated nations that are strengthening the<br />
linkages between urban centers and smaller, more remote settlements.<br />
4) Political leadership. Changes in regime or political leadership could lead to a<br />
discontinuity of (or the improvement of) routine criminal justice operations,<br />
including the collection and reporting of crime data.<br />
9
5) Policy focus. Changes in a nation’s policy focus could alter the collection and<br />
reporting of crime data. For example, a new campaign against corruption or<br />
drug dealing could result in the reallocation of resources to the collection of<br />
targeted statistics with less emphasis on other crime statistics (particularly in a<br />
country with an inadequate criminal justice infrastructure).<br />
6) Regional considerations. In nations attempting to join the European Union<br />
(or a similar regional grouping), a movement toward harmonization of crime<br />
definitions, policies and procedures could create a discontinuity or gap in<br />
record keeping.<br />
7) Nations in transition. Among recently independent countries, such as those of<br />
the former Soviet Union, inconsistencies in statistics could result from new<br />
levels of aggregation and the time-consuming effort to establish country-level<br />
infrastructure and capacity to collect and report data.<br />
10
SUMMARY NON-RESPONSE TABLES<br />
11
Summary Table 1: Police personnel, by sex, and financial resources, 2001-2002<br />
Item 1: Total police personnel<br />
Item 2: Female police personnel<br />
Item 3: Male police personnel<br />
Item 4: Total police budget/financial resources<br />
Summary Table 1. Non-responses to UN 8 th Survey<br />
Table 1, by Item<br />
1.1 1.2 1.3 1.4<br />
Africa Algeria 1 X X X X<br />
Ethiopia 1 X X X X<br />
Morocco<br />
Namibia X X X X<br />
South Africa<br />
Tunisia X X X X<br />
Africa 4 4 4 4<br />
Asia Azerbaijan<br />
Japan<br />
Jordan X X X X<br />
Kuwait<br />
X<br />
Maldives<br />
X<br />
Myanmar<br />
Nepal<br />
Oman X X X X<br />
Philippines X* X X X<br />
Saudi Arabia X X X X<br />
Asia 4 5 4 5<br />
Europe Albania<br />
Austria<br />
Belarus X X X<br />
Belgium X* X* X* X<br />
Croatia<br />
Cyprus X* X*<br />
Czech<br />
Republic<br />
Denmark X*<br />
Finland<br />
Germany X* X X X<br />
Hungary X X<br />
Iceland X* X*<br />
Italy<br />
X<br />
Latvia<br />
Lithuania<br />
Luxembourg<br />
12
Summary Table 1. Non-responses to UN 8 th Survey<br />
Table 1, by Item<br />
1.1 1.2 1.3 1.4<br />
Europe Malta<br />
Netherlands<br />
X<br />
Poland<br />
Portugal<br />
R.Moldova<br />
Romania<br />
X<br />
Slovakia<br />
Slovenia<br />
Sweden<br />
Switzerland X X<br />
Turkey X X X X<br />
UK 2<br />
Europe 6 8 7 6<br />
Latin<br />
America Argentina X X X X<br />
Bolivia<br />
Chile<br />
Costa Rica<br />
El Salvador 1<br />
Panama<br />
Peru X X X X<br />
Uruguay<br />
Venezuela<br />
Latin America 2 2 2 2<br />
North<br />
America Canada<br />
Mexico<br />
United States X X X<br />
N. America 0 1 1 1<br />
Oceania Australia X*<br />
New Zealand<br />
X<br />
Oceania 0 0 0 2<br />
Total non-responses 16 20 18 20<br />
X* Country provided data for either 2001 or 2002, but not both years.<br />
1<br />
Analysis based on paper rather than electronic survey form.<br />
2 A non-response is noted only if no constituent UK country provided data.<br />
13
Summary Table 2: Crimes recorded in criminal (police) statistics, by type of crime including attempts to commit crimes,<br />
2001-2002<br />
Item 2.1 – Grand total of recorded crimes<br />
Item 2.2 – Total recorded intentional homicides, completed<br />
Item 2.3 – Total recorded intentional homicides attempted<br />
Item 2.4 – Total recorded intentional homicides committed with a firearm<br />
Item 2.5 – Total recorded non-intentional homicides<br />
Item 2.6 – Total recorded major assaults<br />
Item 2.7 – Total recorded assaults<br />
Item 2.8 – Total recorded rapes<br />
Item 2.9 – Total recorded robberies<br />
Item 2.10 – Total recorded major thefts<br />
Item 2.11 – Total recorded thefts<br />
Item 2.12 – Total recorded automobile thefts<br />
Item 2.13 – Total recorded burglaries<br />
Item 2.14 – Total recorded frauds<br />
Item 2.15 – Total recorded embezzlements<br />
Item 2.16 – Total recorded drug offenses<br />
Item 2.17 – Total recorded bribery crimes<br />
Item 2.18 – Total recorded kidnappings<br />
Summary Table 2: Non-responses to Table 2, by Item<br />
2.1 2.2 2.3 2.4 2.5 2.6 2.7 2.8 2.9 2.10 2.11 2.12 2.13 2.14 2.15 2.16 2.17 2.18<br />
Africa Algeria 1 X X X X X X X X X X X X X X X X X X<br />
Ethiopia 1 X X X X X X X X X X X X X X X X X X<br />
Morocco X<br />
Namibia X X X X X X X X X X X X X X<br />
South Africa X X X X<br />
Tunisia X X<br />
Africa 3 2 3 5 2 3 3 2 3 4 3 2 5 3 4 3 4 3<br />
Asia Azerbaijan X<br />
Japan X X X X<br />
Jordan X X X X X X X X X X X X X X X X X X<br />
14
Summary Table 2: Non-responses to Table 2, by Item<br />
2.1 2.2 2.3 2.4 2.5 2.6 2.7 2.8 2.9 2.10 2.11 2.12 2.13 2.14 2.15 2.16 2.17 2.18<br />
Asia Kuwait X X X X X<br />
Maldives X X X* X<br />
Myanmar X*<br />
Nepal X X X X X X X X<br />
Oman<br />
Philippines X* X X X X X X X X X X X<br />
Saudi Arabia X X X X X X<br />
Asia 1 2 1 5 2 3 2 3 3 5 2 4 6 2 3 4 6 5<br />
Europe Albania X X X<br />
Austria<br />
Belarus<br />
Belgium X X X X<br />
Croatia<br />
Cyprus X* X<br />
Czech Republic X X X<br />
Denmark X X<br />
Finland X<br />
Germany X X X<br />
Hungary<br />
Iceland X X<br />
Italy X X X X X<br />
Latvia<br />
Lithuania<br />
Luxembourg X<br />
Malta X X* X X X X X X<br />
Netherlands X X X X X X<br />
Poland X<br />
Portugal X X<br />
R.Moldova X X<br />
Romania X X X<br />
Slovakia X X<br />
15
Summary Table 2: Non-responses to Table 2, by Item<br />
2.1 2.2 2.3 2.4 2.5 2.6 2.7 2.8 2.9 2.10 2.11 2.12 2.13 2.14 2.15 2.16 2.17 2.18<br />
Europe Slovenia<br />
Sweden X X X X<br />
Switzerland X X X X<br />
Turkey X X X X X X X X X X X X X X X X X X<br />
UK 2 X<br />
Europe 1 2 3 8 7 8 1 1 2 16 1 3 3 1 8 1 6 5<br />
Latin America Argentina X X X X X X X X<br />
Bolivia X X X<br />
Chile X X X X X<br />
Costa Rica X X* X<br />
1<br />
El Salvador X<br />
Panama X X X X X X X<br />
Peru X X X<br />
Uruguay X<br />
Venezuela X X X X X X X X X X X X X X X X X X<br />
Latin America 1 2 4 3 4 4 1 1 3 5 1 2 4 2 3 2 4 3<br />
North America Canada X X<br />
Mexico X X X X X X<br />
United States X X X X X X X X<br />
North America 0 0 2 0 1 0 1 0 0 1 0 0 1 1 3 1 3 2<br />
Oceania Australia X X X X X X X X X X X X X X X X X X<br />
New Zealand X X<br />
Oceania 2 1 1 1 1 1 1 1 1 2 1 1 1 1 1 1 1 1<br />
Total non-responses 8 9 14 22 17 19 9 8 12 33 8 13 20 10 22 12 24 19<br />
X* Country provided data for either 2001 or 2002 but not both years.<br />
1<br />
Analysis based on paper rather than electronic survey form.<br />
2 A non-response is noted only if no constituent UK country provided data.<br />
16
Table 3: Persons brought into initial formal contact with the police and/or the criminal justice system, by type of crime, where<br />
initial formal contact might include being suspected, arrested, cautioned, etc., 2001-2002<br />
Item 3.1 – Total – All persons brought into initial formal contact with the criminal justice system<br />
Item 3.2 – Committed intentional homicide suspects<br />
Item 3.3 – Attempted intentional homicide suspects<br />
Item 3.4 – Intentional homicide committed with a firearm suspects<br />
Item 3.5 – Total non-intentional homicide suspects<br />
Item 3.6 – Major assault suspects<br />
Item 3.7 – Total assault suspects<br />
Item 3.8 – Rape suspects<br />
Item 3.9 – Robbery suspects<br />
Item 3.10 – Major theft suspects<br />
Item 3.11 – Total theft suspects<br />
Item 3.12 – Automobile theft suspects<br />
Item 3.13 – Burglary suspects<br />
Item 3.14 – Fraud suspects<br />
Item 3.15 – Embezzlement suspects<br />
Item 3.16 – Total drug crime suspects<br />
Item 3.17 – Bribery/corruption suspects<br />
Item 3.18 – Kidnapping suspects<br />
Summary Table 3: Non-responses to Table 3, by Item<br />
3.1 3.2 3.3 3.4 3.5 3.6 3.7 3.8 3.9 3.10 3.11 3.12 3.13 3.14 3.15 3.16 3.17 3.18<br />
Africa Algeria 1 X X X X X X X X X X X X X X X X X X<br />
Ethiopia 1 X X X X X X X X X X X X X X X X X X<br />
Morocco X* X<br />
Namibia X X X X X X X X X X X X X X X X X X<br />
South Africa X X X X X X X X X X X X X X X X X X<br />
Tunisia X X* X X<br />
Africa 4 4 4 6 4 4 4 4 5 4 4 4 6 4 4 5 4 4<br />
Asia Azerbaijan X X<br />
Japan X X X X<br />
Jordan X X X X X X X X X X X X X X X X X X<br />
17
Summary Table 3: Non-responses to Table 3, by Item<br />
3.1 3.2 3.3 3.4 3.5 3.6 3.7 3.8 3.9 3.10 3.11 3.12 3.13 3.14 3.15 3.16 3.17 3.18<br />
Asia Kuwait X X X X X<br />
Maldives X X X X* X<br />
Myanmar X*<br />
Nepal X X X X X X X X X<br />
Oman<br />
Philippines X X X X X X X X X X X X X X X X X X<br />
Saudi Arabia X X X X X X X X X X X X X X X X X X<br />
Asia 3 3 4 8 5 3 4 4 3 5 3 5 7 3 4 4 5 7<br />
Europe Albania X X<br />
Austria X X X X<br />
Belarus X<br />
Belgium X X X X X X X X X X X X X X X X X X<br />
Croatia X<br />
Cyprus X X X X X X X X X X X X X X X X X X<br />
Czech<br />
Republic X X X<br />
Denmark X X X X X X X X X X X X X X X X X X<br />
Finland X<br />
Germany X X X X X<br />
Hungary<br />
Iceland X X X X X X X X X X X X X X X X X X<br />
Italy X X X X X<br />
Latvia X X<br />
Lithuania X<br />
Luxembourg X X X X X X X X X X X X X X X X X X<br />
Malta X X X X X X X X X X<br />
Netherlands X X X X X X<br />
Poland X X X X X<br />
Portugal X<br />
R.Moldova X X<br />
Romania X X X<br />
18
Summary Table 3: Non-responses to Table 3, by Item<br />
3.1 3.2 3.3 3.4 3.5 3.6 3.7 3.8 3.9 3.10 3.11 3.12 3.13 3.14 3.15 3.16 3.17 3.18<br />
Europe Slovakia X<br />
Slovenia<br />
Sweden X X X X<br />
Switzerland X X X X X X X X X X X X X X X X X X<br />
Turkey X X X X X X X<br />
UK 2 X X X<br />
Europe 6 7 13 18 11 12 6 8 8 17 6 8 7 7 13 7 11 10<br />
Latin<br />
America Argentina X X X X X X X X X X X X X X X X X X<br />
Bolivia X X X X X X X X X X X X X X X<br />
Chile X X X X X<br />
Costa Rica X X X X X X X X X X X X X X X X X X<br />
El Salvador 1<br />
Panama X X X X X X X X X X X X X X X X X<br />
Peru X X X X X X X X X<br />
Uruguay<br />
Venezuela X X X X X X X X X X X X X X X X X X<br />
Latin America 3 6 7 6 6 7 5 5 6 7 5 5 6 5 5 4 6 6<br />
North<br />
America Canada X X<br />
Mexico X X X X X X<br />
United States X X X X X X<br />
North<br />
America 0 0 2 2 1 0 0 0 0 2 1 0 1 0 2 0 2 1<br />
Oceania Australia X X X X X X X X X X X X X X X X X X<br />
New Zealand X X X X X X X X X X X X X X X X X X<br />
Oceania 2 2 2 2 2 2 2 2 2 2 2 2 2 2 2 2 2 2<br />
Total non-responses 18 22 32 42 29 28 21 23 24 37 21 24 29 21 30 22 30 30<br />
X* Country provided data for either 2001 or 2002 but not both years.<br />
1<br />
Analysis based on paper rather than electronic survey form.<br />
2 A non-response is noted only if no constituent UK country provided data.<br />
19
Table 4: Persons brought into initial formal contact with the criminal justice system, by sex and age group, where formal<br />
contact might include being suspected, arrested, cautioned, etc., 2001-2002<br />
Item 4.1 – Total female suspects<br />
Item 4.2 – Total male suspects<br />
Item 4.3 – Total adult suspects<br />
Item 4.4 – Adult female suspects<br />
Item 4.5 – Adult male suspects<br />
Item 4.6 – Total juvenile suspects<br />
Item 4.7 – Juvenile female suspects<br />
Item 4.8 – Juvenile male suspects<br />
Summary Table 4: Non-responses to Table 4, by Item<br />
4.1 4.2 4.3 4.4 4.5 4.6 4.7 4.8<br />
Africa Algeria 1 X X X X X X X X<br />
Ethiopia 1 X X X X X X X X<br />
Morocco<br />
Namibia X X X X X X X X<br />
South Africa X X X X X X X X<br />
Tunisia X X X X X X X X<br />
Africa 5 5 5 5 5 5 5 5<br />
Asia Azerbaijan<br />
Japan<br />
Jordan X X X X X<br />
Kuwait<br />
Maldives X X X X<br />
Myanmar<br />
Nepal X X X<br />
Oman<br />
Philippines X X X X X X* X* X*<br />
Saudi Arabia X X X X<br />
Asia 2 2 2 4 4 2 4 4<br />
20
Summary Table 4: Non-responses to Table 4, by Item<br />
4.1 4.2 4.3 4.4 4.5 4.6 4.7 4.8<br />
Europe Albania X X X X<br />
Austria<br />
Belarus<br />
Belgium X X X X X X X X<br />
Croatia<br />
Cyprus X X X X X X X X<br />
Czech<br />
Republic<br />
Denmark X X X X X X X X<br />
Finland<br />
Germany<br />
Hungary<br />
Iceland X X X X X X X X<br />
Italy X X X X X X<br />
Latvia<br />
Lithuania<br />
Luxembourg<br />
Malta<br />
Netherlands<br />
Poland<br />
Portugal X X X X<br />
R.Moldova<br />
Romania X X X X<br />
Slovakia<br />
Slovenia<br />
Sweden X X X X<br />
Switzerland X X X X X X X X<br />
Turkey X X X X X X X X<br />
UK 2 X X X X X X X X<br />
Europe 8 8 7 12 12 7 12 12<br />
21
Summary Table 4: Non-responses to Table 4, by Item<br />
4.1 4.2 4.3 4.4 4.5 4.6 4.7 4.8<br />
Latin<br />
America Argentina X X X X X X X X<br />
Bolivia X X X X X X<br />
Chile<br />
Costa Rica X X X X X X X X<br />
El Salvador 1<br />
Panama X X X X X X X X<br />
Peru<br />
Uruguay<br />
Venezuela<br />
Latin America 3 3 4 4 4 4 4 4<br />
North<br />
America Canada<br />
Mexico<br />
United States<br />
North<br />
America 0 0 0 0 0 0 0 0<br />
Oceania Australia X X X X X X X X<br />
New Zealand X X X X X X X X<br />
Oceania 2 2 2 2 2 2 2 2<br />
Total non-responses 20 20 20 27 27 20 27 27<br />
X* Country provided data for either 2001 or 2002 but not both years.<br />
1<br />
Analysis based on paper rather than electronic survey form.<br />
2 A non-response is noted only if no constituent UK country provided data.<br />
22
2.0: VALIDATION <strong>OF</strong> RESPONSES TO TABLES 1-4<br />
AFRICA<br />
- 23 -
2.0 Africa<br />
Seven (13%) of the 53 UN member nations from Africa were included on the UNODC list of the<br />
66 respondents to the 8 th survey. Egypt, one of the countries on the list, is not included in the<br />
John Jay analysis presented below since no electronic or paper form was received by us for this<br />
country. Of the six countries whose responses were reviewed by John Jay College, four provided<br />
data for 2001 and 2002. In general, as the summary table at the end of this section shows, most<br />
African countries have not historically responded to UN crime data surveys. A few countries that<br />
did respond in the past, such as Nigeria and Zimbabwe, did not respond to the 8 th survey.<br />
2.1 Algeria<br />
Data provided by Algeria for the 8 th survey covered the years 1998, 1999, and 2000 but not 2001<br />
and 2002. Thus, no analysis is presented for Algeria.<br />
2.2 Ethiopia<br />
Data provided by Ethiopia for the 8 th survey covered the years 1993 and 1994 but not 2001 and<br />
2002. Thus, no analysis is presented for Ethiopia.<br />
2.3 Morocco<br />
Morocco responded to 45 of the 48 items in the 8 th survey in 2001 and 46 of the 48 items in<br />
2002. The missing items are shown in Table A. In 2001, the 143,371 calculated sum of crimes<br />
was 53% of the 270,844 reported total crimes (Item 2.1). In 2002, the 144,105 calculated sum<br />
was 51% of the 283,702 reported total crimes. What categories of crime are included in total<br />
recorded crimes (Item 2.1) that are not covered by the rest of the items in Table 2 (Items 2.2-<br />
2.18)?<br />
In the 8 th survey:<br />
(1) For all items in Table 1 (Items 1.1-1.4) and Table 2 (Items 2.1-2.18), no data were<br />
submitted for 1995 to 2000 so that no trend analysis could be undertaken.<br />
(2) Total intentional homicides committed with a firearm (Item 2.4) are reported<br />
as zero in 2001 and as one in 2002. Are these the actual values?<br />
(3) In 2002, intentional homicides committed with a firearm (Item 3.4) are reported as<br />
zero. Is this the actual value?<br />
Table A: Non-responses<br />
2001 2002<br />
2.13 Total recorded burglaries X X<br />
3.4 Intentional homicide committed with a firearm suspects X<br />
3.13 Burglary suspects X X<br />
- 24 -
Table B: Less than Three Years Data Available from 1995 to 2000<br />
1.1-1.4 Table 1 – all items<br />
2.1-2.18 Table 2 – all items<br />
3.3 Attempted intentional homicide suspects<br />
3.4 Intentional homicide committed with a firearm suspects<br />
3.9 Robbery suspects<br />
3.12 Automobile theft suspects<br />
3.13 Burglary suspects<br />
3.17 Bribery/corruption crime suspects<br />
3.18 Kidnapping suspects<br />
4.1-4.8 Table 4 – all items<br />
2.4 Namibia<br />
Namibia submitted data for the 8 th survey for only four items: total recorded intentional<br />
homicide, completed (Item 2.2); total recorded non-intentional homicides (Item 2.5); total<br />
recorded rapes (Item 2.8); and total recorded automobile theft (Item 2.12). No data were<br />
submitted for any survey items for 1995 through 2000, so no analysis is presented for Namibia.<br />
2.5 South Africa<br />
South Africa provided responses to 18 of the 48 items in the 8 th survey for 2001 and 2002. The<br />
items that are missing are shown in Table A. In 2001, the 2,339,196 calculated sum of crimes<br />
was 89% of the 2,620,974 total reported crimes (Item 2.1). In 2002, the 2,430,356 calculated<br />
sum was 91% of the total 2,683,849 reported crimes.<br />
In the 8 th survey:<br />
(1) Total recorded thefts (Item 2.11) decreased from 685,729 in 1995 to 550,925 in 2000.<br />
From 2000 to 2001, thefts increased to 885,997 and continued to increase in 2002 to<br />
931,821. Is this increase reflective of an actual change in thefts or is it attributable to<br />
a change in definition, reporting or other factors?<br />
(2) Total recorded automobile thefts (Item 2.12) decreased from 188,438 in 1998 to<br />
96,859 in 2001, and continued to decrease to 93,133 in 2002. Is this difference<br />
reflective of an actual change in automobile thefts or is it attributable to a change in<br />
definition, reporting or other factors?<br />
- 25 -
Table A: Non-responses 2001 2002<br />
2.4 Total recorded intentional homicides, committed w/firearm X X<br />
2.10 Total recorded major thefts X X<br />
2.15 Total recorded embezzlements X X<br />
2.17 Total recorded bribery crimes X X<br />
3.1-3.18 Table 3 – all items X X<br />
4.1-4.8 Table 4 – all items X X<br />
Table B: Less than Three Years Data Available from 1995 to 2000<br />
2.15 Total recorded embezzlements<br />
2.17 Total recorded bribery crimes<br />
2.18 Kidnapping<br />
3.4 Intentional homicide committed with a firearm suspects<br />
3.5 Non-intentional homicide suspects<br />
3.10 Major theft suspects<br />
3.15 Embezzlement suspects<br />
3.18 Kidnapping suspects<br />
4.4 Adult female suspects<br />
4.5 Adult male suspects<br />
4.6 Total juvenile suspects<br />
4.7 Juvenile female suspects<br />
4.8 Juvenile male suspects<br />
2.6 Tunisia<br />
Tunisia responded to 30 items in 2002 and 31 in 2001 of the 48 items in the 8 th survey. The<br />
items that are missing are shown in Table A. In 2001, the 64,420 calculated sum of crimes was<br />
54% of the 120,217 total reported crimes (Item 2.1). In 2002, the 68,682 calculated sum was<br />
53% of the total 130,375 reported crimes. What categories of crime are included in total<br />
recorded crimes (Item 2.1) that are not covered by the rest of the items in Table 2 (Items 2.2-<br />
2.18)?<br />
In the 8 th survey:<br />
(1) Total recorded non-intentional homicides (Item 2.5) decreased from 76 in 1998 to 31<br />
in 2001, and continued to decrease to 20 in 2002. Is this difference reflective of an<br />
actual change in homicides or is it attributable to a change in definition, reporting or<br />
other factors?<br />
(2) Total recorded automobile thefts (Item 2.12) increased from 882 in 1998 to 1,182 in<br />
2001, and continued to increase to 1,690 in 2002. Is this increase reflective of an<br />
- 26 -
actual change in automobile thefts or is it attributable to a change in definition,<br />
reporting or other factors?<br />
(3) Total recorded drug offenses (Item 2.16) increased from 335 in 1998 to 851 in 2001<br />
then decreased slightly to 815 in 2002. Is this difference reflective of an actual<br />
change in drug offenses or is it attributable to a change in definition, reporting or<br />
other factors?<br />
(4) Total recorded bribery crimes (Item 2.17) decreased from 173 in 1998 to 93 in 2001<br />
and continued to decrease to 68 in 2002. Is this difference reflective of an actual<br />
change in bribery or is it attributable to a change in definition, reporting or other<br />
factors?<br />
(5) Committed intentional homicide suspects (Item 3.2) increased substantially from 98<br />
in 1998 to 176 in 2001 and continued to increase to 202 in 2002. Is this difference<br />
reflective of an actual change in homicide suspects or is it attributable to a change in<br />
definition, reporting or other factors?<br />
(6) Total non-intentional homicide suspects (Item 3.5) decreased from 92 in 1998 to 31 in<br />
2001 and continued to decrease to 21 in 2002. Is this difference reflective of an<br />
actual change in homicide suspects or is it attributable to a change in definition,<br />
reporting or other factors?<br />
(7) Major theft suspects (Item 3.10) decreased from 7,417 in 1998 to 2,148 in 2001, but<br />
then returned to 7,176 in 2002. Is the decline in 2001 reflecting an actual decline in<br />
that one year or is it attributable to a change in definition, reporting or other factors?<br />
(8) Bribery/corruption suspects (Item 3.17) decreased from 180 in 1998 to 115 in 2001,<br />
and continued to decrease to 85 in 2002. Is this difference reflective of an actual<br />
change in bribery and corruption suspects or is it attributable to a change in<br />
definition, reporting or other factors?<br />
Table A: Non-responses 2001 2002<br />
1.1-1.4 Table 1 – all items X X<br />
2.4 Total recorded intentional homicides committed w/ firearm X X<br />
2.13 Burglaries X X<br />
3.4 Intentional homicide committed w/ a firearm suspects X X<br />
3.9 Robbery suspects X<br />
3.13 Burglary suspects X X<br />
3.16 Total drug crime suspects X X<br />
4.1-4.8 Table 4 – all items X X<br />
- 27 -
Table B: Less than Three Years Data Available from 1995 to 2000<br />
1.1-1.4 Table 1 – all items<br />
2.4 Total recorded intentional homicides committed with a firearm<br />
2.18 Kidnapping<br />
3.4 Intentional homicide committed with a firearm suspects<br />
3.18 Kidnapping suspects<br />
- 28 -
Africa Summary Table: UN Members Responding to Crime Surveys Covering 1990-2002<br />
East Africa<br />
North Africa<br />
Southern Africa<br />
Country<br />
5 th Survey 6 th Survey 7 th Survey 8 th Survey<br />
19901991199219931994199519961997199819992000 2001 2002<br />
Burundi<br />
Comoros<br />
Djibouti<br />
Eritrea<br />
Ethiopia X X² X²<br />
Kenya<br />
Madagascar X X X X X<br />
Mauritius X X X X X X X X X X X<br />
Rwanda X<br />
Seychelles X X X X<br />
Somalia<br />
Tanzania, U.R. X X X<br />
2 2<br />
Uganda X X X<br />
Algeria X¹ X¹ X¹<br />
1 1<br />
Egypt X X X X X<br />
Libya<br />
Morocco X X X X X X X X X X<br />
Sudan X X X X X<br />
Tunisia X X X X X<br />
Angola<br />
Botswana X<br />
Lesotho X X X X X X X X<br />
Malawi<br />
Mozambique<br />
Namibia X X<br />
South Africa X X X X X X X X<br />
Swaziland X X X X X X X X<br />
- 29 -
Country<br />
5 th Survey 6 th Survey 7 th Survey 8 th Survey<br />
19901991199219931994199519961997199819992000 2001 2002<br />
Zambia X X X X X X X X<br />
Zimbabwe X X X X X X X X X X X<br />
Benin<br />
Burkina Faso<br />
Cameroon<br />
Cape Verde<br />
Central African Rep.<br />
Chad<br />
Congo, DRC<br />
Congo, Rep.<br />
Côte d'Ivoire X<br />
Equatorial Guinea<br />
Gabon<br />
Gambia<br />
West and Central Africa<br />
Ghana<br />
Guinea<br />
Guinea-Bissau<br />
Liberia<br />
Mali<br />
Mauritania<br />
Niger<br />
Nigeria X X X X X<br />
Sao Tome & Principe X X X X X<br />
Senegal X X X X X<br />
Sierra Leone<br />
Togo<br />
1<br />
Algeria included data for calendar years 1998–2000 rather than 2001–2002.<br />
2 Ethiopia included data for calendar years 1993–1994 rather than 2001–2002.<br />
- 30 -
3.0: VALIDATION <strong>OF</strong> RESPONSES TO TABLES 1-4<br />
ASIA<br />
- 31 -
3.0 Asia<br />
Twelve (27%) of the 45 UN member nations from Asia were on the UNODC list of 66<br />
respondents to the 8 th survey. Syria and the Republic of Korea, two of the countries on the list,<br />
are not included in the John Jay analysis presented below since no electronic or paper form was<br />
received by us for either country. Of the ten Asian countries whose responses were reviewed by<br />
John Jay, all provided at least partial data for 2001 and 2002. The summary table for Asia at the<br />
end of this section shows that 32 of the 45 countries had responded to at least one of the last<br />
three (5 th , 6 th or 7 th ) UN surveys. Some countries that had responded to earlier surveys, such as<br />
Kyrgyzstan and China, did not respond to the 8 th survey.<br />
3.1 Azerbaijan<br />
Azerbaijan provided responses to 45 of the 48 items in the 8 th survey. The missing items are<br />
shown in Table A. In 2001, the 6,813 calculated sum of crimes was 47% of the 14,607 total<br />
reported crimes (Item 2.1). In 2002, the 5,897 calculated sum of crime was 38% of the 15,520<br />
total reported crimes. Why are the 2001 and 2002 percentages different? What categories of<br />
crime are included in the number reported in total recorded crimes (Item 2.1) that are not<br />
covered by the rest of the items in Table 2 (Items 2.2-2.18)?<br />
In the 8 th survey:<br />
(1) Total recorded intentional homicides committed with a firearm (Item 2.4) varied<br />
widely from an annual average of 268 for 1995 to 1997, to an average of 15 for<br />
1998 to 2000, to 140 in 2001, and 120 in 2002. What explains this variation in<br />
magnitude?<br />
(2) Reported major assaults (Item 2.6) were 10 in 2001 and 22 in 2002 compared with<br />
the 1995 to 1997 annual average of 339. Was this an actual decrease or is it<br />
attributable to a change in definition, reporting or other factors? (This item was not<br />
reported for 1998-2000)<br />
(3) Reported major thefts (Item 2.10) were 20 in 2001 and 18 in 2002 compared with<br />
the annual average of 1,506 from 1995 to 1997. Was this an actual decrease or is it<br />
attributable to a change in definition, reporting or other factors? (This item was not<br />
reported for 1998-2000)<br />
(4) Major assault suspects (Item 3.6) were 23 in 2001 and 17 in 2002 compared with an<br />
annual average of 201 from 1995 to 1997. Was this an actual decrease or is it<br />
attributable to a change in definition, reporting or other factors? (This item was not<br />
reported for 1998-2000)<br />
(5) There were eight major theft suspects (Item 3.10) reported in 2001 and 16 in 2002<br />
compared with the annual average of 1,643 from 1995 to 1997. Was this an actual<br />
- 32 -
decrease or is it attributable to a change in definition, reporting or other factors?<br />
(This item was not reported for 1998-2000)<br />
Table A: Non-responses 2001 2002<br />
2.13 Total recorded burglaries X X<br />
3.4 Intentional homicide committed with a firearm suspects X X<br />
3.13 Burglary suspects X X<br />
Table B: Less than Three Years Data Available from 1995 to 2000<br />
1.1 Total police personnel<br />
1.2 Female police personnel<br />
1.3 Male police personnel<br />
1.4 Total police budget/financial resources<br />
2.13 Total recorded burglaries<br />
2.18 Kidnapping<br />
3.4 Intentional homicide committed w/a firearm<br />
3.13 Burglary suspects<br />
3.18 Kidnapping suspects<br />
3.2 Japan<br />
Japan provided responses to 40 of the 48 items in the <strong>8th</strong> survey. The missing items are shown<br />
in Table A. In 2001, the 2,537,109 calculated sum of crimes was 93% of the 2,735,612 total<br />
recorded crimes (Item 2.1). In 2002, the 2,584,522 calculated sum of crimes was 91% of the<br />
2,853,739 total<br />
In the 8 th survey:<br />
(1) Automobile thefts (Item 2.12) were reported at 63,275 in 2001 and 62,673 in 2002,<br />
both substantial declines from the 309,638 reported in 2000. Were the 2001 and<br />
2002 numbers reflecting actual declines in automobile thefts or are they attributable<br />
to a change in definition, reporting or other factors?<br />
(2) Automobile theft suspects (Item 3.12) were reported at 4,933 in 2001 and 4,775 in<br />
2002, a decrease from 19,733 in 2000. Were the 2001 and 2002 numbers reflecting<br />
actual declines or are they attributable to a change in definition, reporting or other<br />
factors?<br />
- 33 -
Table A: Non-responses 2001 2002<br />
2.2 Total recorded intentional homicide, completed X X<br />
2.10 Total recorded major thefts X X<br />
2.13 Total recorded burglaries X X<br />
2.17 Total recorded bribery crimes X X<br />
3.4 Intentional homicide committed with a firearm suspects X X<br />
3.10 Major theft suspects<br />
X X<br />
3.13 Burglary suspects X X<br />
3.18 Kidnapping X X<br />
Table B: Less than Three Years Data Available from 1995 to 2000<br />
2.6 Total recorded major assaults<br />
2.10 Major theft<br />
2.18 Kidnapping<br />
3.6 Major assault suspects<br />
3.10 Major theft suspects<br />
3.18 Kidnapping suspects<br />
3.3 Jordan<br />
Jordan provided responses to three of the 48 items in the <strong>8th</strong> survey. They were: juvenile<br />
suspects (Item 4.6), juvenile female suspects (Item 4.7) and juvenile male suspects (Item 4.8).<br />
Data for these items were not provided in prior years. Data reported from 1995 to 2000 for<br />
other items in the survey were not provided for 2001 and 2002. Thus, no comparative analysis<br />
is presented for Jordan.<br />
3.4 Kuwait<br />
Kuwait provided responses to 37 of the 48 items in the 8 th survey. The missing data are shown<br />
in Table A. In 2001, the 8,654 calculated sum of crimes was 44% of the 19,666 total reported<br />
crimes (Item 2.1). In 2002, the 8,665 calculated sum of crimes was 45% of the 19,350 total<br />
reported crimes. What categories of crime are included in total recorded crimes (Item 2.1) that<br />
are not covered by the rest of the items in Table 2 (Items 2.2-2.18)?<br />
In the 8 th survey:<br />
(1) Data appear to be consistent for 2001 and 2002 for items reported. Insufficient data<br />
were available from previous surveys to permit comparison with previous years.<br />
- 34 -
Table A: Non-responses 2001 2002<br />
1.2 Female police personnel X X<br />
Total recorded intentional homicides committed with a X X<br />
2.4 firearm<br />
2.8 Total recorded rapes X X<br />
2.12 Total recorded automobile theft X X<br />
2.13 Total recorded burglaries X X<br />
2.16 Total recorded drug offenses X X<br />
3.4 Intentional homicide committed with a firearm suspects X X<br />
3.8 Rape suspects X X<br />
3.12 Automobile theft suspects X X<br />
3.13 Burglary suspects X X<br />
3.16 Total drug crime suspects X X<br />
Table B: Less than Three Years Data Available from 1995 to 2000<br />
Only 1996 data available<br />
3.5 Maldives<br />
The Maldives provided responses to 36 of the 48 items in the 2001 and 34 of the 48 items in<br />
2002, with 34 items common to both years. The missing data are shown in Table A. In 2001,<br />
the 3,038 calculated sum of crimes was 47% of the 6,416 total reported crimes (Item 2.1). In<br />
2002, the 3,969 calculated sum of crimes was 56% of the 7,026 total. Why is the percentage<br />
different in 2001 and 2002? What categories of crime are included in total recorded crimes<br />
(Item 2.1) that are not covered by the rest of the items in Table 2 (Items 2.2-2.18)?<br />
In the 8 th survey:<br />
(1) Total frauds (Item 2.14) averaged 154 from 1995 to1997 and increased to 558 in<br />
2001 and 590 in 2002.Were the 2001 and 2002 numbers reflecting actual increases<br />
or were they attributable to a change in definition, reporting or other factors?<br />
(2) There were 250 reported embezzlements (Item 2.15) in 2001 and 274 in 2002. In<br />
1995 there were 58, in1996 there were 38, and in 1997 there were 35. Were the<br />
2001 and 2002 numbers reflecting actual increases or were they attributable to a<br />
change in definition, reporting or other factors?<br />
.<br />
(3) Total persons brought into initial formal contact with the police (Item 3.1) were<br />
reported at 2,598 in 1995, at 2,725 in 1996 and at 3,235 in 1997. The number<br />
increased to 8,968 in 2001 and 14,411 in 2002. Were the 2001 and 2002 numbers<br />
reflecting actual increases or were they attributable to a change in definition,<br />
reporting or other factors?<br />
- 35 -
(4) Fraud suspects (Item 3.14) were 22 in 1995, in 1996 they were 30 and in 1997 they<br />
were 64. They increased to 448 in 2001 and declined to 72 in 2002. What explains<br />
this variation in magnitude?<br />
(5) Embezzlement suspects (3.15) were 36 in 1995, in 1996 they were 33 and in 1997<br />
they were 31. They increased to 183 in 2001 and 193 in 2002. Were the 2001 and<br />
2002 numbers reflecting actual increases or were they attributable to a change in<br />
definition, reporting or other factors?<br />
Table A: Non-responses 2001 2002<br />
1.4 Total police budget/financial resources X X<br />
2.4 Total recorded intentional homicides committed with a firearm X X<br />
2.5 Total recorded non-intentional homicides X X<br />
2.17 Total recorded bribery crimes X<br />
2.18 Kidnapping X X<br />
3.3 Attempted intentional homicide suspects X X<br />
3.4 Intentional homicide committed with a firearm suspects X X<br />
3.5 Total non-intentional homicide suspects X X<br />
3.17 Bribery/corruption suspects X<br />
3.18 Kidnapping X X<br />
4.4 Adult female suspects X X<br />
4.5 Adult male suspects X X<br />
4.7 Juvenile female suspects X X<br />
4.8 Juvenile male suspects X X<br />
Table B: Less than Three Years Data Available from 1995 to 2000<br />
1.1 Total police personnel<br />
1.2 Female police personnel<br />
1.3 Male police personnel<br />
1.4 Total police budget<br />
2.4 Intentional homicide committed w/ a firearm<br />
2.18 Kidnapping<br />
3.3 Attempted intentional homicide suspects<br />
3.18 Kidnapping suspects<br />
3.6 Myanmar<br />
Myanmar provided responses to all 48 items in 2001 and 46 of the 48 items for 2002. The<br />
missing data are shown in Table A. In 2001, the 19,862 calculated sum of crimes was close to<br />
100% of the 19,873 total recorded crimes (Item 2.1). In 2002, the 18,305 calculated sum of<br />
crimes was also close to 100% of the reported 18,301 total recorded crimes.<br />
- 36 -
In the 8 th survey:<br />
(1) In 2001, there were two reported kidnappings (Item 2.18) and seven kidnapping<br />
suspects (Item 3.18). The 2002 data for kidnappings were not reported. Were these<br />
data not reported since there were zero kidnappings or was there some other reason<br />
for the non-response?<br />
Table A: Non-responses 2001 2002<br />
2.18 Kidnapping X<br />
3.18 Kidnapping (suspects) X<br />
Table B: Less than Three Years Data Available from 1995 to 2000<br />
All items in Tables 1-4<br />
3.7 Nepal<br />
Nepal provided responses to 28 of the 48 items in the 8 th survey. The missing data are shown in<br />
Table A. In 2001, the 3,087 calculated sum of crimes was 32% of the 9,644 total recorded<br />
crimes (Item 2.1). In 2002, the 3,143 calculated sum of crimes was 35% of the 8,872 total<br />
recorded crimes. What categories of crime are included in total recorded crimes (Item 2.1) that<br />
are not covered by the rest of the items in Table 2 (Items 2.1-2.18)?<br />
In the 8 th survey:<br />
(1) Data appear to be consistent for 2001 and 2002. Insufficient data were available<br />
from previous surveys to permit comparison with earlier years.<br />
Table A: Non-responses 2001 2002<br />
2.4 Total recorded intentional homicides committed with a firearm X X<br />
2.7 Total Recorded Assaults X X<br />
2.10 Total recorded major thefts X X<br />
2.12 Total recorded automobile theft X X<br />
2.13 Total recorded burglaries X X<br />
2.15 Total recorded embezzlements X X<br />
2.17 Total recorded bribery crimes X X<br />
2.18 Kidnapping X X<br />
3.4 Intentional homicide committed with a firearm suspects X X<br />
3.5 Total non-intentional homicide suspects X X<br />
3.7 Total assault suspects X X<br />
3.10 Major theft suspects X X<br />
3.12 Automobile theft suspects X X<br />
3.13 Burglary suspects X X<br />
- 37 -
Table A: Non-responses 2001 2002<br />
3.15 Embezzlement suspects X X<br />
3.17 Bribery/corruption suspects X X<br />
3.18 Kidnapping X X<br />
4.6 Total juvenile suspects X X<br />
4.7 Juvenile female suspects X X<br />
4.8 Juvenile male suspects X X<br />
Table B: Less than Three Years Data Available from 1995 to 2000<br />
3.8 Oman<br />
All items in Tables 1-4<br />
Oman provided responses to 44 of the 48 items in the 8 th survey. The missing data are shown in<br />
Table A. In 2001, the 6,487 calculated sum of crimes was 59% of the 11,015 total recorded<br />
crimes (Item 2.1). In 2002, the 6,694 calculated sum of crimes was 57% of the 11,782 total.<br />
What categories of crime are included in the total recorded crimes (Item 2.1) that are not<br />
covered by the rest of the items in Table 2 (Items 2.1-2.18)?<br />
In the 8 th survey:<br />
(1) Data appear to be consistent for 2001 and 2002 for items reported. Insufficient data<br />
were available from previous surveys to permit comparison with earlier years.<br />
Table A: Non-responses 2001 2002<br />
1.1 Total police personnel X X<br />
1.2 Female police personnel X X<br />
1.3 Male police personnel X X<br />
1.4 Total police budget/financial resources X X<br />
Table B: Less than Three Years Data Available from 1995 to 2000<br />
All items in Tables 1-4<br />
3.9 Philippines<br />
The Philippines provided responses to six of the 48 items for 2001 and to 11 of the 48 items in<br />
2002, with six items common to both years. The missing data are shown in Table A. Of the 11<br />
items reported in 2002, four were provided in 1995 to 2000. Data reported from 1995 to 2000<br />
for other items in the survey were not provided for 2001 and 2002. Thus, no comparative<br />
analysis is presented.<br />
- 38 -
Table A: Non-responses 2001 2002<br />
1.1 Total police personnel X<br />
1.2 Female police personnel X X<br />
1.3 Male police personnel X X<br />
1.4 Total police budget/financial resources X X<br />
2.6 Total recorded major assaults X<br />
2.8 Total recorded rapes X X<br />
2.9 Total recorded robberies X X<br />
2.10 Total recorded major thefts X X<br />
2.11 Total recorded thefts X X<br />
2.12 Total recorded automobile theft X X<br />
2.13 Total recorded burglaries X X<br />
2.14 Total recorded frauds X X<br />
2.15 Total recorded embezzlements X X<br />
2.16 Total recorded drug offenses X X<br />
2.17 Total recorded bribery crimes X X<br />
2.18 Kidnapping X X<br />
3.1-3.18 All items in Table 3 X X<br />
4.1 Female suspects X<br />
4.2 Male suspects X<br />
4.3 Adult suspects X<br />
4.4 Adult female suspects X<br />
4.5 Adult male suspects X<br />
4.6 Juvenile suspects X X<br />
4.7 Juvenile female suspects X X<br />
4.8 Juvenile male suspects X X<br />
Table B: Less than Three Years Data Available from 1995 to 2000<br />
1.1 Total police personnel<br />
1.2 Female police personnel<br />
1.3 Male police personnel<br />
1.4 Total police budget/financial resources<br />
2.3 Total recorded intentional homicide, attempted<br />
2.4 Total recorded intentional homicides committed with a firearm<br />
2.6 Total recorded major assaults<br />
2.7 Total recorded assaults<br />
2.11 Total theft<br />
2.12 Automobile theft<br />
2.13 Burglary<br />
2.14 Fraud<br />
2.15 Embezzlement<br />
2.16 Drug-related crimes<br />
2.17 Bribery/corruption<br />
- 39 -
2.18 Kidnapping<br />
3.1-3.18 All items<br />
4.1- 4.8 All items<br />
3.10 Saudi Arabia<br />
Saudi Arabia reported 16 of the 48 items in the 8 th survey, ten less than the 29 items reported in<br />
the 7 th survey. Items not reported in the 8 th survey are shown in Table A. No data were<br />
provided for the 1990 to 1997 period. In 2001, the 69,633 calculated sum of crimes was 87% of<br />
the 79,785 total recorded crimes (Item 2.1). In 2002, the 74,530 calculated sum of crimes was<br />
88% of the 84,599 total recorded crimes.<br />
In the 8 th survey:<br />
(1) Total assaults (Item 2.7) were reported as 14,168 and 13,864 in 2001 and 2002,<br />
respectively. The number of assaults in 1998 was 3,668, in 1999 it was 8,820 and in<br />
2000, it was 4,705. Are the increases in 2001 and 2002 reflective of an actual<br />
change in the number of assaults or are they attributable to a change in definition,<br />
reporting or other factors?<br />
(2) Total major thefts (2.11) were reported at 37,805 in 2001 and 39,683 in 2002. The<br />
number in 1998 was 12,527, in 1999 it was 24,509 and in 2000 it was 12,994. Are<br />
the increases in 2001 and 2002 reflective of an actual change in the number of thefts<br />
or are they attributable to a change in definition, reporting or other factors?<br />
(3) Adult suspects (Item 4.3) were reported at 396,390 in 2001 and 42,707 in 2002. Is<br />
the difference between 2001 and 2002 reflective of an actual difference in adult<br />
suspects or is it attributable to a change in definition, reporting or other factors, such<br />
as a missing digit?<br />
Table A: Non-responses 2001 2002<br />
1.1 Total police personnel X X<br />
1.2 Female police personnel X X<br />
1.3 Male police personnel X X<br />
1.4 Total police budget/financial resources X X<br />
Total recorded intentional homicides committed with a X X<br />
2.4 firearm<br />
2.6 Total recorded major assaults X X<br />
2.9 Total recorded robberies X X<br />
2.10 Total recorded major thefts X X<br />
2.16 Total recorded drug offenses X X<br />
2.17 Total recorded bribery crimes X X<br />
- 40 -
3.1-3.18 All items X X<br />
4.4 Adult female suspects X X<br />
4.5 Adult male suspects X X<br />
4.7 Juvenile female suspects X X<br />
4.8 Juvenile male suspects X X<br />
Table B: Less than Three Years Data Available from 1995 to 2000<br />
1.1 Total police personnel<br />
1.2 Female police personnel<br />
1.3 Male police personnel<br />
1.4 Total police budget/financial resources<br />
2.1 Grand total of recorded crimes<br />
2.3 Total recorded intentional homicide, attempted<br />
2.4 Intentional homicide committed w/ a firearm<br />
2.6 Total recorded major assaults<br />
2.10 Major theft<br />
2.17 Bribery/corruption<br />
2.18 Kidnapping<br />
3.1 Total persons brought into initial formal contact w/ police<br />
3.3 Attempted intentional homicide suspects<br />
3.4 Intentional homicide committed w/ a firearm suspects<br />
3.10 Major theft suspects<br />
3.17 Bribery/corruption suspects<br />
3.18 Kidnapping suspects<br />
4.3 Total adult suspects<br />
4.5 Male adult suspects<br />
4.6 Total juvenile suspects<br />
4.7 Female juvenile suspects<br />
- 41 -
Asia Summary Table: UN Members Responding to Crime Surveys Covering 1990-2002<br />
Central Asia and<br />
Transcaucasia<br />
East and South-East<br />
Asia<br />
Country<br />
5 th Survey 6 th Survey 7 th Survey 8 th Survey<br />
1990 1991 1992 1993 1994 1995 1996 1997 1998 1999 2000 2001 2002<br />
Armenia X X X X X X X X X X X<br />
Azerbaijan X X X X X X X X X X X X X<br />
Georgia X X X X X X X X X X X<br />
Kazakhstan X X X X X X X X X X X<br />
Kyrgyzstan X X X X X X X X X X X<br />
Tajikistan X X X X<br />
Turkmenistan<br />
Uzbekistan<br />
Brunei<br />
Darussalam<br />
Cambodia<br />
China X X X X X X X X X X X<br />
Hong Kong,<br />
China (SAR) 1 X X X X X X X X X X X<br />
Indonesia X X X X X X X X<br />
Japan X X X X X X X X X X X X X<br />
Korea, DPR<br />
Korea, Rep. X X X X X X X X X X X<br />
Lao PDR<br />
Macao 1 X X X X X<br />
Malaysia X X X X X X X X X X X<br />
Mongolia<br />
Myanmar X X X<br />
Philippines X X X X X X X X X X<br />
Singapore X X X X X X X X X X X<br />
Thailand X X X X X X X<br />
Timor-Leste<br />
Viet Nam<br />
- 42 -
Middle East<br />
South Asia<br />
Country<br />
5 th Survey 6 th Survey 7 th Survey 8 th Survey<br />
1990 1991 1992 1993 1994 1995 1996 1997 1998 1999 2000 2001 2002<br />
Afghanistan<br />
Bahrain X X X X<br />
Iran<br />
Iraq X X X X X<br />
Israel X X X X X X X X<br />
Jordan X X X X X X X X X X<br />
Kuwait X X X X X X X<br />
Lebanon X X<br />
Oman X X<br />
Pakistan X X X<br />
Qatar X X X X X X X X<br />
Saudi Arabia X X X X X<br />
Syria X X X X X<br />
United Arab<br />
Emirates<br />
Yemen X X X<br />
Bangladesh<br />
Bhutan<br />
India X X X X X X X X X X<br />
Maldives X X X X X X<br />
Nepal X X X<br />
Sri Lanka X X X X X X X<br />
1 Hong Kong (not a UN member) reported data for earlier years, but no longer does so.<br />
2 Macao (not a UN member) reported data for earlier years, but no longer does so.<br />
- 43 -
4.0: VALIDATION <strong>OF</strong> RESPONSES TO TABLES 1-4<br />
EUROPE<br />
- 44 -
4.0 Europe<br />
Twenty-eight 1 of 44 UN member nations from Europe responded to the 8 th survey. As can be<br />
seen in the summary table at the end of this section, 27 countries that responded to the 8 th survey<br />
also responded to at least one of the previous three (5 th , 6 th , or 7 th ) surveys.<br />
4.1 Albania<br />
Albania provided responses to 39 of the 48 items in the 8 th survey. The missing items are shown<br />
in Table A. In 2001, the 3,247 calculated sum of crimes was 70% of the 4,670 total reported<br />
crimes (Item 2.1). In 2002, the 3,075 calculated sum was 58% of the total reported crimes of<br />
5,303. Why are the percentages different for 2001 and 2002? What categories of crime are<br />
included in the data reported in total crimes (Item 2.1) that are not covered by the rest of the<br />
items in Table 2 (Items 2.2 – 2.18)?<br />
In the 8 th survey:<br />
(1) Female police personnel (Item 1.2) declined from 1,329 in 2001 to 537 in 2002. Is this<br />
decrease reflective of an actual change in number or is it attributable to a change in<br />
definition, reporting or other factors?<br />
(2) Kidnapping (Item 2.18) declined to 15 in 2002 from 40 in 2001. Is this decrease<br />
reflective of an actual change in number or is it attributable to a change in definition,<br />
reporting or other factors?<br />
(3) Kidnapping suspects (Item 3.18) declined from 85 in 2001 to 24 in 2002. Is this decrease<br />
reflective of an actual change in number or is it attributable to a change in definition,<br />
reporting or other factors?<br />
(4) Total female suspects (Item 4.1) increased to 248 in 2002 from 125 in 2001. Is this<br />
increase reflective of an actual change in number or is it attributable to a change in<br />
definition, reporting or other factors?<br />
Table A: Non-responses 2001 2002<br />
2.10 Total recorded major thefts X X<br />
2.13 Total recorded burglaries X X<br />
2.15 Total recorded embezzlements X X<br />
3.10 Major Theft Suspects X X<br />
3.15 Embezzlement suspects X X<br />
4.4 Adult female suspects X X<br />
4.5 Adult male suspects X X<br />
4.7 Juvenile female suspects X X<br />
1 The constituent parts of the United Kingdom (UK) – England & Wales, Northern Ireland, and Scotland – are<br />
counted as a “single nation” since the UK is the UN member. Data for each country are, however, analyzed<br />
separately in the discussion of the UK (see pp. 74).<br />
- 45 -
Table A: Non-responses 2001 2002<br />
4.8 Juvenile male suspects X X<br />
Table B: Less than Three Years Data Available from 1995 to 2000<br />
1.1 Total police personnel<br />
1.2 Female police personnel<br />
1.3 Male police personnel<br />
1.4 Total police budget/financial resources<br />
2.1 Grand total of recorded crimes<br />
2.4 Total recorded intentional homicide committed with a firearm<br />
2.7 Total recorded assaults<br />
2.11 Total recorded thefts<br />
2.14 Total recorded frauds<br />
2.15 Total recorded embezzlements<br />
2.17 Total recorded bribery crimes<br />
2.18 Kidnapping<br />
3.1 Total persons brought into initial formal contact w/police<br />
3.4 Intentional homicide committed w/a firearm<br />
3.7 Total assault suspects<br />
3.11 Total theft suspects<br />
3.14 Fraud suspects<br />
3.15 Embezzlement suspects<br />
3.17 Bribery/corruption suspects<br />
3.18 Kidnapping suspects<br />
4.1 Total female suspects<br />
4.4 Female adult suspects<br />
4.7 Female juvenile suspects<br />
4.2 Austria<br />
Austria provided responses to 44 of the 48 items in the 8 th Survey. The missing items are shown<br />
in Table A. In 2001, the 326,796 calculated sum of crimes was 67% of the 484,664 total reported<br />
crimes (Item 2.1). In 2002, the 384,889 calculated sum of crimes was 70% of the 552,411 total<br />
reported crimes. What categories of crime are included in the data reported in total crimes (Item<br />
2.1) that are not covered by the rest of the items in Table 2 (Items 2.2 – 2.18)?<br />
In the 8 th survey:<br />
(1) Bribery/corruption (Item 2.17) increased from 23 in 2001 to 196 in 2002. Was this an<br />
actual increase, or was it due to a change in definition, reporting, or some other factor?<br />
Table A: Non-responses 2001 2002<br />
3.3 Attempted intentional homicide suspects X X<br />
- 46 -
Table A: Non-responses 2001 2002<br />
3.4 Intentional homicide committed with a firearm suspects X X<br />
3.5 Total non-intentional homicide suspects X X<br />
3.8 Rape suspects X X<br />
Table B: Less than Three Years Data Available from 1995-2000<br />
All items in Tables 1-4<br />
4.3 Belarus<br />
Belarus provided responses to 44 of the 48 items in the 8 th survey. The missing items are shown<br />
in Table A. In 2001, the 94,846 calculated sum of crimes was 85% of the 112,189 total reported<br />
crimes (Item 2.1). In 2002, the 102,826 calculated sum was 77% of the total 132,867 reported<br />
crimes. What accounts for the difference in percentages between 2001 and 2002?<br />
Although Belarus has reported crime data to the UN since 1990, some items have been<br />
consistently not reported. Between 1990 and 2000, data regarding police personnel and<br />
resources (Items 1.1-1.4 in Table 1) were not reported and information on these items is still not<br />
provided in the 8 th survey. There is also a consistent lack of reporting for intentional homicide<br />
committed with a firearm (Item 3.4) from 1990 to 2002.<br />
In the 8 th Survey:<br />
(1) In 2001, homicides committed with a firearm (Item 2.4) dropped to 53 from 331 in 2000.<br />
Between 2001 and 2002, the number declined further from 53 to 38. Is this decrease<br />
reflective of an actual change in homicides or is it attributable to a change in definition,<br />
reporting or other factors?<br />
(2) Between 1998 and 2000, total assaults (Item 2.7) ranged from 5,275 to 5,600. In 2001<br />
and 2002, assaults declined to 1,980 and 2,116 respectively. Is this decline reflective of<br />
an actual change in number or is it attributable to a change in definition, reporting or<br />
other factors?<br />
(3) Between 1998 and 2000, robberies (Item 2.9) ranged from 5,056 to 5,668. Robberies<br />
declined to 2,102 in 2001 and 2,460 in 2002. Is this decline reflective of an actual change<br />
in number or is it attributable to a change in definition, reporting or other factors?<br />
(4) Major thefts (Item 2.10) dropped from 43,328 in 2000 to 4,500 in 2001 and then rose to<br />
5,054 in 2002. Although the number of thefts recorded in 1996 (5,746) is close to the<br />
number reported in 2001 and 2002, recorded thefts were greater than 20,000 from 1997 to<br />
2000. What accounts for this fluctuation in magnitude?<br />
(5) Embezzlements (Item 2.15) declined from 266 in 2000 to zero in 2001 and 2 in 2002.<br />
Correspondingly, embezzlement suspects (Item 3.15) decreased from 183 suspects in<br />
2000, to zero in both 2001 and 2002. Are these declines reflective of an actual change in<br />
numbers or are they attributable to a change in definition, reporting or other factors?<br />
- 47 -
(6) Total female suspects (Item 4.1) declined from 13,460 and 12,064 in 1999 and 2000,<br />
respectively, to 4,952 and 5,732 in 2001 and 2002. Is this decline reflective of an actual<br />
change in number or is it attributable to a change in definition, reporting or other factors?<br />
(7) Total adult suspects (Item 4.3) declined from 60,160 and 60,456 in 1999 and 2000,<br />
respectively, to 33,683 in 2001 and 37,527 in 2002. Is this decline reflective of an actual<br />
change in number or is it attributable to a change in definition, reporting or other factors?<br />
(8) Adult female suspects (Item 4.4) declined from 11,858 and 10,690 in 1999 and 2000,<br />
respectively, to 4,293 in 2001 and 5,014 in 2002. Is this decline reflective of an actual<br />
change in number or is it attributable to a change in definition, reporting or other factors?<br />
(9) Juvenile female suspects (Item 4.7) declined from 1,602 and 1,374 in 1999 and 2000,<br />
respectively, to 659 in 2001 and 718 in 2002. Is this decline reflective of an actual<br />
change in number or is it attributable to a change in definition, reporting or other factors?<br />
Table A: Non-responses 2001 2002<br />
1.1 Total police personnel X X<br />
1.2 Female police personnel X X<br />
1.3 Male police personnel X X<br />
3.4 Crimes committed w/ a firearm suspects X X<br />
Table B: Less than Three Years Data Available from 1995 to 2000<br />
1.1 Total police personnel<br />
1.2 Female police personnel<br />
1.3 Male police personnel<br />
1.4 Total police budget<br />
2.18 Kidnapping<br />
3.4 Crimes committed w/ a firearm suspects<br />
3.18 Kidnapping suspects<br />
4.4 Belgium<br />
Belgium provided responses to 14 of the 48 items in 2001 and 17 items in 2002. Missing items<br />
are shown in Table A. In 2001, the 572,214 calculated sum of crime was 60% of the 950,523<br />
total reported number (Item 2.1). In 2002, the 581,618 calculated sum of crimes was 60% of the<br />
973,548 total reported crimes. What categories of crime are included in the data reported in total<br />
crimes (Item 2.1) that are not covered by the rest of the items in Table 2 (Items 2.2 – 2.18)?<br />
Belgium reported no data in any category between 1998 and 2000, but did respond to surveys for<br />
previous years. When data were provided in earlier surveys, there were no responses for items in<br />
Tables 3 and 4. The non-reporting for these tables continued in 2001 and 2002.<br />
- 48 -
In the 8 th survey:<br />
(1) Total police personnel (Item 1.1) increased from 1,433 in 1997 (last reported year for this<br />
item prior to the 8 th survey) to 36,940 in 2002. Was this an actual increase, or was it due<br />
to a change in definition, reporting or some other factor?<br />
(2) Between 1995 and 1997, total recorded robberies (Item 2.9) ranged from 2,092 to 3,598.<br />
They increased to 6,859 in 2001 and 6,888 in 2002. Was this an actual increase, or was it<br />
due to a change in definition, reporting or some other factor?<br />
(3) In 2002, Belgium reported 3,949 total female personnel (Item 1.2). This was far greater<br />
than the 105 reported in 1997 and the 77 reported in 1995. Was this an actual increase, or<br />
was it due to a change in definition, reporting or some other factor?<br />
(4) In 2002, 33,001 total male personnel (Item 1.3) were reported, far greater than the 1,328<br />
last reported in 1997. Was this an actual increase, or was it due to a change in definition,<br />
reporting or some other factor?<br />
(5) Total embezzlements (Item 2.15) were 7,866 and 8,011 in 2001 and 2002, respectively.<br />
Between 1995 and 1997 the numbers ranged from 94 to 100. Was this an actual increase,<br />
or was it due to a change in definition, reporting or some other factor?<br />
Table A: Non-responses 2001 2002<br />
1.1 Total police personnel X<br />
1.2 Female police personnel X<br />
1.3 Male police personnel X<br />
1.4 Total police budget/financial resources X X<br />
2.4 Total recorded intentional homicides with a firearm X X<br />
2.6 Total recorded major assaults X X<br />
2.10 Total recorded major thefts X X<br />
2.12 Total recorded automobile thefts X X<br />
3.1-3.18 All items X X<br />
4.1-4.8 All items X X<br />
Table B: Less than Three Years Data Available from 1995 to 2000<br />
1.1 Total police personnel<br />
1.2 Female police personnel<br />
1.3 Male police personnel<br />
1.4 Total police budget/financial resources<br />
2.13 Total recorded burglaries<br />
2.18 Kidnapping<br />
3.1-3.18 All items<br />
4.1-4.8 All items<br />
- 49 -
4.5 Croatia<br />
Croatia provided responses to 47 of the 48 items in the 8 th survey. The one missing item is<br />
shown in Table A. In 2001, the 68,894 calculated sum of crimes was 71% of the 97,512 total<br />
reported crimes (Item 2.1). In 2002, the 73,501 calculated sum was 72% of the 101,853 total<br />
reported crimes. What categories of crime are included in the number reported in total recorded<br />
crimes (Item 2.1) that are not covered by the rest of the items in Table 2?<br />
In the 8 th survey:<br />
(1) Recorded assaults (Item 2.7) increased from 4,431 in 2001 to 5,404 in 2002, more than<br />
three times the 1,300 assaults in the year this crime was last reported (1997). Was this an<br />
actual increase, or was it due to a change in definition, reporting or some other factor?<br />
(2) Recorded drug offenses (Item 2.16) were 10,819 in 2002, compared to 9,609 in 2001.<br />
The 2002 figure was more than three times the 3,469 reported in 1997. Was this an actual<br />
increase, or was it due to a change in definition, reporting or some other factor?<br />
(3) Recorded bribery crimes (Item 2.17) were 430 in 2002 and 626 in 2001, which was more<br />
than ten times the previous reported number of 59 in 1997. Was this an actual change, or<br />
was it due to a change in definition, reporting or some other factor?<br />
(4) The 8,241 drug crime suspects (Item 3.16) in 2002 were triple the 2,602 drug suspects in<br />
1997, the last reported year before the 8 th survey. Was this an actual change, or was it<br />
due to a change in definition, reporting or some other factor?<br />
Table A: Non-responses 2001 2002<br />
3.4 Intentional homicide committed with a firearm suspects X X<br />
Table B: Less than Three Years Data Available from 1995 to 2000<br />
1.1 Total police personnel<br />
1.2 Female police personnel<br />
1.3 Male police personnel<br />
1.4 Total police budget/financial resources<br />
2.18 Kidnapping<br />
3.12 Automobile theft suspects<br />
3.18 Kidnapping suspects<br />
4.6 Cyprus<br />
Cyprus responded to 19 of the 48 items in the 8 th survey in 2001 and 20 of the 48 items in 2002.<br />
The missing items are shown in Table A. In 2001, the 4,788 calculated sum of crimes was 37%<br />
of the 12,815 total reported crimes (Item 2.1); in 2002, the calculated sum of 5,738 was 44% of<br />
the 13,023 total reported crimes. Why is the percentage different for the two years? What<br />
categories of crime are included in total recorded crimes (Item 2.1) that are not covered by the<br />
rest of the items in Table 2 (Items 2.2-2.18)?<br />
- 50 -
In the 8 th survey:<br />
(1) Between 1997 and 2002, the numbers reported for total reported crimes (Item 2.1) tripled,<br />
increasing from 3,909 in 1997 to 12,815 in 2001 to 13,023 in 2002. Is this increase<br />
reflective of an actual change in number or is it attributable to a change in definition,<br />
reporting or other factors?<br />
(2) The 2001 and 2002 numbers reported for total assaults (Item 2.7) increased from 121 in<br />
1997 to 1,113 in 2001 and 1,192 in 2002. Is this increase reflective of an actual change<br />
in number or is it attributable to a change in definition, reporting or other factors?<br />
(3) Automobile thefts (Item 2.12) increased from 152 in 1997 to 985 in 2001 and 1,009 in<br />
2002. Is this increase reflective of an actual change in number or is it attributable to a<br />
change in definition, reporting or other factors?<br />
(4) Frauds (Item 2.14) for 1996 and 1997 were 859 and 635, respectively. They declined to<br />
256 in 2001 and 200 in 2002. Is this decline reflective of an actual change in number or<br />
is it attributable to a change in definition, reporting or other factors?<br />
Table A: Non-responses 2001 2002<br />
1.2 Female police personnel X<br />
1.3 Male police personnel X<br />
2.5 Non-intentional homicide X<br />
2.15 Embezzlement X X<br />
3.1 Total persons brought into initial formal contact w/ police X X<br />
3.2 Committed intentional homicide suspects X X<br />
3.3 Attempted intentional homicide suspects X X<br />
3.4 Intentional homicide committed w/ a firearm X X<br />
3.5 Non-intentional homicide suspects X X<br />
3.6 Major assault suspects X X<br />
3.7 Total assault suspects X X<br />
3.8 Rape suspects X X<br />
3.9 Robbery suspects X X<br />
3.10 Major theft suspects X X<br />
3.11 Total theft suspects X X<br />
3.12 Automobile theft suspects X X<br />
3.13 Burglary suspects X X<br />
3.14 Fraud suspects X X<br />
3.15 Embezzlement suspects X X<br />
3.16 Drug-related crime suspects X X<br />
3.17 Bribery/corruption suspects X X<br />
3.18 Kidnapping suspects X X<br />
4.1 Female suspects X X<br />
4.2 Male suspects X X<br />
4.3 Adult suspects X X<br />
- 51 -
Table A: Non-responses 2001 2002<br />
4.4 Female adult suspects X X<br />
4.5 Male adult suspects X X<br />
4.6 Juvenile suspects X X<br />
4.7 Female juvenile suspects X X<br />
4.8 Male juvenile suspects X X<br />
Table B: Less than Three Years Data Available from 1995 to 2000<br />
1.1 Total police personnel<br />
1.2 Female police personnel<br />
1.3 Male police personnel<br />
1.4 Total police budget<br />
2.6 Major assault<br />
2.10 Major theft<br />
2.18 Kidnapping<br />
3.1 Total persons brought into initial formal contact w/ police<br />
3.2 Committed intentional homicide suspects<br />
3.3 Attempted intentional homicide suspects<br />
3.4 Intentional homicide committed w/ a firearm<br />
3.5 Non-intentional homicide suspects<br />
3.6 Major assault suspects<br />
3.7 Total assault suspects<br />
3.8 Rape suspects<br />
3.9 Robbery suspects<br />
3.10 Major theft suspects<br />
3.11 Total theft suspects<br />
3.12 Automobile theft suspects<br />
3.13 Burglary suspects<br />
3.14 Fraud suspects<br />
3.15 Embezzlement suspects<br />
3.16 Drug-related crime suspects<br />
3.17 Bribery/corruption suspects<br />
3.18 Kidnapping suspects<br />
4.1 Female suspects<br />
4.2 Male suspects<br />
4.3 Adult suspects<br />
4.4 Female adult suspects<br />
4.5 Male adult suspects<br />
4.6 Juvenile suspects<br />
4.7 Female juvenile suspects<br />
4.8 Male juvenile suspects<br />
- 52 -
4.7 Czech Republic<br />
The Czech Republic provided responses to 42 of the 48 items in the 8 th survey. The missing<br />
items are shown in Table A. In 2001, the 278,044 calculated sum of crimes was 78% of the total<br />
358,577 total reported crimes (Item 2.1). In 2002, the calculated sum of 288,543 was 77% of the<br />
372,341 total reported crimes. What categories of crime are included in total recorded crimes<br />
(Item 2.1) that are not covered by the rest of the items in Table 2 (Items 2.2-2.18)?<br />
In the 8 th survey:<br />
(1) Non-intentional homicides (Item 2.5) declined from 89, 80, and 80 in 1998, 1999, and<br />
2000, respectively, to 45 in 2001 and 49 in 2002. Is this difference reflective of an actual<br />
change in number or is it attributable to a change in definition, reporting or other factors?<br />
(2) All persons brought into contact with the criminal justice system (Item 3.1) declined from<br />
127,887 and 130,234 in 1999 and 2000, respectively, to 85,108 in 2001 and 73,567 in<br />
2002. Is this decline reflective of an actual change in number or is it attributable to a<br />
change in definition, reporting or other factors?<br />
(3) Non-intentional homicide suspects (Item 3.5) declined from 92 and 96 in 1999 and 2000,<br />
respectively, to 32 in 2001 and 31 in 2002. Is this decline reflective of an actual change<br />
in number or is it attributable to a change in definition, reporting or other factors?<br />
(4) Total assault suspects (Item 3.7) decreased from 17,444 and 17,003 in 1999 and 2000,<br />
respectively, to 6,423 in 2001 and 6,322 in 2002. Is this decline reflective of an actual<br />
change in number or is it attributable to a change in definition, reporting or other factors?<br />
(5) Total juvenile suspects (Item 4.6) declined from 17,978 and 17,804 in 1999 and 2000,<br />
respectively, to 9,273 in 2001 and 7,698 in 2002. Is this decline reflective of an actual<br />
change in number or is it attributable to a change in definition, reporting or other factors?<br />
(6) Female juvenile suspects (Item 4.7) decreased from 1,408 and 1,602 in 1999 and 2000,<br />
respectively, to 893 in 2001 and 613 in 2002. Is this decline reflective of an actual<br />
change in number or is it attributable to a change in definition, reporting or other factors?<br />
(7) Male juvenile suspects (Item 4.8) declined from 16,570 and 16,202 in 1999 and 2000,<br />
respectively, to 8,380 in 2001 and 7,083 in 2002. Is this decline reflective of an actual<br />
change in number or is it attributable to a change in definition, reporting or other factors?<br />
Table A: Non-responses 2001 2002<br />
2.3 Attempted intentional homicide X X<br />
2.6 Major assault X X<br />
2.10 Major theft X X<br />
3.3 Attempted intentional homicide suspects X X<br />
3.6 Major assault suspects X X<br />
3.10 Major theft suspects X X<br />
- 53 -
Table B: Less than Three Years Data Available from 1995 to 2000<br />
2.18 Kidnapping<br />
3.18 Kidnapping suspects<br />
4.8 Denmark<br />
In 2001, Denmark provided responses to 19 of the 48 items in the 8 th survey, and to 20 of 48<br />
items in 2002. The missing items are shown in Table A. In 2001, the 329,263 calculated sum of<br />
crimes was 70% of the total 473,290 reported crimes (Item 2.1). In 2002, the 343,089 calculated<br />
sum of crime was also 70% of the total 491,026 reported crimes (Item 2.1). What categories of<br />
crime are included in the data reported in total recorded crimes (Item 2.1) that are not covered by<br />
the rest of the items in Table 2 (Items 2.2-2.18)?<br />
In the 8 th survey:<br />
(1) In general, data reported by Denmark for the 8 th survey were consistent with numbers<br />
reported from 1995 to 2000 in Tables 1 and 2 (Items 1.1-2.18).<br />
(2) Denmark submitted no data for any of the items in Tables 3 and 4 (Items 3.1-4.8) in the<br />
8 th survey. It had reported data for these items from 1990 through 2000.<br />
Table A: Non-responses 2001 2002<br />
1.1 Total police personnel X<br />
2.4 Intentional homicide committed w/ a firearm X X<br />
2.10 Major theft X X<br />
3.1 Total persons brought into initial formal contact w/ police X X<br />
3.2 Committed intentional homicide suspects X X<br />
3.3 Attempted intentional homicide suspects X X<br />
3.4 Intentional homicide committed w/ a firearm suspects X X<br />
3.5 Non-intentional homicide suspects X X<br />
3.6 Major assault suspects X X<br />
3.7 Total assault suspects X X<br />
3.8 Rape suspects X X<br />
3.9 Robbery suspects X X<br />
3.10 Major theft suspects X X<br />
3.11 Total theft suspects X X<br />
3.12 Automobile theft suspects X X<br />
3.13 Burglary suspects X X<br />
3.14 Fraud suspects X X<br />
3.15 Embezzlement suspects X X<br />
3.16 Drug-related crime suspects X X<br />
3.17 Bribery/corruption suspects X X<br />
3.18 Kidnapping suspects X X<br />
4.1 Female suspects X X<br />
4.2 Male suspects X X<br />
4.3 Adult suspects X X<br />
- 54 -
Table A: Non-responses 2001 2002<br />
4.4 Female adult suspects X X<br />
4.5 Male adult suspects X X<br />
4.6 Juvenile suspects X X<br />
4.7 Female juvenile suspects X X<br />
4.8 Male juvenile suspects X X<br />
Table B: Less than Three Years Data Available from 1995 to 2000<br />
2.17 Bribery/corruption<br />
2.18 Kidnapping<br />
3.4 Intentional homicide committed w/ a firearm suspects<br />
3.14 Fraud suspects<br />
3.17 Bribery/corruption suspects<br />
3.18 Kidnapping suspects<br />
4.9 Finland<br />
Finland reported data for 46 of the 48 items in the 8 th survey. The missing items are shown in<br />
Table A. In 2001, the 270,405 calculated sum of crimes was 52% of the 516,175 total reported<br />
crimes (Item 2.1). In 2002, the calculated sum of 273,309 was 53% of the 520,194 total reported<br />
crimes. What categories of crime are included in the data reported for total recorded crimes (Item<br />
2.1) that are not covered by the rest of the items in Table 2 (Items 2.2-2.18)?<br />
In the 8 th Survey:<br />
(1) There is significant fluctuation in the data for major thefts (Item 2.10). The number of<br />
thefts reported for 2001 (358) and 2002 (393) are far below the numbers reported for<br />
1990 to 1996 (when thefts ranged from 3,581 to 5,726), and below the 1,549 thefts<br />
reported for 2000. However, the numbers reported in 2001 and 2002 are similar to those<br />
reported in 1997, 1998, and 1999, which were 353, 312, and 559, respectively. What<br />
explains these fluctuations? Are they reflective of actual changes in thefts or are they<br />
attributable to a change in definition, reporting or other factors?<br />
(2) There is significant fluctuation in major theft suspects (Item 3.10) reported. In 2001 and<br />
2002 there were 194 and 203 theft suspects reported, respectively. The number of<br />
suspects reported in 1997 was 471; this decreased to 228 in 1998 and increased slightly to<br />
273 in 1999. The numbers for 1995, 1996, and 2000 ranged between 2,456 and 2,753.<br />
What explains these fluctuations? Are they reflective of actual changes or are they<br />
attributable to a change in definition, reporting or other factors?<br />
Table A: Non-responses 2001 2002<br />
2.4 Intentional homicide committed w/ a firearm X X<br />
3.4 Intentional homicide committed w/ a firearm suspects X X<br />
- 55 -
Table B: Less than Three Years Data Available from 1995 to 2000<br />
2.4 Intentional homicide committed w/ a firearm<br />
2.18 Kidnapping<br />
3.4 Intentional homicide committed w/ a firearm suspects<br />
3.17 Bribery/corruption suspects<br />
3.18 Kidnapping suspects<br />
4.10 Germany<br />
Germany provided responses to 36 of the 48 items in 2001 and 37 of the 48 items in 2002. The<br />
missing items are shown in Table A. In 2001, the 5,498,139 calculated sum of crimes was 86%<br />
of the 6,363,865 total reported crimes (Item 2.1). In 2002, the 5,654,543 calculated sum of crime<br />
was 87% of the 6,507,394 total reported crimes.<br />
In the 8 th survey:<br />
(1) There were 75,408 total recorded automobile thefts (Item 2.12) in 2001 and 70,617 in<br />
2002. These represented a significant decline from the number of automobile thefts<br />
reported between 1995 and 1998, when they ranged from 112,717 to 201,493. Was there<br />
an actual decrease in 2001 and 2002, or was the decrease due to a change in definition,<br />
reporting or some other factor?<br />
(2) Adult male suspects (Item 4.5) decreased by more than one million between 2000 and<br />
2001 (from 1,433,575 to 367,468), and then increased by over one million from 2001 to<br />
2002 ( 1,463,899). Were these actual changes, or were they due to an error in reporting?<br />
(3) Juvenile female suspects (Item 4.7) decreased from 163,227 in 2000 to 114,320 in 2001<br />
and then increased slightly to 117,776 in 2002. Were there actual changes in 2001 and<br />
2002, or was the decrease due to a change in definition, reporting or some other factor?<br />
Table A: Non-responses 2001 2002<br />
1.1 Total police personnel X<br />
1.2 Female police personnel X X<br />
1.3 Male police personnel X X<br />
1.4 Total police budget/financial resources X X<br />
2.6 Total recorded major assaults X X<br />
2.10 Total recorded major thefts X X<br />
2.15 Total recorded embezzlements X X<br />
3.3 Attempted intentional homicide suspects X X<br />
3.4 Intentional homicide committed with a firearm X X<br />
3.6 Major assaults suspects X X<br />
3.10 Major theft suspects X X<br />
3.15 Embezzlement suspects X X<br />
- 56 -
Table B: Less than Three Years Data Available from 1995 to 2000<br />
1.2 Female police personnel<br />
1.3 Male police personnel<br />
1.4 Total police budget/financial resources<br />
2.5 Non-intentional homicides<br />
2.6 Major assaults<br />
2.10 Major thefts<br />
2.13 Burglaries<br />
2.15 Embezzlements<br />
2.17 Total recorded bribery crimes<br />
2.18 Kidnapping<br />
3.2 Committed intentional homicide suspects<br />
3.5 Total non-intentional homicide suspects<br />
3.6 Major assault suspects<br />
3.10 Major theft suspects<br />
3.13 Burglary suspects<br />
3.15 Embezzlement suspects<br />
3.17 Bribery/corruption suspects<br />
3.18 Kidnapping suspects<br />
4.11 Hungary<br />
Hungary responded to 46 of the 48 items in the 8 th Survey. The missing items are shown in Table<br />
A. In 2001, the 302,795 calculated sum of crimes was 65% of the 465,694 total reported crimes<br />
(Item 2.1). In 2002, the calculated sum of 266,591 was 63% of the 420,782 reported crimes.<br />
What categories of crime are included in the reported total (Item 2.1) that are not covered by the<br />
rest of the items in Table 2 (Items 2.2-2.18)?<br />
In the 8 th survey:<br />
(1) The number of rape suspects (Item 3.8) increased from 372 and 332 in 1999 and 2000,<br />
respectively, to 683 in 2001 and to 691 in 2002. Is this increase reflective of an actual<br />
increase in suspects or is it attributable to a change in definition, reporting or other<br />
factors?<br />
(2) Major theft suspects (Item 3.10) decreased from 1,644 in 2000 to 502 and 480 in 2001<br />
and 2002, respectively. Is this decrease reflective of an actual decrease in suspects or is it<br />
attributable to a change in definition, reporting or other factors?<br />
(3) Total male suspects (Item 4.2) increased from 106,047 in 2000 to 140,853 in 2001 and<br />
140,452 in 2002. Is this difference reflective of an actual increase in suspects or is it<br />
attributable to a change in definition, reporting or other factors?<br />
(4) Total adult suspects (Item 4.3) increased from 111,685 in 2000 to 146,183 in 2001 and<br />
146,230 in 2002. Is this difference reflective of an actual increase in adult suspects or is<br />
it attributable to a change in definition, reporting or other factors?<br />
- 57 -
Table A: Non-responses 2001 2002<br />
1.2 Female police personnel X X<br />
1.3 Male police personnel X X<br />
Table B: Less than Three Years Data Available from 1995 to 2000<br />
2.18 Kidnapping<br />
3.4 Intentional homicide committed w/ a firearm suspects<br />
3.12 Automobile theft suspects<br />
3.18 Kidnapping suspects<br />
4.12 Iceland<br />
Iceland provided responses to 18 of the 48 items in the 8 th survey in 2001 and 20 of the 48 items<br />
in 2002. The missing items are shown in Table A. No data were reported for any of the items in<br />
Tables 3 and 4 in the 8 th survey (Items 3.1-4.8). In 2001, the 12,757 calculated sum of crimes<br />
was 24% of the 53,702 reported total crimes (Item 2.1); in 2002, the 13,510 calculated sum was<br />
22% of the total 60,242 reported crimes. What categories of crime are included in the reported<br />
total (Item 2.1) that are not covered by the rest of the crime items in Table 2 (Items 2.2-2.18)?<br />
In the 8 th survey:<br />
(1) Reported intentional homicide, completed (Item 2.2) and intentional homicide, attempted<br />
(Item 2.3) are no greater than five in any year. Is this an accurate number or is it<br />
attributable to a specific type of definition or another factor?<br />
(2) Reported bribery/corruption crimes (Item 2.17) in 2001 and 2002 were 1 and zero,<br />
respectively. Are these actual numbers or are they attributable to a specific type of<br />
definition, reporting or another factor?<br />
Table A: Missing Data 2001/2002 2001 2002<br />
1.2 Female police personnel X<br />
1.3 Male police personnel X<br />
2.10 Major theft X X<br />
2.12 Automobile theft X X<br />
3.1 Total persons brought into initial formal contact w/ police X X<br />
3.2 Committed intentional homicide suspects X X<br />
3.3 Attempted intentional homicide suspects X X<br />
3.4 Intentional homicide committed w/ a firearm suspects X X<br />
3.5 Non-intentional homicide suspects X X<br />
3.6 Major assault suspects X X<br />
3.7 Total assault suspects X X<br />
3.8 Rape suspects X X<br />
- 58 -
Table A: Missing Data 2001/2002 2001 2002<br />
3.9 Robbery suspects X X<br />
3.10 Major theft suspects X X<br />
3.11 Total theft suspects X X<br />
3.12 Automobile theft suspects X X<br />
3.13 Burglary suspects X X<br />
3.14 Fraud suspects X X<br />
3.15 Embezzlement suspects X X<br />
3.16 Drug-related crime suspects X X<br />
3.17 Bribery/corruption suspects X X<br />
3.18 Kidnapping suspects X X<br />
4.1 Female suspects X X<br />
4.2 Male suspects X X<br />
4.3 Adult suspects X X<br />
4.4 Female adult suspects X X<br />
4.5 Male adult suspects X X<br />
4.6 Juvenile suspects X X<br />
4.7 Female juvenile suspects X X<br />
4.8 Male juvenile suspects X X<br />
Table B: Less than Three Years Data Available from 1995 to 2000<br />
1.2 Female police personnel<br />
1.3 Male police personnel<br />
2.1 Total recorded crimes<br />
2.4 Intentional homicide committed w/ a firearm<br />
2.5 Non-intentional homicide<br />
2.10 Major thefts<br />
2.18 Kidnapping<br />
3.1 Total persons brought into initial formal contact w/ police<br />
3.5 Non-intentional homicide suspects<br />
3.10 Major theft suspects<br />
3.18 Kidnapping suspects<br />
4.13 Italy<br />
Italy provided responses to 31 of the 48 items in the 8 th survey. The missing items are shown in<br />
Table A. In 2001, the 1,871,755 calculated sum of crimes was 87% of the 2,163,826 total<br />
reported crimes (Item 2.1). In 2002, the 1,873,464 calculated sum of crimes was 84% of the<br />
2,231,550 total reported crimes. All of the items not reported in the 8 th survey (see Table A) were<br />
consistently not reported in earlier surveys.<br />
In the 8 th survey:<br />
(1) Total recorded non-intentional homicides (Item 2.5) were 506 in 2001 and 361 in 2002.<br />
Between 1998 and 2000, the numbers ranged between 1,501 and 1,871 and between<br />
- 59 -
1995 and 1997 they ranged between 30 and 51. What accounts for these extreme<br />
fluctuations?<br />
(2) Similar to (1) above, total non-intentional homicide suspects (Item 3.5) declined from<br />
950 in 2001 to 509 in 2002. Between 1998 and 2000, they ranged between 1,568 and<br />
1,836 and between 1995 and 1997, between 45 and 67. What accounts for these extreme<br />
fluctuations?<br />
(3) Fraud suspects (Item 3.14) increased to 42,795 in 2002 from 30,392 in 2001 and 22,368<br />
in 2000. Was this an actual increase, or was it due to a change in definition, reporting, or<br />
some other factor?<br />
Table A: Non-responses 2001 2002<br />
1.4 Total police budget/financial resources X X<br />
2.4 Total recorded intentional homicides committed – firearm X X<br />
2.6 Total recorded major assaults X X<br />
2.10 Total recorded major thefts X X<br />
2.15 Total recorded embezzlement X X<br />
2.17 Total recorded bribery crimes X X<br />
3.4 Intentional homicide with firearm – suspects X X<br />
3.6 Major assaults suspects X X<br />
3.10 Major theft suspects X X<br />
3.15 Embezzlement suspects X X<br />
3.17 Bribery/corruption suspects X X<br />
4.1 Total female suspects X X<br />
4.2 Total male suspects X X<br />
4.4 Adult female suspects X X<br />
4.5 Adult male suspects X X<br />
4.7 Juvenile male suspects X X<br />
4.8 Juvenile male suspects X X<br />
Table B: Less than Three Years Data Available from 1995 to 2000<br />
1.4 Total police budget/financial resources<br />
2.4 Intentional homicide committed w/ a firearm<br />
2.6 Major assaults<br />
2.10 Major thefts<br />
2.13 Burglaries<br />
2.15 Embezzlements<br />
2.17 Bribery/corruption<br />
2.18 Kidnapping<br />
3.4 Intentional homicide with firearm – suspects<br />
3.6 Major assaults suspects<br />
3.10 Major theft suspects<br />
3.13 Burglary suspects<br />
3.15 Embezzlement suspects<br />
- 60 -
Table B: Less than Three Years Data Available from 1995 to 2000<br />
3.17 Bribery/corruption suspects<br />
3.18 Kidnapping suspects<br />
4.1 Total female suspects<br />
4.2 Total male suspects<br />
4.4 Adult female suspects<br />
4.5 Adult male suspects<br />
4.7 Juvenile male suspects<br />
4.8 Juvenile male suspects<br />
4.14 Latvia<br />
Latvia responded to 46 of the 48 items in the 8 th survey. The missing items are shown in Table<br />
A. Latvia has submitted almost complete data sets (Items 1.1-4.8) since 1994. In 2001, the<br />
calculated sum of 50,237 crimes was 98% of the total 51,082 reported crimes. In 2002, the<br />
calculated sum of 47,957 was 97% of the total 49,329 reported crimes.<br />
In the 8 th survey:<br />
(1) The calculated sum of female police personnel (Item 1.2) and male police personnel<br />
(Item 1.3) is less than the total reported police personnel (Item 1.1) for both the 8 th survey<br />
and the 7 th survey. In 2001, the calculated sum of female and male police personnel was<br />
9,496 compared to the reported 10,644 total police personnel (Item 1.1). In 2002, the<br />
calculated sum of female and male police personnel was 9,214 compared to the 10,325<br />
total reported police personnel (Item 1.1). What accounts for total personnel being<br />
greater than the sum of male and female personnel?<br />
(2) There is a great deal of variation in fraud (Item 2.14). In 2001, 692 cases of fraud were<br />
reported; in 2002 there were 573 cases. These numbers are similar in magnitude to those<br />
reported between 1990 and 1995, when they ranged between 308 and 758. However, the<br />
numbers reported between 1996 and 1998 ranged from 1,274 to 1,328. In 1999, there<br />
were 36 reported frauds and in 2000 there were 104. What explains the large variations<br />
in magnitude?<br />
(3) Similar to (2) above, there is a great deal of variation in the number of fraud suspects<br />
(Item 3.14), ranging from 152 and 191 between 1995 and 1998, to 17 and 33 in 1999 and<br />
2000, respectively, to 215 in 2001 and 281 in 2002. What explains the large variations in<br />
magnitude?<br />
(4) There is a great deal of variation in the number of embezzlement suspects (Item 3.15). In<br />
2001, there were 183 suspects; in 2002 there were 243. Embezzlement ranged between<br />
100 and 225 from 1995 to 1998, and dropped to 20 and 36 in 1999 and 2000. What<br />
explains the large variations in magnitude?<br />
- 61 -
Table A: Non-responses 2001 2002<br />
3.3 Attempted intentional homicide suspects X X<br />
3.4 Intentional homicide committed w/ a firearm suspects X X<br />
Table B: Less than Three Years Data Available from 1995 to 2000<br />
2.18 Kidnapping<br />
3.4 Intentional homicide committed w/ a firearm suspects<br />
3.13 Burglary suspects<br />
3.18 Kidnapping suspects<br />
4.15 Lithuania<br />
Lithuania provided data for 47 of the 48 items in the 8 th survey. The one missing item is shown<br />
in Table A. In 2001, the 73,717 calculated sum of crimes was 93% of the 79,265 total reported<br />
crimes (Item 2.1). In 2002, the 65,861 calculated sum was 71% of the 92,646 total reported<br />
crimes. Why are the percentages so different for 2001 and 2002? What categories of crime are<br />
included in the total for 2002 that are not covered by the rest of the crime items in Table 2 (Items<br />
2.2-2.18)?<br />
(1) Data for 2001 and 2002 were generally consistent with data from previous years (1995-<br />
2000).<br />
Table A: Non-responses 2001 2002<br />
3.12 Automobile theft suspects X X<br />
Table B: Less than Three Years Data Available from 1995 to 2000<br />
2.7 Total assaults<br />
2.18 Kidnapping<br />
3.4 Intentional homicide committed w/ a firearm suspects<br />
3.7 Total assault suspects<br />
3.12 Automobile theft suspects<br />
3.13 Burglary suspects<br />
3.18 Kidnapping suspects<br />
4.16 Luxembourg<br />
Luxembourg provided responses to 29 of the 48 items in the 8 th Survey. The missing items are<br />
shown in Table A. In 2001, the 13,501 calculated sum of crimes was 68% of the 22,646 total<br />
reported crimes. In 2002, the 15,459 calculated sum of crimes was 59% of the 26,046 total<br />
reported crimes. Why are the percentages different for the two years? What categories of crime<br />
are included in the reported total (Item 2.1) that are not covered by the rest of the crime items in<br />
Table 2 (Items 2.2-2.18)?<br />
- 62 -
In the 8 th survey:<br />
(1) Total recorded frauds (Item 2.14) increased from 26 in 2001 to 171 in 2002. Was this an<br />
actual increase, or was it due to a change in definition, reporting, or some other factor?<br />
Table A: Non-responses 2001 2002<br />
2.10 Total recorded major thefts X X<br />
3.1-3.18 No data reported X X<br />
Table B: Less than Three Years Data Available from 1995 to 2000<br />
All items in Tables 1-4<br />
4.17 Malta<br />
Malta provided responses to 30 of the 48 items in 2001 and 31 of 48 items in 2002. The missing<br />
items are shown in Table A. In 2001, the 10,956 calculated sum of crimes was 69% of the 15,929<br />
total reported crimes (Item 2.1). In 2002, the 11,595 calculated sum was 68% of the 17,023 total<br />
reported crimes. What categories of crime are included in the total for 2002 that are not covered<br />
by the rest of the items in Table 2 (Items 2.2-2.18)?<br />
In the 8 th survey:<br />
(1) Committed intentional homicide suspects (Item 3.2) increased from 2 in 2001 to 18 in<br />
2002. Was this an actual increase, or was it due to a change in definition, reporting, or<br />
some other factor?<br />
Table A: Non-responses 2001 2002<br />
2.4 Intentional homicides committed w/ a firearm X X<br />
2.5 Total recorded non-intentional homicides X<br />
2.9 Total recorded robberies X X<br />
2.10 Total recorded major thefts X X<br />
2.13 Total recorded burglaries X X<br />
2.15 Total recorded embezzlements X X<br />
2.17 Total recorded bribery crimes X X<br />
2.18 Kidnapping X X<br />
3.4 Intentional homicide committed with a firearm X X<br />
3.5 Total non-intentional homicide suspects X X<br />
3.6 Major assaults suspects X X<br />
3.8 Rape suspects X X<br />
3.9 Robbery suspects X X<br />
3.10 Major theft suspects X X<br />
3.13 Burglary suspects X X<br />
3.15 Embezzlement suspects X X<br />
3.17 Bribery/corruption suspects X X<br />
3.18 Kidnapping X X<br />
- 63 -
Table B: Less than Three Years Data from 1995-2000<br />
All items in Tables 1-4<br />
4.18 Republic of Moldova<br />
The Republic of Moldova responded to 44 of the 48 items in the 8 th survey. The missing items<br />
are shown in Table A. In 2001, the 30,981 calculated sum of crimes was 82% of the 37,830 total<br />
reported crimes (Item 2.1). In 2002, the 28,115 calculated sum was 77% of the 36,302 total<br />
reported crimes. Why are the 2001 and 2002 percentages different? What categories of crime<br />
are included in the number reported in total recorded crimes (Item 2.1) that are not covered by<br />
the rest of the items in Table 2 (Items 2.2-2.18)?<br />
In the 8 th survey:<br />
(1) For total police personnel (Item 1.1), female police personnel (Item 1.2), and male police<br />
personnel (Item 1.3), the numbers are identical for 2000 and 2001. Is this correct?<br />
(2) For automobile theft suspects (Item 3.12) reported values for 2001 and 2002 are about<br />
half the reported numbers for 1995-2000. Automobile theft suspects decreased from a<br />
range of 198-364 in 1995-2000 to 83 in 2001 and 102 in 2002. Is this decrease reflective<br />
of an actual change in number or is it attributable to a change in definition, reporting or<br />
other factors?<br />
(3) Burglary suspects (Item 3.13) declined from a range of 970 to 1,236 from 1995 to 2000 to<br />
586 in 2001 and 504 in 2002. Is this decrease reflective of an actual change in number or<br />
is it attributable to a change in definition, reporting or other factors?<br />
Table A: Non-responses 2001 2002<br />
2.15 Embezzlement X X<br />
2.18 Kidnapping X X<br />
3.15 Embezzlement suspects X X<br />
3.18 Kidnapping suspects X X<br />
Table B: Less than Three Years Data Available from 1995 to 2000<br />
2.18 Kidnapping<br />
3.18 Kidnapping suspects<br />
4.19 Netherlands<br />
The Netherlands provided responses to 35 of the 48 items in the 8 th Survey. The missing items<br />
are shown in Table A. In 2001, the 1,000,750 calculated sum of the crimes was 74% of the<br />
1,357,617 total reported crimes (Item 2.1). In 2002, the 1,034,332 calculated sum of crime was<br />
- 64 -
73% of the 1,422,863 total reported crimes. What categories of crime are included in the total<br />
for 2002 that are not covered by the rest of the items in Table 2?<br />
In the 8 th survey:<br />
(1) Data for the 8 th survey are generally consistent with data from earlier years.<br />
Table A: Non-responses 2001 2002<br />
1.4 Total police budget/financial resources X X<br />
2.4 Total recorded intentional homicide with a firearm X X<br />
2.5 Total recorded non-intentional homicides X X<br />
2.6 Total recorded major assaults X X<br />
2.10 Total recorded major thefts X X<br />
2.17 Total recorded bribery crimes X X<br />
2.18 Kidnapping X X<br />
3.4 Intentional homicide committed with a firearm X X<br />
3.5 Total non-intentional homicide suspects X X<br />
3.6 Major assault suspects X X<br />
3.10 Major theft suspects X X<br />
3.17 Bribery/corruption suspects X X<br />
3.18 Kidnapping suspects X X<br />
Table B: Less than Three Years Data Available from 1995 to 2000<br />
1.4 Total police budget/financial resources<br />
2.4 Total recorded intentional homicide with a firearm<br />
2.5 Total recorded non-intentional homicides<br />
2.6 Total recorded major assaults<br />
2.10 Total recorded major thefts<br />
2.17 Total recorded bribery crimes<br />
2.18 Kidnapping<br />
3.4 Intentional homicide committed with a firearm<br />
3.5 Total non-intentional homicide suspects<br />
3.6 Major assault suspects<br />
3.10 Major theft suspects<br />
3.17 Bribery/corruption suspects<br />
3.18 Kidnapping suspects<br />
4.20 Poland<br />
Poland responded to 42 of the 48 items in the 8 th survey. The missing items are shown in<br />
Table A. In 2001, the 849,481 calculated sum of crimes was 61% of the 1,390,089 total reported<br />
crimes (Item 2.1). In 2002, the 835,548 calculated sum was 60% of the 1,404,229 total reported<br />
crimes. What categories of crime are included in the number reported in total recorded crimes<br />
(Item 2.1) that are not covered by the rest of the items in Table 2 (Items 2.2-2.18)?<br />
- 65 -
In the 8 th survey:<br />
(1) Numbers reported for intentional homicides, committed (Item 2.2) show a great deal of<br />
fluctuation. They were 776 in 2001 and 716 in 2002 compared with 1,869, 1,820, and<br />
2,170 for 1998, 1999, and 2000 respectively. The numbers reported for 1995 to 1997<br />
(853, 873, and 807) are more similar in magnitude to those in 2001 and 2002. What<br />
explains the variation in magnitude?<br />
(2) Reported bribery/corruption suspects (Item 3.17) of 1,135 in 2001 and 1,360 in 2002<br />
were far greater than the 491 reported in 1999 and the 675 reported in 2000. Is this<br />
difference reflective of an actual change in number or is it attributable to a change in<br />
definition, reporting or other factors?<br />
Table A: Non-responses 2001 2002<br />
2.15 Embezzlement X X<br />
3.2 Committed intentional homicide suspects X X<br />
3.3 Attempted intentional homicide suspects X X<br />
3.4 Intentional homicide committed w/ a firearm suspects X X<br />
3.10 Major theft suspects X X<br />
3.15 Embezzlement suspects X X<br />
Table B: Less than Three Years Data Available from 1995 to 2000<br />
2.15 Embezzlement<br />
2.18 Kidnapping<br />
3.3 Attempted intentional homicide suspects<br />
3.4 Intentional homicide committed w/ a firearm suspects<br />
3.15 Embezzlement suspects<br />
3.18 Kidnapping suspects<br />
4.21 Portugal<br />
Portugal provided responses to 41 of the 48 items in the 8 th survey. The missing items are shown<br />
in Table A. In 2001, the 237,416 calculated sum of crimes was 109% of the 218,353 total<br />
reported crimes (Item 2.1). In 2002, the 251,888 calculated sum of crime was 115% of the<br />
218,360 total reported crimes. Data should be checked to determine the source of this<br />
discrepancy for both 8 th survey years.<br />
In the 8 th survey:<br />
(1) In 2002, total recorded thefts (Item 2.11) were 147,958 or 12,000 more than the 35,079<br />
reported in 2001 and a substantial increase over the 90,377 reported in 2000. Do the 2001<br />
and 2002 numbers represent actual increases, or were the differences due to due to a<br />
change in definition, reporting, or some other factor?<br />
- 66 -
(2) Total assault suspects (Item 3.7) declined from 46,706 in 1999 to 27,371 in 2001 and<br />
28,925 in 2002. Were these actual declines, or were they due to a change in definition,<br />
reporting, or some other factor?<br />
(3) Burglary suspects (Item 3.13) were 5,475 and 5,021 in 2001 and 2002, respectively.<br />
These numbers are half of the 10,802 reported in 2000. Do they reflect an actual<br />
decrease, or was the decline due to a change in definition, reporting, or some other<br />
factor?<br />
Comments that Portugal included on their survey form were as follows:<br />
"Table 1: data available does not include the PJ-Judiciary Police, but only PSP-Policia de<br />
Seguranga Publica e GNR- Guarda Nacional Republica." For Table 2, Table 3 and Table 4, the<br />
Source (s) of data provided is given as "PJ- Judiciary Police, Policia de Seguranga Publica, and<br />
Guarda Nacional Republica." It is not clear whether Table 1 is missing the PJ-Judiciary Police<br />
while the rest of the tables have them included. Could this be an explanation for the problems in<br />
Table 1 and the apparent crime decline in many categories?<br />
Table A: Non-responses 2001 2002<br />
2.2 Total recorded intentional homicide, completed X X<br />
2.10 Total recorded major thefts X X<br />
3.10<br />
4.4<br />
Major theft suspects<br />
Adult female suspects<br />
X<br />
X<br />
X<br />
X<br />
4.5 Adult male suspects X X<br />
4.7 Juvenile female suspects X X<br />
4.8 Juvenile male suspects X X<br />
Table B: Less than Three Years Data Available from 1995 to 2000<br />
2.3 Total recorded intentional homicide, attempted<br />
2.10 Major thefts<br />
2.18 Kidnapping<br />
3.3 Attempted intentional homicide suspects<br />
3.4 Intentional homicide committed with a firearm suspects<br />
3.10 Major theft suspects<br />
3.18 Kidnapping suspects<br />
4.4 Adult female suspects<br />
4.5 Adult male suspects<br />
4.7 Juvenile female suspects<br />
4.8 Juvenile male suspects<br />
4.22 Romania<br />
Romania responded to 37 of the 48 items in the 8 th survey. The missing items are shown in<br />
Table A. In 2001, the 170,625 calculated sum of crimes was 50% of the 340,414 total reported<br />
- 67 -
crimes (Item 2.1). In 2002, the 133,754 calculated sum was 43% of the 312,204 total reported<br />
crimes. Why do the percentages differ by almost ten percentage points between 2001 and 2002?<br />
What categories of crime are included in the value reported in total recorded crimes (Item 2.1)<br />
that are not covered by the rest of the items in Table 2 (Items 2.2-2.18)?<br />
In the 8 th survey:<br />
(1) For automobile thefts (Item 2.12), the 1,876 reported for 2001 and the 1,227 reported for<br />
2002 are less than half the 4,219 and 4,546 thefts reported for 1999 and 2000,<br />
respectively. Is this difference reflective of an actual change in number or is it<br />
attributable to a change in definition, reporting or other factors?<br />
(2) Embezzlements (Item 2.15) increased from 47 in 2000 to 4,252 in 2001 and 3,181 in<br />
2002. Embezzlement suspects (Item 3.15) also showed an increase from 12 in 2000 to<br />
3,416 in 2001 and 2,820 in 2002. Are these differences related and are they reflective of<br />
actual changes in number, or are they attributable to changes in definition, reporting or<br />
other factors?<br />
Table A: Non-responses 2001 2002<br />
1.4 Total police budget/financial resources X X<br />
2.4 Intentional homicide committed w/ a firearm X X<br />
2.5 Non-intentional homicide X X<br />
2.10 Major theft X X<br />
3.4 Intentional homicide committed w/ a firearm suspects X X<br />
3.5 Non-intentional homicide suspects X X<br />
3.10 Major theft suspects X X<br />
4.4 Female adult suspects X X<br />
4.5 Male adult suspects X X<br />
4.7 Female juvenile suspects X X<br />
4.8 Male juvenile suspects X X<br />
Table B: Less than Three Years Data Available from 1995 to 2000<br />
2.4 Intentional homicide committed w/ a firearm<br />
2.10 Major theft<br />
2.18 Kidnapping<br />
3.4 Intentional homicide committed w/ a firearm suspects<br />
3.10 Major theft suspects<br />
3.18 Kidnapping suspects<br />
4.23 Slovakia<br />
Slovakia provided responses for 45 of the 48 items in the 8 th survey. The missing items are<br />
shown in Table A. In 2001, the 63,022 calculated sum of crimes was 68% of the 93,053 total<br />
reported crimes (Item 2.1). In 2002, the 71,924 calculated sum was 67% of the 107,373 total<br />
- 68 -
eported crimes. What categories of crime are included in the value reported in Item 2.1 that are<br />
not covered by the rest of the items in Table 2 (Items 2.2-2.18)?<br />
Although Slovakia has provided data for almost all the survey items (1.1-4.8) for 2001 and 2002,<br />
trend analysis was not possible for survey items 3.1-4.8 because no data are available for any of<br />
these items from 1995 to 2000.<br />
In the 8 th survey:<br />
(1) Intentional homicides committed with a firearm (Item 2.4) were reported at 2,285 in 2001<br />
and 2,356 in 2002. Between 1997 and 2000, the reported numbers ranged between 109<br />
and 117. Is this more than ten-fold increase reflective of an actual change in number or is<br />
it attributable to a change in definition, reporting or other factors?<br />
Table A: Non-responses 2001 2002<br />
2.3 Attempted intentional homicide X X<br />
2.5 Non-intentional homicide X X<br />
3.3 Attempted intentional homicide suspects X X<br />
Table B: Less than Three Years Data Available from 1995 to 2000<br />
2.5 Non-intentional homicide<br />
2.6 Major assault<br />
2.10 Major theft<br />
2.18 Kidnapping<br />
3.1 Total persons brought into initial formal contact w/ police<br />
3.2 Committed intentional homicide suspects<br />
3.3 Attempted intentional homicide suspects<br />
3.4 Intentional homicide committed w/ a firearm suspects<br />
3.5 Non-intentional homicide suspects<br />
3.6 Major assault suspects<br />
3.7 Total assault suspects<br />
3.8 Rape suspects<br />
3.9 Robbery suspects<br />
3.10 Major theft suspects<br />
3.11 Total theft suspects<br />
3.12 Automobile theft suspects<br />
3.13 Burglary suspects<br />
3.14 Fraud suspects<br />
3.15 Embezzlement suspects<br />
3.16 Drug-related crime suspects<br />
3.17 Bribery/corruption suspects<br />
3.18 Kidnapping suspects<br />
4.1 Female suspects<br />
4.2 Male suspects<br />
4.3 Adult suspects<br />
4.4 Female adult suspects<br />
- 69 -
Table B: Less than Three Years Data Available from 1995 to 2000<br />
4.5 Male adult suspects<br />
4.6 Juvenile suspects<br />
4.7 Female juvenile suspects<br />
4.8 Male juvenile suspects<br />
4.24 Slovenia<br />
Slovenia provided responses to all of the 48 items in the 8 th Survey. In 2001, the 58,021<br />
calculated sum of crimes was 72% of the 80,059 total reported crimes (Item 2.1). In 2002, the<br />
59,850 calculated sum of crimes was 73% of the 81,697 total reported crimes. What categories<br />
of crime are included in the number reported for total recorded crimes (Item 2.1) that are not<br />
covered by the rest of the items in Table 2 (Item 2.2 – 2.18)?<br />
In the 8 th Survey:<br />
(1) The total recorded crimes (Item 2.1) jumped from 38,178 in 1995 to 80,059 in 2001 and<br />
to 81,697 in 2002. Was this an actual increase or was it due to a change in definition,<br />
reporting, or some other factor?<br />
(2) Total recorded non-intentional homicides (Item 2.5) increased from zero occurrences in<br />
1999 and 2000, to 43 and 40 in 2001 and 2002, respectively. The totals recorded between<br />
1995 and 1998 ranged from 1 to 3. Were the 2001 and 2002 increases representative of<br />
an actual change, or were they due to a change in definition, reporting, or some other<br />
factor?<br />
(3) Total recorded major assaults (Item 2.6) ranged from 763 and 973 between 1995 and<br />
2000. They declined to 404 and 378 in 2001 and 2002, respectively. Did this represent an<br />
actual decrease or was it due to a change in definition, reporting, or some other factor?<br />
(4) Total recorded drug offenses (Item 2.16) increased from 939 in 2000 to 5,792 in 2001<br />
and 5,583 in 2002. Was this an actual increase, or was it due to a change in definition,<br />
reporting, or some other factor?<br />
(5) Between 1995 and 2000, the total of all persons brought into initial formal contact (Item<br />
3.1) ranged from 14,550 to 18,676. The number increased in 2001 and 2002 to 42,118<br />
and 42,092, respectively. Was this an actual increase, or was it due to a change in<br />
definition, reporting, or some other factor?<br />
Table A: Non-responses 2001 2002<br />
Data are available for all items.<br />
Table B: Less than Three Years Data Available from 1995 to 2000<br />
2.18 Kidnapping<br />
3.18 Kidnapping suspects<br />
- 70 -
4.25 Sweden<br />
Sweden provided responses for 36 of the 48 items in the 8 th survey. The missing items are<br />
shown in Table A. In 2001, the 985,576 calculated sum of crimes was 83% of the 1,189,393 total<br />
reported crimes (Item 2.1). In 2002, the 1,019,497 calculated sum was also 83% of the<br />
1,234,784 reported crimes. Sweden has consistently provided no responses for major thefts<br />
(Item 2.10), bribery/corruption (Item 2.17), kidnappings (Item 2.18), major theft suspects (Item<br />
3.10), bribery/corruption suspects (Item 3.17), and kidnapping suspects (Item 3.18).<br />
In the 8 th survey:<br />
(1) For total non-intentional homicide suspects (Item 3.5), the reported numbers for 2000 to<br />
2002 were 115, 112, and 127, respectively. This was a substantial increase over the 1995<br />
to1997 numbers that ranged between 21 and 32. Is this increase reflective of an actual<br />
change in number or is it attributable to a change in definition, reporting or other factors?<br />
Table A: Non-responses 2001 2002<br />
2.6 Major assault X X<br />
2.10 Major theft X X<br />
2.17 Bribery/corruption X X<br />
2.18 Kidnapping X X<br />
3.6 Major assault suspects X X<br />
3.10 Major theft suspects X X<br />
3.17 Bribery/corruption suspects X X<br />
3.18 Kidnapping suspects X X<br />
4.4 Female adult suspects X X<br />
4.5 Male adult suspects X X<br />
4.7 Female juvenile suspects X X<br />
4.8 Male juvenile suspects X X<br />
Table B: Less than Three Years Data Available from 1995 to 2000<br />
2.10 Major theft<br />
2.17 Bribery/corruption<br />
2.18 Kidnapping<br />
3.10 Major theft suspects<br />
3.17 Bribery/corruption suspects<br />
3.18 Kidnapping suspects<br />
4.26 Switzerland<br />
Switzerland provided responses to 16 of the 48 items in the 8 th survey. The missing items are<br />
shown in Table A. In 2001, the 310,699 calculated sum of crimes was 113% of the 275,591 total<br />
- 71 -
eported crimes (Item 2.1). In 2002, the 343,569 calculated sum of crimes was 112% of the<br />
307,631 total reported crimes. Data in both years should be reviewed to determine why the<br />
calculated sum of crime is greater than the reported total.<br />
In the 8 th survey:<br />
(1) Total police budget/financial resources (Item 1.4) decreased dramatically from 117,697<br />
“units” in 1999 (last reported year before the 8 th survey) to 3,104 “units” in 2001 and<br />
3,179 in 2002. Was this an actual decrease, or was it due to a change in monetary units<br />
used in the report, definition, reporting, or some other factor?<br />
(2) Total recorded automobile thefts (Item 2.12) increased dramatically from 9,349 in 2000<br />
(which was consistent with data reported in earlier years), to 64,241 in 2001 and 65,571<br />
in 2002. Was this an actual increase, or was it due to a change in definition, reporting, or<br />
some other factor?<br />
Table A: Non-responses 2001 2002<br />
1.2 Female police personnel X X<br />
1.3 Male police personnel X X<br />
2.5 Total recorded non-intentional homicide X X<br />
2.6 Total recorded major assaults X X<br />
2.10 Total recorded major thefts X X<br />
2.17 Total recorded bribery crimes X X<br />
3.1-3.18 All items X X<br />
4.1-4.8 All items X X<br />
Table B: Less than Three Years Data Available from 1995 to 2000<br />
1.2 Female police personnel<br />
1.3 Male police personnel<br />
2.5 Non-intentional homicides<br />
2.7 Total assaults<br />
2.10 Major thefts<br />
2.11 Total thefts<br />
2.17 Bribery/corruption<br />
2.18 Kidnapping<br />
3.1-3.18 All items<br />
4.1-4.8 All items<br />
4.27 Turkey<br />
Turkey responded to 11 of the 48 items in the 8 th survey. The missing items are shown in<br />
Table A. No data were submitted for any of the items in Tables 1, 2 and 4 (Items 1.1-1.4, 2.1-<br />
2.18, and 4.1-4.8) in the 8 th survey.<br />
- 72 -
In the 8 th survey:<br />
(1) Total assault suspects (Item 3.7) decreased from 92,002 and 96,364 in 1999 and 2000,<br />
respectively, to 26,456 in 2001 and 25,854 in 2002. Is this decrease reflective of an<br />
actual change in number or is it attributable to a change in definition, reporting or other<br />
factors?<br />
(2) Total theft suspects (Item 3.11) averaged 46,722 from 1995 to 2000, then fell to 13,149<br />
in 2001 and then increased almost ten-fold to 124,362 in 2002. What explains these<br />
changes in magnitude?<br />
Table A: Non-responses 2001 2002<br />
1.1 Total police personnel X X<br />
1.2 Female police personnel X X<br />
1.3 Male police personnel X X<br />
1.4 Total police budget X X<br />
2.1 Total recorded crimes X X<br />
2.2 Intentional homicide, committed X X<br />
2.3 Intentional homicide, attempted X X<br />
2.4 Intentional homicide committed w/ a firearm X X<br />
2.5 Non-intentional homicide X X<br />
2.6 Major assault X X<br />
2.7 Total assault X X<br />
2.8 Rape X X<br />
2.9 Robbery X X<br />
2.10 Major theft X X<br />
2.11 Total theft X X<br />
2.12 Automobile theft X X<br />
2.13 Burglary X X<br />
2.14 Fraud X X<br />
2.15 Embezzlement X X<br />
2.16 Drug-related crimes X X<br />
2.17 Bribery/corruption X X<br />
2.18 Kidnapping X X<br />
3.3 Attempted intentional homicide suspects X X<br />
3.4 Intentional homicide committed w/ a firearm suspects X X<br />
3.5 Non-intentional homicide suspects X X<br />
3.9 Robbery suspects X X<br />
3.12 Automobile theft suspects X X<br />
3.14 Fraud suspects X X<br />
3.16 Drug-related crime suspects X X<br />
4.1 Female suspects X X<br />
4.2 Male suspects X X<br />
4.3 Adult suspects X X<br />
4.4 Female adult suspects X X<br />
- 73 -
Table A: Non-responses 2001 2002<br />
4.5 Male adult suspects X X<br />
4.6 Juvenile suspects X X<br />
4.7 Female juvenile suspects X X<br />
4.8 Male juvenile suspects X X<br />
Table B: Less than Three Years Data Available from 1995-2000<br />
2.2 Intentional homicide, committed<br />
2.3 Intentional homicide, attempted<br />
2.4 Intentional homicide committed w/ a firearm<br />
2.6 Major assault<br />
2.10 Major theft<br />
2.13 Burglaries<br />
2.15 Embezzlement<br />
2.18 Kidnappings<br />
3.2 Committed intentional homicide suspects<br />
3.3 Intentional homicide, attempted – suspects<br />
3.4 Intentional homicide committed w/ a firearm suspects<br />
3.6 Major assault suspects<br />
3.10 Major theft suspects<br />
3.13 Burglary suspects<br />
3.15 Embezzlement suspects<br />
3.18 Kidnapping suspects<br />
4.3 Adult suspects<br />
4.4 Female adult suspects<br />
4.5 Male adult suspects<br />
4.6 Juvenile suspects<br />
4.7 Female juvenile suspects<br />
4.8 Male juvenile suspects<br />
4.28 United Kingdom<br />
The United Kingdom (UK) is comprised of three constituent parts: England & Wales, Scotland,<br />
and Northern Ireland. Separate analysis is presented below for each of these component parts,<br />
rather than for the UK as a whole. 2 All data are for the fiscal rather than calendar year.<br />
2 It is not possible to estimate police statistics for the UK from police statistics for its independent components. The<br />
legal systems in Scotland and in England & Wales have their basis in two different traditions. The Scottish system is<br />
based on Roman Law and the system in England & Wales on Common Law. Unification of the legal systems of<br />
Scotland and England & Wales was excluded when the Union of two Parliaments was agreed to in 1706. Since then,<br />
the criminal justice systems have remained independent through different court system and the unique role of the<br />
Procurator Fiscal in Scotland. There are more similarities between England & Wales and Northern Ireland since<br />
both are Common Law based; however differences still exist, particularly in the way court cases are handled. This<br />
difference also extends to both the method of recording statistical information pertaining to the criminal justice<br />
system and the range of information collected.<br />
- 74 -
4.28a England & Wales<br />
England & Wales provided responses to 19 of the 48 items in the 8 th survey for 2001 and 18 of<br />
the 48 items for 2002. The missing items are shown in Table A. In 2001, the 4,554,226<br />
calculated sum of crimes was 82% of the 5,525,316 total reported crimes (Item 2.1). In 2002, the<br />
4,827,146 calculated sum of crimes was also 82% of the 5,899,450 total reported number of<br />
crimes. What categories of crime are included in the number reported for total recorded crimes<br />
(Item 2.1) that are not covered by the rest of the items in Table 2 (Items 2.2-2.18)?<br />
In the 8 th Survey:<br />
(1) No data were reported for any of the items in Tables 3 and 4 (Items 3.1-3.18 and 4.1-<br />
4.8).<br />
(2) Since data were only reported for 2001 and 2002, no trend analysis was undertaken. Data<br />
reported for 2002 appear to be consistent with data reported for 2001.<br />
Table A: Non-Responses 2001 2002<br />
1.4 Total police budget X X<br />
2.4 Intentional homicide committed with a firearm X<br />
2.5 Non-intentional homicide X X<br />
2.10 Major theft X X<br />
3.1-3.18 All items in Table 3 X X<br />
4.1-4.8 All items in Table 4 X X<br />
Table B: Less than Three Years Data Available from 1995 to 2000<br />
No data available prior to 2001.<br />
4.28b Northern Ireland<br />
Northern Ireland provided responses to 33 of the 48 items in the 8 th survey. The 15 missing<br />
items are shown in Table A. In 2001, the 92,823 calculated sum of crimes was 66% of the<br />
139,786 total reported crimes (Item 2.1). In 2002, the 96,879 calculated sum of crime was 68%<br />
of the 142,496 total reported number of crimes. What categories of crime are included in the<br />
total that are not covered by the rest of the items in Table 2 (Items 2.2-2.18)?<br />
In the 8 th Survey:<br />
1) No data were reported for any of the items in Table 4 (Items 4.1-4.8).<br />
2) The reported number of major assault suspects (Item 3.6) almost doubled between 2001<br />
to 2002, increasing from 236 to 432. Is this increase reflective of an actual change in<br />
number or is it attributable to a change in definition, reporting, or other factors?<br />
- 75 -
Table A: Non-Responses 2001 2002<br />
1.4 Total police budget X X<br />
2.10 Major theft X X<br />
2.15 Embezzlement X X<br />
2.17 Bribery/corruption crimes X X<br />
3.10 Major theft suspects X X<br />
3.15 Embezzlement suspects X X<br />
3.17 Bribery/corruption suspects X X<br />
4.1-4.8 All items in Table 4 X X<br />
Table B: Less than Three Years Data Available from 1995 to 2000<br />
No data available prior to 2001.<br />
4.28c Scotland<br />
Scotland provided responses to 19 of the 48 items in the 8 th survey. The missing items are<br />
shown in Table A. In 2001, the 341,233 calculated sum of crimes was 72% of the 475,963 total<br />
reported crimes (Item 2.1). In 2002, the 342,344 calculated sum of crimes was 71% of the<br />
481,760 total reported number of crimes. What categories of crime are included in the number<br />
reported for total recorded crimes (Item 2.1) that are not covered by the rest of the items in Table<br />
2 (Items 2.2-2.18)?<br />
In the 8 th Survey:<br />
(1) No data were reported for any of the items in Tables 3 and 4 (Items 3.1-3.18 and 4.1-4.8).<br />
(3) Since data were only reported for 2001 and 2002, no trend analysis was undertaken. Data<br />
reported for 2002 appear to be consistent with data reported for 2001.<br />
Table A: Non-Responses 2001 2002<br />
2.4 Intentional homicide committed with a firearm X X<br />
2.10 Major theft X X<br />
2.18 Kidnapping X X<br />
3.1-3.18 All items in Table 3 X X<br />
4.1-4.8 All items in Table 4 X X<br />
Table B: Less than Three Years Data Available from 1995 to 2000<br />
No data available prior to 2001.<br />
- 76 -
Europe Summary Table: UN Members Responding to Crime Surveys Covering 1990-2002<br />
Country<br />
5 th Survey 6 th Survey 7 th Survey 8 th Survey<br />
1990 1991 1992 1993 1994 1995 1996 1997 1998 1999 2000 2001 2002<br />
East Europe Belarus X X X X X X X X X X X X X<br />
Moldova, Rep. X X X X X X X X X X X X X<br />
Russian Federation X X X X X X X X X X X<br />
Ukraine X X X X X X X X X X X<br />
Southeast Europe Albania X X X X X<br />
Bosnia &<br />
Herzegovina<br />
Bulgaria X X X X X X X X X X X<br />
Croatia X X X X X X X X X X<br />
Macedonia, FYR X X X X X X X X<br />
Romania X X X X X X X X X X X X X<br />
Serbia & Montenegro X X X X X<br />
Turkey X X X X X X X X X X X X X<br />
West and Central Andorra X X X<br />
Europe Austria X X X X X X X<br />
Belgium X X X X X X X<br />
Cyprus X X X X X X X X X X<br />
Czech Rep. X X X X X X X X X<br />
Denmark X X X X X X X X X X X X X<br />
Estonia X X X X X X X X X X X<br />
Finland X X X X X X X X X X X X X<br />
France X X X X X X X X<br />
Germany X X X X X X X X X<br />
Greece X X X X X X X X X X X<br />
Hungary X X X X X X X X X X X X X<br />
Iceland X X X X X X X X<br />
Italy X X X X X X X X X X X X X<br />
Latvia X X X X X X X X X X X X X<br />
Liechtenstein X X<br />
Lithuania X X X X X X X X X X X X X<br />
Luxembourg X X X X X X X<br />
Malta X X X X X X X<br />
Monaco<br />
Netherlands X X X X X X X X X X<br />
Norway X X X X X X X X X X X<br />
Poland X X X X X X X X X X X X X<br />
Portugal X X X X X X X X X<br />
San Marino<br />
- 77 -
Europe Summary Table: UN Members Responding to Crime Surveys Covering 1990-2002<br />
(cont’d)<br />
Country<br />
5 th Survey 6 th Survey 7 th Survey 8 th Survey<br />
1990 1991 1992 1993 1994 1995 1996 1997 1998 1999 2000 2001 2002<br />
West and Central Slovakia X X X X X X X X X X X X X<br />
Europe (cont’d) Slovenia X X X X X X X X X X X X X<br />
Spain X X X X X X X X X X X<br />
Sweden X X X X X X X X X X X X X<br />
Switzerland X X X X X X X X X X X X X<br />
United Kingdom X X<br />
- 78 -
5.0: VALIDATION <strong>OF</strong> RESPONSES TO TABLES 1-4<br />
LATIN AMERICA<br />
- 79 -
5.0 Latin America<br />
Ten (31%) of the 32 UN member nations from the Caribbean, Central America and South<br />
America (together referred to as Latin America in this report) were included on the UNODC list<br />
of 66 respondents to the 8 th survey. Ecuador, one of the countries on the list, is not included in<br />
the John Jay analysis since no electronic or paper form was received by us for this country. No<br />
country from the Caribbean responded to the 8 th survey. A few countries, such as Barbados and<br />
the Bahamas, who had responded to past surveys, did not respond to the 8 th survey. In general, as<br />
the summary table at the end of this section shows, most Caribbean, Central American and South<br />
American countries have not historically responded to UN crime data surveys.<br />
5.1 Argentina<br />
Argentina responded to 10 of the 48 items in the 8 th survey. The missing items are shown in<br />
Table A. In 2001, the 909,880 calculated sum of crimes was 77% of the 1,178,530 total reported<br />
crimes (Item 2.1). In 2002, the 1,069,216 calculated sum was 91% of the 1,178,530 reported<br />
crimes. What accounts for the different percentages in 2001 and 2002? What categories of crime<br />
are included in the total crime number reported for 2001 (Item 2.1) that are not covered by the<br />
rest of the items in Table 2 (Items 2.2 – 2.18)?<br />
In the 8 th survey:<br />
(1) The 1,178,530 total reported crimes for 2001 (Item 2.1) is identical to the total<br />
reported crimes in 2002. Is this correct?<br />
Table A: Non-responses 2001 2002<br />
1.1-1.4 Table 1 – all items X X<br />
2.4 Crimes Committed w/ a Firearm X X<br />
2.10 Major thefts X X<br />
2.12 Total recorded automobile theft X X<br />
2.13 Total recorded burglaries X X<br />
2.14 Total recorded frauds X X<br />
2.15 Embezzlement X X<br />
2.17 Total recorded bribery crimes X X<br />
2.18 Kidnapping X X<br />
3.1-3.18 Table 3 – all items X X<br />
4.1-4.8 Table 4 – all items X X<br />
Table B: Less than Three Years Data Available from 1995 to 2000<br />
All items except total recorded crimes (Item 2.1), intentional committed<br />
homicides (Item 2.2), drug related crimes (Item 2.16), all persons<br />
brought into initial formal contact with the police (Item 3.1), committed<br />
intentional homicide suspects (Item 3.2), drug-related crime suspects<br />
(Item 3.16), and all of Table 4 (Items 4.1-4.8)<br />
- 80 -
5.2 Bolivia<br />
Bolivia submitted data for 24 of 48 items in the 8 th survey. The missing items are shown in Table<br />
A. The 32,833 calculated sum of crimes in 2001 was 87% of the 37,553 crimes reported (Item<br />
2.1). In 2002 the 32,058 calculated sum exceeded the 31,138 reported total (103%). Why were<br />
the percentages for 2001 and 2002 different and why was the calculated sum of crimes in 2002<br />
greater than the reported total?<br />
In the 8 th survey:<br />
(1) Embezzlements (Item 2.15) decreased from 133 in 2001 to 4 in 2002. Is this reduction<br />
reflective of an actual change in the number or is it attributable to a change in<br />
definition, reporting or other factors?<br />
Table A: Non-responses 2001 2002<br />
2.5 Total recorded non-intentional homicide X X<br />
2.6 Major assault X X<br />
2.10 Total recorded major thefts X X<br />
3.2 Committed intentional homicide suspects X X<br />
3.3 Attempted intentional homicide suspects X X<br />
3.4 Intentional homicide committed w/ a firearm suspects X X<br />
3.5 Non-intentional homicide suspects X X<br />
3.6 Major assault suspects X X<br />
3.7 Total assault suspects X X<br />
3.8 Rape suspects X X<br />
3.9 Robbery suspects X X<br />
3.10 Major theft suspects X X<br />
3.11 Total theft suspects X X<br />
3.13 Burglary suspects X X<br />
3.14 Fraud crime suspects X X<br />
3.15 Embezzlement suspects X X<br />
3.17 Bribery/corruption suspects X X<br />
3.18 Kidnapping suspects X X<br />
4.3 Adult suspects X X<br />
4.4 Female suspects X X<br />
4.5 Male suspects X X<br />
4.6 Juvenile suspects X X<br />
4.7 Female juvenile suspects X X<br />
4.8 Male juvenile suspects X X<br />
Table B: Less than Three Years Data Available for 1995 to 2000<br />
All items in Tables 1-4<br />
- 81 -
5.3 Chile<br />
Chile responded to 38 of the 48 items in the 8 th survey. Items not reported are shown in Table A.<br />
The 128,998 calculated sum of crimes in 2001 was 23% of the 550,282 reported crimes (Item<br />
2.1). In 2002 the 186,058 calculated sum was 31% of the total 593,997. Why do the percentages<br />
differ for the two years? What categories of crime are included in the reported total recorded<br />
crimes (Item 2.1) that are not covered by the rest of the items in Table 2 (Items 2.2-2.18)?<br />
In the 8 th survey:<br />
(1) Total assaults (Item 3.7) reported for 2001 and 2002 are consistent with each other,<br />
with 30,111 and 30,361 reported, respectively. In other years, the number varied<br />
widely. In 1997, it was 38,586; in 1998 it dropped to 9,497. What explains this<br />
variation and change in magnitude?<br />
(2) Fraud suspects (Item 3.14) were reported at 614 in 2001 and 715 in 2002. These<br />
numbers are significantly lower than those reported from 1995 to 1997 of 3,684,<br />
3,684 and 3,750, respectively. Reported numbers were in the hundreds before and<br />
after the 1995 to 1997 period. What explains this variation in magnitude?<br />
(3) Embezzlement suspects (Item 3.15) of 181 in 2001 and 153 in 2002 were not<br />
consistent with suspects reported between 1995 and 1997, when 4,873, 5,761, and<br />
6,181 were reported, respectively. They are, however, consistent with embezzlement<br />
suspects reported in 1994 and 1998. What explains these variations in magnitude?<br />
(4) Total drug crime suspects (Item 3.16) of 16,541 in 2001 and 17,934 in 2002 seem to<br />
be consistent with numbers reported since 1998. However, this represents a<br />
significant increase over the number of suspects reported between 1995 and 1997,<br />
when 63, 69 and 59 were reported, respectively. Prior to 1995 and after 1997, drug<br />
crime suspects were reported in the thousands and ten thousands (i.e. 8,743 in 1994<br />
and 12,285 in 1998). What explains these variations in magnitude?<br />
(5) Reported bribery/corruption suspects (3.17) of 65 in 2001 and 59 in 2002 are far<br />
greater than the reported 3, 7 and 1 suspects reported between 1995 and 1997,<br />
respectively. Is this difference reflective of an actual increase in the suspects or is it<br />
attributable to a change in definition, reporting or other factors?<br />
Table A: Non-responses 2001 2002<br />
2.2 Total recorded intentional homicide, completed X X<br />
2.3 Total recorded intentional homicide, attempted X X<br />
2.6 Major Assault X X<br />
2.9 Robbery X X<br />
2.10 Major Theft X X<br />
3.2 Committed intentional homicide suspects X X<br />
3.3 Attempted intentional homicide suspects X X<br />
3.6 Major assault suspects X X<br />
- 82 -
Table A: Non-responses 2001 2002<br />
3.9 Robbery suspects X X<br />
3.10 Major theft suspects X X<br />
Table B: Less than Three Years Data Available for 1995 to 2000<br />
2.3 Total recorded intentional homicide, attempted<br />
2.4 Crimes committed w/ a firearm<br />
2.5 Total recorded non-intentional homicides<br />
2.12 Total recorded automobile thefts<br />
2.18 Kidnappings<br />
3.3 Attempted intentional homicide suspects<br />
3.4 Intentional homicide committed with a firearm suspects<br />
3.5 Non-intentional homicide suspects<br />
3.18 Kidnapping suspects<br />
5.4 Costa Rica<br />
Costa Rica submitted data for 19 of the 48 items in the 8 th survey in 2001 and 20 of the 48 items<br />
in 2002. Missing items are shown in Table A. The 29,900 calculated sum of crimes in 2001 was<br />
72% of the 41,688 reported crimes (Item 2.1). In 2002 the 48,222 calculated sum was 120% of<br />
the 40,263 reported crimes. Why were the 2001 and 2002 percentages different? Why did the<br />
calculated sum of crimes in Table 2 exceed the reported total crimes in 2002? What categories of<br />
crime are included in the 2002 number of total recorded crimes (Item 2.1) that are not included in<br />
the 2001 number?<br />
In the 8 th survey:<br />
(1) In 2001, there were 10,272 reported total police personnel (Item 1.1); in 2002 there<br />
were 10,124. In previous years the reported numbers of police personnel varied<br />
widely, from 1,116 in 1994 to 10,150 in 1995, 9,925 in 1997, 1,352 in 1998, 1,428 in<br />
1999, and 1,489 in 2000. What explains this fluctuation in magnitude?<br />
(2) Total recorded intentional homicides (Item 2.3) were reported as 111 in 2001 and 115<br />
in 2002. In previous years they jumped from 112 in 1998 to 903 in 1999. What<br />
explains these fluctuations?<br />
Table A: Non-responses 2001 2002<br />
2.6 Major Assault X X<br />
2.9 Robbery X<br />
2.13 Total recorded burglaries X X<br />
3.1-3.18 Table 3 – all items X X<br />
4.1-4.8 Table 4 – all items X X<br />
- 83 -
Table B: Less than Three Years Data Available for 1995 to 2000<br />
1.2 Female police personnel<br />
1.3 Male police personnel<br />
2.10 Major thefts<br />
2.13 Total recorded burglaries<br />
2.18 Kidnapping<br />
3.10 Major theft suspects<br />
3.12 Automobile theft suspects<br />
3.13 Burglary suspects<br />
3.18 Kidnapping suspects<br />
4.3 Total adult suspects<br />
4.4 Adult female suspects<br />
4.5 Adult male suspects<br />
4.7 Juvenile female suspects<br />
4.8 Juvenile male suspects<br />
5.5 El Salvador<br />
El Salvador responded to 47 of the 48 items in the <strong>8th</strong> survey. The only missing item was drug<br />
offenses (Item 2.16). The 39,302 calculated sum of crimes in 2001 was 74% of the 53,110<br />
reported total crimes (Item 2.1). In 2002, the 32,080 calculated sum of crimes was 71.6% of the<br />
44,762 reported crimes. What categories of crime are included in the number reported for total<br />
recorded crimes (Item 2.1) that are not covered by the rest of the items in Table 2 (Items 2.2-<br />
2.18)? This is the first survey for which El Salvador submitted data so that it was not possible to<br />
analyze trends.<br />
In the 8 th survey:<br />
(1) The numbers reported for total major assaults (Item 2.6) and total assaults (Item 2.7)<br />
are identical for both 2001 (5,746) and for 2002 (4,542). Is this correct? Are there no<br />
distinctions between major, or “aggravated,” assault and regular assault?<br />
(2) Reported burglaries (Item 2.13) increased from 0 in 2001 to 496 in 2002. Is this<br />
increase reflective of an actual change in the number or is it attributable to a change<br />
in definition, reporting or other factors?<br />
Table A: Non-responses 2001 2002<br />
2.16 Drug offenses X X<br />
Table B: Less than Three Years Data Available for 1995 to 2000<br />
All survey items in Tables 1-4.<br />
- 84 -
5.6 Panama<br />
Panama submitted data for 16 of the 48 items in the 8 th survey. The missing items are shown in<br />
Table A. The 20,065 calculated sum of crimes in 2001 was 92% of the 21,916 reported crimes<br />
(Item 2.1). In 2002, the 19,127 calculated sum was 91% of the 21,058 reported crimes.<br />
Table A: Non-responses 2001 2002<br />
2.3 Total recorded intentional homicide, attempted X X<br />
2.4 Intentional homicide committed with a firearm X X<br />
2.5 Non-intentional homicides X X<br />
2.13 Burglaries X X<br />
2.15 Embezzlements X X<br />
2.17 Total recorded bribery crimes X X<br />
2.18 Kidnapping X X<br />
3.2-3.18 Table 3 – all items, except for Item 3.1 X X<br />
4.1-4.8 Table 4 – all items X X<br />
Table B: Less than Three Years Data Available for 1995 to 2000<br />
1.1-1.4 Table 1 – all items<br />
2.1-2.18 Table 2 – all items<br />
3.4 Intentional homicide committed with a firearm suspects<br />
3.10 Major theft suspects<br />
3.12 Automobile theft suspects<br />
3.13 Burglary suspects<br />
3.18 Kidnapping suspects<br />
5.7 Peru<br />
Peru submitted data for 32 of 48 items in the 8 th survey. Items missing from the 8 th survey are<br />
shown in Table A. The 142,263 calculated sum of crimes in 2001 was 90% of the 158,263<br />
reported sum (Item 2.1). In 2002, the 145,770 calculated sum was also 90% of the<br />
161,621eported sum. There was insufficient historical data to permit analysis of the 2001 and<br />
2002 numbers.<br />
In the 8 th survey:<br />
(1) The reported numbers for 2001 and 2002 are generally consistent for all survey items<br />
for which data were available.<br />
- 85 -
Table A: Non-responses 2001 2002<br />
1.1-1.4 Table 1 – all items X X<br />
2.3 Total recorded intentional homicide, attempted X X<br />
2.5 Total recorded non-intentional homicides X X<br />
2.17 Total recorded bribery crimes X X<br />
3.3 Attempted intentional homicide suspects X X<br />
3.4 Intentional homicide committed with a firearm X X<br />
3.5 Total non-intentional homicide X X<br />
3.6 Major assault suspects X X<br />
3.10 Major theft suspects X X<br />
3.12 Automobile theft suspects X X<br />
3.13 Burglary suspects X X<br />
3.17 Bribery/corruption suspects X X<br />
3.18 Kidnapping X X<br />
Table B: Less than Three Years Data Available for 1995 to 2000<br />
1.1-1.4 Table 1 – all items<br />
2.3 Total recorded intentional homicide, attempted<br />
2.4 Crimes Committed w/ a Firearm<br />
2.5 Total recorded non-intentional homicides<br />
2.6 Major Assault<br />
2.10 Major Theft<br />
2.12 Total recorded automobile theft<br />
2.13 Total recorded burglaries<br />
2.17 Bribery/Corruption<br />
2.18 Kidnapping<br />
3.3 Attempted intentional homicide suspects<br />
3.4 Intentional homicide committed with a firearm<br />
3.5 Total non-intentional homicide<br />
3.6 Major assault suspects<br />
3.10 Major theft suspects<br />
3.12 Automobile theft suspects<br />
3.13 Burglary suspects<br />
3.17 Bribery/corruption suspects<br />
3.18 Kidnapping<br />
4.1-4.8 Table 4 – all items<br />
5.8 Uruguay<br />
Uruguay reported data for 47 of 48 items in the 8 th survey. The only missing item was major<br />
thefts (Item 2.10). The 104,385 calculated sum of crimes in 2001 was 87% of the 120,274<br />
- 86 -
eported crimes (Item 2.1). In 2002, the calculated sum of 116,345 was also 87% of the 134,010<br />
reported crimes.<br />
In the 8 th survey:<br />
1) Reported robberies (Item 2.9) in 2001 were 11,117 and in 2002 they were 10,282.<br />
These numbers were far less than the 50,348 reported in 1999, but more than twice<br />
the 4,358 reported in 1998 and the 5,367 in 2000. What explains these fluctuations?<br />
2) Major theft suspects (Item 3.10), dropped from 12,004 in 2000 to 1,636 in 2001 and<br />
to 2,147 in 2002. Is this decline reflective of an actual change in the number or is it<br />
attributable to a change in definition, reporting or other factors?<br />
3) Total reported crimes (Item 2.1) increased from 74,133 in 2000 to 120,274 in 2001<br />
and to 134,010 in 2002. Is this increase reflective of an actual change in the number<br />
or is it attributable to a change in definition, reporting or other factors?<br />
4) Total assaults (Item 2.7) increased from 4,584 in 2000 to 10,660 in 2001 and 10,544<br />
in 2002. Is this increase reflective of an actual change in the number or is it<br />
attributable to a change in definition, reporting or other factors?<br />
5) Burglaries (Item 2.13) increased from 5,587 in 2000 to 8,737 in 2001 and 11,184 in<br />
2002. Is this increase reflective of an actual change in the number or is it attributable<br />
to a change in definition, reporting or other factors?<br />
6) Embezzlements (Item 2.15) increased from 832 in 2000 to 1,605 in 2001 and to 1,965<br />
in 2002. Is this increase reflective of an actual change in the number or is it<br />
attributable to a change in definition, reporting or other factors?<br />
7) All persons brought into initial formal contact (Item 3.1) increased from 68,213 in<br />
2000 to 96,637 in 2001 and to 100,085 in 2002. Is this increase reflective of an actual<br />
change in the number or is it attributable to a change in definition, reporting or other<br />
factors?<br />
8) Total assault suspects (Item 3.7) increased from 4,340 in 2000 to 10,111 in 2001 and<br />
to 10,177 in 2002. Is this increase reflective of an actual change in the number or is it<br />
attributable to a change in definition, reporting or other factors?<br />
9) Total theft suspects (Item 3.11) increased from 14,529 in 2000 to 28,727 in 2001 and<br />
31,569 in 2002. Is this increase reflective of an actual change in the number or is it<br />
attributable to a change in definition, reporting or other factors?<br />
- 87 -
10) Automobile theft suspects (Item 3.12) increased from 366 in 2000 to 1,961 in 2001<br />
and 2,185 in 2002. Is this increase reflective of an actual change in the number or is it<br />
attributable to a change in definition, reporting or other factors?<br />
11) Total drug crime suspects (Item 3.16) increased from 377 in 2000 to 2,127 in 2001<br />
and dropped to 1,314 in 2002. Are these differences reflective of an actual change in<br />
the number or are they attributable to a change in definition, reporting or other<br />
factors?<br />
12) Total male suspects (Item 4.2) increased from 56,552 in 2000 to 83,330 in 2001 and<br />
87,516 in 2002. Is this increase reflective of an actual change in the number or is it<br />
attributable to a change in definition, reporting or other factors?<br />
13) Total adult suspects (Item 4.3) increased from 55,660 in 2000 to 76,522 in 2001 and<br />
79,600 in 2002. Is this increase reflective of an actual change in the number or is it<br />
attributable to a change in definition, reporting or other factors?<br />
14) Adult male suspects (Item 4.5) increased from 44,405 in 2000 to 65,245 in 2001 and<br />
to 69,149 in 2002. Is this increase reflective of an actual change in the number or is it<br />
attributable to a change in definition, reporting or other factors?<br />
Table A: Non-responses 2001 2002<br />
2.10 Major theft X X<br />
Table B: Less than Three Years Data Available for 1995 to 2000<br />
1.1-1.4 Table 1 – all items<br />
2.18 Kidnappings<br />
3.13 Burglary suspects<br />
3.18 Kidnapping<br />
5.9 Venezuela<br />
Venezuela submitted data for 12 of the 48 items for the 8 th survey. Missing items are shown in<br />
Table A. There is no information given for total crimes for 2001 and 2002 so no comparison can<br />
be made for total reported crimes and the calculated sum of reported crimes for either year.<br />
In the 8 th survey:<br />
(1) Total female suspects (Item 4.1) were reported at 16,578 in 2001 and 18,462 in 2002.<br />
In 2000, they were reported at 921. Is this change in magnitude reflective of an actual<br />
change in the number of female suspects or is it attributable to a change in definition,<br />
reporting or other factors?<br />
- 88 -
(2) Total male suspects (Item 4.2) were reported as 1,001 in 2001 and 1,195 in 2002,<br />
decreasing from 102,485 in 1998. Is this change in magnitude reflective of an actual<br />
change in the number of male suspects or is it attributable to a change in definition,<br />
reporting or other factors?<br />
(3) Total adult suspects (Item 4.3) were reported as 16,853 in 2001 and 17,625 in 2002,<br />
substantially below the 97,721 reported in 1998. Is this decrease reflective of an<br />
actual change in the number of suspects or is it attributable to a change in definition,<br />
reporting or other factors?<br />
(4) Adult female suspects (4.4) were 874 in 2001 and 1,039 in 2002, substantially below<br />
the 6,759 reported in 1998. Is this decrease reflective of an actual change in the<br />
number of adult female suspects or is it attributable to a change in definition,<br />
reporting or other factors?<br />
(5) Adult male suspects (4.5) in 2001 were 15,979 and 16,586 in 2002, substantially<br />
below the 89,962 reported in 1998. Is this decrease reflective of an actual change in<br />
the number or is it attributable to a change in definition, reporting or other factors?<br />
Table A: Non-responses 2001 2002<br />
2.1-2.18 Table 2 – all items X X<br />
3.1-3.18 Table 3 – all items X X<br />
Table B: Less than Three Years Data Available for 1995 to 2000<br />
1.1-1.4 Table 1 – all items<br />
2.3 Total intentional homicides, attempted<br />
2.4 Intentional homicides committed with a firearm<br />
2.5 Non-intentional homicides<br />
2.7 Total assaults<br />
2.11 Total thefts<br />
2.12 Automobile thefts<br />
2.13 Total burglaries<br />
2.18 Kidnappings<br />
3.3 Attempted intentional homicide suspects<br />
3.4 Intentional homicide committed with a firearm suspects<br />
3.5 Non-intentional homicide suspects<br />
3.7 Total assault suspects<br />
3.11 Total theft suspects<br />
3.12 Automobile theft suspects<br />
3.13 Burglary suspects<br />
3.18 Kidnapping suspects<br />
- 89 -
Latin America Summary Table: UN Members Responding to Crime Surveys Covering 1990-2002<br />
Country<br />
5 th Survey 6 th Survey 7 th Survey 8 th Survey<br />
1990 1991 1992 1993 1994 1995 1996 1997 1998 1999 2000 2001 2002<br />
Antigua & Barbuda<br />
Bahamas X X X X X X X X<br />
Barbados X X X X<br />
Cuba<br />
Dominica<br />
Dominican Rep.<br />
Caribbean Grenada<br />
Haiti<br />
Jamaica<br />
St. Kitts & Nevis<br />
St. Lucia<br />
St. Vincent & Grenadines<br />
Trinidad & Tobago<br />
Belize<br />
Costa Rica X X X X X X X X X X X X X<br />
El Salvador X X X<br />
Central America Guatemala<br />
Honduras<br />
Nicaragua<br />
Panama X X X X X X X X X X X X<br />
Argentina X X X X X X X X X X X X<br />
Bolivia X X X X X X X<br />
Brazil<br />
Chile X X X X X X X X X X X X X<br />
Colombia<br />
South America<br />
Ecuador<br />
Guyana<br />
Paraguay<br />
Peru X X X X X X X X X X<br />
Suriname<br />
Uruguay X X X X X X X X X X<br />
Venezuela X X X X X X<br />
- 90 -
6.0: VALIDATION <strong>OF</strong> RESPONSES TO TABLES 1-4<br />
NORTH AMERICA<br />
- 91 -
6.0 North America<br />
All three of the UN member nations from North America responded to the 8 th survey. As shown<br />
in the summary table for North America at the end of this section, only Canada provided data for<br />
all years from 1990 to 2002.<br />
6.1 Canada<br />
Canada provided responses to 44 of the 48 items in the 8 th survey. The four missing items are<br />
shown in Table A. In 2001, the 1,596,184 calculated sum of crimes was 64% of the 2,502,219<br />
total reported crimes (Item 2.1). In 2002, the 1,599,216 calculated sum of crime was also 64% of<br />
the 2,516,918 total reported crimes. What categories of crime are included in total recorded<br />
crimes (Item 2.1) that are not covered by the rest of the items in Table 2 (Items 2.1-2.18)?<br />
In the 8 th survey:<br />
(1) Intentional homicides (Item 2.2) were reported at 207 in 2001 and 523 in 2002. The 2002<br />
number was consistent with the numbers reported from 1995 to 2000 (482 to 575). Was<br />
the 2001 number correct?<br />
(2) Intentional homicides committed with a firearm, suspects (Item 3.4) decreased from 165<br />
in 1999, to 74 in 2001 and 84 in 2002. Was this an actual decrease, or was it attributable<br />
to a change in definition, reporting, or some other factor?<br />
Table A: Non-responses 2001 2002<br />
2.15 Total recorded embezzlements X X<br />
2.17 Total recorded bribery crimes X X<br />
3.15 Embezzlement suspects X X<br />
3.17 Bribery/corruption suspects X X<br />
Table B: Less than Three Years Data Available from 1995-2000<br />
2.15 Total recorded embezzlements<br />
2.17 Total recorded bribery crimes<br />
2.18 Kidnapping<br />
3.15 Embezzlement suspects<br />
3.17 Bribery/corruption suspects<br />
3.18 Kidnapping suspects<br />
6.2 Mexico<br />
Mexico submitted data for 36 of the 48 items in the 8 th survey. The missing items are shown in<br />
Table A. The 803,377 calculated sum of crimes in 2001 was 53% of the 1,512,448 reported<br />
crimes (Item 2.1). In 2002, the 785,221 calculated sum was 52% of the 1,516,029 reported<br />
- 92 -
crimes. What categories of crime are included in the number reported in the total recorded<br />
crimes (Item 2.1) that are not covered by the rest of the items in Table 2 (Items 2.2-2.18)?<br />
In the 8 th Survey:<br />
(1) Between 1998 and 2000, total police budget/financial resources (Item 1.4) ranged from<br />
218,121 ”units” (1998) to 1,270,028 “units” (2000). These numbers stood at 3,000 and<br />
3,500 “units” in 2001 and 2002, respectively. What explains this fluctuation in<br />
magnitude?<br />
(2) Total recorded robberies (Item 2.9) decreased from 301,512 in 1998 to 147,775 in 2002.<br />
Was this an actual decrease or was it attributable to a change in definition, reporting, or<br />
some other factor?<br />
(3) The reporting format for juvenile male suspects (Item 4.8) is inconsistent with the format<br />
used for other categories in Table 4. In both 2001 and 2002, the data for Item 4.8 were<br />
reported using percentages, while actual numbers were used for other items in the same<br />
table.<br />
Table A: Non-responses 2001 2002<br />
2.3 Total recorded intentional homicide, attempted X X<br />
2.10 Major Theft X X<br />
2.13 Total recorded burglaries X X<br />
2.15 Embezzlement X X<br />
2.17 Bribery/Corruption X X<br />
2.18 Kidnapping X X<br />
3.3 Attempted intentional homicide suspects X X<br />
3.4 Intentional homicide committed with a firearm suspects X X<br />
3.10 Major theft suspects X X<br />
3.11 Total theft suspects X X<br />
3.13 Burglary suspects X X<br />
3.15 Embezzlement suspects X X<br />
Table B: Less than Three Years Data Available from 1995-2000<br />
1.1 Total police personnel<br />
1.2 Female police personnel<br />
1.3 Male police personnel<br />
2.3 Total recorded intentional homicide, attempted<br />
2.10 Major thefts<br />
2.15 Embezzlements<br />
2.17 Bribery/corruption<br />
2.18 Kidnapping<br />
3.1-3.18 All items in Table 3<br />
4.1-4.8 All items in Table 4<br />
- 93 -
6.3 United States<br />
The United States provided responses to 31 of the 48 items in the 8 th survey. The items that are<br />
missing are shown in Table A. In 2001, the 10,967,646 calculated sum of crimes was 92% of the<br />
11,876,669 total reported crimes (Item 2.1). In 2002, the 10,982,870 calculated sum of crimes<br />
was also 92% of the 11,877,218 total reported crimes. No data were provided in any category for<br />
2000. Several of the missing data items in the 8 th survey were consistently not reported in earlier<br />
surveys while some data not provided in the 8 th survey were reported in earlier surveys.<br />
In the 8 th survey:<br />
(1) Total police personnel (Item 1.1) were reported at 927,759 in 2001 and 941,139 in<br />
2002, almost 300,000 more than the average 674,404 reported between 1995 and<br />
2000. Was this an actual increase or was it attributable to a change in definition,<br />
reporting, or some other factor?<br />
(2) Total police budget/financial resources (Item 1.4) were not for 2001 and 2002 (as<br />
noted by the respondent).<br />
Table A: Non-responses 2001 2002<br />
1.2 Female police personnel X X<br />
1.3 Male police personnel X X<br />
1.4 Total police budget/financial resources X X<br />
2.3 Total recorded intentional homicide – attempted X X<br />
2.5 Total recorded non-intentional homicide X X<br />
2.7 Total recorded assaults X X<br />
2.14 Total recorded frauds X X<br />
2.15 Total recorded embezzlements X X<br />
2.16 Total recorded drug offenses X X<br />
2.17 Total recorded bribery crimes X X<br />
2.18 Kidnapping X X<br />
3.3 Attempted intentional homicides, suspects X X<br />
3.4 Intentional homicides committed with a firearm X X<br />
3.5 Total non-intentional homicides suspects X X<br />
3.10 Major theft suspects X X<br />
3.17 Bribery/corruption suspects X X<br />
3.18 Kidnapping suspects X X<br />
Table B: Less than Three Years Data Available from 1995-2000<br />
1.4 Total police budget/financial resources<br />
2.3 Total recorded intentional homicide – attempted<br />
2.4 Total recorded intentional homicides with a firearm<br />
2.5 Total recorded non-intentional homicide<br />
- 94 -
Table B: Less than Three Years Data Available from 1995-2000<br />
2.10 Major thefts<br />
2.17 Total recorded bribery crimes<br />
2.18 Kidnapping<br />
3.3 Attempted intentional homicide, suspects<br />
3.5 Intentional homicide committed with a firearm suspects<br />
3.10 Major theft suspects<br />
3.17 Bribery/corruption suspects<br />
3.18 Kidnapping suspects<br />
- 95 -
North America Summary Table: UN Members Responding to Crime Surveys Covering<br />
1990-2002<br />
Country<br />
5 th Survey 6 th Survey 7 th Survey 8 th Survey<br />
1990 1991 1992 1993 1994 1995 1996 1997 1998 1999 2000 2001 2002<br />
Canada X X X X X X X X X X X X X<br />
North America Mexico X X X* X* X X X X X<br />
USA X X X X X X X X X X X X<br />
*In 1995 and 1997, Mexico provided data for only one category (total drug crime suspects).<br />
- 96 -
7.0: VALIDATION <strong>OF</strong> RESPONSES TO TABLES 1-4<br />
OCEANIA<br />
- 97 -
7.0 Oceania<br />
Two (14%) of the fourteen UN member nations in Oceania responded to the 8 th survey. Eight<br />
nations had submitted data for at least one of the last three surveys (the 5 th , 6 th , and 7 th survey). In<br />
general, as the Oceania summary table at the end of this section shows, several countries in<br />
Oceania have not historically responded to UN crime data surveys. Some countries that did<br />
respond to earlier surveys, such as Fiji and the Marshall Islands, did not respond to the 8 th<br />
survey.<br />
7.1 Australia<br />
Australia provided responses to four of the 48 items in the 8 th survey in 2001 and three of the 48<br />
items in 2002. The missing items are shown in Table A. No data were reported for total recorded<br />
crimes (Item 2.1). Thus, no comparison could be made with the calculated sum of crimes.<br />
In the 8 th survey:<br />
(1) The reporting format for total police budget/financial resources (Item 1.4) for 2001<br />
should be checked against earlier years. The use of the decimal point is inconsistent. In<br />
the 8 th survey, the 2001 value is recorded at 4.9. There were no data provided for 2002<br />
for this item. Between 1998 and 2000, the recorded values are 3,688, 4,036, and 4,197,<br />
respectively; there are no decimal points used. In 1997, the value is recorded as 3663.7.<br />
Is this equivalent to 3.7?<br />
Table A: Non-responses 2001 2002<br />
1.4 Total police budget budget/financial resources X<br />
2.1-2.18 Table 2 - all items X X<br />
3.1-3.18 Table 3 - all items X X<br />
4.1-4.8 Table 4 - all items X X<br />
Table B: Less than Three Years Data Available from 1995 to 2000<br />
1.2 Female police personnel<br />
1.3 Male police personnel<br />
2.1 Grand total of recorded crimes<br />
2.6 Major assaults<br />
2.10 Major thefts<br />
2.14 Total recorded frauds<br />
2.15 Embezzlements<br />
2.16 Drug-related crimes<br />
2.17 Total recorded bribery crimes<br />
2.18 Kidnapping<br />
3.1 Total persons brought into initial formal contact with the police<br />
3.4 Intentional homicide committed with a firearm suspects<br />
3.5 Non-intentional homicide suspects<br />
- 98 -
Table B: Less than Three Years Data Available from 1995 to 2000<br />
3.6 Major assault suspects<br />
3.10 Major theft suspects<br />
3.14 Fraud crime suspects<br />
3.15 Embezzlement suspects<br />
3.16 Drug-related crime suspects<br />
3.17 Bribery/corruption crime suspects<br />
3.18 Kidnapping suspects<br />
4.1-4.8 Table 4 – all items<br />
7.2 New Zealand<br />
New Zealand provided responses to 19 of the 48 items in the 8 th survey. The 29 missing items<br />
are shown in Table A. There were no data reported for total recorded crimes (Item 2.1). Thus, no<br />
comparison could be made with the calculated sum of crimes.<br />
In the 8 th survey:<br />
(1) Total recorded embezzlements (Item 2.15) were reported at 105 and 90 in 2001 and 2002,<br />
respectively. This is somewhat consistent with the 76 reported in 1996, but far greater<br />
than the numbers reported from 1997 to 2000 when embezzlements ranged between 17<br />
and 32. What explains these fluctuations in magnitude?<br />
Table A: Non-responses 2001 2002<br />
1.4 Total police budget/financial resources X X<br />
2.1 Grand total of recorded crimes X X<br />
2.10 Total recorded major thefts X X<br />
3.1-3.18 Table 3 – all items X X<br />
4.1-4.8 Table 4 – all items X X<br />
Table B: Less than Three Years Data Available from 1995 to 2000<br />
1.1 Total police personnel<br />
1.2 Total female personnel<br />
1.3 Male police personnel<br />
1.4 Total police budget/financial resources<br />
2.10 Total recorded major thefts<br />
2.18 Kidnapping<br />
3.10 Major theft suspects<br />
3.18 Kidnapping suspects<br />
- 99 -
Oceania Summary Table: UN Members Responding to Crime Surveys Covering 1990-2002<br />
Country<br />
5 th Survey 6 th Survey 7 th Survey 8 th Survey<br />
19901991199219931994199519961997199819992000 2001 2002<br />
Australia X X X X X X X X X X X<br />
Fiji X X X X X X X X<br />
Kiribati X X<br />
Marshall Isl. X X X X X<br />
Micronesia<br />
Nauru<br />
New Zealand X X X X X X X X<br />
Palau<br />
Papua New Guinea X X X<br />
Samoa<br />
Solomon Islands<br />
Tonga X X X X<br />
Tuvalu<br />
Vanuatu<br />
X<br />
- 100 -