Macro Economics - Shivaji University
Macro Economics - Shivaji University
Macro Economics - Shivaji University

Create successful ePaper yourself
Turn your PDF publications into a flip-book with our unique Google optimized e-Paper software.
H<br />
I<br />
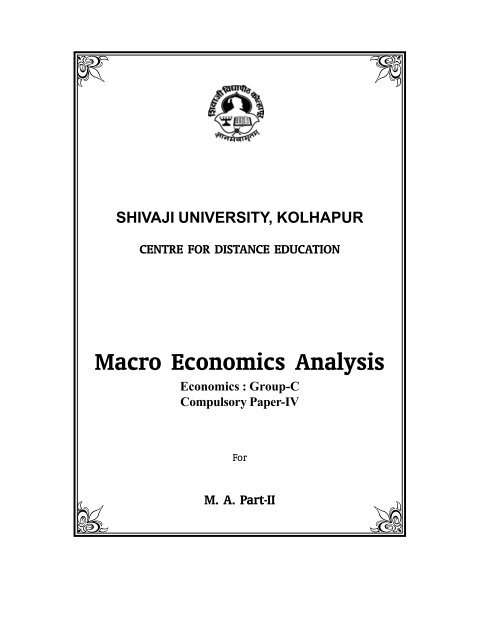
SHIVAJI UNIVERSITY, KOLHAPUR<br />
CENTRE FOR DISTANCE EDUCATION<br />
<strong>Macro</strong> <strong>Economics</strong> Analysis<br />
<strong>Economics</strong> : Group-C<br />
Compulsory Paper-IV<br />
For<br />
K<br />
M. A. Part-II<br />
J
Copyright ©<br />
Prescribed for<br />
Registrar,<br />
<strong>Shivaji</strong> <strong>University</strong>,<br />
Kolhapur. (Maharashtra)<br />
First Edition 2013<br />
M. A. Part-II<br />
All rights reserved. No part of this work may be reproduced in any form by mimeography<br />
or any other means without permission in writing from the <strong>Shivaji</strong> <strong>University</strong>, Kolhapur<br />
(MS)<br />
Copies : 200<br />
Published by:<br />
Dr. D. V. Muley<br />
Registrar,<br />
<strong>Shivaji</strong> <strong>University</strong>,<br />
Kolhapur-416 004.<br />
Printed by :<br />
Superintendent,<br />
<strong>Shivaji</strong> <strong>University</strong> Press,<br />
Kolhapur-416 004<br />
ISBN-978-81-8486-470-0<br />
★<br />
★<br />
Further information about the Centre for Distance Education & <strong>Shivaji</strong> <strong>University</strong> may be<br />
obtained from the <strong>University</strong> Office at Vidyanagar, Kolhapur-416 004, India.<br />
This material has been produced with the developmental grant from DEC-IGNOU, New<br />
Delhi.<br />
(ii)
Prof. (Dr.) N. J. Pawar<br />
Vice-Chancellor,<br />
<strong>Shivaji</strong> <strong>University</strong>, Kolhapur<br />
Prof. (Dr.) R. Krishna Kumar<br />
Hon. Vice-Chancellor, Yashwantrao Chavan<br />
Maharashtra Open <strong>University</strong>, Dnyangangotri,<br />
Near Gangapur Dam, Nasik<br />
Dr. A. P. Gavali<br />
Dean, Faculty of Arts,<br />
<strong>Shivaji</strong> <strong>University</strong>, Kolhapur<br />
Dr. C. J. Khilare<br />
Dean, Faculty of Science,<br />
<strong>Shivaji</strong> <strong>University</strong>, Kolhapur<br />
Prof. (Dr.) A. B. Rajge<br />
Director, B.C.U.D.,<br />
<strong>Shivaji</strong> <strong>University</strong>, Kolhapur<br />
Dr. B. M. Hirdekar<br />
Controller of Examination<br />
<strong>Shivaji</strong> <strong>University</strong>, Kolhapur<br />
Prof. (Dr.) A. N. Joshi<br />
Vaishnavi Appartments, Flat No. 8, Shrirang<br />
nagar, Near Pumping Station,<br />
Near Gangapur Dam, Nasik<br />
●<br />
●<br />
●<br />
●<br />
●<br />
■ B. O. S. MEMBERS OF ECONOMICS ■<br />
Chairman- Dr. Dinkar Rangnath Khatake<br />
Shivraj College of Arts, Commerce & D. S. Kadam Science College, Gadhinglaj, Dist. Kolhapur.<br />
Dr. A. A. Dange<br />
Professor & Head, Department of <strong>Economics</strong>,<br />
<strong>Shivaji</strong> <strong>University</strong>, Kolhapur.<br />
Dr. Lalasaheb Narayanrao Ghatage<br />
Associate Professor and Head,<br />
Chh. <strong>Shivaji</strong> College, Satara<br />
Dr. M. N. Gosavi<br />
Night College of Arts & Commerce,<br />
Bindu Chowk, Kolhapur.<br />
Dr. Anand Dhanavant Lodade<br />
Shahaji Raje Mahavidyalaya, Khatav,<br />
Dist. Satara<br />
Dr. Arjun Subarao Patil<br />
S. B. Khade Mahavidyalaya, Koparde,<br />
Tal. Karveer, Dist.-Kolhapur.<br />
Centre for Distance Education<br />
<strong>Shivaji</strong> <strong>University</strong>, Kolhapur<br />
■ ADVISORY COMMITTEE ■<br />
(iii)<br />
Prof. (Dr.) K. S. Rangappa<br />
Hon. Vice-Chancellor, Karnataka State Open<br />
<strong>University</strong>, Mansagangotri, Mysore<br />
Prof. V. Venkaih<br />
Director, Academic Dr. B. R. Ambedkar<br />
Open <strong>University</strong> Rd. No. 46, Jubilee Hill,<br />
Hyderabad-33 Andhrapradesh<br />
Dr. J. S. Patil<br />
Dean, Faculty of Social Sciences,<br />
<strong>Shivaji</strong> <strong>University</strong>, Kolhapur<br />
Dr. R. G. Phadatare<br />
Dean, Faculty of Commerce,<br />
<strong>Shivaji</strong> <strong>University</strong>, Kolhapur<br />
Prof. (Dr.) D. V. Muley<br />
Registrar,<br />
<strong>Shivaji</strong> <strong>University</strong>, Kolhapur<br />
Shri. B. S. Patil,<br />
Finance and Accounts Officer,<br />
<strong>Shivaji</strong> <strong>University</strong>, Kolhapur<br />
Prof. (Dr.) Jayaprakash A. Shinde<br />
(Member Secretary)<br />
Director, Centre for Distance Education,<br />
<strong>Shivaji</strong> <strong>University</strong>, Kolhapur.<br />
●<br />
●<br />
●<br />
●<br />
Dr. Jagnnath Shamrao Patil<br />
Arts & Commerce College, Kadepur,<br />
Tal. Khanapur, Dist. Sangli.<br />
Dr. R. G. Korabu<br />
D. D. Shinde Sarkar College, Kolhapur.<br />
Dr. V. V. Mahamuni<br />
Associate Professor and Head,<br />
Dept. of <strong>Economics</strong>, Veer Wajekar A. S. C.<br />
College, Phunde (Uran), Navi Mumbai.<br />
Dr. P. S. Kamble<br />
Dept. of <strong>Economics</strong>,<br />
<strong>Shivaji</strong> <strong>University</strong>, Kolhapur.
Centre for Distance Education<br />
<strong>Shivaji</strong> <strong>University</strong>,<br />
Kolhapur.<br />
<strong>Macro</strong> <strong>Economics</strong> Analysis<br />
Writing Team<br />
Authors<br />
Unit No.<br />
Dr. Shashikant Ramchandra Gadgil 1<br />
Mahila Mahavidyalaya, Karad<br />
Dr. Pratibha S. Gaikwad 2<br />
Chh. <strong>Shivaji</strong> College, Satara<br />
Dr. L. N. Ghatage 3, 4<br />
Chh. <strong>Shivaji</strong> College, Satara<br />
Dr. A. K. Wavare 5<br />
Chh. <strong>Shivaji</strong> College, Satara<br />
Dr. Mrs. Yojana V. Jugale 6<br />
Chintamanrao Vyapar Mahavidyalaya, Sangli<br />
Prof. J. A. Yadav 7<br />
Arts & Commerce College, Kadepur<br />
Dr. P. S. Kamble 8<br />
Department of <strong>Economics</strong>, <strong>Shivaji</strong> <strong>University</strong>, Kolhapur.<br />
■ Editors ■<br />
Dr. P. S. Kamble<br />
Associate Professor,<br />
Department of <strong>Economics</strong>,<br />
<strong>Shivaji</strong> <strong>University</strong>, Kolhapur.<br />
Dr. L. N. Ghatage<br />
Associate Professor & Head,<br />
Department of <strong>Economics</strong>,<br />
Chhatrapati <strong>Shivaji</strong> College, Satara<br />
(iv)
Preface<br />
It gives us a great pleasure in presenting this book on '<strong>Macro</strong> <strong>Economics</strong> Analysis'<br />
as a Self Instructional Material (SIM) for M. A. Part-II <strong>Economics</strong> students of Centre for<br />
Distance Education, <strong>Shivaji</strong> <strong>University</strong>, Kolhapur with revised syllabus of Compulsory<br />
Paper IV.<br />
This particular book contains 8 units which establishes the functionl relationship<br />
between the large aggregates. The aggregate analysis has assumed such a great<br />
significance in recent times. <strong>Macro</strong> <strong>Economics</strong> now is not only a scientific method of<br />
analysis, but also a body of empirical economic knowledge. So that this book equips<br />
the students of distance mode at postgraduate level to understand the systamatic<br />
facts and latest theoritical developments for empirical analysis.<br />
This book has covered 8 different chapters i.e. Introduction to macro economics,<br />
Demand and supply of money, Theories of consumption, Theories of investment,<br />
National income, Neo-classical and Keynesian synthesis, Open economy and exchange<br />
rate, Theories of inflation and business cycles etc. which deals us the details in<br />
respect of macro economic analysis. All these units have been clearly discussed in<br />
this book. We believe that this book will be useful for the students and teachers of postgraduate<br />
classes of the subject economics.<br />
We express our thanks to all unit writers of this book entitled '<strong>Macro</strong> <strong>Economics</strong>'.<br />
We will also thankful to Director, Centre for Distance Education, <strong>Shivaji</strong> <strong>University</strong>,<br />
Kolhapur for giving golden academic opportunity to us. We express our thanks to the<br />
administrative officer and personals of <strong>Shivaji</strong> <strong>University</strong>, Kolhapur. We also request<br />
to all the students and teachers to make the necessary suggestions for improving the<br />
standard of this book. Lastly we are tankful to <strong>Shivaji</strong> <strong>University</strong> Press for bringing out<br />
this valuable book intime for the benefits of all related students and teachers.<br />
■ Editors ■<br />
Dr. P. S. Kamble<br />
Associate Professor,<br />
Department of <strong>Economics</strong>,<br />
<strong>Shivaji</strong> <strong>University</strong>, Kolhapur.<br />
Dr. L. N. Ghatage<br />
Associate Professor & Head,<br />
Department of <strong>Economics</strong>,<br />
Chhatrapati <strong>Shivaji</strong> College, Satara<br />
(v)
M. A. Part-I <strong>Economics</strong><br />
Group - C - Compulsory Paper-IV<br />
<strong>Macro</strong> <strong>Economics</strong> Analysis<br />
INDEX<br />
Unit No. Topic Page No.<br />
1 Introduction to <strong>Macro</strong> <strong>Economics</strong> 1<br />
2 Demand and Supply of Money 20<br />
3 Theories of Consumption 33<br />
4 Theories of Investment 48<br />
5 National Income and Accounting 67<br />
6 Neo-classical and Keynesian Synthesis 90<br />
7 Open Economy and Exchange Rate 123<br />
8 Theories of Inflation and Business Cycles 145<br />
(vii)
Each Unit begins with the section Objectives -<br />
Objectives are directive and indicative of :<br />
1. What has been presented in the Unit and<br />
2. What is expected from you<br />
3. What you are expected to know pertaining to the specific Unit<br />
once you have completed working on the Unit.<br />
The self check exercises with possible answers will help you to<br />
understand the Unit in the right perspective. Go through the possible<br />
answer only after you write your answers. These exercises are not<br />
to be submitted to us for evaluation. They have been provided to<br />
you as Study Tools to help keep you in the right track as you study<br />
the Unit.<br />
(viii)
Unit – I<br />
'Introduction to <strong>Macro</strong> <strong>Economics</strong>'<br />
1.0 Objectives<br />
1.1 Introduction.<br />
1.2 Analysis of the unit.<br />
1.2.1 Meaning and Origin of <strong>Macro</strong> <strong>Economics</strong><br />
1.2.2 Importance and Limitations of <strong>Macro</strong> <strong>Economics</strong>.<br />
1.2.3 <strong>Macro</strong> Economic Variables - Stock and flow.<br />
1.2.4 <strong>Macro</strong> Economic Equilibrium.<br />
1.3 Summary<br />
1.4 Objective Questions & Answers<br />
1.5 Questions for Practice<br />
1.6 Key words<br />
1.7 Books for further Reading.<br />
1.0 Objectives,<br />
After studing this unit we will able to-<br />
1) Explain the meaning of <strong>Macro</strong> <strong>Economics</strong>.<br />
2) Tell how macro economics originated.<br />
3) Understand importance of <strong>Macro</strong> <strong>Economics</strong>.<br />
4) Realise the limitations of macro <strong>Economics</strong>.<br />
5) Explain Stock and flow types of Variables.<br />
6) Understand <strong>Macro</strong> <strong>Economics</strong> Variables.<br />
1.1 Introduction :<br />
There are several approaches to economic analysis, micro economic & macro<br />
economic have come to be known as two important approaches to the economic<br />
analysis, recently only in the early thirties of the twentieth century. Between these,<br />
macro economic analysis method is prescribed for the syllabus of M.A. II (<strong>Economics</strong>).<br />
It includes the units such as - Introduction to macro <strong>Economics</strong>, demand & supply of<br />
money, theories of consumption, theories of investment, National Income & Accounting<br />
Neo classical & Keynesion synthesis, open Economy & Exchange Rate & Theories of<br />
inflation & Business cycles. The objective of this self Instruction Material (SIM) is that<br />
1
student should study these units on the theoretical & practical level and understand<br />
the analysis of the entire economic. In Unit -I we are going to study meaning & Origin<br />
of macro Economies, Importance & limitations of macro Economies <strong>Macro</strong> Economic<br />
Variables in the forms of stock & flow and <strong>Macro</strong> Economic Equilibrium.<br />
1.2 Analysis of the Unit<br />
1.2.1- Meaning and origin of macro <strong>Economics</strong><br />
There are different methods of economic analysis. For e.g. deductive, inductive,<br />
scientific, traditional & modern method etc. for studying economic problems & to put<br />
forth economic theories are called as economic analysis method According to views<br />
of modern section there are two types economic analysis, Micro <strong>Economics</strong> & <strong>Macro</strong><br />
<strong>Economics</strong> In modern age, these two methods of economic analysis have got more<br />
importance. From these <strong>Macro</strong> Economic Analysis method has got more importance<br />
than micro Ecomomic Analysis method. These two analysis methods became popular<br />
in decade of 1930 in 20th century.<br />
Meaning of <strong>Macro</strong> <strong>Economics</strong> :<br />
The terms <strong>Macro</strong> <strong>Economics</strong> & micro <strong>Economics</strong> were first used by the<br />
economist Ragnar Frisch in 1933. The word ‘<strong>Macro</strong> is derived from the Greek word<br />
‘Makros’ the word ‘macro’ means large part; the word ‘micro’ means ‘small’ i.e. ‘one<br />
million part ‘or’ the very smallest part; the science which independently studies the<br />
smallest parts of economic system and comes to conclusion of their behaviour, is<br />
called as ‘micro <strong>Economics</strong>;<br />
In this unit, we are going to study the meaning of macro <strong>Economics</strong> To know<br />
the meaning of macro <strong>Economics</strong> in better way, it is necessary to study the definitions<br />
of macro Economies.<br />
Definitions of macro Economies : -<br />
some economists have given definitions of macro <strong>Economics</strong>. We will see<br />
some of these definitions.<br />
1) Prof Boulding - “<strong>Macro</strong> <strong>Economics</strong> as that part of economics which studies over all<br />
averags and aggregates of the system. Thus macro economics makes an attempt to<br />
explain and analyse the working of the economic system as a whole”<br />
2) Prof. Hansen - “The branch of economics which studies the relationships of the<br />
larger group like total employment, total saving total capital, total investment of national<br />
income is called macro <strong>Economics</strong>”<br />
3) Prof Ackley - “<strong>Macro</strong> <strong>Economics</strong> studies overall dimensions & transactions of<br />
economic life. This study is related to the entire factors, likewise the trees in the forest<br />
can not be studied independently”<br />
Characteristics of macro <strong>Economics</strong> -<br />
with the help of above mentioned definitions, we can mention the Characteristics<br />
of macro economics. As follows.<br />
2
1) It studies the entire economic system as a whole.<br />
2) macro <strong>Economics</strong> is also known as the theory of income & employment or income<br />
analysis.<br />
3) <strong>Macro</strong> <strong>Economics</strong> studies aggregates or averages shewing the whole economy.<br />
i.e. total employment total consumption national income, general price level. etc.<br />
4) In <strong>Macro</strong> <strong>Economics</strong>, the analysis is done through ‘General Equilibrium’<br />
5) The scope of macro <strong>Economics</strong> is conpretative.<br />
6) Analysis explains with about average & aggregate numbers.<br />
7) <strong>Macro</strong> Economic Analysis does not assume the assumptions i.e. full employment,<br />
perfect competence, etc.<br />
Scope of <strong>Macro</strong> economics :<br />
we can understand the scope of macro economics through its definitions.<br />
Through the scope of macro <strong>Economics</strong> we can get information of the nature of macro<br />
economics, its study related & relations with other sciences. It helps us to know the<br />
wearing of macro <strong>Economics</strong> in easy way. In the scope of macro <strong>Economics</strong> we are<br />
going to mention the economic theories included in macro <strong>Economics</strong> and the<br />
economists who have contributed in the development of the study of <strong>Macro</strong> <strong>Economics</strong>.<br />
<strong>Macro</strong> <strong>Economics</strong> includes general employment theory, general price theory,<br />
trade cycle theories, economic growth & development theories, of Inter national trade,<br />
currency value theory, general theory of distribution, theories of consumption, theories<br />
of investment, etc. <strong>Macro</strong> <strong>Economics</strong> analyses the economic problems like poverty,<br />
unemployment, economic disequilibrium, inflation, deflation etc. many economists have<br />
put forth their views regarding these theories & problems. Among these the contribution<br />
of the economists like Karl, Marx, Walras, Wicksel, Fisher, Cassel, Robertson, Hayek,<br />
Hawtrey, Keynes etc. is very important. The scope of macro Economies can be<br />
explained with the help of the following layout.<br />
v<br />
Layout of the scope of macro <strong>Economics</strong>-<br />
<strong>Macro</strong> <strong>Economics</strong><br />
Income & General Theories General<br />
Employment price Level of Economic Distribution<br />
theory. theory. Development theory.<br />
v v v v<br />
Theory of Theory of Theory of Theory of<br />
consumption Investment International Trade Currency value<br />
v<br />
Trade Cycle Theory<br />
v v v<br />
3
* Origin and Development of macro <strong>Economics</strong>:-<br />
Ragnar Frisch first used the concept ‘macro Economic in 1933. But before that<br />
<strong>Macro</strong> <strong>Economics</strong> Analysis, Method was used for economic analysis. For e.g. census,<br />
national income, agriculture land measurement. But in real sense, mercantilists<br />
economists used macro economic analysis method scientifically. This use was done<br />
in regard with economic problems. In 16th & 17th century, mercantilists economists<br />
made analysis by thinking total economic system macro economic analysis method<br />
was used in national wealth & economic transactions regarded with states. Sir Willam<br />
petty put forth scientific concept of national income by collecting statistics of different<br />
family’s income. Because of this it is said that the seeds of macro <strong>Economics</strong> are in<br />
the school of mercantilisis.<br />
It is found that in 18th century the physiocratrics school used macro economic<br />
Analysis method while putting forth economic thoughts. Physiocrats economist put<br />
forward the concept of stable Economy in 1758. In it, macro Economic Analysis method<br />
was used. In 19th century, Mathusi, Sisvnondi & Karl did economic analysis regarding<br />
macro economic problems. before Keynes, the modern economists like Walras, Wicksell<br />
& Fischer developed macro economic analysis method. The economists like Marshall,<br />
Pigou Robertson, Hayek and Hawtrey developed a theory regarding money and general<br />
price level. It considered economic situation upto the first world war.<br />
In 1936 Lord Keynes popularised his book named the general theory of<br />
Employment, interest & money. In this popular book he expressed his thoughts like<br />
national income, interest, employment, tradecycles etc. The book also includes analysis<br />
of changing economic situation in better way. It suggested remedies about recession<br />
and employment. Keynes expressed his views by macro economic method and these<br />
views became popular. Through this ‘macro <strong>Economics</strong>’ get recognition as an<br />
independent branch of <strong>Economics</strong>. Radical analysis was being done regarding income,<br />
production and employment, and it increased popularity and scope of macro <strong>Economics</strong>.<br />
So Keynes is given the credit of developing macro Economies many economic problems<br />
were being explained by using macro economic analysis method. <strong>Macro</strong> <strong>Economics</strong><br />
was being figuraly used in practice and theoretical nature.<br />
From 1950 macro Dynamics was being used as impressive means of analysis<br />
for rapid economic development. The basic concept in macro Economic like stock<br />
variables, Flow variables, Ratio variables, functional relationship, <strong>Economics</strong> models<br />
etc. are being extensively used in theoretical and applied research. In the beginning,<br />
consumption, investment etc. With reference to closed economy, were being studied<br />
in macro <strong>Economics</strong>. But after 1970 extension of macro <strong>Economics</strong> is growing due to<br />
expansion of international trade, migration of capital in large extent, growing participation<br />
of developing countries in open market.<br />
1.2.2, Importance and limitations of macro <strong>Economics</strong>.<br />
Importance of macro <strong>Economics</strong> :<br />
<strong>Macro</strong> economic analysis method is very useful in theoretical and applied<br />
4
esearch of <strong>Economics</strong>. <strong>Macro</strong> <strong>Economics</strong> is very helpful to understand objective nature<br />
of economy <strong>Macro</strong> <strong>Economics</strong> has importance in different economic fields. This<br />
importance can be explained by following points.<br />
1) Helpful in formulating economic policy :-<br />
Government gets support of information to plan economic policy due to macro<br />
economic analysis. Plan economic implementation of economic policy is made for the<br />
purpose of improvement in total economic situation. For that, the aggregates units<br />
like national income total expenditure, total saving, total employment etc. are studied.<br />
<strong>Macro</strong> <strong>Economics</strong> helps to make available the extensive statistical information of whole<br />
Economy. Due to macro economics analysis, we get information of problems like<br />
poverty, unemployment, economic disequilibrium inflation etc. it helps to formulating<br />
economic policy to solve these problems.<br />
2) Helps to understand the work of economy :-<br />
The nature & work of modern economy is very complicated. <strong>Macro</strong> economics<br />
is useful to know the work and structure of this economy. In macro <strong>Economics</strong>, a<br />
universe or aggregates for e.g. national income, total employment, total production<br />
etc. are studied. Because of this, statistical information of <strong>Macro</strong> Economic variables<br />
gets available. The impact of these elements on Economy can be understood. From<br />
this one can get the total idea of nature of economy.<br />
3) To solve economic problems :-<br />
Due to macro economic analysis many common economic problems are known<br />
like poverty, unemployment, less productivity, economic disequilibrium, population<br />
explosion cosine etc. Alongwith this the causes of arousing these problems and its<br />
effects on different economic and social classes, are explained, The Government is<br />
helped to formulate certain proper polices to solve these problems for e.g. polices<br />
regarding population, currency, investment etc. It suggests remedies to grow impressive<br />
demand to eradicate unemployment the policy of family welfare & family planning is<br />
implemented to avoid adverse effects of excessive growing population.<br />
4) Real Analysis :-<br />
In micro economics analysis is done by taking many assumptions like<br />
perfect competition, full employment etc. but macro <strong>Economics</strong> does not make analysis<br />
by assuming certain situation. <strong>Macro</strong> <strong>Economics</strong> studies reality in economy, changing<br />
situation in economy, conclusions are made through it. These conclusions are more<br />
correct and useful. So analysis is real. <strong>Macro</strong> economics studies the dynamic economic<br />
system.<br />
5) useful to obtain economic stability : -<br />
<strong>Macro</strong> economics studies economic situation of a country - in objective way.<br />
That is why causes of creation of trade cycles are known. The nature of economic<br />
boom & recession can be understood. Proper economic policies can be planned to<br />
5
suggest remedies on it <strong>Macro</strong> <strong>Economics</strong> is developed to solve economic problems<br />
created due to Great Depression. Trade cycles can be controlled through it <strong>Macro</strong><br />
<strong>Economics</strong> helps to make changes as per necessity in policies regarding monetary &<br />
fiscal policies.<br />
6) Useful for the development of micro <strong>Economics</strong> :-<br />
Micro Economic variables get affected by the changes in macro economic<br />
variables. For e.g. total production, national income total employment etc. If there is<br />
change in these variables it affects Micro economic variables, such as personal<br />
Prnlulting, personal income, personal consumption etc. Because of this the development<br />
of macro economics is useful for the development of micro <strong>Economics</strong>. <strong>Macro</strong><br />
<strong>Economics</strong> guides to put forth theories in micro <strong>Economics</strong>. For e.g. theory of<br />
demolishing marginal Utility, This theory explains the experience of all consumers of<br />
specific good.<br />
7) Study of dynamic economy :-<br />
<strong>Macro</strong> <strong>Economics</strong> studies newly arousing problems in dynamic economy. It<br />
studies causes of problems created in objective way and not by assuming the situation.<br />
As it studies the entire economy, the necessary in for nation is made available for<br />
analysis. So with the help of macro <strong>Economics</strong>, the explanation of newly arousing<br />
frequent problems in economy can be done. The problems like imbalance of balance<br />
of payment, insfability in exchange rate, unemployment, trade cycles etc. are being<br />
created. <strong>Macro</strong> <strong>Economics</strong> is useful to do remedies on it.<br />
8) International comparison :-<br />
Different type of information about macro economic variables in every country<br />
can be obtained due to macro economic analysis. This information is obtained frequently<br />
in new way. For e.g. National income, per capita income, total consumption, per capita<br />
consumption, total production total employment, total import- export etc. The<br />
conclusions about consumption tendency, structure of investment, nature of total<br />
demand in every country, can be done with the help of this information, international<br />
comparison of different countries, economic situation can be made. From this one<br />
gets the idea about the country whether it is more advanced or backward. One gets<br />
idea of our country’s place in international economy. But this type of comparison is not<br />
possible in micro <strong>Economics</strong> as it studies independent units. One understand the ratio<br />
of international & regional economic disequilibrium.<br />
9) Setting of economic theories :-<br />
<strong>Macro</strong> <strong>Economics</strong> studies the relations in larger aggregates. It studies<br />
frequently changing situations in real way so new information is obtained frequently.<br />
Objective study of different problems is done. So it makes possible to set many new<br />
theories with the help of macro economic Development, Theory of general distribution,<br />
theory of currency value, etc. it helped to more development of <strong>Economics</strong> than other<br />
social sciences.<br />
6
10) Economic development :-<br />
one gets information of country’s national income, total saving, total production,<br />
total investment etc. due to macro economic analysis. Along with this, the availability<br />
of resources like land, water, population, minerals, forests etc. is known. It helps to<br />
formulate economic planning for economic development. It helps to make plans and<br />
program to obtain economic goals and for implementation of plans for total employment<br />
welfare state, poverty eradication, balanced development etc. macro <strong>Economics</strong> is<br />
useful to make socialist pattern of society in country and also to make adequate and<br />
efficient use of resources.<br />
Limitations of <strong>Macro</strong> <strong>Economics</strong> :-<br />
Some of the important limitations of <strong>Macro</strong> <strong>Economics</strong> can be explained through<br />
the following points -<br />
1) Fault in Generalisation :-<br />
<strong>Macro</strong> <strong>Economics</strong> considers personal economic practices as economic<br />
behaviour in totality which is faulty. Sometimes, there can be confusion through<br />
generalisation of conclusions. For e.g. A depositor withdrew his deposit from the bank.<br />
It does not affect any bank or banking profession. If the conclusion is made that, if all<br />
depositor’s withdraw their deposits from bank at the same time, it will not affect any<br />
banking profession. This will be a great fault. Conclusions of generalisation are<br />
misleading.<br />
2) Problems in measurement :-<br />
<strong>Macro</strong> <strong>Economics</strong> analysis different types of groups, which are different in<br />
nature all units in each group are not homogenous. These groups does not have any<br />
authenticated means of measurement. Value of many things is measured by<br />
money which does not remain stable. For e.g. Different goods & services with its<br />
value are added to measure national income. But the nature of these goods is very<br />
different and it creates problems in measuring national income.<br />
3) Deficiency of homogeusness : -<br />
Conclusions are made by assuming that all units in group are homogenous.<br />
But homogeneousness is not found in the units. For e.g. there is dissimilarity in weight,<br />
shape, quality, efficiency etc. relations of units in group can be contrasting. Influences<br />
of any situation are different on units in same group. Effects of inflation on poor are<br />
more adverse than rich.<br />
4) Faults in Average :-<br />
The conclusions in macro economic analysis are put forth in aggregation<br />
which can be faulty. For e.g. if national income grew by 5% in last 5 years it means,<br />
national income grew by average 5 to each year. But sometimes, the actual growth<br />
rate would be 20% or in certain year there is actual reduction or 0% growth rate in<br />
national income.<br />
7
5) Limitations regarding policies :-<br />
Government implements economic policies by studying macro economic<br />
aggregations. But these policies can not be useful to all the elements of particular field<br />
or can not affect in same way on all the elements, some elements get benefited of<br />
economic policy & some can be adversely affected. For e.g. Industrial policy is benefitted<br />
for large scale industries but adversely affects small scale industries.<br />
6) Unreal Inference :-<br />
After studding aggregate elements in economy, it is concluded that there is no<br />
change in some fields, so there is no necessity to change current economic policy, but<br />
it is wrong to do certain conclusion. For e.g. the price of industrial goods deducted by<br />
25%. It did not change the general price level of the country. This type of conclusions<br />
are unreal as reduction in price of agricultural goods adversely affects economic<br />
condition of farmers. This can create economic instability in country.<br />
7) Contradictory goals :-<br />
Government implements economic policies to achieve different goals by using<br />
macro economic analysis. But these objectives are contrasting. So it can create<br />
confusion. For e.g. Acieving full employment, economic stability, rapid economic<br />
development etc. these objectives can not be achieved at the same time. It is difficult<br />
to have co- ordination in these objectives. While growing employment opportunities,<br />
the speed of inflation grows. It becomes difficult to maintain economic stability.<br />
8) Incomplete analysis :-<br />
In <strong>Macro</strong> <strong>Economics</strong> conclusions are put forth by thinking aggregates of<br />
variables in economy and economic problems of whole society are studie. But these<br />
conclusions and inferences can not analyses economic situation entirely. There can<br />
be some faults. This analysis does not take into account the characteristics of all the<br />
units. <strong>Macro</strong> economics does not consider personal problems, so analysis becomes<br />
one - sided. It becomes necessary to use micro Economic Analysis method to study<br />
all - round economic situation.<br />
9) Insufficiency in statistical information :-<br />
Different type of statistical information of various elements is collected and<br />
conclusions are made in macro <strong>Economics</strong>. Economic policies are implemented but<br />
all elements in group have different characteristics. Incomplete information of these<br />
elements can not be helpful to make correct conclusions for e.g. people do not give<br />
correct information of income, property, tax, etc. while measuring national income.<br />
There are logical & practical problems. Statistical analysis used various methods but<br />
proper method to get collective and aggregate information, is not still available.<br />
1.2.3. <strong>Macro</strong> Economic Variables Stock & Flow :-<br />
<strong>Macro</strong> economic variables, economic models, functional relationship, etc. are<br />
basic concepts of <strong>Macro</strong> <strong>Economics</strong>. These concepts help to know real nature of<br />
8
<strong>Macro</strong> <strong>Economics</strong>. So if becomcs important to study macro economic variables. We<br />
will study the meaning of ‘variable’<br />
Meaning of variable : we will study the meaning of ‘variable’ with the help of<br />
following definition of variable.<br />
‘Variable : “ An element or factor which can change in number and volume in specific<br />
period of time, is called as variable”<br />
This definition explains the character rustics of variable. These characteristics<br />
are as follows.<br />
Characteristics of Variable :-<br />
1) ‘Variable’ should be explained in reference to a specific ‘point of time’ or<br />
specific period of time: For e.g. on specific day, year etc.<br />
2) The changes of value or size of variable should be expressed with the help<br />
of particular means or tool of measurement. For e.g. kilogram, liter, meter, etc.<br />
Variable expressed in this way proves to be meaningful & useful. If it is not<br />
expressed in such a way it proves to be meaning less and useless. For e.g. Demand<br />
of foddering is 220 million tones. If the value of variable is expressed in this way<br />
nothing can be guessed. But if this is said in a way that on 31-3-2012 the stock of<br />
foodgrains was 220 million tones. It proves actual meaning of variable.<br />
Each science has variable. <strong>Economics</strong> also has variables. For e.g. Demand<br />
supply, price, production interest rate etc. Economic analysis is possible due to these<br />
variables there are various types of variables. Now we will study of various types of<br />
micro Economic variables. In detail.<br />
Classification of macro economic variables :-<br />
In <strong>Economics</strong>, variables are classified by economic analysis method. When<br />
the value of variable is expressed independents in reference to a unit in a group, it is<br />
called ‘micro Economic variable’ for e.g. personal demand, individual consumption,<br />
individual income, production of the firm etc. these variables are useful in micro<br />
<strong>Economics</strong>.<br />
“When the value of variable is expressed in reference to a group or aggregate,<br />
it is called “ macro economic variable”<br />
For e.g. National income , general price level, total supply of money ,total<br />
consumption, total employment etc. These variables are important in macro economics<br />
and used for macro economic analysis.<br />
Prof. Various types of macro economic variables are as follows<br />
A) Functional Relationship variables :-<br />
These variables may be grouped in two ways :-<br />
1) Dependent Variable :-<br />
“A variable, the value of which depends upon the variation in another variable<br />
9
is Known as dependent variable”<br />
The value of specific variable changes due to changes in other variables. A<br />
dependent variable means a variable, the value of which varies in some unique way,<br />
with the variation in some other independent variable or variables. For e.g. demand<br />
goes on changing due to change in price. So ‘depends’ is a ‘Dependent variable’ and<br />
price is a’ independent variable’ Demand depends upon price.<br />
2) “A variable is independent, the value of which influence the value of other<br />
variable or variables”<br />
For e.g. consumption varies with the variation in income. Here consumption is<br />
a dependent variable and income is a ‘Independent variable’<br />
B) Ratio variables : -<br />
The economic variables are also measured in term of ratio variable.<br />
Variables which explain relationship or ratio between variables of two groups<br />
are called ‘Ratio variables’<br />
e.g. The ratio of gross in national income and national consumption in a specific<br />
period time expresses the ratio variable.<br />
c) Stock & flow variables :-<br />
<strong>Macro</strong> Economic variables may be grouped as ‘stock variables’ and flow<br />
variables.<br />
1) Stock variables :-<br />
“The value of aggregate variables is explained for a specific point of time.<br />
Those variables are called ‘stock variables’ e.g. money supply in country on 31-3-<br />
2012 is Rs. 1,00,000 crores. Stock variables must explain with point of time & amount<br />
in this way national income, total employment total production etc. are explained as<br />
stock variables, stock variables prove to be useful to know total situation of economy<br />
at a specific point of time but they can not be helpful to evaluate the changes in<br />
economic situation.<br />
2) Flow variable :-<br />
“the value of aggregates variable is explained for a specific period of time.<br />
Those variables are called ‘Flow variables’ For e.g. marginal propensity to consume,<br />
marginal propensity to saving, etc.<br />
If there is not reference of value & period of time, meaning of flow variables<br />
can not be cleared. For e.g. National income increased by 50,000 crores. This variable<br />
does not have any meaning, as it’s value is not explained in any currency & period of<br />
time. If it is said like - national income increased by Rs- 50,000 crores in the year 2010<br />
-11, it explains the meaning of variable poperly. Total production, total employment,<br />
national income total consumption, total caving etc. These variables can be explained<br />
in reference to a specific period of time, it explains the changes in value of variables in<br />
10
specific period of time. It helps to know the changes in country’s economic situating in<br />
specific period of time. It helps to know the changes in country’s economic development<br />
is possible. Therefore flow variables have more importance than stock variables.<br />
1.2.4. <strong>Macro</strong> Economic Equilibrium :-<br />
‘Equilibrium’ is an important concept in economic analysis. Equilibrium has<br />
great importance in <strong>Economics</strong>. So George stagier called <strong>Economics</strong> as "Science of<br />
Analysis of Equilibrium." Micro Economic Equilibrium refers to the balance between<br />
different macro economic variables. For e.g.. Price through the balance between<br />
demand & supply, interest rate through balance between demand & supply of capital,<br />
national income is equal to national consumption plus national saving. etc. Equilibrium<br />
analysis is also important to achieve economic stability as well as economic<br />
development.<br />
* Meaning of Equilibrium : The word 'Equilibrium' is formed from two Latin<br />
words - 'Aqueous' meaning 'Equal' and 'Libra' meaning 'Balance'. We explain the<br />
meaning of equilibrium by following deffinitions of equilibrium.<br />
* Definitions of Equilibrium :<br />
1) George Stagger : "Equilibrium is a state of balance in such a way that the<br />
opposing forces or tendencies mutually just cancel each other, so that the object on<br />
which these forces extent their pressure do not subject to any disturbances."<br />
2) Dr. Marshall : " Equilibrium refers as the simple balancing of forces which<br />
corresponds rather to the mechanical equilibrium of a stone hanging by an elastic<br />
string or of a number of balls resting against another in a balance."<br />
The concept 'Equilibrium' is in physics' which means take of any movement.<br />
But 'Equilibrium' Does not mean the sum in <strong>Economics</strong>. If there is no movement, then<br />
no economic practices can take place. It will become difficult for human beings to live<br />
life - So equilibrium means stability in movement rate. Production factors try to go in<br />
the state of equilibrium in the same way whole economy tries to go in the state of<br />
equilibrium. When demand and supply are equal at a particular price, it is the state of<br />
equilibrium.<br />
* Type of Equilibrium : Types of Equilibrium are made according to its period<br />
of time, analysis method, scope etc.<br />
A) Stable, Unstable and Natural Equilibrium :<br />
* Stable Equilibrium : Definition of stable Equilibrium is as follows, "Any<br />
disturbance in the equilibrium situation is self-adjusting so that the old equilibrium<br />
position is restored."<br />
For e.g. when the demand price is equal to supply price, the amount produced<br />
has no tendency, either to be increased or to be diminised; it is in equilibrium. There is<br />
rise and fall in agricultural production due to favorable and unfavorable changes of<br />
natural situation. But in normal natural situation, it reaches the general level of<br />
production. This can be explained by following example & figure - 1.<br />
11
For e.g. there is a ball in a flat deep Pot. If we shake the ball, it continues<br />
moving for some time and then it will remain stable. This is called 'stable Equilibrium'.<br />
Figure - 1<br />
Flat deep pot<br />
Ball<br />
A<br />
At specific price, demand supply are in a state of equilibrium. Specific price is<br />
stable price. If price increases, supply will increase and price will become less. It<br />
means, price will come at a particular price level. If price becomes less, supply will be<br />
lessened and again price will increase as before. In this way stable equilibrium can be<br />
achieved.<br />
* Unstable Equilibrium : "When any disturbance in equilibrium situation brings<br />
in forces which move the system away from it, never to restored."<br />
For e.g. Agricultural production constantly goes on growing due to frequent<br />
use of modern technique in cultivation. This equilibrium can be explained by following<br />
example & figure - 2.<br />
If we turned flat deep pot upside down and put the ball in stable position. If we<br />
push the ball, it will go at the opposite side of the force and become stable on ground.<br />
Ball<br />
Figure - 2<br />
A<br />
Deep flat pot<br />
(upside down)<br />
The ball is put stable at point 'A' which is stable equilibrium. The ball is pushed<br />
from left side, so it cam down from pot and stood still at right side at point B. It achieves<br />
unstable equilibrium.<br />
* Neutral Equilibrium : "When an initial equilibrium position is disturbed, the<br />
forces of disturbance bring it to the new position of equilibrium where the system has<br />
come to rest."<br />
12<br />
B
In this equilibrium, changed the place of equilibrium but did not change the<br />
nature of equilibrium. This equilibrium can be explained by following example &<br />
Figure - 3<br />
Push the ball<br />
A<br />
In figure - 3, it is considered that the ball is on flat ground. The ball is stable in<br />
point 'A'. It is pushed from left side and becomes stable on ground at point 'B'. So the<br />
place of equilibrium is changed but its' nature does not change.<br />
In this, three types of equilibrium, only the stable equilibrium which is of use to<br />
economists for analysing complex economic problems. The unstable & neutral<br />
equilibrium are used for academic interest only.<br />
B) Short - term equilibrium & long - term Equilibrium : -<br />
* Short term Equilibrium :- "A short - period equilibrium is one which maintain<br />
its position only at a given point of time and is disturbed beyond the point to time under<br />
consideration."<br />
Short-term equilibrium in reference to a point of time. This equilibrium is more<br />
useful for micro economic analysis.<br />
e.g.. At specific time national income is equal to total national consumption<br />
plus national saving. We can explain in perfect completion, in short-run in given<br />
condition, firm is in normal, profit, abnormal profit & loss condition.<br />
* Long-Term Equilibrium : "Long-term equilibrium is explained in reference<br />
to period of time."<br />
For e.g.. in perfect competition, all firms in industry are in a state of getting<br />
normal profit.<br />
C) Partical Equilibrium & General Equilibrium :<br />
* Partial Equilibrium : "A partial equilibrium is one which is based only on<br />
restricted range of the data. Ex. the price of single product, the prices of all products<br />
being fixed during analysis." Partial equilibrium studies the individual equilibrium i.e.<br />
firm, industry, consumer etc. Marshalling economics is mostly a study in partial<br />
equilibrium analysis. Partial equilibrium also known as micro economics. Partial<br />
equilibrium is concerned with two types of economic problems.<br />
a) It studies only particular aspect of economic behavior of certain individual<br />
firm or industry. It may limit itself to the market for a single product where its price, the<br />
technique, amount of factors of production, are taken into consideration, while all other<br />
factors affecting it are assumed to be constant.<br />
b) It studies only the first-order consequences of the economic events.<br />
We explain, the partial equilibrium with the help of example. e.g.. consumer's<br />
13<br />
B
equilibrium, consumer spends his monetary income on the different goods & services<br />
in such a way, he gets maximum satisfaction. In state consumer's tastes, preference,<br />
income etc. are assumed constant. Partial equilibrium is more useful in Micro<br />
<strong>Economics</strong>. But it is also useful for <strong>Macro</strong> Economic analysis, as changes in equilibrium<br />
affects other elements also.<br />
* General Equilibrium : General equilibrium can be explained with the following<br />
definition.<br />
"General equilibrium for the entire economy could exist only if all economic<br />
units were to achieve simultaneous particular equilibrium adjustments. The concept of<br />
general equilibrium stresses the inter-dependence of all economic units of all segments<br />
of the economy on each other."<br />
Prof. Walras first studied general equilibrium. General equilibrium thinks about<br />
equilibrium of total economy. This concept is very extensive. Economic behaviour of<br />
the elements like manufactures, consumers, business etc. affects each-other, each<br />
moment. It brings changes in all elements in more or less extent - due to change in<br />
one unit. Through these changes, total economy changes towards stable stuation and<br />
general equilibrium achieved.<br />
A economy can be in general equilibrium only if all consumers, all firms, all<br />
industries and all factor - services are in equilibrium simultaneously and they are<br />
interlined through commodity and factor prices. For e.g. price is fixed through equilibrium<br />
between demand & supply. General equilibrium is widely used in macro economics, It<br />
is used for planning for economic development. It has been extended to monetory<br />
theory and welfare economics.<br />
D) Static Equilibrium & Dynamic Equilibrium<br />
* Static Equilibrium :- "A static equilibrium position is based upon the<br />
assumption of the absence of change in the economic phenomena of which it is the<br />
result"<br />
<strong>Macro</strong> - static analysis expllains the static equilibrium position of the economy.<br />
A final position of equilibrium may be shown by equilibrium. It simply shows a time<br />
less identity equation without any adjusting mechanism.<br />
For e.g. level of national income is determined by the interaction of aggregate<br />
supply function and the aggregate demand function. If explain with following equation<br />
Y = c+ I. where Y is the total income, c is total consumption & I is the total saving.<br />
* Dynamic Equilibrium :- "A process through time may be said to be in dynamic<br />
equilibrium if the rates of change in essential variables are constants".<br />
For e.g. population growth, in national income etc. grew in stable rate, it is<br />
called 'Dynamic Equilibrium.<br />
In dynamic equilibrium, not only a study of continuing changes but also of the<br />
process of change. It studies the path of one equilibrium position to another point. It<br />
14
studies the functional relationship of economic variable variables at different points of<br />
time. This is useful for forecasting.<br />
E) Unique Equilibrium & Multiple Equilibrium :-<br />
* Unique Equilibrium :-<br />
" A position of unique eqilibrium arises if there is a single set of prices & quantities<br />
which fulfill the condition of equilibrium."<br />
For e.g. Demand & supply of particular goods become equal at particular price.<br />
That time Unique Equilibrium is formed.<br />
* Multiple Equilibrium :-<br />
" A position of multiple equilibrium arise when several different sets of prices<br />
and quantites will meet the equilibrium conditions."<br />
For e.g. Demand and supply equal at more than one prices then multiple<br />
equilibrium arises. Rapid changes in demand & supply curves because rapid changes<br />
in elasticity of demand & supply.<br />
These types of equilibrium are not independent but they are co - related. These<br />
types are more or less used in macro <strong>Economics</strong> as per necessity.<br />
1.4 Objective Questions :-<br />
A) choose correct alternative & write the sentence again.<br />
1) ______ used the concepts micro <strong>Economics</strong> & macro <strong>Economics</strong> first.<br />
a) Ragner frisch b) Boulding c) Keynes d) Adam smith.<br />
2) The science which studies the whole economy is called _____ <strong>Economics</strong>.<br />
a) Partial b) <strong>Macro</strong> c) Specific d) Micro.<br />
3) The elements which change in number and size in specific period of time<br />
are called _________.<br />
a) Multiplier b) Acceleration c) Variables d) Model<br />
4) The value of variable is explained at a specific point of time is called ____<br />
variable.<br />
a) Flow b) Stock c) Dependent d) Interdependent<br />
5) The value of variable is explained at a specific specific period of time is<br />
called __________ variable.<br />
a) Flow b) Stock c) Dependent d) Independent.<br />
6) _________ first did the study of General Equilibrium.<br />
a) Keynes b) Walras c) Adam Smith d) Ricardo.<br />
7) The state of equilibrium at specific point of time is called ______ Equilibrium.<br />
a) Short-term b) Unique c) Multiple d) Long-term<br />
15
8) A state of equilibrium at a specific period of time is called _____ Equilibrium.<br />
a) Short-term b) Unique c) Multiple d) Long-term<br />
9) Partial Equilibrium is equilibrium of ________ of total economy.<br />
a) one portion b) all elements c) more elements d) less elements<br />
10) When the rate of specific economic element's change is stable, it is called<br />
_______ equilibrium.<br />
a) Static b) Dynamic c) Short-term d) Long-term<br />
B) Answer the following questions in one sentence.<br />
1) Name the two methods of economic analysis.<br />
2) State the definition of <strong>Macro</strong> <strong>Economics</strong>'.<br />
3) Who used. first the concept '<strong>Macro</strong> <strong>Economics</strong>'.<br />
4) Who has first study the General Equilibrium ?<br />
5) Define 'Static Equilibrium.'<br />
6) Give definition of 'Stable Equilibrium.'<br />
7) Which economist's contribution is more important in the development of<br />
<strong>Macro</strong> <strong>Economics</strong> study ?<br />
8) Give definition of 'Flow variable'.<br />
9) Give definition of 'Stock variable'.<br />
10) Name a theory which has importance in <strong>Macro</strong> <strong>Economics</strong>.<br />
* Answers of objective Questions.<br />
A) Choose correct alternative and write the sentence again.<br />
1) - a - Ragner Frisch 2) - B - <strong>Macro</strong> 3) - C - Variable<br />
4) - d - Stock 5) - a - Short - term 6) - b - Walras<br />
7) - a- short-term 8) - d - Long-term 9) - a - One portion<br />
10) - b - Dynamic.<br />
B) Answer the following questions in one sentence.<br />
1) Micro <strong>Economics</strong> and <strong>Macro</strong> <strong>Economics</strong> are two methods, of economic<br />
analysis.<br />
2) <strong>Macro</strong> <strong>Economics</strong> is a branch of <strong>Economics</strong> studyng the relations of large<br />
group like total employment, total saving, total investment & national income.<br />
3) Ragner Frisch first used the concept 'macro <strong>Economics</strong>.'<br />
4) Prof walra first studied 'General Equilibrium'<br />
5) "A static Equilibrium position is based upon the assumption on the absence<br />
of change in economic phenomena of which it is result"<br />
16
6) "Any disturbance in the equilibrium situation is self - adjusting so that the old<br />
equilibrium position is restored is called 'stable Equilibrium.<br />
7) The economist Lord Keynes has an important contribution in the development<br />
of study of '<strong>Macro</strong> <strong>Economics</strong>'.<br />
8) The value of a variable is explained in terms of specific period of time, that<br />
variable is called 'Flow Variable'<br />
9) The value of a variable is explained in terms of specific point of time. That<br />
variable is called 'stock variable.<br />
10) General Employment Theory is an important theory in macro economics.<br />
1.3 Summary -<br />
1) <strong>Macro</strong> <strong>Economics</strong> & micro <strong>Economics</strong> are two methods of Economic analysis.<br />
2) <strong>Macro</strong> <strong>Economics</strong> means a branch of <strong>Economics</strong> which studies the relations<br />
of larger groups like total employment, total saving, total capital, national income etc.<br />
3) <strong>Macro</strong> <strong>Economics</strong> studies total economy, all - round sides of economic life,<br />
main group and aggregate by general equilibrium method.<br />
4) <strong>Macro</strong> <strong>Economics</strong> is called 'science of Income & Employment Theory' and '<br />
science of Income Analysis.<br />
5) <strong>Macro</strong> economics includes general employment theory, Theories of Trade<br />
cycles, Theories of Internal Trade, Theories of currency value, General theory of<br />
Distribution, Theory of consummation, Theories of Investment. etc.<br />
6) In micro <strong>Economics</strong>, the contribution of the economists Malthas, Sismondi,<br />
Karl Mark, Walras, Wicksell, Fischer, Cassel, Robertson, Hayek, Hawtray, Keynes,<br />
etc. is important.<br />
7) <strong>Macro</strong> economic analysis was used in <strong>Economics</strong> from 16th century. In 16th<br />
& 17th century the sects like mercantilist, in 18th century physiocrats & classical<br />
economists used macro economic analysis method. In 19th century Karl Mark and<br />
Maltus, in 20th century Marshal and Keyes, used macro economic analysis method.<br />
<strong>Macro</strong> Economies got popularity as an independent branch of <strong>Economics</strong> due to<br />
economic views of Keynes.<br />
8) Importance of <strong>Macro</strong> <strong>Economics</strong> - i) Helpful to formulating economic<br />
policies. ii) To under stand the work of economy. iii) To solve economic problems<br />
iv) Real analysis v) Useful to achieve economic stability vi) Useful for development of<br />
micro <strong>Economics</strong> vii) Study of dynamic economy viii) International comparison.<br />
ix) Putting economic theories x) Economic development.<br />
9) Limitations of macro <strong>Economics</strong> i) Faults in generalisation ii) Problems in<br />
measurement iii) Lack of homogeneousness iv) Faults in average v) Limitations<br />
regarding policies. vi) Unreal inference vii) Contradictory goods viii) Incomplete analysis<br />
ix) Insufficiency in statistical information.<br />
17
10) The quantity and value of the elements change in specific period of time,<br />
that is called 'variable' Independent' and Dependent' variable are two types of variable.<br />
The value of variables in a group is expressed in reference to a specific point of time<br />
is called 'stock variables' The value of variables in a group is expressed in reference<br />
to specific period of time, it is called 'Flow variables' The variables explaining the<br />
relations or ratio between variables of two groups are called, Ratio variables.<br />
11) Equilibrium is a state of balance in such a way that opposing forces or<br />
tendencies mutually just cancel each other so that the object on which these forces<br />
extend their pressure do not subject to disturbances. Various types of equal brium,<br />
according to time, scope etc. Types of equilibrium as follows - stable, unstable, Neutral,<br />
Short - term, Long - term, partial, General, static, Dynamic, Unique, multiple are the<br />
types of equilibrium.<br />
1-6- Key Terms - 1) Model :- An economic model consists simply of a group or<br />
set of economic relationship, each one of which involves a least one variable that also<br />
appears in at least one other relationship which is part of the model.<br />
2) Variable :- The quantity and size of the elements change in specific period<br />
of time That is called 'variable'.<br />
3) Constant :- The element which does not change in size is called 'constant'<br />
4) Functional Relationship :- The value of variable changes due to change in<br />
one variable is called ' Functional Relationship'.<br />
5) Production Function :- Production function is a physical relationship between<br />
inputs & output in particular production advertises.<br />
1.5 Questions for practice -<br />
A) Write short notes.<br />
1) Origin of <strong>Macro</strong> <strong>Economics</strong>.<br />
2) Importance of <strong>Macro</strong> <strong>Economics</strong>.<br />
3) Limitations of <strong>Macro</strong> <strong>Economics</strong>.<br />
4) Stock & Flow variables.<br />
5) Partial and General Equilibrium.<br />
6) Types of Economic Equilibrium.<br />
7) Meaning of <strong>Macro</strong> <strong>Economics</strong>.<br />
B) Write the answers of following questions.<br />
1) Explain the nature of macro <strong>Economics</strong>.<br />
2) Explain the importance of macro <strong>Economics</strong>.<br />
3) Write the limitations of macro <strong>Economics</strong>.<br />
4) Explain the difference between stock and flow variables,<br />
18
5) What is meant by Equilibrium? Write different types of Economic Equilibrium.<br />
1.7 Books for further Readings -<br />
1) Jagging, M.L- <strong>Macro</strong> Econ<br />
Theory and Policy, macmillon, New York.<br />
5) Shapiro. E.- <strong>Macro</strong> Economic Analysis, Galgotia publications, New Delhi, 1996.<br />
● ● ●<br />
19
Unit – II<br />
'Demand and Supply of Money'<br />
2.0 Objectives<br />
2.1 Introduction.<br />
2.2 Subject Discription<br />
2.2.1 Keynesian approach to demand for money<br />
2.2.2 Don Patinkin's apprach towards demand for money<br />
2.2.3 Milton Friedman's Approach to demand for money<br />
2.2.4 Constituents of money Supply<br />
2.2.5 RBI's measures of money supply<br />
2.3 Summary<br />
2.4 Key words<br />
2.5 Objective questions and their answers. Answers to self learning question<br />
2.6 Questions for self study<br />
2.7 References for furture study<br />
1.0 Objectives,<br />
After studyng the second unit entitled "Demand and Supply of Money" the<br />
students will be able to :-<br />
1) Understand Keynesian approach to demand for money<br />
2) Study the Post Keynesian approach to demand for money with special<br />
reference to Patinkin and Milton Friedman.<br />
3) Examine various approaches towards constituents of money supply<br />
4) Study Reserve Bank of India's approach to measurement of money<br />
supply.<br />
2.1 Introduction :<br />
After studying the first unit which deals with introduction to macro economics,<br />
it becomes essential to study the demand for and supply of money. To know the reasons<br />
behind peoples desire to hold money is an important aspect of macro economics. The<br />
level of demand for money not only determines the rate of interest but also determines<br />
the prices and national income of the economy. Hence in the following part we will<br />
study the Keynsian, Patinkin and Milton Friedmon's approach to demand for money.<br />
Likewise, supply of money also plays an important role in the economy. It plays<br />
a crucial role in the determination of price level and interest rate. Money supply plays<br />
an influential role in the process of economic development and also in the achievement<br />
20
of price stability in the economy. Hence, what constitutes the money supply and what<br />
is RBI's approach to measurment of money supply will be esxplained in this unit.<br />
2.2 Subject Discription :<br />
This unit will deal with the demand and supply of money. It will discuss the<br />
demand for money in Keynsian and post - Keynsian period.<br />
2.2.1 Keynesian approach of demand for money :<br />
The old idea or view about the demand for money was that money was<br />
demanded for carrying out transactions over a period of time. So, according to them<br />
money is a medium of exchange.<br />
Keynes approach to demand for money is based on the following two important<br />
functions namely (i) Medium of exchange and (ii) store of value. Lord John Maynard<br />
Keynes in his world famous book "The general theory of employment interest and<br />
money" explained the demand for money. He has explained the theory of demand for<br />
money by raising two fundamental questions :<br />
i) Why is money demanded ?<br />
ii) What are the determinants of demand for money or liquidity preference.<br />
According to Keynes people hold money in the form of cash which is also<br />
known as liquidity preference with three motives namely :<br />
I) The transactions Motive<br />
II) The precautionary Motive<br />
III) The speculative Motive<br />
I) The Transactions Motive : People need money to carry out day-to-day<br />
transactions but most of them do not receive their income daily. There is hence a time<br />
gap between getting the income but the expenditure has to be done on daily basis. So<br />
when people hold money in cash to fulfill this motive it is called as transaction motive.<br />
The transaction motive is again devided into<br />
a) Income Motive : It refers to the transactions demand for money by the<br />
wage and salary earners. They need this amount of meet their daily expenditure.<br />
b) Business Motive : Business firm require to hold money to meet their day -<br />
to - day transactios. They need money to make payments of various bills such as<br />
electricily, rent, new-material, wages etc.<br />
The amount of money held for transaction - motive depends on the following<br />
factors.<br />
i) Level of Income : Rich people hold larger amount of money than the less<br />
well to-do.<br />
ii) Time interval : Longer the income time interval more is the cash - balance<br />
and vice-versa.<br />
21
iii) The Price level : During inflationary period transaction demand for money<br />
rises due to rising price level.<br />
iv) Volume of employment : When volume of employment and output rise,<br />
the transactions demand for money would rise.<br />
The transactions of demand for money is income - determined and is relatively<br />
stable because income does not change all of a sudden. Also, change in the rate of<br />
interest has no influence on transactions demand for money which is determined by<br />
the level of ecome. Thus, the transactions demand for money is interest inelastic.<br />
However, the trend of a community's aggregate demand for money, under the<br />
transactions motive, depicts a high degree of correlation of proportionality of the size<br />
of money of national income. In symbolic terms, if Lt represents the transactions demand<br />
for money, the money demand function may be stated as !<br />
Lt = f (y),<br />
Where, Y stands for the level of national level.<br />
b) Precautionary Motive : Along with the amount needed for meeting normal and<br />
foreseen expenditures, individuals and business firms will keep additional amount of<br />
money with them to provide protection in the event of emergency. This is the<br />
precautionary motive for holding money.<br />
It is necessary to be cautious about the future which is unlerthin. People suffer<br />
from all sorts of vague doubts and fluctuating status of confidence and courage.<br />
Uncertainty is the important element of the Keynesian precautionary motive.<br />
Demand for precautionary motive; like the transaction motive, also depends<br />
on the level of income. The amount of money kept for this motive varies directly with<br />
income. Rich people will have a larger amount for this motive as against the poor who<br />
may not have enough balance for this purpose. Similarly business firm demand for<br />
money will depend on their turnover. Bigger the firm more will be the amount and<br />
smaller the firm less will be the amount. A firm's precautionary demand for money is<br />
influenced by political uncertainties. When political conditions are unstable, firms tend<br />
to become more cautious and hold a larger amount of cash. The transactions and<br />
precautionary demand for momey is a function of level of income as shown in the<br />
figure drawn below.<br />
Y<br />
Money Income<br />
L 1<br />
=f(y)<br />
O<br />
X<br />
Transactions & Precautionary<br />
demand for money<br />
22
Where, L 1<br />
= Transactions and Precautionary demand for money.<br />
Y = level of income.<br />
Both transaction and precautionary demand for money are based on the role<br />
of money as medium of payment and both are primarily influenced by the level of<br />
income. Keynes clubbed them together. Which is expressued as L 1<br />
= f (y).<br />
The demand for motive for these motives is not influenced by rate of interest.<br />
Hence it is interest inclastic. It is shown by the vertical line ML 1<br />
in the following figure.<br />
Demand for money held under transaction and precautionary motives is known as<br />
demand for "active cash balances".<br />
Y<br />
Rete of Interest<br />
O<br />
C) The Speculative Motive :<br />
L 1<br />
M<br />
Demand for money<br />
The demand for money for speculative motive is related to the "Store of value"<br />
function of money. The speculative demand is also called 'asset demand for money.'<br />
Keynes defines the speculative motive as "the desire of earning profit by knowing<br />
better than the market what the future will bring forth."<br />
All people speculate about the future level of prices of all types of assets and<br />
securities. They will like to hold those securities whose prices they anticipate to rise<br />
and they will hesitate to hold those securities whose prices they fear will decline. This<br />
is the speculative motive for holding money or securities.<br />
Speculative demad for money is interest elastic. At a higher rate of interest<br />
less money is held for this motive and vice-versa. There are two important reasons for<br />
such inverse relationship. First, holdig cash when rate of interest is high has a greater<br />
opportunity cost. Second, there is an inverse relationship between the interest rate<br />
and security prices.<br />
In addition to the above reasons, expectations regarding the market rate of<br />
interest and security prices also play an important role in determining the speculative<br />
demand for money. When the market rate of interest is low, it is expected that the<br />
interest rate will increase in the near futule thus bringing down prices of the securities.<br />
Suchexpectations motivate people of hold more cash. Where as at a very high rate of<br />
interest, there are lo expectations of any further increase therefore, the security prices<br />
are at their lowest, affracting the investers to purchase them. These purchases decline<br />
23<br />
X
the rate of interest and thereby increase security prices.<br />
Demand for money held under the speculative motive is referred to as the<br />
demand for "idle cash balances." Demand for speculative motive depends on the rate<br />
of interest.<br />
Liquidity Trap : The inverse relationship between the rate of interest and<br />
speculative demand for money transforms into a different form of relationship at a<br />
very low rate of interest. Keynes stated that at a very low rate of interest the speculative<br />
demand for money becomes perfectly elastic. Keynes considered a 2 percent rate of<br />
interest as lowest rate, below which the market rate of interest would not decline. At<br />
such low rate of interest people prefer cash and not the securities.<br />
The speculative demand for money, its inverse relationship with the rate of<br />
interest and the liquidity trap are shown in the following figure.<br />
R<br />
Rete of Interest<br />
T<br />
L 2<br />
In the above diagram the L 2<br />
curve is sloping down up to point T indicating<br />
inverse relationship between speculative demand for money and market rale of interest.<br />
At point T the L 2<br />
curve becomes horizontal. The horizantal part of L 2<br />
curve shows the<br />
liquidity trap which explains the perfectly elastic demand for money for speculative<br />
motive.<br />
Total demand for money : The total demand for money arises out of three<br />
motives namely, transaction, precautionary and speculative. Demand for the first two<br />
motives is mainly income determined and interest inelastic. The speculative demond<br />
for money is interest elastic. The total demond is expressed as<br />
Md = L 1<br />
(y) + L 2<br />
(r)<br />
O<br />
Where Md = Demand for money<br />
L 1<br />
(y) = demond for money for transaction and precautionary motive<br />
L 2<br />
(r) = Speculative demand.<br />
Demand for money<br />
In Keynesian terms total demand for money can be experessed as Md = L (yr)<br />
2.2.2 Don Patinkin's approach towards demand for money :<br />
Don Patinkin was born in Chicago on Janary 8, 1922 to Russian Jewish<br />
immigrants, and he died in Jerusalem on August 6, 1955. The intergration of the theories<br />
24<br />
M 1
of value and money was his main contribution developed in his book money, Interest<br />
and Prices.<br />
The Real Balance approach was developed by Don Patinkin by criticising the<br />
cash balance approach of cambridge economists. It was Criticised on two grounds<br />
i.e., 1) homogenity postulate, 2) dicotomisation of goods and money markets. He<br />
integrates these two approaches through the real balance effet. Homogenity postulate<br />
means doubling of money prices will have no effect on the demand supply of<br />
goods.Mathematically, the demand and supply function for goods are homogeneous<br />
of degree zero in price. Dichotomisation means that the relative price level is determined<br />
by the demand and supply of goods, and the absolute price level is determined by<br />
demand and supply of money. Hence, the effect of price has no effect on the monetary<br />
sector and monetary prices in turn has no influence on the real sector of the economy.<br />
He criticised this, and integrated the money market with goods market, which depend<br />
on real balance.<br />
Real balance means the real purchasing power of the cash holdings of the<br />
people. According to him, demand for a commodity depends on both the real balance<br />
and relative prices, hence when the pricelevel rises it will reduce the real balances of<br />
the people and when it falls it will increase the real balances of the people when price<br />
level rises it creates a state of involuntary unemployment but it will not last continuously<br />
because as wages and prices fall the full employment level of output and income will<br />
be restored.<br />
Don Patinkin also introduced the the real balance effect in general equilibrium<br />
analysis. He states that the absolute prices play an important role not only in the<br />
money but also in the real sector. Once the real and monetary data of an economy<br />
with outside money are specified, the equilibrium values of relative prices, the rate of<br />
interest and the absolute price level are simultaneously determined by all the markets<br />
of the economy. It is generally impossible to isolate a subset of markets, which can<br />
determine the equilibrium values of a set of prices. He further pointed out that the real<br />
balance effect implies that people do not suffer from 'money illusion' they are interested<br />
only in the real value of their cash holdings. Hence, Patinkin's analysis is a real<br />
improvement on the traditional quantity theory and its value lies in the integration of<br />
commodity and money market through the real balance effect.<br />
2.3 Milton Friedman's Approach to Demond for money :<br />
In the post Keynesian period the quantity theory of money was explained in<br />
two diferent ways. One way or approach was putforward by Baumol, Tobin and some<br />
other economists. The second was promoted by Friedmain's quantity theory of money.<br />
Milton Friedman classified the holder of money into two groups namely.<br />
(i) Ultimate wealth holders<br />
(ii) Business enterprises.<br />
The group of ultimate wealth holders plays a more significant role than the<br />
25
second group. Friedman emphasises the role of money as an asset which is similar to<br />
Keynsian analysis. Due to which, demand for money becomes a part of capital or<br />
wealth theory which is mainly concerned with portfolio of assets. Friedmans approach<br />
to demond for money is based on the following two assumptions.<br />
(i) Money provides a flow of services to its holder and<br />
(ii) Money is subject to the general principle of diminishing marginal rate of substitution.<br />
The second assumption implies that as the money balances increases, the<br />
marginal service flow of these balances decrease relatively to the returns of other<br />
assets.<br />
Demand of money by ultimate wealth holders :<br />
The households are the ultimate wealth holders. For them money is one form<br />
in which they choose to hold their wealth. Their demand for money is similar to the<br />
demand for durable consumer goods which provides a flow of service. The demand<br />
for money is not for money by itself but a demand for real goods and services through<br />
money. Hence demand for money is for a quantity of real money and not for a nominal<br />
quantity of money. The important determinants of demond for money, accoriding to<br />
Friedman are as follows :<br />
a) Total wealth : According to friedman, total wealth includes both physican<br />
and non-physical or human wealth. Human wealth refers to the present value of the<br />
expected flow of labour income. Here income is used as a substitute for wealth. Where<br />
as, total income includes property income and labour income. Here long term income<br />
is considered as wealth and it is termed as "Permanent income" by Friedman.<br />
b) Human and non-human forms of wealth : Wealth consists of both human<br />
and non-human forms. The persoted earning capacity of people is their human wealth.<br />
According to friedman, fraction of wealth kept in the non-human form is an important<br />
variable in the economy. Smaller part of non-human wealth is held in the form of money<br />
and more in physical assets as it is easter to sell or purchase the physical assets.<br />
c) Rate of return on money and other assets : The desire to hold money or<br />
other assets depends on the expected return and cost of holding them. Money held in<br />
cash brings zero return. It may be negative if it is held in current account which is<br />
subject to service changes. The returns are positive if money is held in saving deposits.<br />
The return on physical assets depents on their yield and cost of storage and also the<br />
expected changes in their nouinal prices. The prices of bonds refer to the expected<br />
change in price resulting in gain or loss.<br />
d) Other variables : In addition to the above factors there are two other variables<br />
that determine the utility of money. They are 1) Services rendered by money in<br />
comparison to other assets. These services are mainly in the form of advantages of<br />
liquidity and transaction conveninces.<br />
2) Degree of economic stability expected to prevail in future :<br />
Friedman's demond function for money can be expressed with the help of<br />
26
following equation :<br />
M<br />
= f (y.w.rm.rs.re.Pe.u)<br />
P<br />
Where,<br />
M = Demond for nominal money<br />
P = General Price level or price index<br />
M<br />
= Demand for real money i.e. real cash balance.<br />
P<br />
Y = Real income<br />
W = Fraction of wealth in non-human form<br />
rm = Expected rate of return of money<br />
r s<br />
= Expected rate of return in fixed value securities including expected changes in<br />
their prices<br />
r e<br />
= Expected rate of return on equities including expected change in their prices.<br />
P e<br />
= Expected rate of change of price of goods<br />
u = other variables affecting the utility derived from the services of money.<br />
Demand for money by business firms :<br />
Money is a capital item for business firms. It can be easily converted into any<br />
input required for the business. According to Friedman, the demand function for money<br />
of the ultimate wealth holders can be applied to the business firm with the following<br />
changes.<br />
- Total wealth is not the main consideration for the business firms as they can<br />
raise additional money from capital market. Instead, Friedman suggest, to substitute<br />
'scale' for total wealth.<br />
- Classification of wealth between human and non - human forms has no<br />
relevance to business enterprises.<br />
- Cost of holding money balances is important for ultimate wealth holders as<br />
well as for business firms. But different variables that affect the returns or cost are not<br />
of equal in portance.<br />
- Variables falling under 'u' in the equation are equally important for both expect<br />
some exceptions.<br />
With the above modifications and by excluding 'w' (Wealth in non-human form),<br />
the demand function for money by business firm remains the same.<br />
Miltan Friedman's theory of demand for money is considered as modern quantity<br />
theory of money.<br />
2.2.4 Constituents of Money Supply :<br />
Money supply refers to the amount or stock of money held by people in<br />
27
spendable form. Money supply plays an important role in the formulation of economic<br />
policy. It refers to the total stock of domestic means of payment owned by the public in<br />
a country. This definition includes money held by the public and in circulation but it<br />
does not include money held by the central Bank, Commercial Banks and the state<br />
treasury because they are money-creating agencies. Money held by them is not in<br />
actual circulation in the country. So the stock of money held by the public in a spendable<br />
form alone constitutes the money supply at a given point of time.<br />
The main constituents of money supply are as follows :<br />
Economists are not unanimous about the constituents of money supply. There<br />
are different views about it. Yet, they can be broadly classified into the following two<br />
parts :<br />
(i) Traditional measure - (Narrow money)<br />
(ii) Modern measure (Broad money)<br />
i) Traditional Measure or Narrow Money : Money is basically a medium of<br />
exchange or means of payment. Hence, according to the traditional approach, the<br />
stock of money should include such items that can be spent immediately. On this<br />
basis, the components of money supply can comprise only of those things which are<br />
readily accepted as a medium of exchange. Currency (coins and notes) and demand<br />
deposits with the bank are the liquid form of money which are readily accepted by<br />
everyone as a medium of exchange. Demand deposits only in the banks are treated<br />
as money because payments can be done by drawing cheques against them. Time<br />
deposits are not included in the traditional measure of money supply because cheques<br />
cannot be drawn against them.<br />
The traditional money is also called as 'narrow money.' It is called narrow money<br />
because components of money supply are confined to currency and demand deposits<br />
only. some economists call it 'transaction money' because it is used for transaction.<br />
M 1<br />
= C+DD<br />
The traditional measure of money supply is expressed as follows :<br />
Where M 1<br />
= Traditional measure or Narrow Money.<br />
C = Currency (coins & Notes)<br />
DD = Demond deposits (Chequeable deposits)<br />
ii) Modern Measure or Broad Money : The broad money concept includes all<br />
the very close substitutes of money in the measure of money supply. Economists like<br />
Milton Friedman, Gurley John G, Shaw Edwards and Radcliff committee are closely<br />
associated with the modern approach.<br />
a) Milton Friedman : According to him the money supply concept is wider and<br />
includes savings and time deposits with Commercial banks, because, time deposits<br />
can be made available for spending purposes with limited cost.<br />
b) Gurley - Shaw : According to him money supply is measured as weighted<br />
28
average of currency, demand deposits and near-money assets.<br />
c) Central Bank :According to the Central Bank approach, all the funds lent<br />
by a number of financial institutions are included in the total money supply.<br />
The modern measure of money consists of M 1<br />
and other liquid assets or near<br />
money. It consists of saving deposits with restriction on the amount and number of<br />
withdrawals. In India they are in the form of the following :<br />
a) Post Office Saving Bank deposits,<br />
b) Time deposits with banks which can be withdrawn with prior notice and<br />
penalty interest,<br />
c) Government securities, bonds and other financial asseets,<br />
d) Credit, representing all debt of domestic non-financial sectors in the form of<br />
mortgages, bonds and similar instruments since the broad money concept includes all<br />
the aspects mentioned above, it can be expressed as;<br />
M 2<br />
= M 1<br />
+ a + b + c<br />
where M 2<br />
= modern measure or broad money. The items included in M 2<br />
differ in liquidity<br />
as the liquidity declines from a to d. Accordingly the broad money can be sub-divided<br />
into M 2<br />
, M 3<br />
and M 4<br />
M 2<br />
= M 1<br />
+ a + b<br />
M 3<br />
= M 2<br />
+ c<br />
M 4<br />
= M 3<br />
+ d<br />
It should be noted that there is no unanimity about the exact components of<br />
modern measure of money. Monetary authorities of each country decide the items to<br />
be included depending upon their impact on economic activities.<br />
2.2.5 Reserve Bank of India's measures of Money Supply :<br />
Since 1977 the Reserve Bank of India, India's Central Bank adopted a new<br />
measure of money supply. Before that, till 1967-68 its measure of money included<br />
only currency and demond deposits (M). From 1967-68 to 1977 it adopted a broader<br />
measure of money supply which was called as Aggregate Monetary Resources (AMR).<br />
The new measure of money supply is stated as follows :<br />
a) M 1<br />
= C + DD + OD<br />
where C = Currency held by the public (Currency in circulation and cash in hand of all<br />
banks)<br />
DD = Demand deposits with all commercial and institutions, foreign Central Banks,<br />
foreign government and the World Bank.<br />
OD = other deposits with all RBI.<br />
The part of OD in total money supply is very small, M 1<br />
has the highest liquidity.<br />
M 1<br />
is useful in formulation of monetary and fiscal policies.<br />
29
) M 2<br />
+ M 1<br />
+ SD<br />
SD = Savings bank deposits with past offices. SD are more liquid than time<br />
deposits<br />
c) M 3<br />
= M 1<br />
+ TD<br />
TD = Time deposits with all Commercial banks and Co-operative banks<br />
(Excluding inter banking deposits). M 3<br />
is a broad money concept.<br />
d) M 4<br />
= M 3<br />
+ TDP<br />
TDP = Total deposits with the post offices (excluding National Saving<br />
Certificates)<br />
The RBI has taken a broad measure of money supply by bringing in total deposits<br />
from post offices, but Post Office deposits are less liquid than the deposits of Commercial<br />
banks. RBI's M 1<br />
measure is conceptually the same as the traditional concept of money<br />
supply. For all policy decisions M 3<br />
is a more relevant measure of money supply.<br />
RBI's measure of money supply - 1998 : The working group of RBI since<br />
1998 has redefined the parameters for measuring money supply. A change is introduced<br />
in M 2<br />
and M 4<br />
is totally abolished. Accordinly, now there are only three monetary<br />
aggregates that is - M 1<br />
, M 2<br />
and M 3<br />
.<br />
M 1<br />
= C + DD + OD<br />
M 2<br />
= M 1<br />
+ time liability portion of savings deposits with banks + CDs issued by bank +<br />
term deposit maturing within one year.<br />
M 3<br />
= M 2<br />
+ Term deposits over one year maturity + call / term barowings of banks.<br />
RBI introduced a new concept of liquid resources on the line of broad money.<br />
They are as follows :<br />
Liquidity Aggregate :<br />
Liquidity aggregates consist of L 1<br />
+L 2<br />
+L 3<br />
that is L A<br />
= L 1<br />
+ L 2<br />
+ L 3<br />
where L A<br />
= Liquidity Aggregates.<br />
L 1<br />
= New M 3<br />
+ All deposits with Post offices savings banks (excluding NSCs)<br />
L 2<br />
= L 1<br />
+ term deposits with term lending institutions + term barrowings of FIs + CDs<br />
issued by FIs<br />
L 3<br />
= L 2<br />
+ public deposits of NBFCs.<br />
The concept of L A<br />
is wider than the revised money supply measure.<br />
2.3 Summary :<br />
In this unit we understood various concepts related to demand for and supply of money.<br />
John M. Keynes in his approach to demand for money states motives of liquidity<br />
preference namely transaction, precautionary and speculative. Out of these the<br />
transaction and precautionary motive are interest inelastic, where as the speculative<br />
motive is interest elastic.<br />
30
In the post keynesian approach Don Patinkin's and Milton Friedmans views have<br />
been studied. The real balance approach developed by Don Patinkin integrates the theary<br />
of value and money. According to him, demand of a community depends on both the real<br />
balance and relative prices, hence when the price level rises it will reduce the real balances<br />
of the people and when it falls it will increase the real balances of the people.<br />
In his approach Milton friedman classified the holders of money into two<br />
groups viz. i) Ultimate wealth holders and ii) Business enterprises. The group<br />
of ultimate wealth holders play a more significant role than the second group.<br />
Further, the demond for money by ultimate wealth holders depends upon total<br />
wealth, human and non-human forms of wealth, rate of return on money and<br />
other assets.<br />
After discussing the concept of demond for money, the money supply concept<br />
has been discussed. Money supply refers to the amount or stock of money held by<br />
people in spendable form. The constituents of money are broadly classified into<br />
traditional measure and modern measure. The traditional measure is also called as<br />
narrow money and the modern measure is terned as broad money.<br />
The RBI's measure of money supply consists of three monetary aggregates<br />
namely M1, M2 and M3. RBI also introduced a new concept of liquid resources on the<br />
lime of broad money that is L A<br />
= L 1<br />
+ L 2<br />
+ L 3<br />
.<br />
Hence in summary we can state Walker's definition of money "Money is what<br />
money does."<br />
2.4 Key words :<br />
1) Speculative motive : Money held with a motive to make or earn money,<br />
hence it is interest elastic.<br />
2) Liquidity trap : It is the very low rate of interest where speculative demand<br />
for money becomes perfectly elastic.<br />
3) Ultimate wealth holders : Households<br />
4) Demand for money by business firms : Money is a liquid capital which<br />
can be easily be converted into any input - required for the business.<br />
5) Supply of money : The total stock of domestic means of payment owned<br />
by the public in a country.<br />
6) Narrow Money : It includes components of money supply which comprise<br />
only of those things which are readily accepted as a medium of exchange.<br />
7) Broad Money : It includes all very close substitutes of money in the measure<br />
of money supply.<br />
2.5 Objective Question :<br />
a) Fill in the Blanks.<br />
1) The .......... motive of demand for money is income elastic.<br />
31
2) There is an ........ relationship between the rate of interest and speculative<br />
demand for money.<br />
3) The real Balance approach was developed by ...........<br />
4) Milton Friedman classified the holder of money into ...... groups.<br />
5) Money is a ............. item for business firms.<br />
b) Answer in one sentence.<br />
1) According to the liquidity preference theory there are how many motives for<br />
demand for money ?<br />
2) In how many ways is the broad money divided ?<br />
3) In which year did RBI redefine the parameter of measuring money supply?<br />
4) What does liquidity aggregate consist of ?<br />
5) Is transaction motive of demand for money interest elastic ?<br />
c) Answer to Objective questions :<br />
a) 1) Speculative 2) Inverse 3) Don Patinkin<br />
4) Two 5) Capital<br />
b) 1) Three 2) M2, M3 & M4 3) 1998<br />
4) L1, L2, L3 5) NO.<br />
2.6 Questions for sell study :<br />
a) Answer the following questions.<br />
1) Examine fully the liquidity prefernece theory.<br />
2) Explain Milton Friedman's quantity theory of money.<br />
3) State the Reserve Bank of India's approach to measurement of money supply.<br />
b) Write short notes.<br />
1) Liquidity trap<br />
2) Don Patinkin's approach to demand for money<br />
3) Narrow money<br />
4) Broad Money<br />
2.7 References for further Study.<br />
1) Modern <strong>Economics</strong> - H. L. Ahuja, (2010) S. Chand & Company New Delhi<br />
2) Modern Economic Theory - K. K. Dewett (2010)<br />
3) <strong>Macro</strong> <strong>Economics</strong> - Mascarenhas, Johnson, Himalaya Publishing House,<br />
Mumbai<br />
4) Indian Economy - Datta Sundaram (2009) S. Chand & Campamy New Delhi,<br />
● ● ●<br />
32
Unit – III<br />
'Theories of Consumption'<br />
3.0 Objectives<br />
3.1 Introduction<br />
3.2 Analysis of the unit.<br />
1. Keynesion psychological law of Consumption.<br />
2. Relative Income Hypothesis<br />
3. Life Cycle Hypothesis<br />
4. Permanent Income Hypothesis.<br />
3.3 Summary<br />
3.4 Glossary<br />
3.5 Objective questions and their answers.<br />
3.6 Questions for practice.<br />
3,7 Books for further reading.<br />
3.0 Objectives<br />
After the study of this Unit No. 3, you will be able to know :<br />
* The meaning and nature of the concept consumption.<br />
* Keynes' psychological law of consumption function.<br />
* The detail information about relative income hypothesis<br />
* The concept of life-cycle hypothesis.<br />
* The meaning of permanent income hypothesis.<br />
3.1 : Introduction<br />
<strong>Macro</strong> <strong>Economics</strong> deals with the interelationship between the various factors<br />
of an economy as a whole, Now-a-days it is necessary to study, the changes in<br />
1) production, employment, demand and general price level at a national level. The<br />
concept of consumption is important in this all contents of macro - economics, we<br />
have considered the detail information about the demand and supply of money and<br />
their approaches in unit number 2. In this particular unit number 3, we will take up the<br />
33
detail information about Keynes psychological law of consumption function, relative<br />
income hypothesis life - cycle hypothesis and permanent income hypothesis. All these<br />
contents related to consumption function are important in macro - economic analysis.<br />
3.2 Analysis of the unit :<br />
The present unit No - 3 includes 4 different types of contents. They are Keynes<br />
psychological law of consumption function, relative income hypothesis, life - cycle<br />
hypothesis and permanent income hypothesis, The details are as follows.<br />
3.2.1 Keynes' psychological law of consumption function :<br />
The concept of consumption function plays an important role in his employment<br />
and income theory. Keynes wrote a book entitled 'The theory of employment, interest<br />
and money' in 1936, According to Keynes, the functional relationship between income<br />
and consumption is known as consumption function. We can explain this concept with<br />
the following formula.<br />
C = f (y)<br />
Here C = Consumption<br />
f = functional relationship.<br />
y = Income.<br />
According to Hansen, Keynes has given important contribution to the<br />
consumption function.<br />
* Keynsian psychological law of consumption function : Keynes has stated<br />
psychological law of consumption function in the following manner.<br />
Other things being same, as income increases, consumption increases but<br />
not by as much as the increase in income. In another words, marginal propensity to<br />
consume is less than one.<br />
The above statement of consumption function is based on the following 3 basic<br />
assumptions.<br />
a) Constant psychological and institutional frame work : Keynes assumes<br />
that the factors affecting consumption function in short-run period are constant. These<br />
factors are distribution of income, tastes and traditions of the people, prices of<br />
commodities etc. do not change during this period.<br />
b) This law is applicable in normal position of an economy.<br />
c) Keynes law of consumption function becomes truth in free capitalistic<br />
economy.<br />
Now we will consider this law in detail.<br />
Keynes' law of consumption function describes the relationship between income<br />
and consumption. The table No. 3.1 clears the psychological law of consumption<br />
function in respect of changes in income, consumption and savings.<br />
34
Table No. 3.1<br />
Consumption function<br />
(Rs. in Crores)<br />
Income Consumption Savings (y-c)<br />
0 40 -40<br />
60 70 -10<br />
80 80 0<br />
120 100 20<br />
150 115 35<br />
175 130 45<br />
200 140 60<br />
Table No. 3.1 clears that as the income increases, the consumption increases<br />
but it increases less than increase in income. When income increases the savings<br />
also increase due to marginal propensity to consume is less than one. The table also<br />
shows that as income increases from crores 0 to 200 crores, Consumption increases<br />
from Rs. 40 Crores to Rs. 140 Crores and savings also increases from Rs. 20 Crores<br />
to Rs. 60 Crores. We can explain this concept of Keynesian psychological law of<br />
consumption function with the help of following figure No. 1.<br />
Y<br />
Z<br />
Consumption Expenditure<br />
C<br />
O<br />
45 0<br />
P<br />
N<br />
Income<br />
C 1<br />
X<br />
Figure No. 3.1 shows us the trend of increasing level of income and consumption<br />
expenditure. Here we observed that as per increase in income of a country, consumption<br />
expenditure increases but with low protortion indicates that since the 'P' point as per<br />
increase in income, consumption decreases and savings increases. Keynes says that<br />
this happens due to the psychology of a consumer.<br />
35
3 Important conclusions of Keynes' psychological law of consumption function:<br />
There are 3 important findings of the Keynes' law of Consumption function.<br />
They are as follows.<br />
1) When the aggregate income increases aggregate consumption expenditure<br />
also increases but by same what smaller amount. The basic cause behind it is that of<br />
increase in income, the primary wants and expenditure an it has been fulfilled.<br />
2) An increase in aggregate income will be divided into 2 parts i.e. consumption<br />
and savings. When entire income is not spent on consumption, the part of that is<br />
saved.<br />
3) As per increase in aggregate income, both consumption and savings<br />
increases. It seems that, increase in income leads to increase in consumption as well<br />
as saving.<br />
* Importance of Keynesian Consumption Function :<br />
Keynes' concept of consumption function is useful in macro-economic analysis.<br />
This law is important in theory as well as in practice. Prof. A. H. Hansen has remarked<br />
that Keynes' concept of consumption function for the formulation of macro-economic<br />
policy. Now we will see the importance of this concept.<br />
1) The concept of consumption function hightlights the importance of investment.<br />
Keynes says that investment and consumption are the two important factors of theory<br />
of employment. The total volume of employment depends upon the level of consumption<br />
expenditure and investment. The psychological law of consumption function devotes<br />
that when in crease in income does not enhance the consumption expenditure, there<br />
is a greater need of investment.<br />
2) This law helps to invalidate say's law of markets, Keynes' consumption<br />
function effectively contradicts says law of markets due to the problems arises in the<br />
equilibrium between demand and supply. Keynes says that say's law of market is not<br />
useful now - a - days, because when consumption expenditure does not increase as<br />
per increase in income, the problem of overproduction and unemployment arises. The<br />
Government has to solve this critical situation by stimulating consumption and<br />
investment.<br />
3) Keynes' law of consumption gives us more explanation about the turning<br />
point of business cycle. He says that MPC is always less than one. Due to this, the<br />
phases of trade cycle arises in a economy. This law also gives us the explanation<br />
about rising the phases of boom, recession and recovery.<br />
4) This concept of consumption function helps to explain the process of income<br />
agreation through additional income generated in a economy with the rising trend of<br />
savings.<br />
5) The concept of consumption function gives the explanation about decreasing<br />
trend of marginal efficiency in a country. Keynes says that consumption expenditure<br />
doesn't increase as per increase in income due to MPC is less than 1. So that beyond<br />
36
a limit, marginal efficiency of capital decreases due to less demand, consumption and<br />
the level of production in a economy. This decreasing trend of MEC affects the economic<br />
development of a economy.<br />
In this way, Keynesian law of consumption function is useful in a developing as<br />
well as developed countries in the world.<br />
3.2.2 Relative Income Hypothesis :<br />
Keynes has explained the relationship between rise in income and consumption<br />
in his book 'The general theory of employment, interest and money' in 1936. Since<br />
Keynes propounded his theory of consumption function, Kuznets, Duesenberry, Brandi<br />
and Rose Frenchman has shown some empirical evidences in respect of changes in<br />
consumption function by the various hypothesis. Relative income hypothesis is one<br />
on them.<br />
An American Economist J. S. Duesenberry put forth the Relative Income<br />
Hypothesis in his book entitled, 'Income, saving and the theory of consumer behavior<br />
in 1949.' According to him the consumption of a person doesn't depend on his current<br />
income, but on a certain previously reached income level.<br />
* Explanation of hypothesis : According to Duesenberry's relative income<br />
hypothesis, consumption of a individual is into the function of his absolute income but<br />
of his relative position in the income distribution in a society. It means the consumption<br />
of a person is not determined himself only but it depends on other people's income<br />
level. Duesenbenry says that, average propensity to consume will remain the same<br />
despite the increase in his absolute income. The basic cause behind it is the<br />
demonstration effect. According to Duesenberry, the consumption of an individual does<br />
not depend on relative income, but it determined by the habits of consumption and<br />
standard of living of other persons.<br />
* Demonstration effect and change in consumption level : Duesenberry<br />
has given an explanation about, the effect of demonstration on individuals or households<br />
consumption. The relative income hypothesis suggests that individuals or households<br />
try to imitate the consumption levels of their neighbors. This is called demonstration<br />
effect or Duesenberry effect. Duesenbeory says that poor families always try to increase<br />
their consumption by attracting the consumption level of rich people of their nelghbours.<br />
We find such type consumption level of poor families in a society who try to imitate the<br />
consumption pattern of others. This happens in respect of rich clothes, quality food<br />
and other luxurious goods like two-wheeler or four-wheelers demand. Duesenberry<br />
says that due to this demonstration effect tendency of poor people's consumption of<br />
high prices commodities is increasing in a developing countries mostly.<br />
* Ratchet Effect : The other significant part of Dueseuberry's relative income<br />
hypothesis is related to ratchet effect. He says that when income of individual falls, his<br />
consumption does not fall much due to the past habits of consumption. According to<br />
Duesberry, the people try to maintain their consumption at the highest level attained<br />
earlier. This is happening partly due to the demonstration effect. He also says that it is<br />
37
difficult to reduce the consumption expenditure for poor people when their level of<br />
income falls. So they maintain their earlier level of consumption by reducing their<br />
savings and past amount of savings. Several studies tell us that the level of consumption<br />
does not fall as per decrease in income particularly in a recession period. We can<br />
explain this situation of ratchet effect with the help of following figure No. 3.2.<br />
Y<br />
Consumption & Savings<br />
O<br />
Figure No. 3.2<br />
Duesenberry Ratchet Effect.<br />
Y=C+S<br />
C1 0<br />
C SR C 1<br />
C 0<br />
Y 0<br />
Y 1<br />
Disposable Income<br />
The figure No. 3.2 shows us the level of consumption expenditure and<br />
disposable income. We assume that there is steady growth of disposable income till it<br />
reaches Y 1<br />
. The linear consumption function C LR<br />
is the long-run consumption function<br />
which is shown in the figure Y 1<br />
level of disposable income.<br />
Now suppose with initial income level Y1, there is recession in the economy with<br />
the result that disposable income falls to the level Yo. Duesenberry says that consumption<br />
would not fall greatly to the level of Yo Co as the long-run consumption functional curve<br />
CLR. In their bid to maintain their consumption level previously reached, people would<br />
now save less and reduce their consumption level only lightly to Yo C'o is on the shortrun<br />
consumption function curve CSR. According to Duesenbery, when the economy<br />
recovers from recession and the disposable income increases, the economy will move<br />
along the short-run consumption level C1 is reached at income level Y1.<br />
Thus, relative income hypothesis denotes the relationship between disposable<br />
income and expenditure. The various critics have made comments on this pyopoiesis.<br />
According to these critics, the demonstration effect and ratchet effect do not change<br />
the level of income of a individual by all the times. This hypothesis does not considered<br />
the size of wealth and changes made in it which affect on the level of consumption<br />
expenditure. According to Tobin and Freedman, wealth is a basic cause of variation in<br />
saving. In short, this hypothesis has focused on the changes in income, habits of<br />
consumption, demonstration effect and ratchet effect toward the level of an individuals<br />
38<br />
Long-run<br />
Consumption function<br />
C LR<br />
Short-run<br />
Consumption function<br />
X
or households in short and long-run period, so that this hypothesis has a practical<br />
value in macro-economic analysis.<br />
6.2.3 Life cycle Hypothesis :<br />
An important post-Keynesian theory of consumption function has been<br />
developed by Franc Modiglani and Albert Ando, which is known as life Cycle Hypothesis.<br />
This hypothesis is also known M.B.A. approach. Franco Modiglani and Audo have<br />
explained this theory in a essay entitled. "The Life Cycle Hypothesis of Saving,<br />
Aggregate Implications and Tests" in a journal of American Economic Review in 1963.<br />
This hypothesis is a modification of absolute and relative income hypothesis. This<br />
hypothesis depends on individual Utility Maximisations.<br />
According to life cycle hypothesis, consumption in any period is not the function<br />
of current income of that period, but of the whole life time expected income, we can<br />
explain this hypothesis with the following formula -<br />
Ct = KVt<br />
Here Ct = Current Consumption<br />
K = equal relationship.<br />
Vt = Current value of expected income of an individual in a life<br />
Thus, in this particular hypothesis, the individual is assumed to plan a pattern<br />
of consumption expenditure based on expected income in their entire life. This<br />
hypothesis further assumed that individual maintains a more or less constant or slightly<br />
increasing level of consumption. This level of individual's consumption is limited by his<br />
expectations of lifetime income.<br />
According to Modiglani and Ando, consumption of an individual in a particular<br />
movement depends on the following 4 factors.<br />
A) Current income, B) Savings of previous period, C) Expected income, D)<br />
Current age of an individual.<br />
The life cycle hypotheses is determined with the help of above mentioned<br />
factors in the following equation.<br />
C t<br />
T = K t<br />
T (YL) Tt + (N-T) Y L<br />
e) T t<br />
W t<br />
T-1)<br />
Where as -<br />
C = Consumption t = Period<br />
T = Current age of an individual<br />
N = Period of income<br />
K = Ratio<br />
Y L<br />
= Current labour - income of an individual<br />
Y e<br />
L = future expected labour income of an individual.<br />
W = Net property of individual.<br />
39
In this way, life cycle hypothesis depends upon the various factors. According<br />
to Modigliani, people make their consumption plans for their entire lifetime and further<br />
they make their lifetime consumption plans on the basis of expectations of lifetime<br />
income.<br />
* Impact of age on consumption : Modigliani says that the impact of permanent<br />
income of an individual to the marginal propensity to consume depends upon the age<br />
and size of family. The consumption pattern of an individual also depends on the life<br />
span of a person. Modigliani says that in a childhood or early period a person expends<br />
more than his income by borrowing from others, but in the middle age, income of a<br />
person increases beyond his consumption and finally at the age of 60 and above<br />
income level declines due to referencing age and consumption continues with the<br />
earlier rates. Thus, age factor is one of the important factors which determines the<br />
level of consumption of a person in his lifetime.<br />
Modigliani also mentioned the size of family factor affects on consumption<br />
expenditure of a person in his life time. In the middle age of a family (30 to 60) size of<br />
members in a family increases, due to this, the total consumption expenditure also<br />
increases. Now we will see the impact of age and size of family on the consumption<br />
pattern of households with the help of figure No. 3.3<br />
Figure No. 3.3<br />
Life cycle hypothesis of consumption function (Impact of age & size of family)<br />
Consumption & Income<br />
Y<br />
H<br />
K<br />
Dis-saving<br />
N<br />
Savings<br />
Ct<br />
C > Y<br />
Yt<br />
Dis-saving<br />
Income<br />
Curve<br />
O 20 30 60 75<br />
Life time (years)<br />
X<br />
Figure No. 3.3 shows us the impact of age and size of family on the level of<br />
consumption of households here, the figure indicates that, upto the age of 30, person's<br />
income is less than his expenditure on consumption. Ct line clears the level of<br />
consumption where as Yt curve denotes the income level, We find that upto the age<br />
30, a person's income (ok) is less than his consumption (OK). But after the age of 30<br />
to 60, his income is greater than consumption. The shaded portion of figure (M to N)<br />
40
indicates the savings of a person or household. In the middle age of households, the<br />
size of family members and income level both increases.<br />
The figure shows us that after the age 60 to 75 lifetime, the consumption of a<br />
person again increases than his income level. Here, we observed that whichever<br />
amount a person saves in his middle age should be utilised for excess consumption in<br />
the retirement age of his life. It is further assumed in the life cycle hypothesis, that net<br />
savings in the lifetime of a person is zero.<br />
* Short-run and long-run consumption function : Ando and Modigliani have<br />
expressed realistic findings based on fieldwork done by then in America. They have<br />
given an explanation of short and long-run consumption level of different age group<br />
people of low income. This function has been estimated taking time series data for the<br />
country U.S.A. The estimate tells us that, in America there was high level of<br />
consumption in low income group at their retirement age (after 60) on large scale. On<br />
the contrary, there was large number of middle age group youths in America whose<br />
average propensity to consume was relatively low. It is because of increase in income<br />
decreases the consumption in short-run period. But in long-run period, average<br />
propensity to consume was larger i.e. 0.72 as well as constant. These observation<br />
based findings have been shown in the figure No. 3.4<br />
Y<br />
N LR<br />
N1 SR<br />
N SR<br />
Consumption<br />
A1<br />
A<br />
AN<br />
AN1<br />
Short-run Consumption<br />
Function<br />
OC - Long-run Consumption Function<br />
O<br />
Income<br />
X<br />
Figure No. 3.4 shows us the level of short and long-run consumption level.<br />
Ando and Modigliani observed in America that, there was 0.6 short run consumption<br />
level where as in long-run it was 0.72. The long run consumption level was stable and<br />
constant. This was happened due to the increasing trend of income and consumption<br />
41
tendency of low and high level income groups A.P.C.<br />
Thus, life cycle hypothesis of consumption denotes the level of consumption<br />
and income in short and long-run period. This hypothesis seems to be quite realistic<br />
and posible. It may be noted that this hypothesis income as derived from wealth. It<br />
also attracts towards the facts of consumer behavior in respect of level of consumption<br />
in short and long-run period and the affecting factors of it. It doesn't mean that the life<br />
cycle hypothesis don't have defects. According to critics, it is highly impossible to<br />
determine consumption plan as stated by Ando and Modigliani. According to Ackley,<br />
the possession of this vision on the part of households sounds unrealistic This<br />
hypothesis has also failed to recognise the importance liquidity constraints in<br />
determining the response of consumption to income, As a result, the consumption<br />
becomes highly responsive to current income which is quite contrary to the life cycle<br />
hypothesis.<br />
3.2.4. Permanent Income Hypothesis -<br />
The permanent income hypothesis has been put forwarded by well - known<br />
American economic milta Friedman in his book entitled 'The Theory of consumption<br />
function in 1957, Though life cycle hypothesis and permanent income hypothesis have<br />
some common fenthies, this hypothesis Milten Freedman says that " consumption is a<br />
function of long term income of consumer According to permanent income hypothesis,<br />
average consumption level depends on expected long-run permanent income,<br />
Freedman has given two different concepts of permanent temporary income and<br />
consumption for the explanation of this hypothesis, Now we will consider these concepts<br />
in detail,<br />
Permanent Income - Permanent income is income of a person with in the<br />
long-run period which fulfils all types of consumption needs of him or her. This income<br />
relies of households expected future income.<br />
B) Temporary income - Temporary or transitory income that is not going to<br />
persist in future periods. Temporary income may be more, or less than the permanent<br />
income, because it is related to profit and loss or extra work donel by a person.<br />
C) Permanent consumption - The permanent consumption is the long term<br />
consumption of an individual which depends on permanent income,<br />
D) Transitory consumption - Transiting or temporary consumption is the shortrun<br />
period consumption, According to Freedman, transiting consumption may be more<br />
or less than the permanent income of an individual,<br />
The above mentioned 4 concept of permanent income hypothesis can be<br />
explained by the following formulas-<br />
I) Y = Yp +Yt Y = Income Yp = permanent income<br />
t = temporary income<br />
II) C = Cp+Ct C - Consumptions = permanent<br />
Consumption & Ct = temporary consumption<br />
42
According to Freedman, consumption is proportional to permanent income.<br />
We can show this relationship between permanent income and permanent consumption<br />
with the help of following formula.<br />
CP = KY p<br />
Where C p = Permanent Consumption<br />
Y p = Permanent Income<br />
and K = proportion of permanent income that is consumed.<br />
Here Friedman also mentioned that as per his classification of permanent and<br />
temporary income and consumption there are two types of commodities i.e. durable<br />
and perishable. Durable goods are connected with the stock of capital available to the<br />
consumer where perishable goods are the consumption goods. Perishable goods are<br />
consumed by the consumers frequently.<br />
* Short-term and Long-term Consumption function : Milton Friedman has<br />
given short-run and long-run consumption function through the concepts of permanent<br />
and transitory income as well as consumption. He also says that the relationship<br />
between income and consumption in short-run, this relationship is proportionate. Now<br />
we will see the impact of income on consumption of a family in short and long run<br />
period with the help of Figure No. 3.5<br />
Y<br />
Figure No. 3.5<br />
Short and Long-run Consumption function<br />
C LR<br />
Long-run Consumption<br />
Function<br />
C SR2<br />
E 2<br />
Consumption<br />
E 1<br />
C SR1<br />
Short-run Consumption<br />
Function<br />
E 0<br />
Y 1<br />
O<br />
Disposable Income<br />
Milton Friedman's permanent income hypothesis is shown in the figure No. 3.5<br />
C SR1<br />
and C SR2<br />
are the short-run consumption function curves where as OC LR<br />
is shown<br />
as a long-run consumption function curve. In short run period, the changes in<br />
consumption and income are not-proportional relationship. But in a long run duration,<br />
we observe the proportional relationship between consumption and income with a<br />
straight line passing through the origin where APC = MPC.<br />
43<br />
X
Thus, Friedman has explained permanent income hypothesis with the various<br />
concepts related to permanent and temporary income as well as consumption, This<br />
hypothesis is similar to life cycle hypothesis. It gives an explanation about the functional<br />
relationship between consumption and income in short-run and long-run period.<br />
The permanent income hypothesis is criticised by two ways. Firstly, Friedman<br />
has given stress on expected income and long-run period. But according to modigliani<br />
in practical world people do not determine their consumption based on expected income.<br />
Secondly, it is not true about the relationship of temporary consumption and income<br />
as per Friedman's rule. According to critics, transitory income increases the temporary<br />
to consumption. Apart from these two critics, According to Evince, permanent income<br />
hypothesis has given new direction to consumption function. Recently Paul A.<br />
Sanvulson and William D. Nardhous have shown the relationship between the changes<br />
in income and consumption on disposable income during 1964 to 1984. So that<br />
permanent income hypothesis has a greater value in 20th and 21st century.<br />
3.3 Summary :<br />
In this unit No. 3, we have studied 4 different contents.<br />
They are of Keynesian concept of consumption function, relative income<br />
hypothesis, life cycle hypothesis and permanent income hypothesis.<br />
J. M. Keynes wrote a book entitled "The theory of Employment, Interest and<br />
Money in 1936." He has given detail information about the concept of consumption<br />
function. Keynes says that the functional relationship between income and consumption<br />
is known as consumption function. So that He has given a formula of consumption<br />
function as under.<br />
C = f (y)<br />
C = consumption<br />
f = functional relationship<br />
y = Income.<br />
According to Keynes, other things being same, as income increases,<br />
consumption increases but not as much as the increase in income. This psychological<br />
law of consumption denotes the relations between consumption and income. The<br />
concept of consumption function given by Keynes is useful in macro economic analysis<br />
now-a-days also in respect of various angles.<br />
Second important sub-unit of this chapter is of post-Keynesian theories of<br />
consumption function. Here the relative income hypothes is explained by An American<br />
Economist J. S. Duesenberry in his book entitled "Income, savings and theory of<br />
Consumer behaviour" in 1949. According to Duesent berry, consumption of an individual<br />
is not the function of his absolute income, but it depends on the relative position of<br />
income. Here, demonstration effect plays vital role in the changing level of consumption<br />
of an individual. Duesenbery has given detail information about short-run and longrun<br />
consumption function in this particular hypothesis.<br />
Third important sub-unit of this chapter is of life cycle hypothesis. Franco<br />
44
Modigliani and Ando have given this hypothesis in a essay entitled, The Life Cycle<br />
Hypothesis of Savings, Aggregate implications and Tests in 1963. According to this<br />
hypothesis, consumption in any period is not the function of current income, but it is of<br />
the life time expected income. According to Modigliani and Ando, consumption of an<br />
individual in a particular period depend on the following four factors.<br />
a) Current Income, b) Savings of previous period, c) Expected Income, d) current<br />
age of individual.<br />
Apart from above 4 factor, Modigliani mentioned the size of family factor which<br />
affects on consumption expenditure. Both these economists have explained short-run<br />
as well as long-run situation of consumption function in this particular hypothesis. So<br />
that this hypothesis is one of the practical oriented significance based hypothesis.<br />
Fourth important subunit of this chapter is of permanent income hypothesis.<br />
This hypothesis is put forwarded by American Economist Milton Friedman in his famous<br />
book, entitled 'The theory of consumption Function in 1957. Permanent income<br />
hypothesis is similar to life cycle hypothesis. According to Milton Friedman, consumption<br />
of an individual is a function of long-term income of consumer. He has given the following<br />
4 different concepts for the elaboration of permanent income hypothesis.<br />
a) Permanent income, b) Temporary income, c) Permanent Consumption, d)<br />
Transitory consumption.<br />
Friedman has given 2 formulas of this hypothesis.<br />
I) Y = Yp + Yt Y = Income Yp = permanent income<br />
Yt - temporary income.<br />
II) C = Cp + Ct = C - Consumption<br />
Cp = permanent consumption<br />
Ct = transitory consumption.<br />
Friedman has also given a detail diagrammatic explanation about short-run<br />
and long-run consumption function. Paul A. Samulson and William D. Nardhous have<br />
shown the practical significance of this hypothesis through America's Changing nature<br />
of consumption during the period of 1964 to 1984.<br />
3.4 Glossary :<br />
A) Consumption function : The functional relationship between income and<br />
consumption.<br />
B) Demonstration Effect : The tendency of poor people to enhance their<br />
consumption by attracting the consumption level of rich people.<br />
C) Ratchet Effect : The tendency of people for mainting standard of living by<br />
constant level of consumption in boom or depreciation condition.<br />
D) Permanent Income : Income of a individual within the long-run period.<br />
45
E) Permanent Consumption : Long-run period consumption of an individual.<br />
F) Transitory income : Income of a person within the short-run period.<br />
G) Temporary Consumption : Short run period consumption of an individual.<br />
3.5 Objective questions and their answers :<br />
A) Rewrite the following sentences by choosing correct alternative given<br />
below.<br />
1) The formula of Keynsian consumption function concept is ________<br />
A) M = Ky B) C = F (y) C) MV = PT D) X = F (YP)<br />
2) Keynes psychological law of consumption function becomes true in _______<br />
Economy.<br />
A) Democratic B) Free Capitalistic C) Socialistic D) Planned<br />
3) Duesembary has explained 'Relative Income Hypothesis' in ________<br />
A) 1941 B) 1949 C) 1957 D) 1991<br />
4) Life-Cycle Hypothesis was propounded by ______<br />
A) Dr. Marshall B) Modiglani C) Fisher D) Keynes.<br />
5) The concept of transitory consumption is given in ______ hypothesis.<br />
A) Absolute income B) Permanent Income<br />
C) Life-cycle D) Permanent Consumption<br />
B) Answer in one sentence.<br />
1) Explain Keynes's psychological law of consumption function.<br />
2) Who propound Relative Income Hypothesis first ?<br />
3) What do you mean by 'Life-cycle hypothesis' ?<br />
4) What is the meaning of permanent consumption,<br />
5) State two concepts used in permanent income pyopoiesis.<br />
* Answers of objective questions,<br />
A) Rewrite the following sentences by choosing correct alternative given below,<br />
1) The formula of Keyesian consumption functional is c = f (Y)<br />
2) Keynes psychological law of consumption functional be comes true in free<br />
capitalistic economy.<br />
3) Duesenberry has explained 'Relative Income hypothesis' in 1949'<br />
4) Life - cycle hypothesis was propounded by Modiglani'<br />
5) The concept of transitory consumption is given in permanent income<br />
hypothesis.<br />
46
B) Answer in one sentence :<br />
1) "Other thing being same, as income increases, the consumption increases<br />
but not by as much as increase in income."<br />
2) Relative income hypothesis was propounded by Brandi and Roz friedman.<br />
3) Consumption in any period is not the function of current income but of the<br />
whole life-time expected income.<br />
4) The consumption of an individual of long-run period.<br />
5) Permanent income and transitory consumption are the two factors of<br />
permanent income hypothesis.<br />
3.6 Questions for practice :<br />
A) Answer the following questions :<br />
1) Explain Keynes psychological law of consumption function.<br />
2) Critically examine the relative income hypothesis.<br />
3) Explain the permanent income bypathesis.<br />
B) Write short Notes :<br />
1) Life Cycle hypothesis<br />
2) Ratchet Effect<br />
3) Demonstration effect<br />
4) Importance of Keynes psychological law of consumption function.<br />
3.7 Books for further readings :<br />
1) Ahuja H. L. Modern <strong>Economics</strong> (2010) 15th Revised Edition. S. Chand &<br />
Company New Delhi. 110055<br />
2) Dewett K. K. / Navalur M. H. (2010) Revised and Enlarged Edition, S. Chand<br />
and Company New Delhi 110055.<br />
3) Seth M. L. (1990) <strong>Macro</strong> <strong>Economics</strong> Lakshmi Narain Agrawal Educational<br />
Publisher, Agra - 03.<br />
4) Mithani D. M. '<strong>Macro</strong> Economic Analysis' (2004) Himalaya Publishing House,<br />
Mumbai.<br />
5) <strong>Macro</strong> Economic Analysis (2012) <strong>Shivaji</strong> <strong>University</strong>, Kolhapur, first Edition.<br />
Distance Education Centre.<br />
● ● ●<br />
47
Unit – IV<br />
'Theories of Investment'<br />
4.0 Objectives<br />
4.1 Introduction<br />
4.2 Analysis of the unit.<br />
1. Classical view of Investment<br />
2. Investment function<br />
3. Investment Multiplier, Acceleration, Principle and super multiplier<br />
4. New and new classical views of Investment.<br />
4.3 Summary<br />
* Objective questions and their answers.<br />
4.4 Glossary<br />
4.5 Questions for practice<br />
4.6 Books for further reading<br />
4.0 Objectives<br />
After going through this particular unit No. 4, you will be able to know :<br />
* the meaning of Investment function.<br />
* the classical view of investment<br />
* the concepts of multiplier, actualization and super multiplier.<br />
* Now and new classical approach of the investment.<br />
4.1 : Introduction<br />
The study of investment is important for the determination of income and<br />
employment in macroeconomic analysis. We have considered the concept of<br />
consumption function and the theories of consumption in the unit No. 3. In this particular<br />
unit No. 4, we will see the concept of investment and investment function. We will also<br />
consider the concepts of multiplier and super multiplier in this unit. This unit also covers<br />
the concept of acceleration and new and new classical approach of investment. The<br />
concept of investment is important for overall development of an economy.<br />
48
4.2 : Analysis of the Unit :<br />
The concept of investment is important for the determination of income<br />
employment and production level of an economy. J. M. Keynes has used the word<br />
'Investment' as a real investment which is made in the form of new factories, machines<br />
and finished goods. According to Keynes, such type of real investment increases income<br />
and production. In this particular unit No. 4, We will consider the concept of investment<br />
function, multiplier, super-multiplier, acceleration principle as well as neoclassical and<br />
new classical approaches to investment.<br />
4.2.1 : Classical view of Investment :<br />
Investment is a factor of overall economic development and growth, There are<br />
various views about investment in macro economics. The fundamental principle of<br />
classical theory of investment is based on free and self-regulating economy. Adam<br />
Smith, J. B. Say have given the role and importance of investment in economic growth<br />
with their views.<br />
* Assumptions of classical view of investment - Classical view of investment is<br />
based on the following assumptions.<br />
a) Full employment level in an economy.<br />
b) No government interference in the process of production and distribution.<br />
c) Capitalistic economy.<br />
d) Self - adjustment mechanisms in an economy.<br />
e) Total output is divided between consumption & investment.<br />
* Explanation of the classical approached to investment - J. B. Say's law<br />
of market is based on classical view of investment. According to Say, every supply<br />
creates its own demand in a capitalistic free economy. So that no shortage or excess<br />
production is produced in a country. As there is always equilibrium in demand and<br />
supply of commodities market, the equilibrium between savings and investment is<br />
also established by investment and marginal efficiency of capital.<br />
IV) Production capacity of existing resources :<br />
If the existing machinery's production capacity is fully utilised in a industry,<br />
there should be requirement of new investment leads to MEC. But if the existing<br />
machinery is not fully utilized, there should be no need of extra investment for producing<br />
more commodities. So that in this situation, MEC declines.<br />
V) Rate of Current Investment :<br />
The rate of current investment affects MEC, If the rate of such investment is at<br />
high level, then there should not necessary to make extra investment in the industry.<br />
So the MEC declines in such a position of an economy.<br />
VI) Rate of Interest :<br />
MEC is dependent on rate of interest when the rate of interest in an economy is<br />
49
low, the investment increases and MEC also increases on the contrary, the high level<br />
of interest rates declines MEC as well as investment in a economy.<br />
Apart from all above mentioned factors, government policy, business optimism<br />
and pessimism, war and peaceful atmosphere, infrastructure development are the<br />
important factors affects MEC in an economy. According to classical economist, rate<br />
of interest is the important factor who establishes the equilibrium between savings<br />
and investment, when rate of Interest, the size of savings also increases and the<br />
investment decreases. On the contrary, when the rate of interest decreases the savings<br />
also decreases and investment increases due to the cheap money policy. Here classical<br />
economist says that the equilibrium between savings and investment determines the<br />
equilibrium of an economy. The basic principle, of self regulating behind this view of<br />
investment is through the following figure No. 4.1<br />
Figure No. 4.1<br />
Y<br />
G<br />
G1<br />
S<br />
S1<br />
Rate of Interest<br />
N1<br />
N<br />
O<br />
S<br />
S1<br />
Figure No. 4.1 clears the self adjustment between savings and investment<br />
thoroughly the rate of interest. In this figure, 'p' point denotes the initial level of<br />
equilibrium between savings and investment. When investment increases from the<br />
point 'p' to p1 level through the investment curve GG to G1G1 rate of interest will be<br />
increased from ON to ON 1. This increasing trend of rate of interest leads to the<br />
increasing level of savings which is shown with the curve SS to S1S1 According to<br />
classical economist the equilibrium of savings and investment will be established<br />
automatically. So that no excess production or shortage of production situation will be<br />
arised in a economy.<br />
* Comment on Classical view of Investment :<br />
P<br />
C<br />
Lord J. M. Keynes has attacked on the classical view of investment in the<br />
following manner.<br />
50<br />
P2<br />
G<br />
Savings & Investment<br />
G1<br />
X
A) According to Keynes, rate of interest does not establish the equilibrium<br />
between savings and investment, but the changing nature of income level is important<br />
for such type of equilibrium.<br />
B) Full employment level is not possible : According to Keynes, classical view<br />
of investment is based on the assumption of full employment in a economy. But the<br />
situation of full employment is an exceptional. Due to this, classical view to investment<br />
does not give the explanation of investment in the underemployment condition of the<br />
economy.<br />
C) Classical view of investment is based on the another assumption of Every<br />
supply creates its own demand! But Keynes says that it is highly impossible to establish<br />
equilibrium between demand and supply because of the factors affecting demand and<br />
supply of commodities are different so that the problem of excess production and<br />
scarcity arises in a economy.<br />
D) Classical view of investment is not useful for welfare state - According to<br />
critics, the classical view of investment is not useful to the developing and welfare<br />
principle economies. The obstacles arises in the process of income generation,<br />
production process and investment should be considered while giving explanation<br />
about investment policy of a country.<br />
Due to all above mentioned critics, classical view of investment has declined<br />
it's value in 20th century. So the new classical and new classical views of investment<br />
have been developed later on in micro economic analysis.<br />
4.2.2 Investment Function :<br />
The investment function relates to inducement to investment. There are two<br />
major tapes of Investment, from the point of view of the theory of income and<br />
employment. These types are autonomous and induced. Autonomous investment is<br />
made by the government. Which is not related to income or profit, such type of<br />
investment is made for the development of roads, dams, public buildings and other<br />
public utilities in the long run period. Induced investment is made for only profit motive<br />
in a capitalistic economy. Such tape of investment is influenced by private consumption.<br />
Induced investment is made by the people due to the result of change in income and<br />
consumption, Thus induced investment is governed by the profit motive.<br />
* Determinants of Investment :<br />
Investment is one of the important factors of income and employment<br />
determination process. Broadly speaking, the induced investment leads to the process<br />
of economic development, such type of investment depends upon the two factors i.e.<br />
the marginal efficiency of capital and the rate of interest. Now we will consider the<br />
detail information about these two determinants of investment function.<br />
A) Marginal Efficiency of capital :<br />
Keynes has given the another name for marginal efficiency of capital is expected<br />
rate of profit. In modern world, investment policy involves great amount of risk. Due to<br />
51
the risk accepted by the enterpreneur should be given expected economic benefit for<br />
which he has invested the amount. Prof. Kurihara defines marginal efficiency of capital<br />
is an expected income of capital and supply price of capital. According to Keynes, the<br />
Marginal efficiency of capital rely on two factors i.e. prospective yield from the capital<br />
asset and supply price of capital. The supply price of capital is the excess cost made<br />
by producer for purchasing new capital assets. Sometimes this supply price of capital<br />
is known as the replacement cost of new machines. In this way, marginal efficiency of<br />
capital is determined by the two factors expected return from capital and rate of interest.<br />
The relationship between inves'tment, MEC and rate of interest is shown in the Table<br />
No. 4.1,<br />
Table No. 4.1<br />
Determination of MEC and investment.<br />
Investment (Rs. Crores) MEC (%) Rate of Interest (%)<br />
5 10 10<br />
10 8 09<br />
15 6 06<br />
20 4 04<br />
25 2 03<br />
Table No. 4.1 reveals the relationship between investment, MEC and rate of<br />
interest. When the amount of investment increases from Rs. 5 Crores to 10 Crores,<br />
the marginal efficiency of capital declines from 10% to 8% and the rate of interest also<br />
deadlines from 10% to 9%. It happens due to the two reasons. One is the larger<br />
investments on capital assets leads to minimize the marginal efficiency of it, secondly<br />
the price of such type of capital assets increases as per increase in demand. We can<br />
explain this situation with the help of following figure No. 4.2<br />
Figure No. 4.2<br />
Marginal Efficiency of Capital<br />
Marginal efficiency of capital curve<br />
Y<br />
D<br />
S<br />
S1<br />
O<br />
N<br />
52<br />
P<br />
A A1<br />
Investment (Crores)<br />
R<br />
MEC Curve<br />
X
Figure No. 4.2 shows us the relationship between MEC and investment on OX<br />
axis, investment is shown in the Rs. in crores whereas on OY axis, marginal efficiency<br />
of capital is shown the marginal efficiency of capital (MEC) curve. This curve shows<br />
us, as the investment increases, MEC declines and vice-versa. So that the slope of<br />
MEC is slowdown from left to right.<br />
* Factors influencing marginal efficiency of capital :<br />
We can classify the factors affecting MEC in two categories, first type is of<br />
short-run period and second is of long-run period factors influencing marginal efficiency<br />
of capital in a private enterprise economy. Now we will consider these factors in detail.<br />
A) Short-run factors : The various factors affecting MEC on short-run period are as<br />
follows.<br />
I) Expected demand for the production : Expected demand for commodity<br />
produced in a economy is one of the important influencing factor of MEC. If the expected<br />
demand for products is to be high level in future, the marginal efficiency of capital will<br />
be high. On the contrary, if the demand for such type of products is to be less in future,<br />
the MEC and volume of investment will be less.<br />
II) Costs and prices : The future nature of costs and prices will also one of the<br />
important influencing factor of MEC. If the expected costs of commodity are to be<br />
declined, the size of investment increases as well as MEC also increases. On the<br />
contrary, when the expected prices of commodities sold by the entrepreneurs are to<br />
be increased, the marginal efficiency of capital and investment also increases.<br />
III) Propensity to consume : In a short-run period, if there will be a possibility<br />
of increasing trend of propensity to consume, the MEC and level of investment increases<br />
and vice-versa position of it.<br />
IV) Change in income : MEC and the level of investment is directly related to<br />
the expected level of income, sudden changes in income occurs due to the windfall<br />
gains of an economy. An increase into the level of income in a short-run period stimulates<br />
the MEC and investment while a decline in the income of consumer decreases the<br />
level of MEC and investment.<br />
V) Business environment : MEC and the level of investment depends on<br />
business environment of an economy. The entrepreneurs face the challenges of trade<br />
cycles. If the environment of the economy is favorable to a boom stage, the MEC and<br />
investment increases and vice-versa.<br />
IV) Wages and rate of interest : MEC and investment depends on wage rates<br />
as well as interest rates of the banks. If the wages and interest rates of financial<br />
institutions are on high level or to be high level, the production cost of commodity<br />
increases and MEC as well as investment level decreases. On the contrary, if the<br />
wage rates and interest rates are at lower level, the MEC and investment increases.<br />
B) Long-run factors of MEC :<br />
The various long-run period influencing factors of MEC are as follows -<br />
53
I) Rate of growth of population : This is one of the important influencing factors<br />
of MEC. When the grossularite of population of a country increases, MEC of private<br />
enterprises also increases due to the expansion in demand for the various commodities.<br />
On the contrary, the declining rate of population decreases the marginal efficiency of capital.<br />
II) Development of new areas : When the backward regions are developed<br />
by the government through heavy investment in roads, transport communication,<br />
electricity, agriculture, housing etc. the marginal efficiency of capital increases.<br />
III) Technological progress : Technological progress in agriculture and<br />
industrial sector always leads to rise in marginal efficiency of capital, New techunology<br />
or invention in the production increases marginal efficiency of capital,<br />
iv) Existing capacity of capital equipment -<br />
If the existing capacity of capital equipment or machinery is not being felly used,<br />
the excess demand for products should be fulfilled with these machlinery. In this situation<br />
MEC will be less, On the contrary, in case of full used of existing capacity, the increasing<br />
level of demand for products will be met by installing new capital equipment in a industry<br />
which leads to increase in MEC.<br />
v) Rate of current investment - MEC depends on the current investment, In<br />
a industry, If such type of rate of investment is already high, then there is no scope for<br />
further increase in investment, So that in this particular position MEC will not crease<br />
in, But if the current rate of investment is low, there will be new entrepreneurs willingness<br />
for, increasing investment in different units in a industry which leads to MEC in a<br />
economy,<br />
Thus above mentioned factors affect MEC. Apart from all above factors, Government<br />
policy, trade cycles etc. factors also determines the nature and size of MEC,<br />
4.2.3 The Multiplier -<br />
The multiplier is an important concept used in macro- economics. This concept<br />
was developed, by R.F. Khan in1931 in his article, Relation of home investment to<br />
unemployment, The concept of multiplier developed by Khan is known as employment<br />
multiplier. Keynesian multiplier concept is based on marginal propensity to consume<br />
(MPC)<br />
According to Keynes, multiplier is the ratio of final change in income to the<br />
initial change in investment, the concept of multiplier is explained in the following formula,<br />
K =<br />
iY<br />
K= multiplier<br />
iI iY = change in income<br />
iI = change in investment,<br />
The multiplier is determined by the propensity to consume, the relationship between<br />
the MPC and the investment multiplier is shown by the following arthmatic formula,<br />
54
K=<br />
1<br />
1 - MPC<br />
For example, if MPC is 3/4 the multiplier will be<br />
1<br />
1<br />
K = = = 4<br />
1 - 3/4 0.25<br />
Assumptions of Multiplier -<br />
The Keynesian Concept of investment multiplier is based on the following assumptions:-<br />
1) The mpc is constant.<br />
2) The concept of multiplier is applicable to the economy based on industry.<br />
3) The economy fully increase closed,<br />
4) There should be net increase in investment,<br />
5) There is unemployment in a economy.<br />
6) There should not be changes in monetary and fiscal policy during the working of<br />
multiplier process,<br />
7) Induced investment is made in an economy.<br />
8) There is an existence of excess capacity in the consumer goods industry in economy.<br />
9) No time lags between successive expenditure on consumption in the process of<br />
multiplier.<br />
10) Resources required for the production process are available in a economy.<br />
* Working of Multiplier - Explains the cumulative effect of a change in investment on<br />
income via consumption expenditure, It is the mechanism through income and<br />
investment expansion,talcel plau Now we will see the functioning of multiplier with the<br />
help of following assumed example, Let us suppose that MEC is 4/5 i.e. 75% The<br />
initial investment is Rs 1000 crores, The process of income generation from the original<br />
(initial) investment is shown in the Table No 4,2.<br />
Table No 4.2<br />
Working Of Multiplier<br />
MPC= 4/5<br />
Period of Initial Investment Increase in Increase in<br />
Multiplier i (Rs) Income iY (Rs) Consumption (Rs)<br />
0 1000 800 800<br />
1 -- 800 640<br />
2 -- 640 512<br />
3 -- 512 410<br />
4 -- 410 328<br />
5 -- 328 262.4<br />
-- -- -- --<br />
-- Total Rs. 1000/- Rs. 5000/- Rs. 4000/-<br />
55
Table No 4,2 shows us the process of working of multiplier in a economy, in the<br />
various stages. The initial (originally) investment is assumed of Rs. 1000/- The MPC is<br />
4/5 so that in the phase or stage, increase in consumption expenditure and induced in<br />
come is of Rs. 800/- The second stage, we observe that induced come in and<br />
consumption expediturbecomes Rs 640/- and Rs 512 /- respectively. In this way the<br />
working of multiplier process is going on upto the level induced income and expediture<br />
on consumption becomes O, Thus. with the help of original investment of Rs.1000/-<br />
the economy can grow induced income and consumption of Rs 5000/- and Rs. 4000/<br />
- respectively, It denotes that multiplier becomes 5, the process of multiplier is the<br />
cyclical effect of induced income and consumption. The concept of investment Multiplier<br />
is shown with the help of following figure No. 4.3<br />
Consumption &<br />
Investment<br />
Y<br />
N1<br />
N<br />
C<br />
O<br />
N = C + S<br />
E2 C + I + I1<br />
C + I<br />
E1<br />
C<br />
E<br />
45 0 X<br />
Income<br />
Figure No. 4.3 shows us the working of multiplier in a 4/5 MPC ratio. Ox axis<br />
shows the change in income and OY axis consumption and investment is shown. ON<br />
line shows the zero savings condition. E, E1 and E3 are the three equilibrium points<br />
which shows us the changes in income and investment level of an economy. The<br />
equilibrium point E2 denotes the zero savings situation. Thus, the process of working<br />
of multiplier depends on MPC.<br />
* Limitations or Leakages of Multiplier : The concept of multiplier seems to<br />
be very attractive theoritically, but in practice, the functioning of multiplier arises some<br />
limitations or leakages. These limitations of multiplier are as follows :<br />
a) MPC will not remain constant - Keynes assumes that MPC is constant in the<br />
process of multiplier, but according to the critics, it should not remain constant by all the<br />
time. When MPC will decrease or increase, the working of multiplier automatically changed,<br />
b) Regular investment - The value of multiplier depends on regular investment<br />
level. Otherwise the process of continuous increase in income and consumption<br />
expenditure will stop.<br />
56
c) Repayment of debt - When a part of increased income will be used for<br />
repayment of pervious loans or debt taken the working of multiplier will be disturbed.<br />
Thus repayment of debt is one of the important leakage to multiplier.<br />
d) Multiplier period - Keynes assumes that there is an adjustment between<br />
increase in income and expenditure for the absence of multiplier period. But in practice,<br />
it does not happen that every amount of increase in income due to the multiplier process<br />
will be spent on consumption immediately. So that the value of multiplier automatically<br />
decreases in this context.<br />
e) Availability of resources - It is necessary for smooth working of multiplier,<br />
the resources should be available for the production process. But in practice there<br />
should be several problems arises while maintaining the production process regarding<br />
the resources. Keynes neglects this situation.<br />
f) Full employment ceiling - The working of multiplier should be in smooth<br />
level upto the fall employment level of an economy. But after the establishment of full<br />
employment, the value of multiplier becomes very low.<br />
g) Holding cash in hands - The functioning of multiplier depend on expenditure<br />
tendency of every increased amount of income. But if the persons have saved the<br />
increased amount through multiplier process, the process of multiplier will not be<br />
continued.<br />
h) Import policy - If the money obtained by multiplier process is used for<br />
purchasing imported goods and services there will not increase income and employment<br />
level of an economy. Afterall the process of multiplier will be stopped.<br />
Despite of above all limitations of multiplier, this concept is useful for economic<br />
analysis. The followers of Keynes are using tis concept in various fields of an economy<br />
now a days.<br />
* Acceleration Principle - The Principle of acceleration is used in macro<br />
economics in respect of derived demand and investment impact. This concept was<br />
developed by J. M. Clerk in 1917. Afterall it was further developed by Hicks, Samulson,<br />
Harrod and Keynes in business economics. This principle gives us an explanation<br />
about the fluctuations in a economy especially capital goods industry.<br />
The acceleration principle simply tells us when income increases the demand<br />
for consumption goods and capital goods also increases. The acceleration is the<br />
coefficient of the ratio between induced investment and initial change in consumption<br />
expenditure. Now we will realise this principle by the following formula.<br />
a =<br />
iI<br />
iC<br />
a = acceleration<br />
i= change<br />
I = Investment<br />
C = Consumption<br />
Thus, accelerator shows us the effect of change in income on investment.<br />
57
* Assumptions of Acceleration - The principle of acceleration is based on the<br />
following assumptions.<br />
a) Capital output ratio is constant.<br />
b) Resources are available for production process.<br />
c) There is no excess capacity in existing industries.<br />
d) The supply of capital and credit money is elastic.<br />
e) Investment leads to increase in the production immediately.<br />
* Working of Acceleration : The working of Acceleration is explained by<br />
assumed example given in the Table No. 4<br />
Table No. 4<br />
Working of Acceleration<br />
58<br />
* Rs. in Crores<br />
Period Output Desired Replacement Net Gross<br />
Capital Investment Investment Interest Investment<br />
1 100 200 20 0 20<br />
2 100 200 20 0 20<br />
3 110 220 20 20 40<br />
4 120 240 20 20 40<br />
5 150 300 20 60 80<br />
6 170 340 20 40 60<br />
7 170 340 20 0 20<br />
8 160 320 20 20 0<br />
Table No. 4. clears the working of acceleration principle within the assumed<br />
capital output ratio 2. Table also shows us the changes as per desired capital and<br />
gross investment in a economy, gross out put in a economy is depending on the<br />
replacement investment and net investment. When the economy is moving downwards,<br />
the gross investment can fall upto zero which is shown in 2 and 7 that period stage.<br />
Thus, the functioning of acceleration principle in a economy is the effect of change in<br />
income on consumption and investment.<br />
* Limitations of the Accelerator : The principle of acceleration is based on<br />
rigid assumptions so that this principle has the following limitations.<br />
a) A constant capital output ratio is not passible : According to critic the<br />
assumption of constant capital output ratio is not possible in modern dynamic world.<br />
The factors of investment, production technique businessman's expectations, prices<br />
and wage rates etc. may affect the capital output ratio. Hence, the capital output ratio<br />
does not remain constant due to the phases of business cycle.
) The assumption of no excess capacity is not true : Acceleration principle<br />
assumes that there is not excess capacity in a economy in respect of consumer goods<br />
industry. But if excess capacity is available, then an increase in demand for such commodities<br />
will be met with the existing capacity, and the accelerator will not in working condition thereon.<br />
c) Fluctuation in permanent demand : This principle assumes the permanent<br />
demand for consumer goods. But if the rise in demand for consumer goods is temporary<br />
nature, it will not lead to any increase in capital stock.<br />
e) Absence of time lag : The principle of acceleration assumes that increasing<br />
demand for output immediately leads to induced investment, But there may be a time<br />
lag for this process of new investment to be generated.<br />
f) The problem of finance : This principle assumes that the finance will be<br />
generated easily for induced investment. But according to the critics, if the finance will<br />
not available for investment, the working of acceleration stops.<br />
Apart from above all limitations the acceleration principle makes the process<br />
of income propagation more realistic.<br />
* The concept of super multiplier : The concepts of multiplier and acceleration<br />
are most important to study the changes in national income of a economy. These two<br />
concepts have a mutual relations, so we have to consider the combine effect of working<br />
of multiplier and the acceleration principle, prof., Hansen calls the combine effect of<br />
multiplier and acceleration leverage effecor super - multiplier.<br />
The concept of multiplier represents the relationship between the change in investment<br />
to the change in income, the principle of acceleration denotes the change in consumption to<br />
the change in investment. Prof. Hand, Samulson, Hicks and Kurihyara have also made attempts<br />
to integrate these two parallel concepts of macro economics. Hicks has combined the multiplier<br />
and the accelerator mathematically and has given the name as a super multiplier. We can<br />
explain the concept of super multiplier with the help of following equation.<br />
KS = K+a Whereas KS = Super multiplier<br />
K = multiplier, a = accelerator<br />
Now we can explain this concept with the help of following example with a<br />
schedule. Combination of multiplier and the acceleration or working of super multiplier.<br />
*( Rs. in crores)<br />
Induced Induced Aggregate<br />
Period Initial Investment Consumption Investment Increase in<br />
C+ as A+2 National Income<br />
1 100 Crores - - 100 Crores<br />
2 100 Crores 50 Cr 100 (50x2) 250 Crores<br />
3 100 Crores 125 Cr 150 (75x2) 375 Crores<br />
4 100 Crores 187.5 Cr 125 (62.5x2) 412.5 Crores<br />
5 100 Crores 106.25 37.5 (18.75x2) 343.75<br />
'N' times 100 Crores 500 Cr 1000 Cr 1000 Crores<br />
59
The above schedule clears the changes in initial investment, induced<br />
consumption level, induced investment and aggregate increase in national income,<br />
The schedule also represents the process of income generation with the help of both<br />
The principles i.e. multiplier and accelerator, within the 5 year duration, Here we observe<br />
that the initial investment and aggregate crease in national income with the functioning<br />
of multiplier and accelerator. Thus the study of super- multiplier or accelerator- multiplier<br />
combination effect on economy, The concept of super - multiplier furnishes an adequate<br />
explanation of the cyclical process of multiplier and the accelerator.<br />
* Conclusions - The important critics have been made on the concept of super<br />
multiplier are as follows -<br />
a) It is highly impossible to calculate the effect of working of multiplier and the<br />
accelerator on national income increase,<br />
b) The concept of super - multiplier is based on the assumption of constant<br />
MPC, but in practice MPC does not remain constant. Multiplier and acceration doesn't<br />
remain constantly all the time.<br />
c) According to critics, the change in multiplier and accelerator on investment<br />
and national income we don't calculate.<br />
Apart from all above mentioned critics, the multiplier-acceleration combination<br />
or super-multiplier is useful for knowing scientific explanation of trade cycle. This concept<br />
gives guidelines to the Government in respect of economic stability and full employment<br />
level and expenditure policy. According to Prof. Kurihara, the concept of super-multiplier<br />
is useful for the explanation of trade-cycle.<br />
4.2.4 Neo and New classical views of Investment :<br />
There are 3 different types of views of investment in macro economic analysis.<br />
Classical neo and new classical views have been developed in 20th and 21st century.<br />
J. B. Say and other classical economists have explained classical view of investment<br />
which is based on unrealistic assumptions. So that since 1929, Keynesian view of<br />
investment has become more realistic on the background of the great depreciation<br />
period. Keynes attacked on classical view of investment due to unrealistic assumptions.<br />
* Keynesian view towards investment :<br />
Keynes view of investment is known as neo-classical view of investment. Keynes<br />
says that savings and investment are the two different important components of<br />
economic growth. They are interdependent but not equal by all the times. In this context<br />
Keynes has used the following two terms.<br />
a) Equality in accounting : Keynes has explained the concept of equity in<br />
accounting of savings and investment in his book entitled, "The General Theory of<br />
Employment, Interest and Money" in 1936. He says that the savings and investment<br />
equilibrium is necessary for economic development. But for such type of equity, there<br />
should be equilibrium between actual saving and actual investment. Keynes says that<br />
savings always depend on the level of income and tendency of savings. He also<br />
60
mentioned that there are so many factors determining the size of savings i.e. level of<br />
consumption, rate of interest, nature of inflation, Government policy etc. Keynes says<br />
that current income should be greater than the current consumption for the equilibrium<br />
of savings and investment. It is passible in most of the developed countries, but it is<br />
impossible in developing countries due to the obstacles arise in the level of income<br />
savings and investment.<br />
b) The functional equity between savings and investment : According to<br />
keynes, the equilibrium between savings and investment establishes due to the change<br />
in income level of the country. We find the process of changes in income, savings and<br />
investment continuously upto the equity between saving and investment. After all we<br />
observe that the investment declines though the income and savings increase. We<br />
can show this situation with the help of following figure No. 4.4<br />
Figure No. 4.4<br />
The process of equilibrium 'between savings and Investment'<br />
Y<br />
B<br />
Savings & Investment<br />
B<br />
G1<br />
B1<br />
S<br />
G2<br />
B2<br />
G<br />
O<br />
Y1<br />
Y<br />
Income<br />
Figure No. 4.4 clears the equity between savings and investment through<br />
income level of a economy. In this diagram, OX axis shows the level of income and OY<br />
clears the saving and investment ratio. BB is the savings curve and GG is shown as<br />
the investment curve. When Income of a economy is OY1, investment is greater than<br />
savings by B1 G1. At the income level OY savings and investment are equal. But<br />
when the income level of a economy reaches up to OY2, savings is greater than<br />
investment by B2 G2, we also find the backward linkage of multiplier in this particular<br />
situation.<br />
Thus the explanation of equity between savings and investment is established<br />
through the level of income of a economy. Prof. Kurihara has explained the importance<br />
of equity of savings and investment view given by Keynes is based on demand and<br />
supply analysis of Dr. Marshall. The view about the investment explained by Keynes<br />
has been criticised by the critics. According to critics, it is highly impossible to explain<br />
61<br />
Y2<br />
X
the equity between savings decisions have been taken by crores of people who saves<br />
money by different motives whereas the investment policy is depend on the nature of<br />
business activities. So that the equity of savings and investment is an exceptional<br />
case. Another critic has been made on this view, in respect of static explanation about<br />
investment.<br />
Jorgenson has explained his theory of investment as a neo-classical theory of<br />
investment. He says that investment depends on the stock of capital in a economy.<br />
Secondly the decisions related to investment have been taken through the maximisation<br />
of profit. Jorgenson also explains the process of investment is based on the demand<br />
for capital which is elastic to the rate of interest. Both the concepts of savings and<br />
investment are rely upon rate of interest.<br />
* New classical view of investment : New classical approach has been<br />
developed since 1960. British Economist Patrak Bhinford and American Economists<br />
Robert Lucas and Thomas Sargent have developed this attitude. The new classical<br />
approach is superior than the classical as well as new classical approaches. The<br />
changes in European countries America and other countries have to face the problems<br />
of Inflation and unemployment since 1970. Keynesian approach of investment and<br />
employment has failed to stimulate these economis. So that the new classical approach<br />
towards investment should be considered now a days.<br />
New classical approach is based on the two basic assumption of changing<br />
nature of wage rates and people's rational behavior. According to Robert Lucas and<br />
Thomas sargent, we must consider the economic fluctuations of the European countries<br />
since 1970. They argue that it is impossible to establish full employment level. The<br />
monetory and fiscal measures have failed to solve the problem of unemployment of<br />
these economies. So that supply side measures have to be taken to prevent these<br />
economies. According to these economists, we have to produce more to overcome<br />
the problem of unemployment and inflation. Government in European economies have<br />
to give relaxation on taxes for the equilibrium of economy. America has used these<br />
measures and stimulate the economy during the period of 1981 to 1984.<br />
The new classical view of investment is based on the following three<br />
approaches.<br />
a) Free market approach where markets alone are assumed to be generate<br />
maximum welfare of the society.<br />
b) Public choice approach of consumption and investment should be considered.<br />
c) Government's role in respect to solving the problem of unemployment and<br />
lack of deficiency of demand in a economy.<br />
Thus new classical approach deals with the post-liberalisation position of<br />
different economies in the world and how to face the challenges of consumption, trade<br />
barriers as well as the level of production in a economy at optimum level, so that the<br />
new approach of savings and investment should be developed to compete with the<br />
global economic crisis. This approach suggests that investment policy should be<br />
62
determined by the Government to increase investment, income and savings ratio.<br />
Same view has been explained by Robertson, Dr. Lutz, Ovlin, Aric Lindal and Myrdall in<br />
the recent years. Thus new classical approach of investment has been developed<br />
since 1960 which is practical oriented and comprehensive to stimulate the economies<br />
in 20th & 21st century.<br />
* Objective Questions :<br />
A) Rewrite the following sentences by choosing correct alternatives given<br />
below.<br />
1) The formula of Kenyesian consumption function is .............. ,<br />
a) M=KY b) C=f(Y) c) MV=PT d) A=f(X)<br />
2) According to Keynes investment means ..........<br />
a) money supply b) demand for money<br />
c) real investment d) interest in terms of money<br />
3) Marginal efficiency of capital is mainly rely on ......... ,<br />
a) rate of interest b) supply of commodity<br />
c) Government policy d) level of income<br />
4) Multiplier is the function of ......... ,<br />
a) income b) expenditure c) employment d) inflation<br />
5) The principle of acceleration was propounded by ........... ,<br />
a) Dr. Marshall b) Prof. J. M. Clerk<br />
c) Keynes d) Adm Smith<br />
6) ............. has explained the law of market.<br />
a) J. B. Say b) Pigou c) Robertson d) Marshal<br />
B) Answer in one sentence :<br />
1) What do you mean by induced investment ?<br />
2) State two determinants of MEC ?<br />
3) Give definition of multiplier.<br />
4) State two limitations of accelerator.<br />
5) What the formula of super multiplier?<br />
* Answers of the objective question.<br />
A) Rewrite the following sentences by choosing correct alternatives.<br />
1) The formula of Keynesion consumption function is = C = f(Y)<br />
2) According to Keynes, investment means real investment.<br />
3) Marginal efficiency of capital mainly rely on rate of interest.<br />
4) Multiplier is the function of income.<br />
5) The principle of acceleration is prepared by Prof. J. M. Clerk.<br />
6) J. B. Say has explained the law of market.<br />
63
B) Answer in one sentence :<br />
MEC.<br />
1) Induced investment means the investment made by only profit motive.<br />
2) Business environment and Government policy are the two determiants of<br />
3) The ratio of final change in income to the initial change in investment is<br />
called multiplier.<br />
4) Availability of resources and the problem of finance are the two limitations of<br />
accelerator.<br />
5) KS = K = a is the formula of supermultiplier.<br />
4.3. Summary :<br />
The concept of investment is important for the determination of income, ,<br />
employment and overall development of a economy. In this particular unit No. 4, we<br />
will consider the four contents related to investment function.<br />
A) Clasical view of investment : The classical view of investment is developed<br />
by J. B. Say, Adam Smith and other classical economists. This view of investment is<br />
based on free and self regulating economy. J. B. Says law of market is based on the<br />
classical view of investment. According to J. B. Say every supply creates its own<br />
demand. So that there will no over production or shortage of commodities in a capitalistic<br />
economy. Keynes has made the various comments on the classical view of investment<br />
due to its limitations.<br />
B) Investment function : Second important sub-unit of this chapter is of<br />
investment function. The investment function is the inducement to invest. There<br />
are 2 types of investment i.e. automous and induced. Autonomous investment is<br />
made by the Government to provide basic infrastructure. The induced investment<br />
is always linked with the profit motive. Marginal efficiency of capital and rate of<br />
interest are the two main factors of investment function. Prof. Kurihara defines the<br />
concept of marginal efficiency of capital as an expected income of capital and<br />
supply price of capital. There are various short-run and long-run period factors<br />
affecting MEC.<br />
C) The third important aspect of this unit is the concepts of multiplier,<br />
accleration and super-multiplier. The concept of multiplier has been developed by<br />
Keynes. Multiplier is the ratio of final change in income to the initial change in<br />
investment. The multiplier is determined by the concept of propensity to consume.<br />
The process of multiplier is useful for generating income, employment and<br />
consumption, Acceleration principle is explained by J. M. Clerk. Acceleration is the<br />
co-efficient of the ratio between induced investment and initial change in expenditure.<br />
This principle shows us the effect of change in income on investment. The concepts<br />
of multiplier and acceleration are based on certain assumptions. So they have various<br />
limitations. Super multiplier is the combination of the functioning of multiplier and<br />
acceleration. Prof. Hansen calls the combination effect of multiplier and activation<br />
64
leverage effect. The concept of supermultiplier gives us the scientific explanation<br />
about trade clycles which is useful for the equilibrium of an economy.<br />
D) Neo - and new classical views of investment is the 4th sub-unit of this<br />
chapter. Keynesian view towards investment is called neo-classical view of investment.<br />
Whereas the views about investment developed since 1960 in European and other<br />
countries is called new classical thoughts of investment. Keynes has explained the<br />
role of investment in a economy as an equity in accounting and functional equity<br />
between savings and investment has failed to solve the practical problems of inflation<br />
and unemployment in 20th century. So that, since 1960, the new classical view has<br />
been developed in America and European countries for the stabilization of economics<br />
from economic fluctuations. The contribution of Robert Lucas and Thomas sargent is<br />
highly important in this context. So that its value in 21st country is important for solving<br />
the basic economic issues of unemployment and inflation.<br />
4.4 Glossary :<br />
A) Induced investment : Induced investment is the investment made for profit<br />
motive.<br />
B) Autonomous investment : Autonomous investment is made by the<br />
Government for developing infrastrucfare.<br />
3) Marginal efficiency of capital : MEC is an expected income of capital and<br />
supply price of capital.<br />
4) Multiplier : Multiplier is the ratio of final change in income to the initial<br />
change in investment.<br />
5) Acceleration : The effect of change in income on investment.<br />
6) Super multiplier : Super-multiplier is the combine effect of working of<br />
multiplier and the acceleration.<br />
4.5 Questions for practice :<br />
A) Essay type Questions<br />
1) What do you mean by MEC Explain the factors affecting MEC.<br />
2) Explain classical view of investment critically.<br />
3) What is multiplier ? Explain the process of multiplier and leakages of it.<br />
4) Critically examine the neo-classical and new classical views of investment.<br />
B) Write short notes.<br />
a) Working of Accelerator.<br />
b) Multiplier.<br />
c) Super multiplier<br />
d) Keynesion view towards investment.<br />
65
4.6 Books for further reading.<br />
Delhi.<br />
1) Jhingan M. L. <strong>Macro</strong> <strong>Economics</strong> 2004. Vrinda Publication privated Ltd. New<br />
2) Seth M. L. Monetory <strong>Economics</strong> (2006) Lakshmi Narayan Agrawal Publication<br />
Agrawal publication agra (U.P.)<br />
3) Dweef K.K. 'macro Economic' 207 S.Chand & Company, New Delhi.<br />
4) Mithari D. M. 'Money, Banking and international trade, (2004) Himalaya<br />
Publishing House, New Delhi.<br />
5) Deshmukh Ram, 'Modern <strong>Macro</strong> <strong>Economics</strong>' (2010) (Marathi Book) Vidya<br />
Prakashan Nagpur.<br />
● ● ●<br />
66
Unit – V<br />
National Income and Accounting<br />
Index<br />
5.0: Objectives<br />
5.1: Introduction<br />
5.2: Presentation of Subject Matter<br />
5.2.1: Circular Flow of National Income<br />
5.2.2: Concepts of National Income<br />
5.2.3: Measurement of National Income<br />
5.2.4: Social Accounting Method<br />
5.3: Summery<br />
5.4: Key Words<br />
5.5: Objectives Questions<br />
5.6: Answers of Obiedives Questions<br />
5.7: Questions for Praetice<br />
5.8: Reference Books for further study<br />
5.0: Objectives:<br />
After the studying the National Income and Accounting, unit, you will be able to<br />
understand.<br />
1. The circular flow of National Income.<br />
2. The different concepts of National Income<br />
3. The various methods of measurement of National Income i.e. Production,<br />
Income, Expenditure and Social Accounting<br />
5.1: Introduction:<br />
In the Unit No.4, we have studied the different laws of investment. In present<br />
unit we will study the different concepts of National Income and methods of<br />
measurement of national income. National income is an important variable for the<br />
study of macro economics. The production and distribution of goods and services<br />
between the different categories of society, is the basic problem of every economy. In<br />
this regard all branches of the economics are studying the different contents of<br />
67
production and income. National income and Per capita income are the very important<br />
variables for the measurement of the rate of development of economy. Basically, after<br />
the Great depression the different economists are presented their approaches regarding<br />
the total production, total supply, gross national income etc. New concepts of national<br />
income have also originated from new views of economists. So new methods of<br />
measurement of national income also introduced. The different sectors are going to<br />
develop in the economy. So the circular flow of national income has been changed.<br />
So, in respect of these changes we will study the national income in this unit.<br />
5.2 : Presentation of Subjed Matter:<br />
We will study the circular flow of national income i.e. Two, Three, Four and<br />
Five sector economy. With this we will study the different concepts of national income<br />
and methods of measurement of national income in this unit,<br />
5.2.1: Circular flow of National Income:<br />
National income is the very important concept regarding the study of macro economics.<br />
The main objective of economic activity is the production and equal distribution of<br />
goods and services. So the different branches of economics are connected to the<br />
production and income. It is possible to inter-regional and international comparison of<br />
economic condition with the help of national income. Upto the 1930, the total production,<br />
total income, total supply and total employment was not considered for the economic<br />
analysis. But, after the Great depression some economist has taken into consideration<br />
the above factors.<br />
Every economy has using the money for exchange the goods and services. There are<br />
number of transactions of purchasing and selling. One household’s expenditure is<br />
another’s income. This kind of exchange happened at the beginning of development<br />
of an economy. But, in the modern age, firms are doing the business of collection of<br />
production. Production sector is producing the goods and services which are demanded<br />
by the household sector. Household sector is not producing the goods and services.<br />
Household sector is provided the factors of production to the production sector.<br />
Production sector pays the price of factors of production in the form of rent, wages,<br />
interest and profit. We can explain the circular flow of income between production<br />
sector and household sector.<br />
A) Circular Flow of National Income in Two Sector Economy:<br />
Household sector and Production sector are the two important sectors in the circular<br />
flow of national income in two sector economy. Household sector provides the land,<br />
labour, capital and entrepreneur to the production sector and the rewards of factors of<br />
production provides by the production sector in the form of rent, wages, interest and<br />
profit. The Figure No. 1 shows the circular flow of national income in two sector<br />
economy.<br />
68
Figure No - 1<br />
HOUSEHOLD INCOME<br />
(RENT + WAGES + INTEREST + PROFIT)<br />
FACTOR SERVICES<br />
HOUSEHOLD<br />
SECTOR<br />
PRODUCTION<br />
SECTOR<br />
GOODS AND SERVICES<br />
HOUSEHOLD CONSUMPTION<br />
In the figure No. 1 at the left side household sector and the right side production sector<br />
is shown. Household sector is the group of primary consumers. Household sector is<br />
consuming the various goods and services for fulfill their needs. But, at the same time<br />
household sector provides the land, labour, capital and entrepreneur for production of<br />
goods and services to the production sector.<br />
At another side shows the production sector selling the goods and services to<br />
the household sector. Here the direct relationship between consumer and producer’s<br />
has been shown. But, in real market in between the producer and consumer’s wholesale<br />
traders, retail traders are the middlemen’s. The circular flow of national income is<br />
generated due to dual relationship between production sector and household sector.<br />
In short, household sector and production sector are interdependent to each other. In<br />
national income accounts we are concerned with money flow. In the above model,<br />
following assumptions are made :<br />
a) Household Sector consumes the entire amount it receives as factor payments.<br />
In other words, household sector does not save at all.<br />
b) Production Sector also does not save at all. Whatever is received from sale of<br />
produced goods and services is given as factor payments to Household Sector.<br />
c) There is no Government.<br />
d) The economy is a closed economy. It means nothing is exported to or imported<br />
from other countries.<br />
From above model following are the main conclusions.<br />
a) The summation of net income of Household and Production sector means<br />
national income.<br />
69
) Total expenditure of individuals and production sector for production is national<br />
income.<br />
c) The total market price of final goods and services within a country in a specific<br />
period is national income.<br />
Because of these assumptions, the model discussed above is not realistic. So we<br />
will try to discuss the circular flow of national income with the help of three sector<br />
economy.<br />
B) Circular Flow of National Income in Three Sector Economy:<br />
In the two sector economy, it is assumed that Household sector and Production<br />
sector do not save at all. Household sector consumes as much as it receives from<br />
production sector as factory payments. Similarly, Production sector pays as factor<br />
payments whatever it receives from household sector as payments for goods and<br />
services. In actual practice, it is not so. Households save more part of their income for<br />
many reasons like precautionary reasons, transactionary reasons etc. Similarly, firms<br />
in Production sector also save some part of their receipts for many reasons like<br />
expansion of their business transactionary purposes, speculatively purposes etc. The<br />
savings of Production Sector is undistributed profit and depreciation fund. Household<br />
income in this model will, therefore, be equal to sum of rent, wages, interest and<br />
distributed profits. The savings of household and production sector are collected by<br />
Capital Sector in the economy. All the financial institutions, commercial banks and<br />
insurance companies taken together constitute Capital Sector of the economy. From<br />
capital sector these savings flow to Production Sector as loans for investment. All<br />
these transactions can be shown with the help of Circular flow as shown in the following<br />
Figure. No. 2<br />
Figure No. 2<br />
HOUSEHOLD INCOME<br />
(RENT + WAGES + INTEREST + DISTRIBUTED PROFIT)<br />
HOUSEHOLD<br />
SECTOR<br />
SAVINGS<br />
CAPITAL<br />
SECTOR<br />
SAVINGS<br />
INVESTMENT<br />
PRODUCTION<br />
SECTOR<br />
HOUSEHOLD CONSUMPTION<br />
70
C) Circular flow of National Income in Four Sector Economy:<br />
The circular of national income in the Two Sector and Three Sector economy<br />
having a serious limitation, i.e. Government sector has not considered. Because<br />
classical economists thought was no government interference in the economy. But, in<br />
the changing nature of the economy Government is concerned with the all economic<br />
activities in the economy. So in the Four Sector economy Government sector has<br />
included. All the economic activities are affected on the circular flow of national income.<br />
This includes the tax levied on the public by the government and income spent on<br />
public welfare activities by the government. Government sector pays to Household<br />
sector some amount as transfer payments like old age pensions. Rest of the income is<br />
saved by Government and is mobilized by Capital sector. The working of economy in<br />
a Four Sector model can be shown with the help of circular flow as shown in the<br />
Figure. No. 3<br />
HOUSEHOLD<br />
SECTOR<br />
Figure No. 3<br />
HOUSEHOLD INCOME<br />
(RENT + WAGES + INTEREST + DISTRIBUTED PROFIT)<br />
TAXES<br />
TRANSFER<br />
PAYMENTS<br />
AND FACTOR<br />
PAYMENTS<br />
CAPITAL<br />
SECTOR<br />
SAVING<br />
GOVT.<br />
SECTOR<br />
HOUSEHOLD CONSUMPTION<br />
TAXES<br />
GOVT.<br />
CONSUMPTION<br />
PRODUCTION<br />
SECTOR<br />
Government taxes and expenditure classified as under<br />
1. Government taxes: Government levied different kinds of taxes i.e. Direct<br />
and Indirect taxes. A direct tax includes, Corporation tax, Income tax, Sales tax etc.<br />
Excise duty, Service tax, Tariff ect., are the indirect taxes. Due to levied direct taxes<br />
on the household sector some income of household sector exit from circular flow of<br />
national income, and the flow of income from household sector to production sector is<br />
reduced. If Government spent some receipts collected from the household and<br />
production sector for the purchase of goods and services produced by the production<br />
sector, it will again come to the circular flow of national income. If the Government<br />
saved received receipts for precautionary purpose, this money will be again exit for the<br />
circular flow of national income.<br />
71
2. Government Expenditure: Government collecting the receipts from the<br />
different sources i.e. tax revenue and non tax revenue. Revenue collected by the<br />
government spent on the different economic and social activities. We can explain the<br />
government expenditure on the various activities as follow:<br />
a) Expenditure on Public Sector Undertaking: Government has its own<br />
enterprises, for these enterprises government purchases some services from the<br />
Household sector and gives the rewards for it. Government is also selling the goods<br />
and services to the household sector and getting the income. Government spending<br />
on different types of factories, nationalized banks, post and telegraph offices, insurance<br />
etc. and this expenditure automatically comes in to the circular flow of national income.<br />
b) Expenditure on Grants and Subsidies : Government has some transfer<br />
expenditure on pension, social security schemes and some social welfare schemes.<br />
This is unproductive expenditure of government and not expected to refund. Transfer<br />
expenditure is not considered in the national income.<br />
c) Expenditure on Infrastructure and social services: Government is providing<br />
the basic infrastructure and services to the society. This requires the huge investment<br />
and expenditure. Road transport, Rail transport, Water and Air transport,<br />
Communication, Education, Health, Defense, Administration, Justice having the highest<br />
share in the public expenditure.<br />
Four sector economies include mainly Household sector, Production sector,<br />
Capital sector and Government sector.<br />
d) Five Sector Economy :<br />
Now a day all the economies are open economies. By open economies we<br />
mean economies participating in international trade of goods and services. Therefore<br />
to make our model more realistic, we should include in our model the Rest of the<br />
World sector. Production sector of the economy imports goods and services from<br />
Rest of the World sector and makes payments for these imports. Production sector<br />
also exports goods and services from its total production to Rest of the World sector.<br />
In returns for these exports Production sector receives money from Rest of the World<br />
sector. Household sector receives money from Rest of the World sector for providing<br />
services abroad and as transfer payments like gifts, donations etc. Household sector<br />
also makes payments to Rest of the World sector for getting goods and services from<br />
abroad and as transfer payment. Government sector receives money from Test of the<br />
World sector for export for export of goods and services and as transfer payments. If<br />
total exports are more than total imports, that is, balance of payment position is in<br />
surplus, it implies that some foreign investment is made. On the other hand if total<br />
exports are less than total imports, that is, balance of payment position is in deficit, it<br />
implies some foreign disinvestment is made. Working of a five sector economy can<br />
be shown with the help of circular flow as in Figure: No. 4<br />
72
HOUSEHOLD<br />
SECTOR<br />
Figure No- 4<br />
HOUSEHOLD INCOME<br />
(RENT + WAGES + INTEREST + DISTRIBUTED PROFIT)<br />
SAVINGS<br />
TAX<br />
TRANSFER<br />
PAYMENTS AND<br />
PAYMENTS FOR<br />
SERVICES<br />
EXPECEIPTS<br />
IM PAYMENTS<br />
IM PAYMENTS<br />
CAPITAL<br />
SECTOR<br />
SAVINGS<br />
GOVT.<br />
SECTOR<br />
EX-RECEIPTS<br />
REST OF THE<br />
WORLD SECTOR<br />
SAVINGS<br />
INVESTMENT<br />
TAX<br />
GOVT.<br />
CONSUMPTION<br />
IM PAYMENTS<br />
EX-RECEIPTS<br />
PRODUCTION<br />
SECTOR<br />
HOUSEHOLD CONSUMPTION<br />
5.2.2: Concepts of National Income:<br />
Each and every country in the world desires to achieve rapid and all-round<br />
economic development. The intension may be to offer superior standard of living to<br />
the people or to emerge out as a developed country in the world. National income is<br />
an indicator or parameter of measuring economic development of the country. The<br />
economic performance of the whole economy is measured by national income data.<br />
National income is the money value of all the final goods and services produced by a<br />
country during a period of one year. National consists of a collection of different types<br />
of goods and services of different types. Since these goods are measured in different<br />
physical units it is not possible to add them together. Thus we cannot state national<br />
income is so many millions of meters of cloth, so many million liters of milk etc.<br />
Therefore, there is no way except to reduce them a common measure. This common<br />
measure is money.<br />
Definitions :<br />
1. Fisher: “The National income consists of solely services as received by<br />
ultimate consumers, whether from their material or from their human environments.<br />
Thus, a Piano, or an overcoat made for me this year is not a part of this year’s income,<br />
73
ut an addition to the capital. Only the services rendered to me during this year by<br />
these things are income.”<br />
2. Marshall: “The labour and capital of a country acting on its natural resources<br />
produce annually a certain net aggregate of commodities, material and immaterial<br />
including services f all kinds and net income due on account of foreign investment<br />
must be added in, this is the true net annual income or revenue of country or national<br />
dividend.”<br />
3. Pigou: National income is that part of the objective income of the community<br />
including of course derived from abroad which can be measured in money.”<br />
time.”<br />
4. Myron H. Ross: “Income is a flow of goods and services over a period of<br />
Concepts of National Income :<br />
1. Gross National Product (GNP): This is the basic concept in national income<br />
accounting. It measures the total output or aggregate supply of goods and services.<br />
Gross national product is defined as ‘The total market value of all final goods and<br />
services produced in a year. It has already been seen that whatever is produced<br />
within the domestic territory of a country in a year is its gross domestic product. It,<br />
however, includes, the contribution made by non-resident producers by way of wages,<br />
rent, interest and profits. The non-residents work in the domestic territory of some<br />
other country and earn factor incomes. In other words, it is factor income earned from<br />
abroad by the residents of India by rendering factor services abroad. Gross national<br />
product is defined as the sum of the gross domestic product and net factor income<br />
from abroad. Thus in order to estimate the gross national product of India we have to<br />
add net factor income from abroad i.e., income earned by Indian residents abroad<br />
minus income earned by non-residents in India to form the gross domestic product of<br />
India.<br />
We should add the total of the market value of the final goods and services<br />
produced in a nation. This method of measuring Gross National Product at Market<br />
Prices is called Product Method.<br />
Product Method<br />
G.N.P. at market prices = Market value of consumer goods and services ©<br />
+ Market value of Govt. produced goods and services (G)<br />
+ Gross Domestic private investment (I)<br />
+ Exports including factor services (X)<br />
- Imports including factor services (M)<br />
G.N.P. at market price = C + G + I + (X-M)<br />
G.N.P. at factor cost = There is different between ‘Factor cost’ and ‘Market price’,<br />
Factor cost includes that expenditure which in incurred on the production of goods<br />
74
and services. Profits are also included in these costs. In market prices we include not<br />
only factor cost but also indirect taxes which are imposed on goods. Suppose the<br />
factor cost of any goods is Rs. 50 per unit. Government imposes Rs. 5 per units an<br />
indirect tax, e.g. Excise duty. The market price of goods will be 50 + 5 = 55 per unit. If<br />
government gives subsidy Rs. 2 per unit, then the market price of the goods will be 50<br />
+ 5 – 2 = Rs. 53 per unit.<br />
G.N.P. at factor cost means total of factor cost value of all the final goods and<br />
services produced in a nation in one year.<br />
G.N.P. at factor cost = G.N.P. at Market prices – Net indirect taxes (i.e., Indirect<br />
Tax – Subsidy)<br />
2. Gross Domestic Product (G.D.P.) :<br />
There is a difference between Domestic product and National product. The<br />
production which occurs within the domestic territory of nation is called Domestic<br />
product. Production by all the residents of a nation, whether it is within the domestic<br />
territory of a nation or outside the domestic territory, is called National product.<br />
Gross Domestic Product at Market prices means total of market value of all<br />
the final goods and services produced within the domestic territory of a nation in one<br />
year.<br />
According to Samuelson and Nordhaus, “Gross Domestic Product is the name<br />
we give to the total dollar value of the final goods and services produced within a<br />
nation during a given year.”<br />
In other words, as the most comprehensive measure of nations total output of<br />
goods and services, GDP is the total sum of rupee value of consumption, gross<br />
investment, government purchases of goods and services and net exports produced<br />
within a nation during a given year.<br />
Formula: G.D.P. at Market Prices = G.N.P. at Market Prices-Net Factor Income<br />
from Abroad.<br />
75<br />
Or<br />
G.D.P. at Market Prices = C + I + G + (X-M)<br />
Where, C= Consumption / Consumer goods, I= Investment / Capital goods,<br />
G = Government produced goods / Purchases, X = Export Value, M = Import Value.<br />
Gross Domestic Product at Factor Cost refers to the total cost in terms of<br />
factor prices or incomes incurred to produce the total production of goods and services<br />
by a country during the period of one year. It is the total income earned by the people<br />
in the form of factor prices like wages and salaries, rents, interest, dividends,<br />
undistributed corporate profits, mixed incomes, direct taxes.<br />
Formula G.D.P. at factor cost = G.D.P. at Market Price + (S –T)<br />
Where, S = Subsidies, T = Indirect Taxes
In other words, G.D.P. at factor cost means total of factor cost values of all the<br />
final goods and services produced within the domestic territory of a nation in one year.<br />
Formula: G.D.P. at factor cost = G.D.P. at Market Prices – Net Indirect Tax<br />
3 Net National Product (NNP) :<br />
Net National Production at Market Prices means total of market value of net<br />
final goods and services produced in a nation in one year. NNP refers to the value of<br />
the net output of the economy during the year. It is obtained by deducting the value of<br />
depreciation or replacement allowance of the capital assets, from GNP. The word net<br />
refers to the exclusion of that part of the total output, which representing depreciation.<br />
The concept of net production is more important than that of gross production because<br />
it shows the true availability of output for the economy.<br />
Formula: NNP at Market Prices = GNP at Market Prices- Depreciation of<br />
Capital<br />
Net National Product at Factor Cost is the net output evaluated at factor<br />
prices. It is the NNP calculated by adding up remunerations of factors of production. It<br />
includes income earned by factors of production through participation in the production<br />
process such as wages and salaries, rents, interests, profits, etc. IT is called National<br />
Income. It can be expressed symbolically as :<br />
NNP at factor cost = NNP at Market Prices – Net Indirect Tax<br />
Or<br />
NNP at Factor Cost – GNP at Factor Cost – Depreciation<br />
4. Personal Income (P I) : The sum of all income actually received by all<br />
individuals or households during a year is known as Personal Income. However, it is<br />
to be noted that national income, that is total income earned and personal income,<br />
that is income actually received are generally different. This happens because social<br />
security contributions, corporate income taxes and undivided corporate profits are<br />
earned incomes, but which are not actually received. Similarly, there are certain<br />
incomes, which are actually received but are not earned. For example, transfer<br />
payments like pension, unemployment allowance, relief payments and interest received<br />
on public debt. We, therefore, define personal income as,<br />
Personal Income = National Income – Social Security Contribution –<br />
Corporate Income Tax – Undistributed Corporate Profits + Transfer Payment.<br />
5. Per Capita Income (PCI): National Income does not paint real picture of<br />
standard of living of the individuals or people, hence, Per Capita Income is considered<br />
as the real measures or method or indicator of economic development of the country.<br />
The average income of the people in a particular year is called Per Capita Income. It is<br />
the per head income of a person or an individual in the country. When we divide national<br />
income by the population of the country in that particular year then we get PCI. The<br />
term PCI is expressed symbolically as :<br />
76
National Income<br />
Per Capita Income = ———————-<br />
Population<br />
6. Disposable Income (DI): Personal Disposable Income means the part of<br />
Personal income which can be spent by residents of a nation. The whole personal<br />
income accruing to individual is not available to spend. A part of the personal income<br />
has to be paid by individuals to the Government by way of direct taxes. That part of<br />
personal income, which is left behind after payment of direct taxes is called Disposable<br />
Income.<br />
Symbolatically,<br />
Disposable Income = Personal Income – Direct Taxes<br />
Personal Disposable Income may be used for consumption or saving<br />
Personal Disposal Income = Personal Consumption Expenditure + Personal Saving<br />
5.2.3: National Income Accounting :<br />
Now a day the measurement of national income has assumed great significance<br />
in all the economics with the measurement of national income. We can know rate of<br />
growth of the economy, the fluctuations in the economy and we can evaluate the<br />
economic policy also. Production and sale of goods and services and the generation<br />
of income which accompanies these activities are processes that go on continuously.<br />
Production gives rise to income; income gives rise to demand for goods and services;<br />
and demand in turn gives rises to expenditure; again expenditure leads to further<br />
production. The circular flow of production, income and expenditure represents three<br />
related phases, namely production, distribution and disposition. These three phases<br />
enable us to look at national income in three ways –as a flow of goods and services,<br />
as a flow of incomes or as a flow of expenditure on goods and services. To measure it<br />
at each phase, we require different data and methods. If we want ot measure it at the<br />
phase of production, we have to find out the sum of net values added by all the producing<br />
enterprises of the country. If we want to measure it at the phase of income distributed,<br />
we have to find out the total income generated in the production of goods and services.<br />
Finally, if we want to measure it at the phase of disposition, we have to know the sum<br />
of expenditures of the three spending units in the economy, namely, government,<br />
consumer households, and producing enterprises.<br />
Corresponding to the three phases, there are three methods of measuring<br />
national income. They are: 1. Product Method (Final Goods Method and Value Added<br />
Method), 2. Income Method, 3. Expenditure Method.<br />
1. Product Method: A) Final Goods Method : In an economy the production<br />
units produce different kinds of final goods and services e.g. sugar cloth, oil, medicine<br />
machine, wheat, rice, milk, doctor’s services, teacher’s services etc. The value of the<br />
final goods and services produced in a country in a year is known as gross national<br />
77
product. But the problem involved in that the measurement of different goods produced<br />
in the economy are different e.g. cloth produced is expressed in meters, milk in liters,<br />
oil in liters, wheat in quintals or tonnes, etc. So it is difficult to know the sum total of<br />
these goods. To overcome this problem the money prices of these goods and services<br />
are taken. Then, the money values of all the final goods and services produced are<br />
added and this sum is called Gross National Product at Market Prices.<br />
Illustration :<br />
Goods Production Market Price Total Value<br />
Cloth 5000 meter Rs. 10 meter Rs. 50000<br />
Sugar 200 quintal RS. 1000 quintal Rs.2,00,000<br />
Wheat 10 tonne Rs. 10000 tonne Rs. 1,00,000<br />
Milk 500 liter Rs. 20 liter Rs. 10,000<br />
Silver 100 k.g. Rs. 1000 k.g. Rs. 1,00,000<br />
Tractor 05 Rs. 3,00,000 Rs. 15,00,000<br />
National Income = Rs. 19,60,000<br />
B) Value Added Method: According to final goods approach, only the money<br />
value of final or finished goods and their output should be considered by neglecting<br />
the output of intermediate goods and raw materials, which facilitates to avoid double<br />
counting. For example, while measuring output of textile industry only the total output<br />
of cloth should be taken into account.<br />
In this method the value added by each enterprise in the production goods and<br />
services is measured. This method involves the following steps:<br />
a) Identifying the producing enterprise and classifying them into industrial sectors<br />
according to their activities.<br />
b) Estimating net value added by each producing enterprise as well as each<br />
industrial sector and adding up the net value added by all the sectors.<br />
All the producing enterprises are broadly classified into three main sectors namely:<br />
1) Primary sector which includes agriculture and allied activities, 2) Secondary sector<br />
which includes manufacturing units and 3) Tertiary sector which include services like<br />
banking, insurance, transport and communication, trade and professions. These sectors<br />
are further divided into sub-sectors and each sub-sector is further divided into<br />
commodity group or service-group. For calculating the net product of the inductrial<br />
sector we need to know about gross output of the sector, the raw materials and<br />
intermediate goods and services used by the sector and the amount of depreciation.<br />
For an individual unit, we subtract from the value of its gross output, the value of raw<br />
material and intermediate goods and services used by it and, from this, we subtract<br />
the amount of depreciation to get net product or value added by each unit. Adding value<br />
78
added by all the units in one sub-sector, we get value added by the sub-sector. Again<br />
adding value added or net products of all the sub-sectors of a sector we get valueadded<br />
or net product of that sector. For the economy as a whole, we add net products<br />
contributed by each sector to get Net Domestic Product. If the information regarding<br />
the final output and intermediate goods is available in terms of market prices we can<br />
easily convert it in terms of factor costs by subtracting net indirect taxes to it. If we add<br />
or subtract net income from abroad we get Net National Product at factor cost which is<br />
nothing but National Income.<br />
The symbolic expression of this method of measuring national income is:<br />
Y = (P – D) + (S – T) + [(X –M) + (R – P)]<br />
Where, Y = National Income, P = Domestic production of all productive sectors, D =<br />
Depreciation allowance, S = Subsidies, T = Indirect Taxes, X = Exports, M = Imports,<br />
R = Receipts from abroad, P = Payments made abroad.<br />
Precautions: Following precautions should be taken while measuring national<br />
income of a country through value added method.<br />
1. Imputed rent values of self-occupied houses should be included in the value<br />
of output. Though these payments are not made to others, their values can be easily<br />
estimated from prevailing values in the market.<br />
2. To avoid double counting only the value of output of final or finished goods<br />
should be considered.<br />
3. Value of services of housewives is not included because it is not easy to find<br />
out correctly the value of their services.<br />
4. Products self consumption by the producers should be estimated by guesswork.<br />
5. Value of intermediate goods must not be counted while measuring value added<br />
because this will amount to double counting.<br />
6. While evaluating the output, changes in the price levels must be taken into<br />
account.<br />
2. Income Method: Different factors of production pool their services for carrying<br />
out production activities. These factors of production, in return, are paid for their services<br />
in the form of factor incomes. The labour gets wages, land gets rent, capital gets<br />
interest and entrepreneur gets profits. In other words, whatever is produced by a<br />
producing unit is distributed among the factors of production for their services and<br />
aggregate of factor incomes of all the factors of production of all the producing units<br />
from the subject matter of calculation of national income by income method. This<br />
method of estimating national income has the great advantage of indicating the<br />
distribution of national income among the different income groups such as landlords,<br />
owner of capital, workers, entrepreneurs. Measurement of national income through<br />
income method involves the given below steps:<br />
79
1. Like the value added method, the first step in income method is also to identify<br />
the productive enterprises and then classify them into various industrial sectors such<br />
as agriculture, fishing, forestry, manufacturing, transport, trade and commerce, banking<br />
etc.<br />
2. In this step the factor payments of the production units are estimated. Generally<br />
the factor payments are divided into following categories.<br />
a) Compensation of employees which are includes wages and salaries, both in<br />
cash and kind, as well as employers’ contribution to social security schemes. b) Rent<br />
c) Interest d) Profits –dividends, undistributed profits & corporate income tax<br />
3. Mixed Income: It is the income which arises due to work, enterprises and<br />
property. In this it is difficult to know the separate contribution of property and that of<br />
work e.g. the income of the farmer, small shop-keepers.<br />
4. Third Stage: In this stage the factor payments of all the domestic units are<br />
added. It is also called domestic factor income. (Domestic Factor Income = Sum of<br />
factor payments by all units in the domestic territory.)<br />
5. Fourth Stage: Incomes paid by out by all industrial sectors we will obtain<br />
domestic factor income which is also called net domestic product at factor cost.<br />
6. Finally, by adding net factor income earned from abroad to domestic factor<br />
income or<br />
Net Domestic Income at factor cost which is called national income.<br />
Precautions : The following precautions should be consideved for calculating national<br />
inanedy income included,<br />
1. The income from illegal activities like theft, smuggling and gambling should<br />
not be included in national income.<br />
2. Windfall gains like lottery etc. should also not be included.<br />
3. All unpaid services (like services of house wife) should not to be included and<br />
services for payments should be included.<br />
4. Financial transactions and sales of old property are to be excluded, and they<br />
do not add to the real income.<br />
5. Direct tax revenue to the government should be subtracted from the total<br />
income, as it is only a transfer of income.<br />
6. The income derived from new or old shares and bonds is not included in<br />
National income.<br />
7. The value of the production kept for self-consumption is also included in<br />
National income.<br />
8. Profit tax or corporation tax is the part of the profit only. So the profits before<br />
tax should be added in national income but afterwards profits or corporate tax should<br />
80
not be added again. If the profit is added after the tax payment, then however, profit tax<br />
should be added separately in national income.<br />
3. Expenditure Method:<br />
In explaining the concept if G.N.P. we considered different expenditures which<br />
add up the gross national product. Accordingly, we can say that national income can<br />
be measured by adding all final expenditures made for purchases of goods and services<br />
in a year. It should be noted here that incomes from productive activity are received<br />
only because people spend money on goods and services produced by the income<br />
receivers. For simple understanding of the expenditure method of estimating national<br />
income, we can divide expenditure into four groups.<br />
a) Personal consumption expenditure – what private individuals spend on<br />
consumer goods and services.<br />
b) Gross domestic private investment –what private business spend on<br />
replacement, renewals and new investment.<br />
c) Net foreign investment expenditure – what the foreign countries spend on<br />
the goods and services of the national economy over and above what this economy<br />
spends on the output of the foreign countries, i.e. export minus imports.<br />
d) Government purchases – what the government spends on the purchases of<br />
goods and services.<br />
From this we deduct depreciation allowances, and then we get Net National<br />
Product at market prices. From this, if we deduct indirect taxes and add subsidies, we<br />
get National Product at factor cost.<br />
* Precautions: While estimating National income through expenditure method,<br />
the following precautions should be taken.<br />
1. The expenditure made on second-hand goods should not be included because<br />
this does not contribute to the current year production of goods and services.<br />
2. Expenditure on purchase of old shares and bonds from other people and from<br />
business enterprises should not be included while estimating G.N.P. through expenditure<br />
method. This is because bonds and shares are more financial claims and do not<br />
represent expenditure on currently produced goods and services.<br />
3. Expenditure on transfer payments by government such as unemployment<br />
benefits, old age pension should also not be included because no goods or productive<br />
services are produced in exchange by the recipients of these payments.<br />
4. Expenditure on intermediate goods such as fertilizers and seeds by the farmers<br />
and wool, cotton and yarn by manufacturers of garments should also be excluded.<br />
This is because we have to avoid double counting. Therefore, for estimating G.N.P. we<br />
have to include only expenditure of final goods and services.<br />
We have explained above the three alternative methods of estimating national<br />
income. The best way to arrive at national income will be to employ all these three<br />
81
methods so as to permit their cross-checking ensuring accuracy and throwing more<br />
light on details.<br />
5.2.4 : Social Accounting Method :<br />
Social accounting of social accounts has assumed great importance in modern<br />
times. This is so because economic theory is being increasingly applied for the solution<br />
of practical problem. If study of economics is to be truthful, knowledge of social accounts<br />
is absolutely essential. Social accounting is a term which is applied to the description<br />
of the various types of economic activities that are taking place in the community in a<br />
certain institutional frame-work. In social accounting, we are concerned with statistical<br />
classification of the economic activity so that we are able to understand easily and<br />
clearly the operation of the economy as a whole. According to Stone and Murry, “The<br />
term social accounts is used in a general sense to denote an organized arrangement<br />
of all transactions, actual or imputed, in an economic system. In such a system<br />
distinctions are drawn between i) forms of economic activity, namely, production,<br />
consumption and accumulation of wealth, ii)sectors or institutional division of the<br />
economy, and iii) types of transactions, such as sales and purchase of goods and<br />
services, gifts, taxes and other current transfers, etc. Here is another description of<br />
the field of social accounting. The field of studies-summed up by the words social<br />
accounting embraces, however, not only the classification of economic activity, but<br />
also the application of the information thus assembled to the investigation of the<br />
economic system. Social accounting is thus concerned with the analytical as well as<br />
the statistical elements of the study of national accounts.<br />
In the economy there are different sectors are producing different types of goods<br />
and services, i.e. Public sector, Private sector, Co-operative sector, Capital sector and<br />
Rest of world sector. To understand the relationship between various sectors it is<br />
necessary to understand the social accounting method. Now a day the concepts of<br />
economics are changing, because state has accepted the concept of welfare state,<br />
planned economic development and maximum welfare. So social accounting method<br />
is useful for understand the social and industrial sectors income for the measurement<br />
of national income. What is the direction of economic development?, What type of<br />
planning is necessary for economic development? has been cleared through the social<br />
accounting method. This method is also useful for to understand the business cycles,<br />
industrial production, savings, and domestic capital formation. Generally, the problems<br />
of economy are related to the national income and related factors of national income.<br />
Number of transactions is happenings in the day-to-day in the economy. The<br />
consumable goods are purchased by the consumers, farmers are producing the<br />
agricultural products, industrial sector produces the industrial products, purchase of<br />
raw material, purchase of machineries, distribution of wages, collection of tax and<br />
import and export trade etc. transactions are continuously happenings in the economy.<br />
To understand the share of each sectors in the national income it necessary to use a<br />
specific method. Social accounting method is useful for calculate the sector wise<br />
share in the national income.<br />
82
The measurement of national income through social income accounting method<br />
following factors should be taking into consideration.<br />
a) Accounting of Production<br />
b) Accounting of Capital<br />
c) Accounting of Household sector<br />
d) Accounting of Government sector<br />
e) Accounting of Rest of World sector<br />
All above mentioned factors are interdependent. This interdependence or income and<br />
expenditure have taken into consideration in the circular flow of national income. There<br />
are three methods of social accounting of national income measurement. These are<br />
as follows:<br />
A) Double Entry Account System<br />
B) Equation Account System<br />
C) Flow of Funds System<br />
A) Double Entry Account System: In this method the income from various<br />
sectors is shown on the receipts side and expenditure is shown on the liabilities side.<br />
Left side shows the expenditure and right side shows the income. From the production<br />
sector we can understand the income generated from the various sectors and the<br />
expenditure on the various sector. As per this information we can get the national<br />
income data. Following schedules are shown the accounts of house hold sector,<br />
production sector, government sector, capital sector, saving-investment sector and<br />
rest of the world sector.<br />
1) Household Sector: (Figures in Crore)<br />
Sr. No Expenditure Amount Sr. No Receipts Amount<br />
1 Purchase of consumable 1015 1 Sale of factors of 1050<br />
goods and services from production to<br />
production sector production sector<br />
2 Indirect tax and other 80 2 Receipts from 65<br />
liabilities which are<br />
government (transfer<br />
payable to government payment and interest)<br />
3 Saving<br />
Gross National Income 1115 1115<br />
83
2. Production sector: (Figures in Crores)<br />
Sr. No Expenditure Amount Sr. No Receipts Amount<br />
1 Purchase of factors of 1240 1 Goods and services 1120<br />
production from the<br />
sold to household<br />
citizens of the country<br />
sector<br />
2 Direct tax 45 2 Goods and services 110<br />
sold to public sector<br />
3 Savings 32 3<br />
4 Indirect tax 55 4 Gross investment 95<br />
5 Depreciation 25 5 Net import 72<br />
Gross National Income 1397 1397<br />
3. Public Sector (Figures in Crores)<br />
Sr. No Expenditure Amount Sr. No Receipts Amount<br />
1 Goods and services 780 1 Income from the goods 598<br />
purchased by the<br />
and services sold to<br />
production sector the household sector<br />
2 Transfer earnings 37 2 Income from production 211<br />
sector (Direct and<br />
Indirect tax and other)<br />
3 Interest 13<br />
Total National Income 809 809<br />
4. Capital Sector: (Figures in Crores)<br />
Sr. No Expenditure Amount Sr. No Receipts Amount<br />
1 Gross Investment 109 1 Saving of Firm 45<br />
2 Depreciation 19 2 Saving of household 132<br />
Sector<br />
3 Foreign Investment 56 3 Depreciation 35<br />
4 Deficit -28<br />
Gross National Income 184 184<br />
84
5. Rest of World Sector (Figures in Crores)<br />
Sr. No Expenditure Amount Sr. No Receipts Amount<br />
1 Net import of goods and 77 1 Net foreign investment 77<br />
services<br />
2 Gross National Income 77 2 77<br />
3. Equation Account Method: In this method different kinds of signs are used for the<br />
national income accounting instead of figures. Double accounting method used the<br />
figures and Equation method using the various signs for national income accounting;<br />
this is only difference between both methods. With the help of following example we<br />
can explain the Equation method.<br />
Sr. No Expenditure Sign Sr. No Receipts Sign<br />
1 Purchase of factors of A 1 Goods and Services Y<br />
production by the citizens<br />
sold to Household Sector<br />
of the country<br />
2 Direct Tax B 2 Goods and Services R<br />
sold to Public Sector<br />
3 Savings C 3 Gross Investment L<br />
4 Indirect Tax D 4 Net Import V<br />
5 Depreciation E<br />
Gross National Income = A+B+C+D Y+R+L+V<br />
As per the above example Gross National Income = A+B+C+D+E+Y+R+L+V<br />
3. Flow of Funds System: This method creates the relationship between flow of<br />
money and sectoral structure in the economy. Production sector is the central point in<br />
this method. This shows the flow of income comes from the different factors of the<br />
economy and how it spends from the production sector. Accounting of National income<br />
can determine by the flow of money in this method. With the following table we can<br />
explain the national income accounting.<br />
85
Flow of Funds System and National Income Accounting<br />
Rent, Wages, Interest and Production Household Sector (Private<br />
Undistributed profit Sector Consumption )<br />
Direct Tax<br />
Depreciation and undistributed<br />
profit<br />
Net Indirect Tax<br />
Public Sector (Public<br />
Consumers)<br />
Capital Sector (Domestic<br />
Capital Formation)<br />
Rest of World Sector<br />
(Import & Export sector)<br />
Above table clears the relationship between production sector and other sectors<br />
income and expenditure flow. Private consumption is the receipt side of production<br />
sector and private consumption is the expenditure side of the household sector. In<br />
other words the expenditure side of other sectors is the income side of the production<br />
sector. With the help of following diagram we can explain the interdependence of<br />
income and expenditure of different sectors.<br />
Figure No 5:<br />
Production<br />
Sector<br />
Private Consumption<br />
Government Consumption<br />
Total saving and investment<br />
Household<br />
Sector<br />
Government<br />
Sector<br />
Capital<br />
Sector<br />
Export - Import<br />
Rest of the<br />
World Sector<br />
The flow of income from the different sectors of economy to production sector<br />
has shows with the help of arrow. In the free economy there are multiple transactions<br />
of the various countries. With assume above thing the diagram of flow of funds has<br />
prepared with consideration of income of production sector, consumption, capital<br />
formation and import-export.<br />
86
Social accounting method is also having some limitations. No any method is<br />
without limitations. Different methods are necessaries as per different objectives. This<br />
method is useful for only monetary transactions, but in the economy there are different<br />
transactions are happenings without money. These are not considered in this method.<br />
5.3 Summery :<br />
National Income is the very important factor in the Country. This an important<br />
factor in the economic development process of an economy. The concept of national<br />
income has originated in the 17 th century. In that time, there was the barter system in<br />
the economy. This system had number of problems. Today production sector has<br />
working the collection of factors of production from the household sector. So there is<br />
a circular flow between the production and household sector. There is Two sector,<br />
Three sector, Four sector and Five sector circular flow of national income is seen in<br />
the economy. This includes household sector, production sector, capital sector,<br />
government sector and rest of the world sector. The national income is circulating<br />
among these five sectors in the economy.<br />
National income is an important macroeconomic variable. National income is<br />
very important variable for tackle the issues of poverty, employment, economic<br />
development, industrial development, inflation-deflation. There are different kinds of<br />
concepts of national income i.e. Gross National Income, Gross Domestic Product,<br />
Net National Product, National income at factor cost and market price, and at constant<br />
prices and current prices, Per capita income, Disposable income etc.<br />
Goods and Services produced in the economy measured with the different forms.<br />
The market value of the goods and services is also different. So in this case the<br />
different methods of national income accounting also used for measurement of national<br />
income. Production method, Income method and the Expenditure method are the<br />
important methods of national income accounting. Social accounting method also is<br />
taking in to consideration for measurement of national income. Some precautions are<br />
necessary to take into consideration while measuring the national income with above<br />
different methods.<br />
5.4 : Objective Type Questions :<br />
A) Choose the correct alternatives from the following and rewrite the sentence.<br />
1. The origin of National Income concept in ———————century.<br />
a) 17 th b) 18 th c) 19 th d) 20 th<br />
2. Two sector circular flow of national income including ———————.<br />
a) Government and Institution b) Household and Production sector<br />
c) Production firms and Business firms d) None of the above<br />
3. ———————— is the method of national income accounting.<br />
a) Production b) Income c) Expenditure d) All of the above<br />
87
4. -——————— branch of <strong>Economics</strong> studied the National Income.<br />
a) Micro b) <strong>Macro</strong> c) Agriculture d) None of the above<br />
5. National income is basically income of —————————years in the economy.<br />
a) 1 b) 2 c) 3 d) 4<br />
6. Net National Income = Gross National Income - —————————<br />
a) Depreciation b) Expenditure c) Rent d) Profit<br />
B) Answer in one sentence<br />
1. Define Gross National Product<br />
2. What is Gross Domestic Product?<br />
3. What is Net National Income?<br />
4. Which sectors are included in the three sector circular flow of national income?<br />
5. Give the two methods of measurement of national income<br />
5.5: Answers of Self – learning questions:<br />
A) 1 - a 2 - b 3 - d 4 - b 5 - a 6 – a<br />
B) 1 - The total market value of all final goods and services produced in a year. It has<br />
already been seen that whatever is produced within the domestic territory of a country<br />
in a year is its gross domestic product. It, however, includes, the contribution made by<br />
non-resident producers by way of wages, rent, interest and profits. The non-residents<br />
work in the domestic territory of some other country and earn factor incomes.<br />
2. Total of market value of all the final goods and services produced within the domestic<br />
territory of a nation in one year<br />
3. NNP at Market Prices = GNP at Market Prices- Depreciation of Capital<br />
4. Three sector circular flow of national income includes the household, production<br />
and capital sector.<br />
5. Income method and Product method are the two methods of National income<br />
accounting.<br />
5.6 : Questions for practice.<br />
A) Answer the following questions in brief.<br />
1. Explain the five sector circular flow of national income<br />
2. Explain the different concepts of national income<br />
3. State the Social Accounting Method of measurement of national income<br />
4. Explain the two sector circular flow of national income<br />
B) Write short notes :<br />
1. Three sector circular flow of national income<br />
2. Gross Domestic Product<br />
88
3. NNP<br />
4. PCI<br />
5. Social Accounting<br />
6. Product method of national income accounting<br />
5.7: References for further reading<br />
1. Edward Shapiro, <strong>Macro</strong> Economic Analysis, Galgotia Publications Pvt. Ltd., Fifth<br />
edition, 1990.<br />
2. H.L. Ahuja, <strong>Macro</strong> <strong>Economics</strong> (Theory and Policy), S. Chand and Company Ltd.,<br />
New Delhi, Seventh revised edition, 1999<br />
3. B.K. Sharma & Gulshan Kumar, Introductory Micro & <strong>Macro</strong> <strong>Economics</strong> Theory,<br />
Modern Publishers Jalandhar, 2004<br />
4. Dr. J.F. Patail, Tamhankar, Sahastrabuddhe, <strong>Macro</strong> <strong>Economics</strong>, Phadake Prakashan,<br />
Kolhapur, 2004<br />
5. Bhosale & Kate , <strong>Macro</strong> <strong>Economics</strong>, Phadake Prakashan, Kolhapur, 1999.<br />
6. R.K.Shinde, <strong>Macro</strong> <strong>Economics</strong>, Ravil Prakashan, Satara, 1978<br />
7. Dr. Mukund Mahajan, <strong>Macro</strong> <strong>Economics</strong>, Nirali Prakashan, Pune, 2000<br />
8. Ashok Dange, Dr. Kakade, Business <strong>Economics</strong>, Phadake Prakashan, Kolhapur,<br />
1998.<br />
● ● ●<br />
89
Unit – VI<br />
Neo Classical and Keynesian Synthesis<br />
6.0 Introduction<br />
6.1 Objectives<br />
6.2 Subject analysis<br />
6.2.1 IS-LM Model<br />
6.2.2 Extension of IS-LM model with government sector and Labour market<br />
6.2.3 Relative effectiveness of morietiary and fiscal policies with the help of IS-LM<br />
model.<br />
6.2.4 The new classical critiques on Micro foundations.<br />
The new classical approach, policy implications of new classical approach-<br />
Empirical evidence.<br />
6.3 Summary<br />
6.4 Terms to remember (Glossary)<br />
6.5 Check your progress<br />
6.6 Answers to check your progress<br />
6.7 Questions for practice.<br />
6.8 References for further study.<br />
6.0 Introduction :<br />
In the preceding unit we have discussed the National Income and its auditing.<br />
Circular flow of National Income and its relationships in two-sector, four-sector & five<br />
sector Interrelations. In this unit we are explaining the role of the interest rate and<br />
money in the Keynesion system and construction of IS-LM model to show how<br />
equilibrium rate of interest and level of income are jointly determined. When the price<br />
level is assumed to remain constant. The IS-LM model is used to find the value of the<br />
interest rate and level of income that simultaneously equilibrate both in commodity<br />
market and money market. Similarly, both fiscal and monetary policy instruments affects<br />
the level of income. We are examining the relative effectiveness of the two types of<br />
policies. The difference in the value of the government expenditure multiplier in the two<br />
models. That is the simple Keynesian model and the IS-LM model has been accepted<br />
as an important policy implication. The shifts and slopes of IS-LM curves are also<br />
explained in this concern. We are also discussing new classical critique on micro<br />
foundations and the new classical approach, The objectives of the study are as under.<br />
90
6.1 Objectives :<br />
1) To discuss the Neo Classical and Keynesian Synthesis.<br />
2) To elaborate the IS-LM model in detail.<br />
3) To study the relative effectiveness of monetary and fiscal policies with the<br />
help of IS-LM model.<br />
4) To understand the New Classical critiques on micro foundations.<br />
5) To analyse the New Clasical approach, and policy implications of New<br />
Classical approach and its empirical evidences.<br />
6.2 - Subject Analysis.<br />
6.2.1- IS-LM Model.<br />
Introduction -<br />
The basic macroeconomic model developed in this chapter is known as the<br />
IS-LM model. The IS-LM model was first developed in 1937 by Nobel laureate Sir. John<br />
Hicks, who intended to explore the graphical representation of the ideas presented by<br />
Keynes in his famous book. “General Theory of Employment, Interest and money”<br />
published in 1936 Keynes belived that ‘wages and prices don’t adjust quickly to clear<br />
the markets,’ Hicks however, assumed that the price level is fixed, at least temporarily.<br />
Post ‘Hickian generations of economists have worked to retine the IS-LM model. It has<br />
been widely applied their analyses to cyclial luctuations and macro- economic policy,<br />
and forecasting.<br />
The IS-LM model has been commonly identified as Keynesian approach to<br />
business cycle. Classical economists believed that wages and prices are move rapidly<br />
clears the markets. IS-LM model assumes that the price level is fixed. However the<br />
conventional IS-LM model may be easily adapted to allow for rapidly adjusting wages<br />
and prices. Thus the IS-LM framework, although, originally developed by Keynesian,<br />
also used to present and discuss the classical approach to business cycle. In addition,<br />
the IS-LM model is equivalent to the Keynesian AD-AS model.<br />
Using the IS-LMmodel as a teamwork for both classical and Keynesian analysis<br />
renders several practical benefits. First, it avoids the need to learn two deterrent models.<br />
Second, by utilizing a single teamwork it explore large areas of agreement between<br />
the Keynesian and classical approaches showing how two approaches dieter Moreover<br />
this version of the IS - LM model is so often applied to analysis of the economy macro<br />
- economic viable in the through proper policy initiatives By, studying this framework it<br />
will help to understand tally the cerate economic debates on macro economic prices.<br />
In this chapter we have explained the role & merest rate and money in the<br />
Keynesian system. The construction of IS - LM model shows how the equilibrium rate<br />
& interest and level & income are jointly determined. The model further tells us how<br />
both interest rates and aggregate output are also determined when the price level is<br />
assumed to nemine constant.<br />
91
Structure of the model : The IS-LM model emphasises the interaction between<br />
the goods and asset markets. The Keynesian model looks at income determination by<br />
arguing that income affects spending which, in turn, determination output (GNP) and<br />
income (GNI) J. R. Hicks and A. H. Hansen have added the affects of interest rates on<br />
spending vis-a-vis income and the independence of asset markets on income. Higher<br />
income raises money demand and also interest rates. Higher interest rates lowers<br />
spending and also income. Spending interest rates and income are determined jointly<br />
by equilibrium in the goods and assets markets as shown as fig 6.1<br />
Figure - 6.1<br />
National income<br />
Assets markets<br />
money<br />
market<br />
Supply<br />
demand<br />
Bond<br />
market<br />
Supply<br />
demand<br />
Commodity markets.<br />
GNP = Aggregate<br />
demand.<br />
Monetary policy<br />
Interest rates<br />
Fiscal policy<br />
Basis of IS-LM curve Model.<br />
The IS-LM curve is used to final out the values of the interest rate and level of<br />
income. This simutanceously equilibrate both commodity market and money market.<br />
We have identified the combinations of income and interest rate that equilibrate<br />
the commodity market, neglecting the money market. They we identified the<br />
combinations of income and rate of interest that equilibrate the money market. These<br />
two set of equilibriums brings out the equilibriums in both markets. At this stage we<br />
assumed that there is no change in policy variables such as money supply, government<br />
expenditure and taxes, we also took other autonomous influences on income and<br />
interest rates as fixed in the short run. We have seen that these policy variables and<br />
other exogenous influences determines the shapes and slopes of the two cures i.e. IS<br />
and LM, which are indicators of commodity of (product) market equilibrium, and money<br />
market equilibrium respectively.<br />
Product (Goods) Market equilibrium : IS curve<br />
Derivation of IS curve<br />
Equilibrium in the goods market requires Y=C+I and S=I i.e. all the factors that<br />
cause the consumption function and saving function to shift and all the factors that<br />
92
cause the Investment function to shift influence the determination of this equilibrium.<br />
Other factors may be introduced once the basic model is developed, we assume here<br />
that investment is a function of the interest rate alone and that consumption and<br />
saving is a function of income alone. Following three equations are to cover the goods<br />
market equilibrium under C+ I<br />
consumption function : C= (Y)<br />
Investment function : I + I (r)<br />
Equilibrium condition : Y = C (Y) + I (r)<br />
Similarly under I, S Approach we derive the follow the three equilibrium general to lover<br />
the goods market equilibrium.<br />
Saving function : s = s (y)<br />
Investment function : I = I (r)<br />
Equilibrium condition : s (Y) = I (r)<br />
we to develop the capture which follows either or both the approaches, but the attention<br />
is limited to that based of I, s approach. From the IS schedule we can new determine<br />
the IS cure. The IS schedule represents the functional relationships between rate of<br />
interest and investment function. income - saving function and interest rate - income<br />
functions.<br />
Table . 6.1<br />
IS Schedule<br />
(Rs. in crores)<br />
Interest rate-Investment function Income-saving function Interest rate-Income function<br />
Interest rate (%) Investment Income saving Interest rate (%) Income level<br />
5 20 40 20 5 40<br />
4 40 80 40 4 80<br />
3 60 120 60 3 120<br />
2 80 160 80 2 160<br />
1 100 200 100 1 200<br />
Three functional relationships are shown in the IS schedule. First one is the<br />
relationship between interest rate and investment which is inversely proportionate.<br />
Means the negative relationship. Secondly the relationship between income and saving<br />
which is proportionate means the positive relationship. Thirdly the interest rate income<br />
function is inversely proportionate. When interest rate decreases the income level<br />
increases.<br />
Based on the set of equations and IS schedule, we have drawn the IS curve in<br />
figure No 6.2<br />
93
S<br />
S<br />
100<br />
100<br />
80<br />
60<br />
S<br />
80<br />
60<br />
S<br />
40<br />
40<br />
20<br />
0<br />
r<br />
5<br />
20<br />
Y<br />
S<br />
0<br />
40 80 120 160 200 20 40 60 80 100<br />
I<br />
(C) Saving Function I (B) Saving Investment<br />
S=S (Y)<br />
Equility S=I<br />
5<br />
4<br />
3<br />
S<br />
4<br />
3<br />
I<br />
2<br />
2<br />
1<br />
1<br />
0<br />
0<br />
40 80 120 160 200 20 40 60 80 100<br />
(D) Goods market Equilibrium<br />
S (Y) = I (r)<br />
(A) Investment Function<br />
I = I (r)<br />
Part (A) in fig 6.2 gives us the investment spending schedule, showing that<br />
investment spending varies inversely with the interest rate.The straight line in part (B)<br />
is drawn at 45 0 angle from the origin. The planned investment is measured along the<br />
horizontal acres of part (B), the planned saving is also measured along the vertical<br />
axis of part (B), i.e.. they one same. Therefore all points along the 45 0 line in part (B)<br />
indicate equality of saving and investment. Part (c) brings out saving function whach<br />
shows that saving varies directly with income.<br />
The IS came in part D is derived from the other parts of the figure. For example,<br />
assuming an interest rate of 5 percent in part (A) indicating that investment is Rs. 20<br />
croros during the period, assumed satisfay the equal to investment. i.e. between sand<br />
I. and saving must also be equal to investment i.e. which is shown on the vertical axis.<br />
94
In part (c) saving will be Rs. 20 crores only at the income level of Rs. 40 crores finally,<br />
bringing together Y of Rs 40 crones from part (c) and R of 5 percent from part (A)<br />
yields one combination of Y and r at which s = I (and Y= C+I) is observed, If we<br />
assume the lower Interest rate of 4 percent, part (A) indicates that investment will be<br />
Rs- 40 crores, which yields an income. level of Rs. 80 crores in part (C), Therefore, Y<br />
of Rs. 80 crones and r of 4 percent is another combination of y and r at which S= IS<br />
obtained. Other combinations could be we obtain IS found in the same way. Connecting<br />
all such combination curve in part (D) lastly.<br />
There is no longer a single level of income at which S=I, but a different level for<br />
each different interest rate. The higher the interest rate, the lower will be the level of<br />
income at which S=I is viewed in one way, this follows from the fact that a high means<br />
of low I. Lower I, through multiplier effects means a lower y. Viewed in another way it<br />
follows from the fact that, a low Y means low S. Because equilibrium requires S=I<br />
lows means low I. Low I is the result of a high r. Although the IS function indicates that<br />
equilibrium in the goods market will be found at a lower level of income for a higher<br />
interest rate, it alone does not reveal combination of y and r will be found in any specific<br />
time period. All combinations on the IS function are equally possible combinations of y<br />
and r in the goods market.<br />
Money Market equilibrium : The LM Curve<br />
Derivation of LM curve<br />
Equilibrium in money market require an equality between the supply of and the<br />
demand for money. The Keynesion theory of the demand for money makes the<br />
transactions demand (here combined with the precautionary demand ) a direct function<br />
of the income level alone, or mt = K(y). It makes the speculative demand an inverse<br />
function of the interest rate alone, or msp = h (r), total demand for money is ms =mz +<br />
msp = K(Y) + h (r), The supply of money, ms is determined outside the model - it is<br />
exogenous. This may be written as ms = ma' in which ma is simply the amount of<br />
money that exists, an amount determined by the monetary authorities (The monetary<br />
authorities determine only the nominal stock of money, Ms but with P ( price level )<br />
assumed to be stable, determination of Ms also determines ms ) This gives us three<br />
equations to cover the money market :<br />
Demand for money : md = K (Y) + h (r)<br />
supply of money : ms = ma<br />
Equilibrium condition : md = ms.<br />
The functional relationships between (1) interest rate and money supply., (2)<br />
interest rate and demand for money ( transaction demand, precautionary demand and<br />
speculative demand), and (3) interest rate and income is shown in LM schedule -<br />
95
Table 6.2 -LM Schedule.<br />
(Rs. in Crores)<br />
Money support Function Demand for money LM Schedule<br />
Interest Money Interest Speculative Income Pronations Interest Income<br />
Rate (%) supply rate (%) demand & precautionary rate (%) (Rs.<br />
(Rs-m crores) for money demand for money Crores)<br />
1 2 3 4 5 6 7 8<br />
2 100 2 100 40 0 2 40<br />
3 100 3 80 80 20 3 80<br />
4 100 4 60 120 40 4 120<br />
5 100 5 40 160 60 5 160<br />
6 100 6 20 200 80 6 200<br />
Based on the figures in LM schedule and the set & equations, we can now<br />
derive the LM crore as shown in figure No. 6.3<br />
mt<br />
100<br />
80<br />
(C) Transaction<br />
Demand<br />
mt = K (y)<br />
mt<br />
100<br />
80<br />
(B) Supply of<br />
money<br />
ms = mt + msp<br />
60<br />
40<br />
20<br />
0<br />
r<br />
6<br />
5<br />
4<br />
3<br />
2<br />
1<br />
0<br />
40 80 120 160 200 y 0<br />
20 40 60 80 100<br />
(D) Money<br />
market<br />
Equilibrium<br />
ms=Ky+h(r)<br />
0<br />
40 80 120 160 200 y 20 40 60 80 100<br />
60<br />
40<br />
20<br />
r<br />
6<br />
5<br />
4<br />
3<br />
2<br />
1<br />
msp<br />
(A) Specal affive<br />
Demand<br />
msp = h(r)<br />
msp<br />
96
part A shows the speculative demand for money as a function of r. part B is<br />
drawn to show a total money supply of Rs 100 crores. All of which must be held in<br />
either transactions or speculative balances. The points along the line indicate all the<br />
possible ways in which the given money supply may be divided between mt and msp<br />
part c shows the amount of money required for transactions purposes at each level of<br />
income on the assumption that k= ½.The LM curve of part D is derived from the other<br />
parts as follows.<br />
Assume in part A an interest rate of 4 percent, at which the public will want to<br />
hold Rs. 40 crores in speculative balances. In part B, subtracting the Rs 40 crones of<br />
speculative balances from a total many supply of Rs 100 crores leaves Rs 60 crones<br />
of transactions balances, an amount consistent with an income level of Rs 160 crones<br />
as shown in part c. finally, in part D, bringing together y of Rs 160 from part c and 4<br />
percent from part A yields anecrmaination at y and at which md = ms or at the pomp<br />
beaver there is equilibrium in the money market. If we assume the lower interest rate<br />
of 3 percent, part A indicates that speculative balances of Rs. 40 and part C transaction<br />
balances Rs 40 and part c indicates the income level of Rs 120 crones as that consistent<br />
with transactions balances of Rs 40. This yields another combination of y and the Rs<br />
120 crores and 3 percent at which md= ms. Other such combinations can be derived<br />
in the same way. In part D, the function labeled LM results when these combinations<br />
are connected.<br />
The characteristics of the LM function slopes upward to the right, with a given<br />
stock of money, money market equilibrium is found at combinations of high interest<br />
rates and high income levels or low interest rates and low income levels. Viewed in<br />
one way, this follows from the fact that a high level of income calls for relatively large<br />
transactions balances, with a given money supply, when can be drawn out of<br />
speculative balances only by pushing up the interest rate, viewed in another way, it<br />
follows from the fact that at a high interest rate speculative balances will be low, this<br />
releases more of the money supply for transaction balance. This money will be held in<br />
such balances only at a correspondingly high level of income. Although the Lm function<br />
indicates why equilibrium in money market occur at a higher interest rate for a higher<br />
level of income ? It alone cannot reveal what particular combination of Y and r will be<br />
found in any given time period. All combinations of LM functions are equally possible<br />
equilibrium combinations in the money market.<br />
General equilibrium in the complete IS - LM model.<br />
The labor market, the goods market and the asset market put together and<br />
examined the equilibrium of the economy as a whole is the final step of IS - LM model.<br />
A situation in which all markets in an economy are simultaneously in equilibrium is<br />
called a general equilibrium. Figure 6.4 shows the complete IS-LM model, illustrating<br />
how the general equilibrium of the economy is which shows :<br />
Determined :<br />
- The full - employment, or FE line, along which the labour market is in equilibrium .<br />
97
- The IS carve, along which the goods market is in equilibrium, and .<br />
- The LM carve, along which the asset market is in equilibrium,<br />
Fig 6.4<br />
General equilibrium in the IS - LM model.<br />
Real<br />
Interest<br />
Rate (r)<br />
FE line<br />
E<br />
LM curve<br />
IS curve<br />
O<br />
y<br />
output<br />
Y<br />
Full employment output<br />
The economy is in general equilibrium when quantities supplied equal quantities<br />
demanded in every market. The general equilibrium point E lies on the IS crore the LM<br />
curve and the FE line. Thus at E and at E, the goods market, the asset market and the<br />
labour market are simultaneously in equilibrium.<br />
6.2.2 Extension of IS-LM model with Government sector and Labour Market :<br />
Factors that shift the IS curve<br />
To analyses the causes and effects of shift of the IS curve we have to incorporate<br />
government expenditure and taxes in our analysis. The IS curve will shift if any or all<br />
of the components of autonomous expenditures T, (Tax revenue) I, (Investment<br />
expenditure of firms) and G (Government spending) Change Fig. 6.5 shows the shift<br />
of IS curve. Fig. 6.5 Rightward shift of the IS curve with an increase in government<br />
spending.<br />
a) Investment plus Government r spending<br />
r 1<br />
r 0<br />
I (r) + G1<br />
I 0<br />
+G 0<br />
O<br />
98<br />
I 0<br />
+G 1<br />
I (r)+G 0<br />
I + G
) Saving plus Taxes<br />
S+T<br />
I 0<br />
+G=S 1<br />
+T 0<br />
S (y-T 0<br />
) + T 0<br />
I 0<br />
+G 0<br />
=S 0<br />
+T 0<br />
O Y 0<br />
Y 1<br />
Y<br />
c) IS curve<br />
r<br />
O Y 0<br />
Y 1<br />
Y<br />
r 1<br />
r 0<br />
E<br />
iG<br />
1<br />
I-b<br />
E 1 IS 1<br />
IS 0<br />
If Government spending increases to G, in Fig. 6.5 (a) the combined investment<br />
plus Government spending curve shifts out to the right turn I 0<br />
+G 0<br />
to I 0<br />
+G. At a fixed<br />
interest rate or investment will main unchanged. In order to maintain equilibrium with<br />
fixed level of taxes, saving has to rise from S 0<br />
to S 1<br />
, which requires income to rise<br />
from Y 0<br />
to Y 1<br />
in part (b). At interest rate or the equilibrium point in the product market<br />
shifts from E to E. Thus an increase in G shifts the IS curve to the right from IS 0<br />
to IS,<br />
in part (c).<br />
The IS curve shifts by horizontal distance E to E 1 when G increases by iG.<br />
The horizontal shift of the IS (e.g. distance EE 1 ) is that amount of the increase in<br />
income is required to generate new saving equal to increase in government spending.<br />
Since the increased saving is MPS times of iY, the required increase in iy (the<br />
horizontal shift of the IS curve) will be iG = iS (I-b) iY. So the amount of such shift<br />
of the IS curve per unit increase in a is [1/(1-b)], the autonomous expenditure multiplier.<br />
In terms of Fig. 6.5. EE 1 + iY + Y 1<br />
-Y 0<br />
= iG(1/1-b); ...... r and therefor I remaining<br />
99
constant. Here the multiplier effect is present due to induced increase in consumption<br />
caused by rising government spending, with investment remaining fixed.<br />
An increase in MEC caused by a favorable shift in expectations about the future<br />
profitability of investment projects increases investment demand corresponding to<br />
each interest rate. As a result the I (r) curve shifts to the right and hence the combined<br />
I+G curve to the right in Fig. 6.7 (a). This rights ward shift of the I (r) curve, by the<br />
amount of the autonomous increase in investment, has exactly the same effect on the<br />
Is curve as an equal increase in G as shown in Fig. 6.6 (c). Each type of change can<br />
increase in I or G shifts the I + G curve and this shift, in turn, shifts the IS curve to the<br />
right the autonomous, expenditure multiplier [1/(1+b)] times the increase in G or increase<br />
in I.<br />
Taxes are leakages from the curricular flow of income, an increase in taxes<br />
shifts the S + T schedule to the left in part (b) of the fig. 6.6. At the same interest rate<br />
of which fixes . I 0<br />
and thus I 0<br />
+G 0<br />
saving and therefore, income must fall to maintain the<br />
equilibrium condition in the commodity market. I+G = S+T. After the tax increase,<br />
income falls from Y 0<br />
(Point E) to Y 1<br />
(Point E 1 ) in order to ensure product market<br />
equilibrium at the original interest rate of in fig. 6.6<br />
r<br />
Fig. 6.6 Leftword shift of the IS curve with an increase in faxes.<br />
a) Investment Plus<br />
government spending<br />
E<br />
S+T<br />
b) Saving plus Taxes<br />
S(Y-T 0<br />
)+T 0<br />
S(Y-T 1<br />
)+T 1<br />
I 0<br />
+G 0<br />
T 0<br />
=S 1<br />
+T 1<br />
E<br />
r 0<br />
0<br />
I(r)+G 0<br />
I 0<br />
+G 0<br />
I+G<br />
0 Y 1<br />
Y 0<br />
Y<br />
c) IS Curve<br />
r<br />
-b<br />
iT<br />
I-b<br />
Interest rate<br />
r 0<br />
E 1<br />
E<br />
IS 0<br />
(T 0<br />
)<br />
IS 1<br />
(T 1<br />
)<br />
0 Y 1<br />
Y 0<br />
Y<br />
100
Factors shifting the LM curve.<br />
Two factors shift the LM curve any change in the money supply and another<br />
change in the demand for money (liquidity of preference). If central bank policy changes<br />
the effect of money supply change.<br />
Fig. 6.7 Shows the effect of money supply on the LM curve.<br />
a) Money market equilibrium<br />
r<br />
Interest rate<br />
r 0<br />
O<br />
r 1<br />
MS 0 MS 1<br />
M d (Y 0<br />
)<br />
E<br />
F<br />
b) The LM Curve<br />
r<br />
Quantity of money (m)<br />
LM 1<br />
LM 2<br />
Interest rate<br />
r 0<br />
r 1<br />
M S 0<br />
O<br />
E<br />
F<br />
E 1<br />
Y 0<br />
Y 1<br />
M S 1<br />
Income<br />
Fig. 6.7 Rightward shift of the LM curve due to an increase in the Quantity of money.<br />
Part a of the Fig. 6.7 the money market is in equilibrium at point E. If money<br />
supply increases from M S to 0 MS the rate of interest falls from r to r (at a given level<br />
1 0 1<br />
of income Y 0<br />
) as the money market teachers new equilibrium at point F. As a result<br />
the LM curve shifts to the right, indicating lower interest rates at all levels of income -<br />
In the money supply shifts LM curve downward and to the right. The converse is also<br />
true. A fall in money supply will shift the LM curve upward and to the left.<br />
101<br />
(Y)
LM 1<br />
LM 2<br />
Fig. 6.8 shows the leftward shift of the LM curve and to increase in the demand<br />
for money.<br />
If the demand for money increases or decreases the LM curve shifts tot he left<br />
or right. Suppose due to any reason e.g. people's loss of confidence in bonds the<br />
demand for money increases at the same level of income and the same rate of interest.<br />
As a result, the demand curve for money shifts upward and to the right from M d (Y ) to<br />
0 0<br />
M d (Y ) in Fig. 6.8<br />
1 0<br />
Fig. 6.8 Leftward shift of the LM curve due to increase in demand for money.<br />
a) The money market<br />
r<br />
M s 0<br />
Interest rate (r)<br />
r 1<br />
E 1<br />
r 0<br />
m d 0 (y 0 )<br />
E<br />
m d 1 (y 0 )<br />
0 Quantity of Money (m)<br />
b) The LM curve<br />
r<br />
Interest rate (r)<br />
r 1<br />
r 0<br />
0<br />
F<br />
E 1<br />
E<br />
Y 0<br />
Income (Y)<br />
As a result, the equilibrium rate of interest rises for the same level of income<br />
(Y 0<br />
) in part (a). Consequently the LM curve shifts upward and to the left from LM 0<br />
to<br />
LM 1<br />
in part (b).<br />
102
Equilibrium in the Labor market.<br />
Equilibrium in the labor market determines wares and employment; in turn, the<br />
level of employment, together with the quantities of other inputs ( such as capital) and<br />
the level of productivity, determines how much output on economy produce. The basic<br />
model of the labour market rests on the assumption that the quantities of labour supplied<br />
and demanded are equal so that all labor resources are fully utilized.<br />
Equilibrium in the labor market requires that the aggregate quantities of labor<br />
demanded equal the aggregate quaintly of labour supplied.<br />
The full employment level of employment N, is the equilibrium level of<br />
employment reached other wares and prices have fully adjusted, so that the quantity<br />
of labour supplied equals the quality of labour demanded. Full - employment output, y<br />
is the amount of output produced when employment is at its full - employment level for<br />
the curret level of the capital stock and the production function.<br />
Equilibrium in the labour market is represented by the full - employment line, or<br />
FE in Fig - 6.9 IN the fig 6.9 the real interest rate on the vertical armis and output on the<br />
horizontal armis. The FE line is vertical at y = y = because, when the labour market is<br />
in equilibrium, output equals its fall - employment level, retarders of the interest ratio.<br />
Figure No. 6.9<br />
Real Interest rate (r)<br />
FE line<br />
Y<br />
Output<br />
Y<br />
The full = employment level of output is determined by the full employment level of<br />
employment and the curent levels of capital and productivity. Any change that attests<br />
the full. Employment level of output, y will cause the FE line to shift. Recall output that<br />
full employment output, y increases and thus the FE line shifts to the right when the<br />
labor supply increases ( which raises equilibrium employment N) when the capital<br />
stock increases, or when there is a beneficial supply stock. Similarly dropping the<br />
labour supply shock, lowers full employment output, y and shifts the FE line to the left.<br />
103
Factors that shift the full - employment (FE) line.<br />
A(n) Shifts the Reason.<br />
Beneficial supply shock FE line Right 1) More output can be produce. For the<br />
same amount of capital and labour<br />
2) It the MPN rises, labour demand<br />
increases and raises employment full<br />
employment output increases for both<br />
reasons-<br />
Increase in labour supply Right Equilibrium employment rises, raising<br />
full employment output.<br />
Increase in the capital stock Right More output can be produced with the<br />
same amount of labour In addition, in<br />
creased capital may in crease the<br />
MPN, which in creases labour demand<br />
and equilibrium employment.<br />
6.2.3. Relative Effectiveness of monetary and fiscal policies with the Help of<br />
IS-LM model.<br />
The instruments of the fiscal and monetary policy affects the level of<br />
income we may now examine the relative effectiveness of the two types of policies.<br />
Effectiveness means the magnitude of the effect on the equilibrium income y of a<br />
given change in the policy variable such as government expenditure (G), taro (T) or<br />
money supply (M), It may be noted at the outset that the effectiveness of each type of<br />
policy- depends on the slope of Is and Lm curves, which in turn depends on certain<br />
behavioral parameters of the Is - Lm curve model.<br />
Figure No. 6.10<br />
The slope of the Is curve and the effectiveness of fiscal policy-<br />
a) Steep IS Curve b) Flat IS Curve<br />
r<br />
LM 0<br />
r 1<br />
r 0<br />
0<br />
y 0<br />
AC<br />
F<br />
I<br />
iG( )<br />
I-b<br />
LM 0<br />
I<br />
iG( ) r<br />
r I-b 1<br />
1<br />
r 0<br />
IS 1<br />
IS 0<br />
IS 0<br />
IS 1<br />
y 1<br />
y<br />
0<br />
y 0 y 1<br />
y<br />
104
c) Vertical IS Curve<br />
LM<br />
IS 0<br />
IS 0<br />
1<br />
r 1<br />
I<br />
E iG( )<br />
r<br />
I-b<br />
0<br />
0<br />
y 0 y 1<br />
y<br />
In each part of figure No.6.10 an increase in of shifts the IS curve to the right<br />
from IS 0<br />
to IS, In part (a), where the IS curve is steep, this expansionary fiscal policy<br />
action (in the form of an increase in G or a cut in T or both ) results in a relative large<br />
increase in y. The same fiscal policy action is much less effective (y is much smaller )<br />
in part (b) where IS curve is relatively flat, Fiscal policy is further most effective in part<br />
(c), where the IS curve is vertical.<br />
r<br />
The slope of the Lm curve and the effectiveness fiscal policy.<br />
a) Flat LM Curve<br />
r 1<br />
r 0<br />
0<br />
y 0<br />
I<br />
i G ( )<br />
I-b<br />
y 1<br />
LM 0<br />
IS 1<br />
IS 0<br />
Figutre No. 6.11<br />
y<br />
r<br />
r 1<br />
r 0<br />
b) Steep LM Curve<br />
LM 0<br />
I<br />
iSG( )<br />
IS 0<br />
IS 1<br />
0 y 0<br />
y 1<br />
y<br />
c) Vertical LM Curve<br />
r<br />
LM 0<br />
I<br />
iG( )<br />
I-b<br />
IS 0<br />
IS 1<br />
0<br />
y 0<br />
y 1<br />
y<br />
105
In each part of Fig No. 6.11 an increase in G shifts the Is curve to the right from<br />
Is to SI, fiscal policy is most effective in part (a) where LM curve is relatively flat; less<br />
effective in part (b) where Lm curve is steeper; and completely ineffective in part (c)<br />
where the LM curve is vorticella .<br />
The slope of the IS - curve and the effectiveness of monetary policy.<br />
An increase in the money supply shifts the LM curve to the right from LM to LM,<br />
the Figure No. 6.12 This expansionary monetary policy has only a small effect on y in<br />
part (a) where the IS curve is steep. It has a much stronger effect on y in part (b) where<br />
the IS curve is relatively that. IN part (c) where the Is curve the IS curve is vertical, the<br />
income in money supply has neutral effect on equilibrium income.<br />
(a) Steep IS curve<br />
Figure No - 6.12<br />
(b) Flat IS curve<br />
r<br />
iM<br />
C 1<br />
LM 0<br />
r<br />
iM<br />
C 1<br />
LM 0<br />
LM 1<br />
r 1<br />
r 0<br />
0<br />
LM 1<br />
IS 0<br />
y 0<br />
y 1<br />
y<br />
r 1<br />
r 0<br />
0<br />
y 0<br />
y 1<br />
y<br />
(c) Vertical IS curve<br />
r<br />
IS 0<br />
r 1<br />
r 0<br />
0<br />
y 0<br />
=y 1<br />
LM 0<br />
LM 1<br />
y<br />
106
The slope of the LM curve and effectiveness of monetary policy<br />
(a) Flat LM curve<br />
Figure No. 6.13<br />
(b) Steep LM Curve<br />
LM<br />
r<br />
iM<br />
r<br />
0<br />
LM<br />
C 1<br />
1 LM 0<br />
iM<br />
C<br />
LM 1<br />
r 1<br />
1<br />
r 1<br />
r 0<br />
r 0<br />
IS 0<br />
IS<br />
0<br />
0<br />
0<br />
y 0<br />
y 1<br />
y<br />
y 0<br />
y 1<br />
(c) Vertical LM curve<br />
r<br />
iM<br />
C 1<br />
r 1<br />
y<br />
LM 0<br />
LM 1<br />
IS 0<br />
r 0<br />
0<br />
y 0<br />
y 1<br />
y<br />
In each part of fig No 6.13 an increase in money supply shifts the LM curve to<br />
the right from LMo to LM, Monetary policy is least effective in part (a) where the LM<br />
curve is relatively Hat more effective in part (b) where the LM curve is steeper, and<br />
most effective in part (c) where the LM curve is vertical.<br />
The slopes of the Is and Lm curves and relative. Effectiveness of<br />
monetary and fiscal policies.<br />
Steep<br />
Flat<br />
Steep<br />
Flat<br />
Monetary policy<br />
IS curve Ineffective<br />
effective<br />
Fiscal policy<br />
IS curve<br />
Effective Ineffective<br />
107<br />
LM Curve<br />
Effective Ineffective<br />
LM curve<br />
Ineffective Effective
Complete Ineffectiveness of monetary policy in a liquidity trap situation.<br />
At the low levels of the interest rate that would prevail in the liquidity trap<br />
conditions, Keynesian would expect the economy to be on the nearly horizontal large<br />
of the LM curve as shown in fig - No 6.14 Monetary policy would lose its effectiveness<br />
in this situation completely because monetary expansion can no longer reduce rate of<br />
interest (of) and stimulate investment (I)<br />
Figure No. 6.14<br />
r<br />
LM 0<br />
LM1<br />
r 1<br />
r 0<br />
0<br />
y 0<br />
y 1<br />
IS 0<br />
y<br />
The cyclical position of the economy of and the relative effectiveness of fiscal<br />
policy and monetary policy instruments.<br />
The effectiveness of demand - management policies such as monetary policy<br />
and fiscal policy depends on the stage of the economy.<br />
(A) Fiscal policy -<br />
The size of fiscal policy (FP) multiplier or the effectiveness of fiscal policy<br />
depends on whether FP change is initiated at a low or high level of output relative to full<br />
employment output. This point is illustrated in Fig No - 6. It shows differing effects on<br />
y of a given IS shift, depending on where on the LM curve the policy actions start.<br />
The IS and LM elasticities and monetary - Fiscal Policies.<br />
We have intentionally avoided specific reference to the elasticities of the IS and<br />
LM functions so that we might concentrate on the general characteristics of the present<br />
stable - price model and the general conclusions it suggests. When we allow for the<br />
elasticities of these functions, we will find that same of these conclusions must be<br />
qualified and that same must even be abandoned in the extreme cases of perfectly<br />
elastic or inelastic fun actions, for example, am expansionary fiscal policy may rise<br />
only the interest rate and leave the income level unchanged; conversely, it may raise<br />
only the income level and leave the interest rate unchanged. An expansionary monetary<br />
policy may lower only the interest rate and leave the income leave unchanged of it<br />
may change neither the interest rate nor the level of income, the reverse is possible for<br />
contraction policies.<br />
108
Elasticity of the IS and functions<br />
With a fixed money supply, the LM function as derived in figure A slope upward<br />
to the right. However, at one extreme the function may become perfectly elastic, and<br />
at the other extreme it may become perfectly inelastic, with a range of varying elasticities<br />
in between. In general, the higher the interest rate, the less elastic the corresponding<br />
point on the LM function. These three ranges are delineated in part A of the figure. In<br />
which the perfectly elastic section is the “Keynesian range” the perfectly inelastic section<br />
is the “classical range” and the section between is the “intermediate range”.<br />
Why such shapes shapes accoucheur with perfect elasticity at one extreme<br />
and perfect inelasticity at the other? A +a very low interest rate, the speculative demand<br />
for money may become perfectly elastic due to a consensus by wealth - holders,<br />
accordingly stand ready to extreme securities for cash at existing security prices, which<br />
prices, which produces the liquidity trap on the speculative demand function. Here, on<br />
the LM ‘function, it produces what is known as the Keynesion range. At the other<br />
extreme, very high interest Rate, the speculative demand for money may become<br />
zero and perfectly inelastic at interest rates above this it wealth - holders believe the<br />
interest rate will rise no higher and that security prices will fall no lower. At this or any<br />
higher rate, wealth - holders accordingly prefer to hold only securities and no idia cash.<br />
This perfectly inelastic section of the speculative demand function is known as the<br />
classical range on the LM function,<br />
r<br />
r 5<br />
r 4<br />
r 3<br />
Figure No. 6.15<br />
LM 1<br />
IS 1 3 LM 2<br />
IS 3<br />
Keynesian IS 1 2<br />
Range IS 2<br />
r 2 IS<br />
r 1<br />
IS 1 1<br />
1<br />
0<br />
y 1<br />
y 2<br />
y 3<br />
y 4<br />
y 5<br />
Monetary policy is the exercise of the central bank’s cantrol over the money<br />
supply as an instalment for achieving the objectives of general economic policy. Fiscal<br />
policy IS the exercise of the government’s control over public spending and tax.<br />
Collections for the same purpose. We will now continue ourselves income The IS - LM<br />
framework provides a basis for comparing the effect of the two types of policy the<br />
income level and the interest rate for comparing the conditions under which each type<br />
109<br />
Intermediate<br />
Range<br />
Classical<br />
Range<br />
y
of policy will be effective or ineffective in producing the desired change in income. For<br />
this purpose, the discussion is conveniently divided into three parts, each corresponding<br />
to a range of the LM function. As shown in figure - 6.15<br />
The keynesian Range :<br />
Consider first the y, of equilibrium in the keynesian range. An increase in the<br />
money supply shifts the LM cure to the right from LM, to LM2 This means that for each<br />
possible level of income Ma =Ms, only at a lower interest rate; the rate must fall by the<br />
amount necessary to make the public willing to hold larger idle cash balances, But this<br />
is not true in the liquidity trap, Here the interest rate is already at an irreducible minimum<br />
for the time being. As the monetary authority purchases securities, security - holders<br />
are willing to exchange them for cash at the existing prices. There for explosion of the<br />
money supply cannot cause the interest rate to full below the rate given by the trap.<br />
The public holds - more in speculative balances and less in securities. Increases in<br />
the money supply would shift the LM curve to the right, but the lower end of the curve<br />
would remain anchored in the same liquidity trap. It the economy is in trap, monetary<br />
policy is powerless to raise the income level. It cannot reduce the interest rate any<br />
further to produce a movement down the IS, curve to a higher equilibrium income<br />
level. The belief that the economy is in the trap during the early thirties because<br />
government cannot raise the income level through monetary policy, it can only try to do<br />
so through fiscal policy, If a rise in income cannot be achieved by producing a shift in<br />
the IS curve from IS, to IS, fiscal measures such as increased government spending<br />
or reduced taxes could shift the IS curve<br />
To the extent that monetary policy operates by raising investment spending<br />
through a reduction in the cost of money, the impasse of monetary policy for an economy<br />
caught in the trap means that the elasticity or inelasticity of the IS function is no longer<br />
relevant.<br />
The liquidity trap is an extreme case that could occur only during a deep<br />
depression A prosperous economy and a liquidity trap do not go hand in hand, because<br />
the pure keynesiom range is the range of the liquidity trap, one can now appreciate<br />
with Hicksian appearance of keynes’ book, that the General Theory of Employment is<br />
the <strong>Economics</strong> of Depression”.<br />
Classical Range :<br />
when we examine the Y4; r4 equilibrium defined by the interaction of IS and LM,<br />
in Fig. A. Some increase in the money supply will shift the LM1, curve to LM2. In contrast<br />
to the result in the keynesion range, the result is now an increase in the income level<br />
from Y4 from Y5 and a fall in the interest rate from r4 to r3 In the classical range, the<br />
interest rate is so high that speculative balances are zero; money is held for transactions<br />
purposes only. Under these circumstances, if the monetary authority enter the market<br />
to purchase securities, security - holders can be induced to exchange securities for<br />
cash only at higher prices. As security prices are bid up and the interest rate is pushed<br />
down, investment is stimulated (in classical theory, saving is discouraged), because<br />
110
nobody chooses to hold idle cash, Expansion of the money supply will produce a new<br />
equilibrium only by reducing the interest rate by whatever amount is necessary to<br />
increase the income level. Sufficiently to absorb the full increase in the money supply<br />
in transactions balances.<br />
In contrast to the keynesian range, in which monetary policy is completely<br />
ineffective, in the classical range it appear to be completely ineffective in the classical<br />
range it appear to be completely effective. No part of any increase in the money<br />
supply disappears into idle cash balances. The increase in the money supply leads to<br />
increased spending that raises the income level to the point at which the total increase<br />
in the money supply is absorbed into transactions balances. Because all income<br />
changes are real changes in the present model, the increase in the money. Supply<br />
that shifts LM1to LM2 causes an increase from Y4 to Y5 in output as well as in income.<br />
In contrast to the Keynesiam range, in which fiscal policy alone cam be<br />
effective, fiscal policy in the classical range is completely ineffective An upward<br />
shift in the is function from IS3, to IS3 in fig A, cam raise only the interest rate,<br />
from 1/24 to rs0 The income level stays unchanged at Y4 Given the increase in<br />
spending that lies behind the upward shift in the IS function, the interest rate will<br />
rise sufficiently to crowd out enough spending to leave aggregate spending<br />
unchanged. Therefore, it the rise in spending resulted from increased government<br />
spending, the rise in the interest rate would crowd out an amount of private<br />
spending equal to the rise in government spending. The level of income IS as<br />
high as the given money supply an support. In the classical range, an increase in<br />
income is therefore impossible without an increase an increase in the money<br />
supply, and monetary policy becomes an all - powerful method of controlling the<br />
income level.<br />
Intermediate Range :<br />
The equilibrium of Y 2<br />
, R 2,<br />
as defined by the intersection of IS 2<br />
and LM, in Fig - A,<br />
we see that some increase in the money supply will shift the LM, function of LM2- In<br />
the Keynesion range, this increase in the money supply left both y and of unchanged,<br />
because total increase was absorbed in speculative balances at the existing interest<br />
rate. In the classical Large, this increase in the money supply hails Y by the amount<br />
necessary to absorb the full increase in transactions balances. This worked itself out<br />
through the interest rate reduction that raised sparing by the amount needed to produce<br />
the required rise in income In the intermediate range, however increase in the money<br />
supply is partially absorbed in both speculative and trans actions balances, The level<br />
of income rises by an amount less than that which would require the full increase in<br />
the money supply for transactions proposes.<br />
In the intermediate range, monetary policy has some degree of effectiveness<br />
but not the complete effectiveness it has in the classical range. In general, the closer<br />
equilibrium insertion is the classical range. The effective monetary policy becomes;<br />
the closer the intersection is to the keynesian range, the less effective it becomes.<br />
111
Within this range, fiscal policy Is also effective to some extent, fiscal measles<br />
that shift the Is function from IS 2<br />
to IS 2<br />
It will raise the level of income and the interest rate<br />
to the new equilibrium defined by the intersection of IS 2<br />
and LM, If the shift in the IS<br />
function stems from a deficit - financed increase in government spending, the interest<br />
rate must rise, we are assuming a fixed money supply - described by LM, so the increased<br />
government spending is being financed by borrowing from the public. The sale of additional<br />
securities by the government depresses security prices, raises the interest rate, and<br />
chokes of some amount of private spending. The rise in the interest rate following any<br />
given increase in government spending will be greater or smaller depending on how high<br />
in the intermediate range. Although fiscal policy is some what effective anywhere in the<br />
intermediate range. In general it will be more effective to the closer of equilibrium to the<br />
keynesiam range and less. Effective to the closer equilibrium to the classical range.<br />
Although both monetary and fiscal policies have varying degrees of<br />
effectiveness in the intermediate range. The relative effectiveness of each depends in<br />
large part on the elasticity of the Is function. Monetary policy can do very little Is raise<br />
the level of income, even in the intermediate large. Fiscal policy alone is effective in<br />
such a situation furthermore, an expansionary fiscal policy need not be concerned<br />
with adverse monetary effects in this case. A shift in an inelastic function will raise the<br />
interest rate, but this higher rate will have little feedback on spending keynes maintained<br />
that the investment schedule ( as well as the saving schedule ) is interest inelastic. If<br />
this is the case, the Is schedule must also be inelastic, and fiscal policy, which is<br />
completely effective in the keynesian range, must be almost as effective in the<br />
intermediate range, If the Is schedule is indeed interest inelastic, then the keynesion<br />
range becomes in effective The complete LM curve is more applicable at the lower<br />
and than at the upper end, but with some applicability throughout.<br />
6.2.4 The New Classical critiques on Micro foundations, The New classical<br />
Approach; Policy Implications of New Classical Approach - Empirical Evidence.<br />
Keynesion and Monetarist remedies failed to cure inflation and unemployment<br />
problems in money developed countries during 1970. Same economists, known as<br />
'radiologists' who have been thought about the effectiveness of monetary and fiscal<br />
policies in equilibrating the economy. The 'radiologists' ought to answer the question<br />
what makes monetary and fiscal policies ineffective? Answer they responded is that<br />
people are well informed about the economy by the government. So the people are<br />
capable of predicting future course of economy accurately. They can therefore,<br />
anticipate well in advance the government's fiscal and monetary moves to resolve any<br />
economic disoricbrum and can guess their effects on their economic interests, their<br />
earnings, consumption and investment expenditure, etc. Therefore they make<br />
necessary adjustments in their economic plans even before the anticipated policy.<br />
Different schools of thought have influenced the development of macro<br />
economics, Keynesian economics, monetarist school, and new classical growth<br />
theories were developed between 1930 and 160, Modern Schools like new classical<br />
macro economics new Keynesian school, real business cycle school and supply side<br />
112
economics represent more recent developments. There has been heated debate and<br />
contrarily among the different groups (see follow chart) which traces evolution of macro<br />
economics since 1936.<br />
Figure No. 6.16<br />
The family Tree <strong>Macro</strong> <strong>Economics</strong><br />
Neo Classical Growth Theory<br />
Role of Potential GDP Growth<br />
accounting formula<br />
Keynesian <strong>Economics</strong><br />
Rote of aggregate demand<br />
Countrcyclical fiscal policy.<br />
Monetorist school<br />
Role of money supply<br />
Quantity equation of earchinge.<br />
New Keynesian School<br />
Sticky prices with rational<br />
expectations<br />
Implicit contracts<br />
Co-ordination failure<br />
Theory of<br />
Economic Fluctuations<br />
and Economic growth<br />
New Classical macro economics<br />
Importance of credibility and rules<br />
Limited information with rational<br />
expectations.<br />
Real Business Cycle school<br />
Fluctuations in potential GDP<br />
Productivity shocks<br />
New Classical <strong>Macro</strong> economics : The Radicalism.<br />
Keynesian and monetarist economics failed to cure inflation and unemployment<br />
problems which was a grave problem during in 1970. This raised doubts in the minds<br />
of economists, could radiologists. The doubts were entered grand effectiveness of<br />
monetary and fiscal policies in managing the economy. The radiologists answer to the<br />
question, what makes monetary and fiscal policies in managing the economy. The<br />
radiologists answer tot he question; What makes monetary and fiscal policies<br />
ineffective? Is summarized below.<br />
People are as well informed about the economy by the government, action<br />
people are capable of predicting future course of action accurately. They can there<br />
fore, anticipate well in advance the government's fiscal and monetary moves to resolve<br />
any economic problem and can guess their effects on their economic interests, their<br />
earnings, consumption and investment expenditure, and so on. Therefore, they make<br />
necessary adjustment in their plans even before an anticipated policy. This prepares<br />
proper plinth of effectiveness of monetary and fiscal policies in the economy.<br />
Keynes did recognize the importance of consumers' and producers'<br />
expectations in his General theory of employment but he treated expectations,<br />
separately and did not combine it with his income and employment theory. Until early<br />
1980, not much attention was paid to the importance of peoples expectations in<br />
113<br />
Supply side <strong>Economics</strong><br />
Role of tax policy in raising<br />
aggregate supply
determining the output and employment and equilibrium of the economy. Nor was any<br />
serious efforts made to incorporate the role of expectations in macro economic<br />
formulations. Klowever, Robert E Lucas of Chicago (the 1995 Noble Laureate)<br />
incorporated people's expectations into macro economics. Two other notable<br />
contributors to the new classical macro economics are Thomus J. Sergeant of standard,<br />
and Robert Barrio of Harvard. Their macro economic propositions came to be<br />
recognized as new classical macro economics.<br />
The new classical macro economics is primarily radicals' attack on the Keynesion<br />
macro economics, especially the Keynesian approach to the rote of people's expectations<br />
in the formulation of their economic plans and its effects on government policies. The<br />
radiologists reject the Keynesian, and also monetarist, approach to formation of price<br />
expectations based on the past experience. According to the radiologists, people of the<br />
consumers and the producers are assumed to make their price expectations in response<br />
to policy action on the basis their past experience regarding policy changes and prices,<br />
even if their past experience does not hold in future. According to radicals, such<br />
expectations are irrational expectations because they involve systematic error in the<br />
sense that the people are assumed to commit the same error again. Therefore, they<br />
reject Keynesian approach to the formation of price expectations.<br />
The radiologists reject not only the Keynesion approach of price expectations<br />
but also the policy implications of the Keynesian economics. In the words of Lucas,<br />
"Keynes's contribution has been completely superseded, not only from the point of view<br />
of economic policy but also from that of theory and methodology. Lucas and Sargent<br />
added, that the existing Keynesian macro economic models cannot provide reliable<br />
guidance in the formulation of monetary, fiscal or other types of policies and there is no<br />
hope' of making Keynesian models useful by making minor or even major modifications<br />
of these models. The radiologists consider Keynesianism as temporary deviation from<br />
the mainstream scientific progress in economics. 'It succeeded because the theory of<br />
general economic equilibrium, in the versions available in the thirties, was unable to<br />
account for the empirical evidence.' In their view, Keynesianism has become useless if<br />
not actually earful' and since if lacks a rigorous foundation in terms of general economic<br />
equilibrium; it cannot predict how the economy will react to changes in economic policy,<br />
and hence cannot provide reliable criteria for choosing between different economic policy.<br />
The foundation of New Classical macro economics : The rational Expectations<br />
There are four wheels of New macro economics they are 1) New classical<br />
economics with rational expectations models. 2) The random walk theory. 3) Real<br />
business cycle theory and, 4) The New Keynesian theories :<br />
In the rational expectations model (New classical economics) developed by<br />
Nobel Laureate economist, Robert Lucas, people from expectations that are quite<br />
consistent with the way in which the economy operates. Anticipated changes in<br />
monetary policy has no real effect on the economy either in the short run or in the long<br />
run. This is known as policy ineffectiveness theorem.<br />
114
The new classical macro economies is built on 1) the theory of rational<br />
expectations developed by John F. Muth and 2) Some radical assumptions made by<br />
the new classical-macro economists.<br />
The concept of rational expectations was developed by a micro economist J. F.<br />
Muth in his paper 'Rational Expectation and the Theory of price Movements'.<br />
Econometric, July 1961. He has used a micro economic assumption, that people behave<br />
rationally to build his theory of rational expectations. A rational behavioral means acting<br />
in one's own self interest.<br />
The theory of rational expectations lies in the foundation of the new classical<br />
macro economics. The rational expectations are those expectations which are formed<br />
by an effusive use of all available relevant information including past and present<br />
data, and anticipated events the radiologists, approach to the formation of rational<br />
expectations has two important teachers; i) if does not involve systematic errors, and<br />
ii) it is forward looking Rational expectation, forever, does not mean error free<br />
expectations. It means that economic agents use the available information intelligently<br />
and efficiently, and the predictions do not involve a systematic error.<br />
The new classical macro economic formulations are based on two assumptions:<br />
1) Price and wages are fireball. This is a classical assumption. 2) Economic agents -<br />
producers, consumers and labour - possess all the information they need to from their<br />
expectations and use them intelligently. This is a 'radical' assumption.<br />
Main postulates of the New classical <strong>Macro</strong> economics :<br />
The radiologists derive the following propositions from the theory of rational<br />
expectations and their assumptions, which form the basis of their policy formulations<br />
for macro economic management.<br />
A) Monetary and Fiscal Policies do not effect employment and output : The<br />
radiologists reject the basic Keynesian and monetarist postulate that a systematic<br />
fiscal or monetary change influences the aggregate demand, therefore, real variablesoutput<br />
and employment. The radiculitis argue that the real variables (output and<br />
employment) are insensitive to the change in aggregate demand. Therefore, fiscal or<br />
monetary policies do not affect output and complement.<br />
The radiculitis proposition that fiscal and monetary policies do not matter is<br />
illustrated in Fig. A and B in the juxtaposing of the Keynesion and monetarist view. Fig.<br />
6.17 presents the equilibrium output and employment in the new classical system and<br />
Fig. B illustrates the new classical argument. In fact fig. A provide the basis for further<br />
analysis of new classical model. Part a of fig A presents the new classical aggregate<br />
demand (AC NC<br />
) and aggregate supply curve (AS NC<br />
). The general equilibrium is shown<br />
at output Y 0<br />
and price level P 0<br />
. In part (b) the curve labeled ND (P 0<br />
) represents the new<br />
classical labour demand curve at given price level (P 0<br />
) and curve labeled S N<br />
(NC)<br />
represents the new classical labour supply curve. The labour market is in equilibrium<br />
at employment level No.<br />
115
Let us first look at the Keynesian and monetarist view on the employment effect<br />
of change in money stock in the radiculitis model, suppose that. The initial new classical<br />
aggregate demand and supply curves are given as AD NCO<br />
and AS NCO<br />
, respectively, in<br />
part (a) of fig. 6.18. The equilibrium point E 0<br />
gives equilibrium.<br />
Fig. 6.17 : The output and employment in the new classical model<br />
a) Aggregate demand and b) Labour market demand and<br />
supply curves.<br />
Aggregate Price level<br />
f<br />
P 0<br />
0<br />
Y 0<br />
AS NC<br />
Output<br />
AD NC<br />
supply curves<br />
Level of output at Y 0<br />
and price level at P 0<br />
. At point E 0<br />
actual output and employment are<br />
the same as rational expectations. Let us now examine the effect of a fully anticipated<br />
change in money supply on the level of output and employment. Suppose that money<br />
supply so increases that the aggregate demand curve AD NCO<br />
shifts to AD NC1<br />
. Since<br />
aggregate supply curve (AS NCO<br />
) remains unaffected in the short run, the Keynesian<br />
and monetarist models, the equilibrium point will shift to E; output will increase to Y 1<br />
;<br />
and prices will rise to P 1<br />
. With the rise in prices, demand for labour<br />
Figure No. 6.18<br />
The effect of change in money stock on output and employment.<br />
Y<br />
a) Aggregate demand and b) The effect of change in money stock<br />
supply curves. on output and employment.<br />
Money Wage<br />
W<br />
SN NC<br />
W 0<br />
N 0<br />
(P C<br />
)<br />
0<br />
N 0<br />
Employment<br />
Aggregate Price Level<br />
P<br />
P 2<br />
E 2<br />
P 1<br />
P 0<br />
E 0<br />
0<br />
Output<br />
AS NC1<br />
AS NC0<br />
E 1<br />
Maney wage<br />
W<br />
NS(NC 1<br />
)<br />
NS(NC 0<br />
)<br />
W 2<br />
W 1<br />
W 0<br />
ND(P<br />
AD 2<br />
)<br />
NC1<br />
AD<br />
ND(P 1<br />
)<br />
NC0<br />
Y 0<br />
NON 1<br />
Employment<br />
116<br />
Y
Increases and labour demand curve. MD(P 0<br />
). Shifts to No. (P 1<br />
) Since in the<br />
Keynesian and monetarist model, labour supply curve remains unaffected in the short<br />
run, employment will increase to N 1<br />
. Thus according to the Keynesians and monetarists,<br />
an expansionary policy affects the aggregate demand and, therely increases output<br />
and employment in the short run.<br />
The radiologists reject the Keynesion and Monetarist proposition. They argue<br />
that output and employment are insensitive to the change in aggregate demand in<br />
short run. They question the basis of the Keynesian and Monetarist assumption that<br />
labour supply curve remains fixed in the short run. They argue that, the rational<br />
expectations, the rise in money stock is well dissipatedly vis-a-vis, rise in money wage<br />
is well anticipated simulator hence, fall in real wages is also well anticipated with the<br />
anticipated fall in real wages, labour supply will decrease and the labour supply cure<br />
will shift leftward. This shift in the labour supply curve makes the difference between<br />
Keynesian-Monetarist and new classical Scintillations.<br />
As shown in part (b) of Fig. 6.18 with rational expectations, the expected<br />
increase in money supply makes the labour supply curve shift to the left from NS (NCO)<br />
to NS (NCI)<br />
. With this shift in labour supply curve, the aggregate supply curve AS NC 0<br />
shifts leftward to AS NC 1<br />
. This increases the rational expected real wage derrises. As<br />
a result labour demand curve shifts to (ND (P 2<br />
). with this shift in labour demand curve<br />
labour market reaches an equilibrium at wage W 2<br />
and employment at the initial level<br />
of No. In the final analysis, Monetary Eropanision result in ware rise from W 0<br />
to W 2<br />
bt<br />
employment remains us affected at N 0<br />
.<br />
What happens in the product market with employment level remaining saturated<br />
at N 0<br />
, other things renuarinig the same, output remains unaffected. As shown in part<br />
(a) of Fig. 6 to 18, monetary expansion shifts the aggregate demand AD NC0<br />
to AD NC1<br />
,<br />
and leftward shift of labour supply curve from NS (NC0)<br />
to NS (NC1)<br />
shifts the aggregate<br />
supply curve from AS NC0<br />
to AS NC1<br />
. These shifts settle the product market equilibrium at<br />
E 2<br />
which gives equilibrium output at its initial level Y 0<br />
, though prices rise to P 2<br />
. In<br />
conclusion, the monetary expansion does not influence output and employment levels<br />
it results only in inflation. This analysis indicates the new classical view that, in the<br />
short run, monetary (or fiscal) expansionary policy does not influence the real output<br />
and employment. They only push way and prices up.<br />
B) Unemployment is not voluntary :<br />
In the Keynesian view, a major part of unemployment during recession is<br />
involuntary. On the contrary, new classical economists believe that there is nothing<br />
like involuntary unemployment because the market for labour is always cleared. The<br />
radicals insist that the phrase involuntary 'unemployment' be discarded in all serious<br />
thinking about the actual options unemployed people are faced with. In their view,<br />
unemployment, if any, especially of non tractional nature, is mostly voluntary. In new<br />
classical view, it people are unemployed, they are unemployed not because they are<br />
not getting jobs but because they are looking for better jobs. In their words, "Measured<br />
117
unemployment (more exactly, its non-frictional complements) is viewed as consisting<br />
to persons who regard the wage rate at which they could be currently employed as<br />
temporarily low and who therefore chouse to wait or search for improved conditions<br />
rather than invest in moving in moving or occupational change."<br />
C) There is no trade-off between inflation and unemployment :<br />
The relationship between nictation and employment has been one of the widely<br />
contested issues in macroeconomics. One of the most prominent views on this issue<br />
is represented by the Nipples curve, constructed by A, W Nipples on the U.K. economy.<br />
The Phillips curve status that, there is a stable, inverse relationship between the inflation<br />
rate and the unemployment rate. This relationship between inflation and unemployment<br />
implies that, policy makers can find a trade off between inflation and unemployment,<br />
this proposition supports the Keynesian position.<br />
Lucas and Sargent made it central to their attack on Keynesian economics.<br />
They argue that there is no trade off between the rate of inflation and the unemployment<br />
rate. They produced a new classical philips curve which is vertical. The vertical philips<br />
curve is based on the classical reassuring that, in the long run, the economy is always<br />
at full employment level. In new classical view, therefore, there is no trade off between<br />
inflation and unemployment rates.<br />
Policy Implications :<br />
The new classical macroeconomic propositions yield two radical policy<br />
implications, because they are in sharp contract with the Keynesian and monetarist<br />
policy prescriptions.<br />
1) A Policy change must came as a surprise to people :<br />
Under the rational expectations hypothesis, systematic fiscal and monetary<br />
changes can be anticipated by the people well in advance, especially if prices and<br />
wages are fireball. Therefore, households, firms and labour adjust their demand and<br />
supply plans well in advance to the expected situation and hence policy changes<br />
becomes ineffective. This is called policy ineffectiveness thereon. The theorem reads.<br />
"With rational expectations and flexible prices and wages, anticipated government<br />
policy cannot affect real output and employment.<br />
2) Discretionary (freedom to decide) changes in policy must be avoided :<br />
The new classical macroeconomics argue that discretionary policy changes<br />
are predictable and private sector can forecast the future economic seance better<br />
than the policy makers. Therefore, private sector buyers and sellers adjust their purchase<br />
and sale plans so as to ward off the expected adverse effects of the discretionary<br />
policy. In radicalism's view, discretionary policies not only level the output and<br />
unemployment unaffected but also cause market distortions.<br />
Concluding Remarks :<br />
The advent of new classical macro economics has tended to upset the apple<br />
cart of the Keynesions and to a great extent, that of monetarists. However, new classical<br />
118
macroeconomics was not favorably received by mainstream macroeconomics. The<br />
debate continues mainly between the neo-Keynesians and new classical<br />
macroeconomics, the support for new classical macroeconomics is increasing,<br />
perhaps, because of neatness of the new classical model. However the Keynesians<br />
hold the ground firmly. As slow has remarked, it is "Much too early to tear up the IS-LM<br />
chapters in the text books of your possibly misspent youth."<br />
6.3 Summary :<br />
The IS-LM model is used to final the values of the interest rate and level of<br />
income that simultaneously equilibrate both the commodity market and the money<br />
market. Both the fiscal and monetary policy instruments can effect the level of income.<br />
We examined the relative effectiveness of the two types of policies. To analyst the<br />
causes and effects of shift of the IS curve we have to incorporate government<br />
expenditure and tares in our analysis. Different schools of thought have influenced the<br />
development of macro economics. Keynesian economics, monetarist school, and new<br />
classical growth thetas developed in 1930, and 1960, based on the prevaily circular.<br />
New classical macro economics, new Keynesian school, real business cycle school<br />
and supply side economics represents more recent development. There is a heated<br />
debate and controversy among these groups.<br />
6.4 Terms to remember (Glossary) :<br />
1) IS-LM = Investment (I) Saving (s) Liquidity demand for money (L) Money<br />
supply (M)<br />
2) S(Y) = I (r) = Goods market equilibrium<br />
3) Ms = Md = Money market equilibrium<br />
4) S = S(Y) = saving function.<br />
5) I = I (r) = Investment function.<br />
6) Md = Demand for money<br />
7) Ms = Supply of money<br />
8) r = Rate of interest<br />
9) Msp = speculative demand for money<br />
10) Mt = transaction demand for money<br />
11) FE line = Full employment line<br />
12) Y = output<br />
13) Y = full employment output<br />
14) T = Tax revenue<br />
15) G = Government spending.<br />
16) Fp = Fiscal Policy<br />
119
17) AD NC<br />
= New classical Aggregate demand<br />
18) AS NC<br />
= New classical Aggregate supply curve.<br />
19) ND = New classical labour demand<br />
20) SN (NC)<br />
= New classical Labour supply<br />
21) Po = Given price level.<br />
22) N = full employment level of employment<br />
6.5 Objective type questions.<br />
A) Choose the correct alternatives given below.<br />
1) The IS-LM model was developed by the Nobel Labourate...<br />
a) Paul Samualson b) amartya sen<br />
c) John Hicks d)<br />
2) The IS-LM model emplasis the interaction between ..........<br />
a) goods and Asset market b) goods and labour market<br />
c) Asset and hawala market c) Labour and financial market<br />
3) Equilibrium in goods market requires .........<br />
a) Liquidity demand for money = money supply b) Demand = supply<br />
c) Investment = saving d) Income = expenditure<br />
4) Equilibrium in Asset market requires<br />
a) Investment = saving b) supply of labour = Demand for labour.<br />
c) Liquidity demand for money = money supply d) Input = output<br />
5) Saving is the function of .........<br />
a) Expenditure b) Income c) Rate of interest d) Money supply<br />
6) Investment is the function of ...........<br />
a) Rate of interest b) demand for money c) money supply d) capital.<br />
7) Transaction and procurationem demand for money are the direct functions<br />
of ..........<br />
a) Expenditure b) money supply c) Income d) rate of interest<br />
8) speculative demand for moneys the function of ...........<br />
a) Money supply b) Rate of interest c) Income d) Expenditure<br />
9) At a high interest rate speculative balances will be ........<br />
a) High b) Low c) Moderate d) very high<br />
10) A situation in which all markets in an economy are simultaneously in<br />
equilibrium is called a .............. equilibrium.<br />
a) Partial b) general c) none of these<br />
11) An increase in government spending shifts the IS curve to the .........<br />
120
a) right b) Left c) none of these<br />
12) It the central bank policy changes, it effects the changes in .........<br />
a) Labour supply b) money supply c) demand for money<br />
d) non of these<br />
13) Regional expectations model (new classical economics) / developed by<br />
Noble Laureate economist ..............<br />
a) Robert Lucas b) Tinbergen c) Kuznets d) Lewis<br />
14) ............... is primarily radicals attack on the Keynesian macroeconomics.<br />
a) New classical macroeconomics b) Classical macroeconomics<br />
c) modern macroeconomics d) Austrian school macroeconomics<br />
15) The concept of rational expectations was developed by a macroeconomics<br />
a) J.F Muth b) Hayek c) Fridman d) Malthus<br />
* Answer to check your progress :<br />
1) John Hicks 2) goods and asset market 3) Investment = saving<br />
4) Liquidity demand for money = money supply 5) Income<br />
6) Rate of interest 7) Income 8) rate of interest 9) Low<br />
10) general 11) right 12) money supply 13) Robert Lucas<br />
14) New classical macroeconomics 15) J. F. Muth.<br />
6.6 Questions for practice :<br />
1) Critically examine the complete IS-LM model.<br />
2) Diagrammatically explain the factors, that shift the IS Curve<br />
3) Explain the factors that shift the LM curve<br />
4) Give a note on equilibrium in the labour market.<br />
5) How stope of the IS curve affects the fiscal policy.<br />
6) How slope of the LM curve and affects the fiscal policy.<br />
7) Explain the slope of Is curve and its effectiveness of monetary policy.<br />
8) Explain the slope of the LM curve and the effectiveness of monetary policy.<br />
9) How IS and LM classicistic affects the monetary and fiscal policies.<br />
10) Write notes on<br />
1) the Keynesian Range 2) The classical Range 3) The Intermediate Range<br />
11) State the new classical critiques on micro foundations.<br />
12) Give main pustules of the new classical macroeconomics.<br />
13) Write a note on policy implications of new classical approach.<br />
121
6.7 References for further study :<br />
1) Shipper Edward : (1994) : <strong>Macro</strong>economic Analysis - fifth Edition - Galgotia<br />
publications (p) Ltd. New Delhi.<br />
2) Pentecost Eric (2000) : <strong>Macro</strong>economics an open economy approach -<br />
Macmillan press ltd. London.<br />
3) Able Andrew B and Bernomke Ben S. (2003) <strong>Macro</strong> economics : fourth<br />
edition : Person education (singapore).<br />
4) Mukherjee Sampat (2005) Analytical <strong>Macro</strong>economics from Keynes to<br />
Mankiw : New Central Book Agency, Kolkata.<br />
5) Harcourt G. C. (Editor) (1977) The Microeconomic foundations of macro<br />
economics (Editorial Book) : The Macmillan Press Ltd. London.<br />
6) Seth M. L. (2004) <strong>Macro</strong> <strong>Economics</strong> : Lakshmi Narain Agarwal, Educational<br />
Publishes, Agra.<br />
7) Jhingan M. L. (2002) <strong>Macro</strong> Economic Theory - Vrinda Publications (P)<br />
Ltd. Delhi.<br />
8) Froyen Richard T. - <strong>Macro</strong> <strong>Economics</strong>.<br />
● ● ●<br />
122
Unit – VII<br />
Open Economy and Exchange Rate<br />
7.0 Objectives<br />
7.1 Introduction<br />
7.2 Presentation of Subject Matter.<br />
1. Meaning and Types of Exchange Rate.<br />
2. Mundell-Fleming Model of open Economy.<br />
3. Asset Markets, Expectations and Exchange Rates.<br />
4. Monetary Approach to Balance of Payment.<br />
* Objective type Questions.<br />
* Answers of objective questions.<br />
7.3 Summary<br />
7.4 Key Words<br />
7.5 Objective Question<br />
7.6 Answer of Objective Question<br />
7.7 Questions for Practice<br />
7.8 Books for further reading<br />
7.0 Objectives<br />
After going through this Unit No. 7 . You will beable to know,<br />
1. The structure of an open economy<br />
2 The explain the meaning of Exchange Rate<br />
3 The types of Exchange Rate<br />
4 The Mundell-Fleming Model explanation in detail.<br />
5 The Monetary Approach to Balance of payment.<br />
7.1 : Introduction<br />
In the previous unit No. 6, we discussed the IS-LM model and Extension of IS-<br />
LM model with Government Sector and Labour market Relative effectiveness of<br />
Monetary and fiscal policies with the help of IS-LM model. In this unit, we will studied<br />
the meaning and type of Exchange Rate, Mundell-Fleming model of open economy.<br />
123
Assets markets, Expectations and Exchange Rates. Monetary approach to Balance of<br />
payments.<br />
Since 1980, there is tremendous change in the Global economy. All the<br />
Countries Expected the Globalization. In that sense an international trade has increase<br />
on large size. The exchange rate will play a very important role in international trade.<br />
It is helpful to increase this trade. The rate of Exchange refers to the rate at which a<br />
Country’s Currency exchanges for those of other Currencies. In other word, it is the<br />
expression of value of a currency in terms of other currencies.<br />
Hicks and Hansen developed the IS-LM model. This model is extended<br />
Keynesian model. In this model the term IS is the shorthand expression of the equality<br />
of Investment and saving which represents the product market equilibrium. It is also<br />
known as ‘real sector’ equilibrium. On the other hand the term LM is the shorthand<br />
expression of the equality of money demand (L) and money supply (M) and represents<br />
the money market equilibrium. Mundell-Fleming developed this model and they induced<br />
the international trade in the context of an open economy. In this model IS, LM & BP<br />
technique. Where the LM curve represents monetary policy, IS curve represents fiscal<br />
policy and BP curve explains balance of payment equilibrium.<br />
The monetary approach to the balance of payments is an explanation of the<br />
overall balance of payments. It explains changes in balance of payments in terms of<br />
the demand for money and supply of money.<br />
7.2 : Presentation of subject Matter.<br />
The explanation of this particular Chapter is as under.<br />
7.2.1 : Meaning and Types of Exchange Rate.<br />
The concept of exchange rate is very importance in the international trade.<br />
Exchange rate is the rate at which one currency is exchanged for another. It is the<br />
price of one currency in terms of another Currency. It is customary to define the<br />
exchange rate as the price of one unit of the foreign currency in terms of domestic<br />
currency. The exchange rate between the Rupee and the Dollar refers to the number<br />
of Rupee required to purchase a pound. Thus, the exchange rate between the Rupee<br />
and the Dollar from the Indian viewpoint are expressed as Rs. 48 = $ 1. The American<br />
would express it as the number of Dollar required to get one Rupee and the above<br />
exchange rate would be shown as Rs. 1 = $ 0.0208<br />
The exchange rate of Rs. 48= $ 1 or Rs.1= $ 0.0208 will be maintained in the<br />
world foreign exchange market by arbitrage. Arbitrage refers to the purchase of foreign<br />
currency in a market where its price is low and to sell it in some other market where its<br />
price is high. The effect of arbitrage is to remove differences in the foreign exchange<br />
rate of currencies so that there is a single exchange rate in the world foreign exchange<br />
market. If the exchange rate is Rs. 48 in the American exchange market and Rs. 49 in<br />
the Indian exchange market. Foreign exchange Speculator, known as arbitrageurs,<br />
will buy dollar in New York and sell them in India. In this time, make a profit Rs.1 on<br />
each dollar. So the price of dollar in terms of Rupees rise in the New York market and<br />
124
falls in the Indian market. Ultimately, it will equal in both the markets arbitrage come to<br />
an end.<br />
If the exchange rate between the Rupee and dollar rises to Rs. 50=$ 1 through<br />
time. The Rupees is said to depreciate with respect to the dollar because in that time<br />
more Rupees needed to buy one dollar. When the rate of exchange between the<br />
Rupee and the dollar fails to Rs. 45=$ 1 the value of rupees is said appreciate because<br />
less Rupees are required to purchase one dollar. Thus a depreciation of the Rupees<br />
against the dollar is the same thing as the appreciation of the dollar against the rupees<br />
and vice versa.<br />
* Definitions of exchange rate :<br />
1. Clare & Crump -: “Rate of Exchange is only a price of one currency quoted in<br />
terms of another currency.”<br />
2. H. Kartrak -: “ The rate at which the currency of a country exchange for that of<br />
another country is called exchange rate between the two countries .”<br />
“The rate at which one currency buys or exchanges for another currency is known as<br />
the rate of exchange.” In short, exchange rate is the price of foreign money.<br />
8 Types of Exchange Rate :<br />
The transaction in the exchange market is carried out at what are termed<br />
exchange rates. Exchange rate is the price of foreign money. It may be defined as the<br />
price paid in the home currency for a unit of foreign currency. In minor sense rate of<br />
exchange is the price of one national currency in terms of another nation’s currency. It<br />
can be quoted in the two ways firstly, one unit of foreign money to so many units of the<br />
domestic currency or secondly, a certain number of units of foreign currency to one<br />
unit of domestic currency.<br />
E.g. 1 U.S. dollar = 48 Indian Rupees or Rs. 1= $0.0208. There are<br />
the two types of exchange rates.<br />
a) Spot Rate and Forward Rate of Exchange.<br />
b) Fixed exchange rate and flexible exchange rate.<br />
A) Spot Exchange rate and Forward exchange rate :<br />
The exchange rate change from day to day and from hour to hour looking at<br />
this uncertainty of foreign exchange transactions may be different types it is spot rate<br />
and forward rate.<br />
The spot rate of exchange refers to that rate of exchange at which the delivery<br />
of foreign exchanges are made to the buyer by the seller at the spot. The spot rate<br />
transactions require immediate delivery, or exchange of currencies on the spot. In<br />
practice the settlement takes place within two days in most market.<br />
The forward rate of exchange is that rate of exchange at which the seller<br />
contracts to deliver to the buyer foreign exchange at some future date at a rate settled<br />
125
in the present A forward exchange markets function is side by side with a spot exchange<br />
market. The transactions of forward exchange market are known as forward exchange<br />
transactions which simply involve purchase or sale of a foreign currency for delivery at<br />
sometime in the future. The rate at which these transactions are consummated,<br />
therefore called forward rates. Forward exchange rate is determined at the time of<br />
sale but the payment is not made until the exchange is delivered by the seller. Forward<br />
rates are usually quoted on the basis of a discount or premium over or under the spot<br />
rate of exchange. Thus, forward rate may express as a percentage deviation from the<br />
spot rates. E.g. suppose an Indian people buys goods from the America worth $200,<br />
payable in 3months. The ‘spot Rate’ is Rs. 48.50 paisa = $1. In order to avoid exchange<br />
risk, he may enter into a forward contract in the forward exchange market to buy $200<br />
three months’ forward at a rate agreed on now the forward rate. If the rate agreed on<br />
is 50 paisa at a discount then the buyer shall have been to pay at the rate of Rs. 48 =<br />
$ 1. If the rate is fixed at 50 paisa at premium then he shall have to pay at the rate of<br />
Rs. 49=$ 1. In this way in the forward rate system, a buyer avoids risk in the sense that<br />
whatever may be the fluctuations in exchange rate in the future; he knows now what<br />
he will have to pay for $200. Thus, forward exchange rates enable exports and imports<br />
of goods to know the prices of their goods which they are about to export or import.<br />
Thus forward exchange rates are not independent of spot rates of exchange<br />
and they are inter-related indirectly through interest rates prevailing in the two countries.<br />
That means usually the forward rate is determined by the relative rates of interest in<br />
the countries concerned. If the rates of interest are the lower abroad relative to the<br />
rate of interest at home, the forward rate will be at a premium compared with the spot<br />
rate by amount equal to the difference in the rates of interest plus commission. This is<br />
because the dealer borrows at home at or rate higher than the rate at which he<br />
investment the foreign fund abroad he makes out a deficit that goes to his client in<br />
competitive market, plus his own charges-commission conversely, if the rate of interest<br />
abroad is higher, then the forward rate may be quoted at discount by an amount equal<br />
to the difference in the rate of interest, less dealer’s commission.<br />
B) Fixed and Flexible Exchange Rate :<br />
After the First World War, the various countries of the world had adopted the<br />
system of inconvertible paper currency standard. In this currency these can be two<br />
types of exchange rates - Fixed and Flexible exchange rates.<br />
Under the stance monetary system of the IMF, Fixed or stable exchange rates<br />
called pegged exchange rates on par values. In fact the IMF was established in March<br />
1947 with the objective of stabilizing the rate of exchange with proper safeguards for<br />
adjustments whenever is necessary. A fixed exchange rate system agrees to keep<br />
their currencies at a fixed, pegged rate and to change their value within a small range<br />
of variations, when economic situation forces them to do so. On the other hand, free<br />
or flexible exchange rates are left uninterrupted by the monetary authorities to be<br />
determined by the forces of demand and supply in foreign exchange market. Thus,<br />
flexible exchange rates are determined by the condition of the demand and supply of<br />
126
foreign exchange and are perfectly free to fluctuate according to the changes in the<br />
demand or supply forces, if there are no restrictions on buying and selling in the foreign<br />
exchange market. The free or floating rate is allowed to seek its own level, as no par of<br />
exchange is fixed.<br />
* Fixed Exchange Rate system :<br />
In the fixed exchange rate system, a country officially fixes a specific exchange<br />
rate of its currency and in terms of a given foreign currency and maintain the same<br />
over a period of time.<br />
* Merits or advantages of fixed exchanges Rates :<br />
The various merits of fixed exchange rates are as follows :<br />
1. Based on common currency : The fixed exchange rate between different<br />
countries is based on the case for a common currency within a country. A country<br />
having a common currency with a fixed value facilities trade increases production and<br />
leads to faster growth of economy. The most benefitted fixed exchange rates encourage<br />
international trade by making price goods involved in trade such a situation will bring<br />
about disturbances in the balance of payments.<br />
5. Useful to small countries : a system of fixed exchange rate is essential for<br />
small countries. Johnson Favours fixed exchange rates in the ‘banana republics’ where<br />
foreign trade plays a dominant role. Flexible exchange rates in them lead to inflation<br />
and depreciation when the exchange rate falls.<br />
6. Smooth flow of International trade :<br />
International trade will flow more quickly and more easily when there is confidence all<br />
round that the existing rate will continue in future.<br />
7. Disciplinary : Another important advantage of fixed exchange rate system<br />
is that is serves as an ‘Anchor and imposes a discipline on Monetary authorities to<br />
follow responsible financial policies with countries. Inflation will cause balance of<br />
payments deficits and reserve loss. Hence, authorities will have to take countermeasures<br />
to stop inflation. Fixed exchange rate should therefore impose ‘Discipline’<br />
on government and stop them from pursuing inflationary policies which are out of tune<br />
with the rest of world.<br />
8. Promote growth of internal Money and Capital Markets : It is another big<br />
advantage of the fixed exchange rate system. Since flexible exchange rates cause<br />
uncertainties about the future exchange rate, individuals, companies and institutions<br />
are reluctant to lend to and borrow from internal money and capital markets.<br />
9. Automatic equilibrium in the balance of payment : Fixed exchange rates<br />
system creates Automatic equilibrium in the balance of payments. The fluctuating<br />
exchange rate may cause in stability and thereby bring about disequilibrium in the<br />
balance of payment. Such instability may be avoided under stable exchange rates in<br />
127
maintaining equilibrium in the balance of payments.<br />
10. Promote rapid economic growth : another advantage of fixed exchange<br />
rate is that it promotes rapid economic growth of the developing countries. A fixed<br />
exchange rate system would attract foreign capital investments and foreign investment<br />
is one of important source of economic growth.<br />
11. International Monetary Co-operation : The system of fixed exchange<br />
rate promotes International Monetary Co-operation and so helps in the smooth working<br />
of the International monetary System Under institutions as IMF, IBRD and Euro-market.<br />
In view of the above advantages of the fixed exchange rate are substantial and<br />
carry much weight, the IMF aimed at maintaining fixed or pegged exchange rates for<br />
its members.<br />
* Arguments against fixed exchange rate :<br />
The important Demerits and Limitations of fixed exchange rate are as follows -<br />
1. Sacrifice of objectives : The principle defect in the operation of a system<br />
of fixed exchange rates is the sacrifice of the objective of full employment and stable<br />
prices at the altar of stable exchange rates.<br />
2. Unsuitable for developing countries : In the case of developing countries<br />
they need more foreign exchange earnings and foreign capital to achieve rapid<br />
economic growth; this would be possible under flexible exchange rate policy which<br />
promotes exports and international investment.<br />
3. Heavy Burden of adjustment balance of payments : A system of fixed<br />
exchange rates places the burden of adjustment in the balance of payments of a<br />
country on domestic income and prices. Maintenance of stable exchange rate requires<br />
huge foreign exchange reserves. Therefore less developed countries find it heavy<br />
burden to maintain fixed exchange rates.<br />
4. Unexpected Disturbances : Another problem of fixed exchange rates system<br />
the effects of unexpected disturbances in the domestic economy are transmuted abroad<br />
‘While a country may be protected by fixed exchange rates from the full consequences<br />
of domestic disturbances and policy markets. It has to bear a share of the burden of<br />
the disturbances and mistakes of others.<br />
5. Fixed Exchange Rate not always possible : In the case of fixed exchange<br />
rate the main problem relates to the stability of the exchange rate. The exchange rate<br />
of a one country to another country cannot remain fixed for a long period. Balance of<br />
payments problems and fluctuations in international commodity prices often compel<br />
countries to bring changes in exchange rate. Thus, it is not possible to have rigidly<br />
fixed exchange rates.<br />
6. Balance of Payment Disequilibrium Adverse Effect on International<br />
Relation : A system of fixed exchange rate fails to solve the problem of balance of<br />
payments disequilibrium. It can be tackled only temporarily because its permanent<br />
solution lies in monetary, fiscal and other measures.<br />
128
7. Problem of International Liquidity : When the country expands its trade,<br />
than a country must have adequate international liquidity to maintain a fixed exchange<br />
rate. The country must have sufficient reserves of foreign currencies to avoid balance<br />
of payment disequilibrium. In the view of the above demerits and problem the fixed<br />
exchange rate has been given up despite its various advantages explained before.<br />
* Flexible Exchange Rates :<br />
The system of flexible exchange rate was advocate by a number of economists.<br />
Flexible, floating or fluctuating exchange rate are determined by market forces. There<br />
is no intervention by the monetary authority. The rate of exchange is allowed to fluctuate<br />
in terms of change in demand for and supply of foreign exchange. Under a regime of<br />
freely fluctuating exchange rate, if there is an excess supply of currency, the value of<br />
the currency in foreign exchange market will fall. It will lead to depreciation of the<br />
exchange rate. Consequently, equilibrium will be restored in the exchange market. On<br />
the other hand, shortage of a currency will lead to appreciation of exchange rate thereby<br />
leading to restoration of equilibrium in the exchange market.<br />
* Case with the Flexible Exchange Rates :<br />
The following advantages or merits are claimed for flexible exchange rate<br />
system.<br />
1. Simple operation : The most important advantage of flexible exchange<br />
rates is simple operation. The exchange rate moves automatically and freely to equate<br />
supply and demand, thereby clearing the foreign exchange market It does not allow a<br />
deficit or surplus to build up and eliminates the problem of scarcity or surplus of any<br />
one currency. It also avoids the need to induce changes in prices and incomes to<br />
maintain or restore equilibrium in the balance of payment.<br />
2. Promotes growth of multilateral trade : The advocates of flexible exchange<br />
rate system are rapid growth of multilateral world’s , trade, because it maintains the<br />
exchange rates at their natural level through continuous market adjustments. Thus<br />
there is no danger over valuation or under valuation of domestic currency.<br />
3. Smooth and automatic adjustment of the balance of payments : A system<br />
of flexible exchange rates brings about smooth and automatic adjustment in the balance<br />
of payments. For instance, when there is a deficit, it will turn to lower the exchange<br />
rate and corresponding change in the balance volume of exports and imports will<br />
restore equilibrium in the balance of payments. But the fixed exchange rate requires<br />
changes in costs, prices, incomes, etc. to correct disequilibrium in the balance of<br />
payments.<br />
4. Autonomy of Economy policies : The system of flexible exchange rate<br />
autonomy of the economic policies is preserved. Modern governments are committed<br />
to maintain full employment and promote stability with growth. They are not required<br />
to sacrifice these objectives of full employment and economic growth in order to remove<br />
balance of payments disequilibrium under a regime of flexible exchange rates.<br />
129
5. No need of foreign exchange reserves : There is no need of foreign<br />
exchange reserves where exchange rates are flexible. A deficit country will simply<br />
allow its currency to depreciate in relation to foreign currency instead of intervening by<br />
supplying foreign exchange reserve to the other country to maintain a stable exchange<br />
rate.<br />
6. Not require to maintain of International Liquidity : A system of flexible<br />
exchange rates do not require to maintain a large stock in international Liquidity. Under,<br />
fixed exchange rates a ucountry has to increase its reserve when it faces deficit in its<br />
balance of payments. But, under the IMF arrangements such reserve are not required,<br />
because an adverse balance of payment is corrected through the changes in the rate<br />
of exchange.<br />
7. Comparative Advantage : The important merit of flexible exchange rate is<br />
simple and easy to administer and the exchange rates are always in equilibrium under<br />
the flexible exchange rates.<br />
8. More effective Monetary policy : Another advantage of flexible exchange<br />
rates is the effectiveness of monetary policy. If a country wants to increase output. It<br />
will lower interest rates under a regime of flexible exchange rates, the lowering of<br />
interest rates will result in an outflow of capital. A rise in the spot rate for the currency<br />
which will in turn, cause exports to rise and imports to fall. Thus monetary policy making<br />
more effective. Thus the merits of flexible exchange rates are simple and feasibility in<br />
achieving of objectives of full employment and economic growth.<br />
* Arguments on flexible exchange rate :<br />
The some important arguments on flexible rate of exchange are as follows.<br />
1. Instability and uncertainty situation : An important argument against flexible<br />
exchange rates is that too frequent fluctuations in exchange rate under it create<br />
uncertainty about the exact amount of receipt and payment in foreign exchange<br />
transactions. This instability hampers foreign trade and capital movements between<br />
the countries.<br />
2. Discourage long-term international investment : Another disadvantage<br />
of flexible exchange rates system is discouraging long-term international investment.<br />
The fluctuating exchange rates create uncertainty in the minds of the borrowers and<br />
the lenders. The borrowers may be worried about the increased burden of debt and<br />
servicing following the depreciation in the exchange rate.<br />
3. Dumping effect on foreign Trade : Under the flexible exchange rate system,<br />
the price of foreign exchange or international value of national currency is quite<br />
uncertain. As a result, they are unable to take proper decisions regarding exports and<br />
imports of goods. Obviously, this has a dumping effect on the volume and growth of<br />
foreign trade.<br />
4. Adverse effect of Speculation : A system of flexible exchange rates,<br />
speculation adversely influences fluctuation in supply and demand for foreign exchange.<br />
130
Argument against flexible exchange rates on the basis of empirical evidence that<br />
speculation is destabilizing which means that it aggravates fluctuation in exchange<br />
rate. ‘It is often said that speculator see a decline in the exchange rate as a signal for<br />
further decline in that their actions will cause the movement in the exchange rate to be<br />
larger than it would be in absence of speculation. In such a case speculation is<br />
destabilizing.<br />
5. Encouragement to Inflation : The system of flexible exchange rates has<br />
inflationary bias. Another shortcoming of the flexible exchange rates is that have an<br />
inflationary impact on the economy. It has been pointed out that whenever due to<br />
deficit in balance of payments, the currency depreciates, the prices of imports go up<br />
the higher prices of imported materials raise the prices of industrial products and thus<br />
generate cost-push inflation.<br />
6. Breaks the world market : A system of exchange rates is breaks up the<br />
world market. There is no money which serves as a medium of exchange unit of<br />
account Store of value and a standard of deferred payment. Under it, the world market<br />
for goods and capital would be divided.<br />
7. Problem Balance of payments : Less developing counties are faced with<br />
the perpetual problem of deficit in their balance of payments because they import raw<br />
material, machinery, capital equipment etc. for their development. But their exports<br />
are limited to primary and other product which face low prices in the world markets.<br />
Their balance of payment deficit can be removed in the system of flexible exchange<br />
rates if there is continuous depreciation of the country’s currency.<br />
In the practical use of flexible exchange rates there are various limitations.<br />
7.2.2 Mundell-Fleming Model of Open Economy:<br />
The Mundell-Fleming Model, also known as the IS-LM-BP model. This model<br />
is developed by Fleming and Mundell. They treated that the rates of return on<br />
capital to become equal in financial markets of different countries as a result of<br />
perfect mobility of capital was formalized in model in the 1960’s by Robert Mundell,<br />
now a professor at Columbia <strong>University</strong> and the Late Marcus Fleming, an economist<br />
at the IMF. They are analyzing the role of Monetary and fiscal policies in the context<br />
of an open economy. The Mundell-Fleming model is called the Keynesian open<br />
Economy Model.<br />
In this approach Mundell-Fleming analyzed the relationship between two<br />
Instruments and to targets. The two instruments is Monetary Policy represented<br />
by interest rate and fiscal policy represented by government expenditure. There<br />
are two objectives first one is full employment means internal balance and second<br />
one is balance of payments equilibrium means external balance. The assignments<br />
rule is to assign monetary policy to the objective of external balance and fiscal<br />
policy to internal balance.<br />
131
* Assumptions of the Model :<br />
The assumptions of in Mundell-Fleming model are as under<br />
1. Monetary policy is related to changes in interest rate<br />
2. Fiscal policy is related to deficit or surplus budget<br />
3. Exports are exogenously given<br />
4. Import are a positive function of income<br />
5. International capital movements respond to domestic interest rate changes.<br />
* Explanation of the Model :<br />
This model Mundell states that ‘In countries where employment and balance<br />
of payments policies are restricted to monetary and fiscal Instrument monetary<br />
policy should be reserved for attaining the desired level of the balance of payments<br />
and fiscal policy for preserving internal stability under the conditions assumed<br />
here. If monetary and fiscal policy is adjusted smoothly and continuously, the<br />
assignment rule can work very well. Thus the Mundell-Fleming model used<br />
monetary and fiscal policy for internal and external stability,<br />
In this Mundell-Fleming model we study internal and external balance in<br />
terms of Monetary-fiscal mix policies under fixed and floating exchange rates with<br />
perfect and relative capital mobility and their effects on balance of payment of a<br />
country.<br />
A) Fixed Exchange Rates With Perfect capital mobility :<br />
In the of case perfect capital mobility a small change in the domestic interest rate<br />
brings large flows of capital. When the domestic interest rate equals the world<br />
interest rate, balance of payment is in equilibrium. If the domestic interest rate is<br />
lower than the world rate, there will be large capital outflows in order to seek better<br />
rates a broad which will be self-eliminating. On the contrary, if the domestic interest<br />
rate is higher than the world rate, large capital inflows would bid the domestic<br />
interest rate down to its initial level.<br />
The policy implication of perfect capital mobility is shown in the figure No. 1<br />
132
Figure No. 1<br />
LM<br />
Y 0<br />
LM 1<br />
Interest<br />
R<br />
E E 2<br />
BP<br />
Rate<br />
E 2<br />
O<br />
In this figure BP curve is drawn horizontally. ‘E F is the initial equilibrium<br />
point. This point IS-LM-BP curves intersects each other. At point ‘E’ Bop is zero but<br />
the economy is not in full employment equilibrium. This point determines ‘OY’ the<br />
national income level and ‘OR’ the interest rate. The BP curve is drawn horizontally<br />
because even the small change in the interest rate will lead to an infinitely large<br />
capital flow. If the domestic interest rate is above OR, capital flows into the country<br />
and if the domestic interest rate is below OR, capital flows out of the country<br />
Suppose, the economy wants to attain the full employment income level<br />
OY 2<br />
. The monetary authority starts an expansionary monetary policy by increasing<br />
the money supply. The LM curve shifts to LM 1<br />
. The curve LM 1<br />
and IS intersects at<br />
Ei, so that the interest rate falls to ORi. It in turn, leads to an outflow of capital.<br />
Since the price of foreign exchange is fixed, the monetary authority will finance the<br />
outflow of capital by selling foreign exchange. The sales of foreign exchange will<br />
decrease the money supply. This causes the LM, curve shifts upward to the left to<br />
its original position of the LM curve. Thus the monetary policy is totally ineffective<br />
under fixed exchange rates and perfect capital mobility is maintaining internal<br />
balance.<br />
On the other hand, an expansionary fiscal policy has the effect of raising<br />
the income level by perfect capital mobility. This is shown in the the figure No. 2.<br />
IS<br />
Y Y 1<br />
Y 2<br />
X<br />
National Income<br />
133
Figure No. 2<br />
LM<br />
Y 0<br />
Interest<br />
R 1<br />
E<br />
E 1<br />
E 2<br />
LM 1<br />
BP<br />
IS 1<br />
IS<br />
O Y Y 1<br />
Y 2<br />
X<br />
National Income<br />
Suppose the Government expenditure is increased to achieve full<br />
employment level of income OY 2<br />
. This shifts the IS curve to the right to IS 1<br />
. The<br />
new curve IS 1<br />
intersects the LM curve at E 1<br />
. This causes the interest rate to rise to<br />
OR 1<br />
and the income level to fall to OY 1<br />
. The rise in interest rate leads to large<br />
inflows of capital from abroad. This increases the money supply with the rise in<br />
foreign reserves, therefore shifting the LM curve to the right to LM 1<br />
. Now this LM 1<br />
curve intersects the IS 1<br />
curve at point E 2<br />
. This point L 2<br />
ftfll employment income<br />
level OY 2<br />
is reached. Thus fiscal policy by increasing money supply raises aggregate<br />
demand, income and employment.<br />
Thus, In the case of perfect capital mobility and fixed exchange rates, fiscal<br />
policy is effective in maintaining internal balance and monetary policy is ineffective.<br />
So far as the external balance is concerned, it is maintained itself because of<br />
perfect capital mobility.<br />
B) Floating Exchange Rates With Perfect Capital Mobility-:<br />
Consider the effects of monetary and fiscal policies with perfect capital<br />
mobility under floating exchange rates. The monetary authority starts an<br />
expansionary monetary policy. This has the effect of lowering the interest rate,<br />
increasing capital and thereby bringing deficit in the balance of payments.<br />
How this deficit it removed is shown in the figure. No. 3.<br />
134
Figure No. 3<br />
LM<br />
LM 1<br />
Interest<br />
Rate<br />
R<br />
E<br />
E 1<br />
E 2<br />
BP<br />
IS<br />
O<br />
Y Y 1<br />
Y 2<br />
X<br />
National Income<br />
In this figure ‘E’ is the initial equilibrium point. When the expansionary<br />
monetary policy used by monetary authority the LM curve shifts to the right LMi<br />
curve, given the IS curve. The LMi curve intersects the IS curve at Eiwhich lower<br />
the interest rate to OR 1<br />
and raise income to OYi. These lead to capital outflow and<br />
consequent deficit in the balance of payment and depreciation of the exchange<br />
rate. Depreciation increases the demand for domestic goods in the foreign country.<br />
Thus the economy upward along the LM 1<br />
curve till it reaches point E 2<br />
when income<br />
rises to OY 2<br />
and the interest rate rises to the old level OR. Equilibrium in the<br />
balance of payments is restored at point E 2<br />
where the increase in imports through<br />
rise in income is offset by surplus in trade balance due to depreciation.<br />
Suppose the Government adopted an expansionary fiscal policy which shifts<br />
the IS curve to IS 1<br />
, given the LM curve is shown in the Figure. No. 4.<br />
Y 0<br />
Figure No.4<br />
E 1<br />
LM<br />
Interest<br />
Rate<br />
R 1<br />
E<br />
BP<br />
IS 1<br />
O<br />
IS<br />
Y Y 1<br />
X<br />
National Income<br />
135
In this figure ISicurve and LM curve intersects in point Ei which has economy<br />
into equilibrium. With OR 1<br />
interest rate and OY 1<br />
income level. Since point E 1<br />
is<br />
above the BP line, there is surplus in the balance of payment. This surplus leads to<br />
the appreciation of the exchange rate which, in turn, reduces the demand for<br />
domestic output This process of appreciation will continue so long as the domestic<br />
interest rate is above the world rate and capital inflows continue. Appreciation will<br />
continue to reduce the demand for goods and offset the expansionary effect of<br />
fiscal policy till the ISi curve shifts back to the IS curve and the equilibrium is reestablished<br />
at E where the interest rate and income are back to their original levels<br />
of OR and OY. In that way the equilibrium in the balance of payment is being maintained<br />
at Ei by financing the trade deficit though capital inflows with expansionary fiscal policy.<br />
The fiscal policy has not effect on income and employment under perfect capital mobility.<br />
Thus under floating exchange rate with perfect capital mobility monetary policy is<br />
effective in maintaining internal and external balance and fiscal policy is ineffective.<br />
The above analysis under fixed and floating exchange rates considers monetary<br />
and fiscal policy in isolation. As a result, monetary and fiscal policies are expanded<br />
simultaneously in such a manner that the LM and IS curve shifts to the right to LMi and<br />
ISi so that they intersect at point £2, thereby increasing income to OY2 level, but<br />
keeping the interest rate intact at OR.<br />
C) Fixed Exchange Rates With Relative Capital Mobility :<br />
Consider the effect of monetary and fiscal policies with relative capital mobility<br />
under fixed exchange rates. This is shown in the Figure : No. 5.<br />
BP<br />
LM<br />
Interest<br />
R 1<br />
R 2<br />
R<br />
Y 0<br />
E<br />
IS 1<br />
LM 1<br />
LM 2<br />
E 1<br />
E 3<br />
IS<br />
O Y Y 3<br />
Y 1<br />
Y 2<br />
X<br />
National Income<br />
136
In that figure BP curve is steeper than the LM curve. The initial equilibrium<br />
is at point ‘E’ where curve IS = LM = BP curves with OR interest rate and OY<br />
income level.<br />
First take an expansionary fiscal policy which shifts the IS curve to ISi, and<br />
it intersects the LM curve at E 2<br />
. In this point interest rate rises from OR to OR 2<br />
and<br />
the level of income increases from OY to OY 2<br />
.There will be a deficit in the balance<br />
of payments because E 2<br />
is the below and to the right of the BP curve. The deficit<br />
will bring decline in the money supply as the monetary authority starts selling foreign<br />
exchange. Thus the LM curve shifts upward to the left to LMi where it intersect the<br />
IS 1<br />
and BP curves at E 1<br />
consequently, the economy is at internal and external<br />
balance with OR 1<br />
interest rate and OY 1<br />
income level.<br />
On the other hand, an expansionary monetary policy will always leads to<br />
deficit in the balance of payment With this policy, the LM curve shifts to the right to<br />
LM 2<br />
. The interest rate will fall from OR to OR 2<br />
and the income will increase from<br />
OY to OY 2<br />
. The fall in interest rate will lead to a capital account deficit. This deficit<br />
will force the monetary authority to sell foreign exchange which will reduce the<br />
money supply and thus shifts the LM 2<br />
curve to its original position of LM curve.<br />
Consequently, the equilibrium position remains at point E with OR interest rate<br />
and OY income level. Thus the monetary policy is ineffective.<br />
However, fiscal and monetary policy mix can lead the economy to both<br />
internal and external balance. This can be achieved by combining an expansionary<br />
fiscal policy with a restrictive monetary policy. Thus the economy attains full<br />
employment as well as Bop equilibrium with OR 1<br />
interest rate and OY 1<br />
income<br />
level.<br />
D) Floating exchange rate with relative capital mobility :<br />
Consider the effect of monetary policy and fiscal policy under floating<br />
exchange rates with relative capital mobility. This is illustrated in the Figure. No. 6.<br />
137
Figure No - 6<br />
BP<br />
BP 1<br />
LM<br />
Y 0<br />
IS 1<br />
E 1<br />
E 3<br />
LM 1<br />
Rate of<br />
Interest<br />
R 1<br />
R<br />
R 2<br />
E<br />
IS<br />
O<br />
Y Y 1<br />
Y 2<br />
X<br />
National Income<br />
In Figure No. 6, ‘E’ is the initial equilibrium point. This point shows the<br />
curve BP=IS=LM curves and OR interest rate and OY income level. Suppose the<br />
monetary authority follows an expansionary monetary policy which shift the LM<br />
curve to the right to LM 1<br />
and intersect the IS curve at E 2<br />
. This leads to short-run<br />
Bop deficit because point E 2<br />
is below and to the right of the BP curve. With the fall<br />
in interest rate to OR 2<br />
. There is capital outflow. This leads to increase in the demand<br />
for foreign currency and the country’s exchange rate depreciate. This increases<br />
exports and decrease imports. This causes the IS curve to shift to the right IS 1<br />
.<br />
Bop is improves so that the curve BP shifts to the right to BPi. The new equilibrium<br />
is established at L 3<br />
.<br />
In this point the curve IS 1<br />
=LM 1<br />
=BP 1<br />
curves and both external balance and<br />
internal balance are attained at a higher OY 2<br />
income level than OY. Thus monetary<br />
policy is effective under the flexible exchange rates.<br />
Suppose, an expansionary fiscal policy is adopted, there is the balance of<br />
payment deficit under flexible exchange rates. Starting from the equilibrium point<br />
E. with an increase in government expenditure or cut in taxes, the IS curve will<br />
shift to the right to ISi which cuts the LM curve at E 1<br />
. This raises the interest rate to<br />
OR 1<br />
. There is capital inflow which causes currency appreciation. This, in turn,<br />
raises imports and reduces exports and leads to depreciation of the currency and<br />
138
the ISi curve is shifted back to the IS curve. The original equilibrium point E is<br />
reached. Thus fiscal policy is ineffective under floating exchange rates with relative<br />
capital mobility.<br />
Thus, an expansionary monetary policy combined with contraction fiscal<br />
policy under floating exchange rates and capital movements is effective in attaining<br />
internal and external balance.<br />
7.2.3 Asset Market, Expectations and Exchange Rates :<br />
Exchange rate is very importance in the international trade. It is helpfull to<br />
increase this trade. Exchange rate is the rate at which one currency in terms of another<br />
currency.<br />
Expection means forecasts made by an economic agent regarding the uncertain<br />
economic variables which are relevant to this descision.<br />
The fundamental feature of models of exchange rate determinations is the<br />
assumption of international capital mobility. In this connection with capital mobilty the<br />
asset markets and asset prices pay an important role because capital between<br />
Countries flow in response to the return on assets. Two important asset markets of a<br />
country are bond Market and stock market where bonds and equity shares are sold<br />
and bought. Given the well integrated asset Markets of various Countries, it is expected<br />
that interest rates will be equated across countries due to perfect mobility of capital<br />
among them. Interest is return on bonds which are important financial assets. In addition<br />
to bonds, Stocks of corporate firms are other important financial assets in which people<br />
make investment. It is important to note that price of a stock is the net present value of<br />
expected future returns or dividends. Changes in expectations of future dividends and<br />
capital gains affect the price of a stock of a company.<br />
In the assets markets, bonds periodic fixed payments are paid and then at the<br />
end maturity period, face value of the bond is paid. Price of a bond is the present value<br />
of future periodic payments and the maturity amount paid at the end. Bond prices are<br />
inverely related to interest, bond prices will change. fall in the interest rate will raise<br />
bond prices, and rise in market interest rate will lower bond prices. Since Price of a<br />
stock of a corporate Company is the present value of expected dividends and capital<br />
gains in future it is also influenced by long-term interest rates. Therefore, stock prices<br />
fall when interest rates rise and vice versa.<br />
As mentioned above in the analysis of exchange rate determination. With perfect<br />
mobility of capital internationally we expect interest rate or return on capital assests to<br />
be equated across countries. Capital moves internationally across countries due to<br />
differentials in dyields or returns on assets.<br />
With the incorporation of exchange rate expectations in determination of rate<br />
of return on bond. The capital flows are affected by the difference between the domestic<br />
interest rate and foreign interest after making adjustments for expected changes in<br />
the exchange rate of currrencies. Given the domestic interest rate, decrease in foreign<br />
139
interest rate or expectations of depreciation of the foreign currency would, cause capital<br />
outflows from the foreign country. On the other hand, increase in domestic interest<br />
rate and expectations of appreciation of domestic currency would encourage capital<br />
inflows in the domestic economy.<br />
7.2.4 : Monetary Approach to Balance of Payment :<br />
Monetary approach regards balance of payments is a monetary phenomenon.<br />
Advocates of Monetary approach argue that disequilibrium in the balance of payments<br />
affects the supply of money and demand for money. According to them, disequilibrium<br />
in the balance of payments is reflaction of monetary disequilibrium and therefore it can<br />
corrected by monetary measures. In an open economy decrease or increase in foreign<br />
exchange resenes for the basis of expansion in money supply.<br />
When balance of payments is thrown into disequilibrium, adjustments take<br />
place to restore equilibrium in the balance of payments. The classical economists<br />
believed in automatic mechanism of adjustment through which disequilibrium in balance<br />
of payments is self-correcting. They thought monetary contaction or monetary expansion<br />
will bring the balance of payments into equilibrium when there is deficit or surplus in it.<br />
In the absorption approach to balance of payments is general equilibrium in<br />
nature and is based onthe Keynesian national income relationship. So this approach<br />
also known as the keynesian approach. If runs through the income effect of devaluation<br />
as against the price effect to the elasticity approach. The theory states that if a country<br />
has a deficits in its balance of payments, it means that people are 'absorbing' more<br />
than they produce. Domestic expenditure on consumption and investment is greater<br />
than national income. If they have a surplus in the balance of payments, they are<br />
absorbing surplus in the balance of payments, they are absorbing less. Expenditure<br />
on Consumption and investment is less than national income. Here the balance of<br />
payment is defined as the difference between national income and domestic<br />
expenditure. This analysis can be explained in the following form.<br />
Y = C + I + G + X - M ............................. (1)<br />
where, Y = National income<br />
The sum of<br />
C = Consumption<br />
I = Domestic Investment<br />
G = Government expenditure<br />
X = Export<br />
M = Import<br />
C+I+G = A = Total absorption<br />
and X - M = B = Balance of payment Thus Equation (1) becomes<br />
Y = A + B<br />
140
or B = Y-A ...................................... (2)<br />
This equation state that the balance of payments on current account is the<br />
difference between national income (Y) and total absorption (A). BOP can be improved<br />
by either increasing domestic income or reducing the obsorption. For this purpose,<br />
Sydney Alexander abvocates devaluation. The devaluation increases exports and<br />
reduces imports, there by increasing the national income. The additional income so<br />
generated will furhter increase income via the multiplier effect. This will lead to an<br />
increase in domestic consumption. Thus the net effect of the increase in national<br />
income on the balance of payments is the difference between the total increase in<br />
income and the induced increase in absorption.<br />
L mB = mY - mA ........................... (3)<br />
Total absorption (AA) depends on the marginal porpensity to absorb. When<br />
there is devaluation. This is expressed as a Devaluation also directly affects absorption<br />
through the change in income which we write as D Thus -<br />
mA = amY + mD ............................... (4)<br />
Substituing equation (4) in (3) we get.<br />
mB = AY - amY + mD<br />
or<br />
mB = (1-a) mY + mD ............................. (5)<br />
Thus, the above equation @ is explain the effects of devaluation on balance of<br />
payments.<br />
7.3 Summary :<br />
The concept of exchange rate is very importance in the international trade.<br />
Exchange rate is the rate at which one currency is exchanged for another. It is the<br />
price of one currency in terms of another currency. Basically. the two types of exchange<br />
rates. First is spot rate and forward rate and second Fixed exchange rate and Flexible<br />
exchange rate.<br />
The spot rate of exchange refers to the rate at which foreign currency is made<br />
available on the spot. The forward rate is the rate at which a future contract for foreign<br />
currency is brought and sold the forward rate is quoted at apremium or discount over<br />
the spot rate.<br />
In the fixed exchange rate system, a country officially fixes a specific exchange<br />
rate of its currency in terms of given foreign currency and maintains the same over a<br />
period of time. On the other hand under a flexible or floation exchange rate system,<br />
exchange rate are freely determined by the interation of supply and demand an open<br />
market.<br />
The monetary approach to the balance of payment is an explanation of the<br />
overall balance of payments. It explanation of the overall balance of payments. It<br />
explains changes in balance of payments in terms of demand for and supply of money.<br />
141
7.4 : Key words :<br />
1. Money - Money is want money does.<br />
2. Inflation - Inflation is the issue of too much currency.<br />
3. BOP - Balance of Payment<br />
4. LM - Liquidity and money supply.<br />
5. IS - Investment and Saving<br />
6. Devaluation - Devaluation is official reduction in the external value of domestic<br />
currency.<br />
7. Globalisation - The Integration of economics of the world resultion from free<br />
flows of trade, capital, labour and technology.<br />
8. Exchange rate - the price of foreign money.<br />
9. Tax - compulsory payment, without quid-pro-quo imposed on the citizen of the<br />
govenment.<br />
7.5 Objective type questions :<br />
A) Choose the correct alternative given below :<br />
1) The rate of exchange in unconvertable paper currency system is ........<br />
a) Flexible b) Fixed<br />
c) decrease d) None of these<br />
2) This model is called the keynesian open Economy model ............<br />
a) IS-LM model b) Samuelson's Model<br />
c) Mundell-Flemina Model d) Non of these<br />
3) An expansionary monetary policy means .........<br />
a) Increase the money supply b) Increase Loan<br />
c) Incharease in government expenditure d) None of these<br />
4) When foreign exchange is brought and sold for immediate delivery, it is called.<br />
a) Forward rate b) Fixed exchange rate<br />
c) Spot rate d) above all<br />
5) An expansionary fiscal policy means ..........<br />
a) Cut in taxes b) Increase in Govt. expenditure<br />
c) a and b both d) None of these<br />
B) Answer in one sentence :<br />
1) Define the concepts of the balance of payment.<br />
2) What is meant by exchange rate?<br />
142
3) What is Depreciation ?<br />
4) Define the spot exchange rate.<br />
5) What is Expectations ?<br />
6) Define the concept of currency convertibility ?<br />
7) Who developed keynesian open Econony model ?<br />
8) What is the Devaluation ?<br />
9) What is the forward exchange rate ?<br />
10) What is the fixed exchange rate ?<br />
7.6 Answer to the objective questions :<br />
A) Choose the correct alternative given below :<br />
1) a) Flexible :<br />
2) c) Mundel - Fleming model<br />
3) a) Increase the money supply.<br />
4) c) Spot rate of exchange<br />
5) c) a and b both -<br />
B) Answer in one Sentence :<br />
1. "The balance of payments is a systematic record of economic transactions<br />
of the residents of a country with the rest of the world during a given period<br />
of time."<br />
2. "Rate of exhange is only a price of one currency quoted in terms of another<br />
currency."<br />
3. Depreciation refers to the decline in the value of domestic currency in relation<br />
to that of foreign currency.<br />
4. The spot rate of exchange refers to the rate at which foreign currency is<br />
made available on the spot.<br />
5. "Expectation means forecasts made by an economic agent regarding the<br />
uncertain economic variables which are relavant to this decision."<br />
6. 'Currency convertibility means currency of a country can be freely converted<br />
into foreign currency.'<br />
7. Mundal - Fleming developed keynesian open Economic model.<br />
8. "Devaluation means a deliberate reduction by the government in the value<br />
of its national currency in terms of gold, foreign Currencies".<br />
9. The forward rate is the rate at which a future contract for foreign currency is<br />
brought and sold.<br />
143
10. Fixed exchange rate system, a country officially fixes a specific exchange<br />
rate of its currency in terms of a given foreign currency and maintains the<br />
same over a period of time.<br />
7.7 Questions for Practice<br />
a) Write short notes :<br />
1) Fixed exchange rates.<br />
2) Monetary approach to balance of Payments<br />
3) Flexible exchange rates<br />
4) Fixed exchange rates with perfeet capital mobility.<br />
5) Spot rate and forward exchange rates.<br />
b) Broad Questions :<br />
1) What is meant by exchange rate? Discuss its types.<br />
2) Discuss in detail Mundell- Fleming model of open economy.<br />
3) Explain the merits of a flexible exchange rate system.\<br />
4) State the argaments for and against Fixed exchange rates.<br />
5) What are the merits and demerits of flexible exchange rate ?<br />
7.8 Books for further study.<br />
1. M. K. Ghadoliya - <strong>Macro</strong> <strong>Economics</strong>, RBSA Publishers, Jaipur, 2003.<br />
2. M. L. Seth - Money, Banking, Intemational Trade and Pubic finance, Lakshmi<br />
Narain Agarwal, Educational Publishers, Agra. 2003<br />
3. M. L. Jhingan - <strong>Macro</strong> Economic Theory, Reprint 2005, Vrinda Publieations (P.)<br />
Ltd.<br />
4. Dr. H. L. Ahuja - <strong>Macro</strong> <strong>Economics</strong> Theory and Policy. S. Chand & Company<br />
Ltd. New Delhi, Reprint - 2010<br />
● ● ●<br />
144
Unit – VIII<br />
Theories of Inflation and Business Cycles<br />
8.0 Objectives<br />
8.1 Introduction<br />
8.2 Presentation of Subject matter<br />
8.2.1 Classical Keynesian and monetarist approach to inflation structural<br />
theories of Inflation.<br />
8.2.2 Philips Curve Analysis - Tobinls modified Philips Curve.<br />
8.2.3 Samulson, Hicks and Goddwin's theory of Business cycle.<br />
8.2.4 Policy to control Inflation & Business cycle.<br />
8.3 Summary<br />
8.4 Key- words<br />
8.5 Objectives Questions<br />
8.6 Answevs of Objective Questions<br />
8.7 Questions for practice<br />
8.8 R Books for further Reading<br />
8.0 Objectives- Atter going the this Unit No- 8, you will be able -<br />
1. To understand concepts of Inflation as well as Business Cycles.<br />
2. To study theoretical explanation of the problems of inflation and business<br />
cycles.<br />
3. To highlight policies to control both the inflation and business cycles.<br />
8.2. Presentation of Subject Matter<br />
8.2.2 Introduction<br />
<strong>Macro</strong> economic analysis is a major approach of economic analysis in economic<br />
theory. It analyses economic problems and phenomena with broader perspectives.<br />
The previous unit has studied the problems of Exchange Rate and Balance of Payments<br />
in detail. Hence, the present unit endeavours to study two major and important problems<br />
145
Inflation and Business Cycles in theoretical perspective with emphasis on measures<br />
to deal with them.<br />
8.2.3 Inflation<br />
Inflation is a major economic problem of the globe in general and developing<br />
economies in particular. It has number of consequences, which affects every section<br />
of population and employees badly. Therefore, it is inevitable to study the problem of<br />
inflation.<br />
The meaning of the term Inflation can better understand with the help of following<br />
definitions.<br />
1. Crowther<br />
“Inflation is a state in which the value of money is falling, i. e. prices are rising.”<br />
2. Hawtrey<br />
“Inflation is the issue of too much currency.”<br />
3. Kemmerer<br />
“Inflation is too much currency in relation to the physical volume of business<br />
being done.”<br />
4. Coulbourn<br />
“Inflation is too much money chasing for few goods.”<br />
* Types of Inflation<br />
Inflation is classified into various types based on the different criteria.<br />
1. Creeping, Walking, Running and Hyper Inflation<br />
2. Open and Suppressed Inflation<br />
3. Comprehensive and Sporadic Inflation<br />
4. Full and Partial Inflation<br />
5. Peacetime, Wartime and Post War Inflation.<br />
8.2.3 Theories of Inflation<br />
There are four theories of inflation primarily. They are known as approaches<br />
towards the analysis of inflation.<br />
A) Classical Theory<br />
B) Keynesian Theory<br />
C) Monetarist Theory<br />
D) Structuralist Theory<br />
A) Classical Theory of Inflation<br />
Theories of inflation explain why the problem of inflation emerges out in the<br />
economy. They analyse the causes responsible for the phenomenon of inflation classical<br />
146
approach is the first theory of inflation propounded by the classical economists like<br />
Irving Fisher. This theory explains the problem of inflation in terms of money supply. It<br />
is known as the quantity theory of money.<br />
The quantity theory of money is quite old theory. It was first propounded in<br />
1588 by an Italian economist Dayanzatti. Later, the classical economist developed<br />
this Irving Fisher popularized this theory in his book, “The Purchasing Power of Money”<br />
published in 1911, and gave quantity approach to this theory. The economists like<br />
John Locke, David Hume also have contributed in the development of this theory.<br />
According to classical theory, price level is determined by quantity or supply of<br />
money. Thus, this theory establishes the relationship between money supply and price<br />
level. This theory explains the factors that determine the general price level in a country.<br />
Quantity of money and price level are positively and proportionately related. There is<br />
direct and proportionate relationship between supply of money and price level. With<br />
the increase in money supply the price level also increases, and vice versa. In addition<br />
to that, increase in the price level is in the same proportion in which supply of money<br />
increases, and the value of money decreases.<br />
The classical approach towards the inflation can be explained with the help of<br />
following figure.<br />
Price Level<br />
(P)<br />
Y<br />
P 3<br />
P 1<br />
P 2<br />
O<br />
<br />
<br />
B<br />
M 2 A<br />
M 1 C<br />
M 3 F (MV)<br />
X<br />
<br />
Quantity of Money (MV)<br />
In the above figure, the level of price increases in the same proportion in which<br />
quantity of money increases. It falls with the decrease in money supply. The supply of<br />
money rose from M 1 to M 3 , as a result price level increased from P 1 to P 3 .<br />
Irving Fisher explains the problem of inflation due to increase in money supply<br />
with the help of following equation.<br />
MV + M 1 V 1 = PT<br />
or<br />
P =<br />
MV<br />
1<br />
+ M V<br />
T<br />
1<br />
147
where P = Price Level<br />
M = Supply of Legal Tender Money<br />
V = Velocity of circulation of Legal Tender Money<br />
M 1 = Supply of Bank/Credit Money<br />
V 1 = Velocity of Circulation of Bank Money<br />
T = Volume of Transaction<br />
There is a direct and proportionate relationship between price level (P) and<br />
supply/quantity of money (MV + M 1 V 1 ).<br />
But this theory is criticized on the ground that it is the theory of value of money<br />
and not a theory of inflation. It cannot explain the phenomenon of hyper inflation.<br />
Likewise, it cannot be applicable to the economy suffering from depression.<br />
B) Keynesian Theory<br />
J. M. Keynes has given excess demand approach to the analysis of the problem<br />
inflation. It is the demand for goods and services greater than their supply results in<br />
rise in prices and thereby the problem of inflation. According to Keynes, “Just as the<br />
price of any commodity is determined by the demand and supply, so also the general<br />
price level is determined by the total demand for and total supply of the goods. Thus,<br />
inflation is the result of excess demand over supply.”<br />
This is known as demand pull inflation. Keynes says, inflation arises when<br />
there occurs an ‘inflationary gap’ in the economy, which comes to exist when aggregate<br />
demand exceeds aggregate supply at full employment level of output. Inflation is caused<br />
where pressure of aggregate demand for goods and services exceeds the supply of<br />
output. This imbalance in demand and supply of goods and services occurs as the<br />
result of number of forces. When aggregate demand for all purposes – consumption,<br />
investment and government, expenditure exceeds the supply of goods at current prices,<br />
there is a rise in prices.<br />
J. M. Keynes in his booklet “How to Pay for War” published during IInd World<br />
War, explained inflation in terms of excess demand for goods relative to the aggregate<br />
supply of their output. His concept of ‘Inflationary Gap” in this book represented excess<br />
of aggregate demand over full employment output. Inflationary gap leads to the rise in<br />
prices. Keynes gave explanation of inflation in terms of demand pull forces. Hence,<br />
the theory of demand-pull inflation is recognised in the name of Keynes. Because<br />
after full employment level of aggregate supply, output cannot increase in demand,<br />
this results in rise in prices under the pressure of excess demand, and consequently<br />
inflation. The main factors which are responsible for increase in demand are increase<br />
in public expenditure, increase in exports, repayment of internal debt, reduction in<br />
taxation, increase in private expenditure. Likewise, factors contributing to decrease in<br />
supply are hoarding by consumers, hoarding by traders, shortage of inputs, etc.<br />
148
elow.<br />
The Keynesian theory of inflation can be explained with the help of diagram<br />
Y<br />
AS<br />
Price Level<br />
P 4<br />
P 3<br />
AD 4<br />
AD<br />
P 3<br />
2 Y 1 Y 2 Y 3<br />
AD 2<br />
O<br />
X<br />
In the above diagram, AD is Aggregate Demand Curve, and AS is Aggregate<br />
Supply Curve. With the increase in demand, price level increases from OP to OP 4 .<br />
The increase in price level is higher when economy reaches at full employment, output<br />
level OY 3 .<br />
C) Monetarist Theory of Inflation<br />
Aggregate Demand and<br />
The monetarist like Milton Friedman has developed monetarist approach to<br />
the problem of inflation, and propounded monetarist theory of inflation. It is also the<br />
demand pull theory of inflation. But it is slightly different from that of J. M. Keynes. We<br />
get monetary explanation of the inflation in Milton Friedman’s “The Role of Monetary<br />
Policy”, in American Economic Review published in 1968.<br />
Milton Friedman also explains inflation of excess demand for goods and<br />
services, but different from J. M. Keynes. J. M. Keynes explained inflation arises due<br />
to real sector forces. According to him, excess demand comes in existence as the<br />
result of autonomous increase in expenditure on investment or consumption. It is<br />
increase in aggregate expenditure or demand occurs independent of increase in the<br />
supply of money. But according to monetarists, inflation arises because of rise in prices<br />
on account of the increase in money supply in the economy.<br />
According to Friedman, “Inflation is always and everywhere as monetary<br />
phenomenon, and can be produced only by a more rapid increase in the quantity of<br />
money than in output.” When supply of money increases in the economy, then there<br />
emerges excess supply of money balances with the public over the demand for money.<br />
149
Hence, people increase their expenditure on purchasing goods and services. The<br />
excess supply of money supply results in increase in aggregate demand for goods<br />
and services. If there is no increase in output, then extra money supply leads to excess<br />
demand for goods and services. This causes inflation or rise in prices.<br />
The monetarist theory of inflation can be explained with the help of following<br />
equation;<br />
P =<br />
MV<br />
T<br />
=<br />
M 1<br />
.<br />
Y K<br />
∆P<br />
∴<br />
P<br />
=<br />
∆M<br />
M<br />
s<br />
s<br />
∆Y<br />
−<br />
Y<br />
∆ P<br />
From the above equation, rate of inflation ( P<br />
) is determined by growth of<br />
money supply (<br />
∆ Y<br />
) and rate of growth of output ( Y<br />
), with velocity of circulation<br />
(V) Y or K remaining constant. Hence, Friedman and other monetarist claim, inflation<br />
is predominantly a monetary phenomenon, which implies changes in velocity and<br />
output are small.<br />
The monetarist theory of inflation is represented with the help of figure below.<br />
Y<br />
AS<br />
P 1<br />
T<br />
Price Level<br />
P<br />
R<br />
AD(M)<br />
AD 1 (M 1 )<br />
O<br />
Y Y 1<br />
National Income<br />
150<br />
X
In the above figure, with the increase in supply of money the demand for goods<br />
and services increases. But to that extent supply of goods and services does not<br />
increase, as the result, price level rises and inflation arises.<br />
Cost – Push Inflation<br />
Before 1950s inflation was explained in terms of excess demand phenomenon<br />
in terms of quantity theory of money or Keynesian theory. The supply or cost explanation<br />
of inflation was given during 1950s. The cost-push inflation theory is referred to as the<br />
new inflation theory. Holzman, Martin Bronfenbrenner have observed analysis of<br />
inflation in the context of cost of production and supply. The idea is price level might<br />
rise on the cost or supply side, independent of any increase in aggregate demand.<br />
Increase in cost of production can take place due to wage push, profit push<br />
and increase in prices of raw materials, especially energy inputs. In addition to the<br />
direct effect of increase in prices of raw materials, there are indirect effects of such<br />
supply shocks, which cause further rise in rate of inflation. An important feature of<br />
cost-push inflation is, this causes not only rise in price level, but brings about fall in<br />
aggregate output.<br />
The theory of cost push inflation is presented in the diagram below.<br />
AS 2 E 1<br />
Y<br />
AS 1<br />
Price Level<br />
P 2<br />
O<br />
E 2<br />
Y 2 Y 1<br />
Aggregate Output<br />
In the above diagram with the increase in cost of production due to increase in<br />
wages, profits and prices of raw materials the aggregate supply falls from AS 1 to AS 2 ,<br />
demand remaining the same (AD), hence price level rises from OP 1 to OP 2 . And rise in<br />
price level is higher than fall in output in the economy.<br />
Many economists are of the opinion that inflation in the economy is caused by<br />
the interaction of the demand pull and cost push factors. The inflation many be started<br />
in the first instance either by cost push factors or by demand pull factors, both works<br />
151<br />
X<br />
AD
and interact to cause sustained inflation over time. The interaction between demand<br />
pull and cost push inflation is shown in the diagram below.<br />
Y<br />
AD 1<br />
AD<br />
Price Level<br />
P 2<br />
P 1<br />
P<br />
C 2 C 1<br />
C<br />
O<br />
AD<br />
Y Y1<br />
Aggregate Output<br />
X<br />
The above diagram shows initially demand pull inflation takes place. Later on<br />
cost push inflation arises in the economy. The interaction between them further<br />
intensifies the inflation.<br />
D) Structuralist Theory of Inflation<br />
The above mentioned theories of inflation cannot analyse the problem of inflation<br />
in developing countries, especially of Latin America. The well known economists Myrdal<br />
(1968), Streeten (1972) have propounded the structuralist theory of inflation, which<br />
analyses inflation in developing countries in terms of structural features of their<br />
economies. Recently Kirkpatrick and Nixon (1987) have generalized this theory for all<br />
developing countries.<br />
According to the structuralists, it is incorrect to apply the highly aggregative<br />
demand supply model for explaining inflation in the developing countries. Because,<br />
there is a lack of balanced integrated structure in them where substitution possibilities<br />
between consumption and production and inter sectoral flows of resources between<br />
different sectors of the economy are not quite smooth and quick so that the inflation in<br />
them cannot be reasonably explained in term of aggregate demand and aggregate<br />
supply.<br />
According to this theory, economies of the developing countries of Latin America<br />
and India are structurally underdeveloped as well as highly fragmented due to the<br />
existence of market imperfections and structural rigidies of various types. The result<br />
of these structural imbalances and rigidies is that whereas in some sectors of these<br />
developing countries, we find shortages of supply relative to demand, in others under<br />
utilisation of resources and excess capacity exists due to lack of demand. These<br />
152
structural features of the developing countries make the aggregate demand supply<br />
model of inflation inapplicable to them. Therefore, disaggregative and sectoral demand<br />
supply imbalances to explain inflation in the developing countries is necessary. Various<br />
sectoral constraints or bottlenecks generate the sectoral imbalances and lead to rise<br />
in prices. Therefore, it is inevitable to analyse the forces, which generate these<br />
bottlenecks or imbalances to study inflation in developing countries.<br />
These bottlenecks are of four types : 1) Agricultural bottlenecks, which make<br />
supply of agricultural products inelastic, 2) resources constraint or government budget<br />
constraints, 3) foreign exchange bottleneck, and 4) physical infrastructural bottlenecks.<br />
The bottlenecks like disparities in land ownership, defective land tenure system act as<br />
disincentives for raising agricultural production in response to increasing demand for<br />
them due to increase in income, population growth and urbanisation. Likewise, use of<br />
backward technology also adversely affects agricultural production growth. Even though<br />
planned efforts are made to achieve rapid and all rural development in the developing<br />
counties through government participation, budget constraint or resource gap does<br />
not enable to achieve it. Inadequate revenue mobilization is also due to tax evasion,<br />
low tax base, inefficient and corrupt tax administration. Hence, the government exploits<br />
deficit financing as a means of financing, which increases money supply, but to that<br />
extent output does not increase, as a result, inflation arises. Shortage of foreign<br />
exchange due to low exports, but increasing imports which necessitates devaluation<br />
of currency leads to the problem of inflation in developing countries like India. Low<br />
exports are due to low exportable supply and high domestic demand. But imports rise<br />
because of ambitious industrialization programme. Likewise, imports of capital goods,<br />
technology, machinery, foodgrains, petroleum products promote inputs rapidly resulting<br />
in the problem of deficit in balance of payments. Currency devaluation is undertaken<br />
to tackle the problem of disequilibrium in balance of payments, which intensified inflation.<br />
Besides these, lack of infrastructural facilities, such as power, transport, fuel stands in<br />
the way of adequate growth in output, and thereby increase gravity of the problem of<br />
inflation in the developing countries.<br />
According to this theory, above mentioned bottlenecks and constraints are<br />
rooted in the social, political and economic structure of the developing countries.<br />
Therefore, a broad based strategy of development which aims to bring about social,<br />
institutional and structural changes is needed to bring about economic growth without<br />
inflation. Further, giving higher priority to agriculture in the strategy of development is<br />
essential for price stability.<br />
Now the question arises is, which theory of inflation, whether demand pull or<br />
cost push can explain the problem of inflation in the developing countries like India? It<br />
is observed that inflation in developing economies is the result of both the demand<br />
pull as well as cost push inflation. Hence, inflation in developing countries can be<br />
explained as a contribution of both the demand pull as well as demand push as shown<br />
in the diagram below.<br />
153
Y<br />
Price Level<br />
P 2<br />
E 2 E 1<br />
P 1 AD<br />
E<br />
1<br />
AD<br />
O<br />
Y<br />
Y1<br />
X<br />
8.2 Phillips Curve Analysis<br />
National Output<br />
According to J. M. Keynes, the aggregate supply curve is of inverse L shape,<br />
that is, it is a horizontal straight line up to full employment level of output, beyond that<br />
it becomes horizontal. Inflation arises in the economy only after full employment level<br />
of output is achieved. Thus, with L shaped aggregate supply curve there is no trade off<br />
or clash between inflation and unemployment.<br />
But the empirical evidence did not prove correct the Keynesian macro model.<br />
A well-known British economists, A. W. Phillips in 1958 on the basis of data from U. K.<br />
for 100 years drawn a conclusion that, there is inverse relationship between rate of<br />
unemployment and rate of inflation. This indicates a trade off that, for reducing<br />
unemployment, price in the form of a higher rate of inflation has to be paid, and for<br />
reducing the rate of inflation, price in terms of a higher rate of unemployment has to be<br />
borne.<br />
Y<br />
Rate of Inflating<br />
10<br />
9<br />
8<br />
7<br />
6<br />
5<br />
4<br />
3<br />
P 1 Philips Curve<br />
P 2<br />
O<br />
1 2 3 4 5 6 7 8 9 10<br />
Rate of Unemploy-<br />
154<br />
X
Phillips Curve in the above diagram shows inverse relationship between rate<br />
of inflation and rate of unemployment. At higher rate of inflation the rate of unemployment<br />
falls and vice versa.<br />
Both the Keynes and Monetarist have given explanation of downward sloping<br />
Phillips curve. The marginal cost of firms increases as more labour is employed due to<br />
diminishing marginal physical product of labour and also because wage rate also<br />
rises. Phillips while discussing the relationship between inflation and unemployment,<br />
considered the relationship between rate of increase in wage rate (as a proxy for the<br />
rate of inflation) on the one hand, and unemployment rate on the other. A higher rate of<br />
increase in aggregate demand and consequently a higher rate of rise in price level is<br />
associated with the lower rate of unemployment, and vice versa.<br />
But during 1971-91 the Phillips curve analysis collapsed, and some economists<br />
asserted that the stable Phillips curve has disappeared. In these two decades period<br />
in USA, rates of both inflation and unemployment increased, i. e. a high rate of inflation<br />
was associated with a high rate of unemployment rate, which shows the absence of<br />
trade off. This is known as shift in Phillips curve. The shift in Phillips curve is due to<br />
according to Keynes because of adverse supply shocks in the form of four fold increase<br />
in the prices of oil and petroleum products delivered to the American economy first in<br />
1973-74 and again in 1979-80. According to Friedman’s natural rate hypothesis though<br />
there is trade off between inflation and unemployment and therefore the long run<br />
Phillips curve is a vertical straight line. According to Friedman’s theory of adaptive<br />
expectations, there may be trade off between rate of inflation and unemployment in<br />
the short run, but there is no such trade off in the long run.<br />
The advocates of natural rate of unemployment rate theory think, when the<br />
actual rate of unemployment achieved is only a temporary phenomenon. When the<br />
actual rate of inflation exceeds the one that is expected, unemployment rate will fall<br />
below the natural rate only in the short run. In the long run, the natural rate of<br />
unemployment will be restored.<br />
The economy will not remain in stable equilibrium at natural rate of<br />
unemployment. Because workers will realise that due to the higher rate of inflation<br />
than the expected, their real wages and incomes have fallen.<br />
The workers will demand higher nominal wages to restore their real income. But as<br />
nominal wages rise to compensate for the higher rate of inflation than expected, profits<br />
of business firm will fall to their earlier levels. This reduction in their profit implies that<br />
the original motivation that promoted them to expand output and increase employment<br />
resulting in lower unemployment rate will no longer be there.<br />
Thus, while short run Phillips curve is downward sloping indicating that trade<br />
off between inflation and unemployment rate in the short run, the long run Phillips<br />
curve is a vertical straight line showing no trade off exists between inflation and<br />
unemployment in the long run.<br />
155
Rate of Inflating<br />
Y<br />
1<br />
9<br />
8<br />
7<br />
6<br />
5<br />
SPC 2<br />
SPC 1<br />
SPC 3<br />
A<br />
B<br />
C<br />
P (9%)<br />
P (7%)<br />
P (6%)<br />
O<br />
U<br />
X<br />
According to Rational Expectations Theory, there is no lag in the adjustment of<br />
nominal wages consequent to the rise in price level. Nominal wages are quickly adjusted<br />
to any expected changes in the price level so that there does not exist the type of<br />
Phillips curve that shows trade off between rates of inflation and unemployment. As a<br />
result of increase in aggregate demand, there is no reduction in unemployment rate.<br />
The rate of inflation resulting from increase in aggregate demand is fully and correctly<br />
anticipated by workers and business firms and get completely and quickly incorporated<br />
into the wage agreements resulting in higher prices of products.<br />
* Tobin’s Modified Phillip’s Curve<br />
Unemployment Rate<br />
The Friedman-Phelps-Lucas explanation of the empirical instability of the Phillips<br />
curve dramatically transformed macro economics. However, Tobin (1971 a, 1971 b)<br />
suggested approach to explaining the Phillips curve, which identified the issue of<br />
incorporation of inflation expectations rather the formation of inflation expectations.<br />
But Tobin never developed a deeper theoretical account of this alternative approach.<br />
Expected inflation equals actual inflation in the long run. Therefore, the long<br />
run Phillips curve is negatively sloped, and there exists a permanent trade off between<br />
inflation and unemployment. The long run Phillips curve crosses each short run Phillips<br />
curve at point where actual inflation equals expected inflation (<br />
. One critical<br />
feature of long run negatively sloped Phillips curve is that expected inflation equals<br />
actual inflation at all times so that agents are always on the long run Phillips curve.<br />
However, the long run Phillips curve remains negatively sloped. This shows that<br />
formation of inflation expectations is not the critical question when it comes to the<br />
Phillips curve.<br />
Analytically, the key feature of Tobin’s neo-Keynesian Phillips curve is that, the<br />
coefficient of inflation expectations is less than unity. That means incorporation of<br />
inflation expectations into nominal wage setting is less than complete, and it is this<br />
rather than the formation of inflation expectations that is critical for the existence of a<br />
156
Phillips trade off. The problem is, it is hard to construct a justification in an aggregate<br />
labour market model. That is because according to such a model the labour market<br />
determines real wages and failure to fully incorporate inflation expectations would<br />
constitute systematic money illusion. That in turn erode the real wage over time, causing<br />
systematic disequilibrium.<br />
Why empirical estimates of the Phillips curve show less than full incorporation<br />
of inflation expectations was suggested by Tobin, who argued the Phillips curve is the<br />
product of a multi-sector phenomenon. “The myth of macro economics is that relations<br />
among aggregates are enlarged analogues of relations among corresponding variables<br />
for individual households; firms, industries, markets. That myth is a harmless and<br />
useful simplification in many contexts, but sometimes it misses the essence of the<br />
phenomenon.”(Tobin, 1972). For Tobin, the Phillips curve is a disequilibrium<br />
phenomenon, the product of the combination of downward nominal wage rigidity plus<br />
persistent recurring disequilibria at the sector level. Disequilibria are always arising at<br />
the sector level and some sectors have unemployment because of downward nominal<br />
wage rigidity. Greater aggregate demand pressure reduces unemployment by reducing<br />
the proportion of sectors with unemployment, but it raises inflation in sectors at full<br />
employment. Unfortunately, Tobin (1972) did not complete the argument by showing<br />
how a multi-sector framework can explain incomplete incorporation of inflation<br />
expectations. That requires some retheorizing of labour markets and nominal wage<br />
setting.<br />
8.2.4 Policies to Control Inflation<br />
There are number measures included in some of the policies to control inflation.<br />
They are as follows :<br />
I) MONETARY POLICY MEASURES<br />
Monetary policy through its measures tries to control supply of money in the<br />
economy, and thereby controls inflation.<br />
1. Increase in Bank Rate<br />
The increase in bank rate decreases supply of bank money and thereby total<br />
supply of money in the economy and controls growing inflation.<br />
2. Sale of Securities in Open Market<br />
The sale of securities by the government in the open market decreases lending<br />
capacity of banks, which results in cut down in supply of credit money, total money<br />
and facilitates the control of inflation in the economy.<br />
3. Increase in Cash Reserve Ratio<br />
Increasing cash reserve ratio controls credit creation, supply of bank money<br />
and total supply of money, which consequently restricts increasing intensities of inflation.<br />
157
4. Demonetisation of Currency<br />
The demonetisation of currency results in supply of legal tender money, thereby<br />
bank money and total supply of money in the economy, as the result of which inflation<br />
intensity is controlled.<br />
5. Issue of New Currency of Higher Denominations<br />
The issuing of currency of higher denominations facilitates control of velocity<br />
of circulation of money, credit creation, bank money, total money which enables the<br />
control of inflation in the economy.<br />
II)<br />
FISCAL POLICY MEASURES<br />
These directly affect demand for the goods and services, and facilitate the<br />
control of inflation in the economy. They are :<br />
1. Increase in Taxes<br />
The increasing rates of existing taxes, and introducing new taxes curtails<br />
purchasing power of people and their demand for goods and services that control<br />
rising prices and inflation.<br />
2. Cut Down in Public Expenditure<br />
The cutting down in expenditure of the government reduces purchasing power<br />
of the people, and demand for goods and services, and thereby control of rising prices<br />
of goods and services and inflation also.<br />
3. Increase in Savings<br />
The obligatory increase in savings of the people by the government results in<br />
fall in demand for goods and services, which restricts rising prices and control of<br />
inflation.<br />
4. Surplus Public Budget<br />
The surplus public budget restricts injecting additional purchasing power in<br />
the economy and control both the rise in prices of goods and services as well inflationary<br />
situation in the economy.<br />
5. Increasing Public Debt<br />
The raising of increased public debt by the government cuts down purchasing<br />
power of the people and their demand for goods and services, which facilitates rising<br />
prices and inflation in the economy.<br />
III)<br />
OTHER POLICY MEASURES<br />
They are as follows :<br />
1. Increase in Output<br />
The increase in output of goods and services restricts their rising prices and<br />
restricts growing inflation.<br />
158
2. Rational Wage Policy<br />
The wages in accordance with the marginal productivity controls demand for<br />
goods and services, their rising prices and the state of inflation.<br />
3. Price Control Policy’<br />
The policy to control prices results in the control of rising prices of goods and<br />
services and thereby the inflationary situation.<br />
4. Rationing of Goods<br />
The rationing of goods and services through public distribution system restricts<br />
rising prices of goods and services and controls the inflation in the economy.<br />
5. Import Liberalization<br />
The remaining restrictions on imports of goods and services promotes imports<br />
and their supply in the economy which control rising prices and inflation in the economy.<br />
8.2.3 Business Cycles<br />
Capitalism is a type of economy. Its salient feature is, its economic development<br />
is coupled with occasional fluctuations, not steady and single direction. These ups<br />
and downs are in economic activity of the economy consisting of output, income,<br />
employment, investment, etc.<br />
Meaning of Business Cycles<br />
The dynamic forces operating in the economy create various kinds of business<br />
or economic fluctuations. According to their salient features, fluctuations or moments<br />
in economic activity are classified into four kinds, such as secular trends, seasonal<br />
fluctuations, cyclical fluctuations and random fluctuations. These cyclical fluctuations<br />
are known as trade or business cycles. They create significant disturbances in the<br />
working of the economic system, and their causation is not easily perceived. Hence,<br />
the study of trade or business cycles has a special importance.<br />
The term trade cycle in economics refers to the wave like fluctuations in the<br />
aggregate economic activity particularly employment, output and income. Business<br />
cycles are ups and downs in economic activities. The meaning of the term business<br />
cycles can better understood from its following definitions.<br />
1. Mitchell<br />
“A fluctuation in aggregate economic activity is a trade cycle.”<br />
2. Hoberler<br />
“The business cycles is an alternation of periods of prosperity and depression<br />
of good and bad trade.”<br />
3. J. M. Keynes<br />
“A trade cycle is composed of periods of good trade characterised by rising<br />
prices, and low unemployment percentages altering with periods of bad trade<br />
characterised by falling prices and high unemployment percentages.”<br />
159
2.9 Phases of Business Cycles<br />
Burus and Mitchell in their book “Measuring Business Cycles” regard the peaks<br />
and the trough as the cyclical mark off points in a cycle. A business cycle is divided<br />
into four phases, prosperity, recession, depression, revival or recovery. Their<br />
diagrammatic presentation is as follows :<br />
Y<br />
Economic<br />
Activitiy<br />
Prosperity<br />
Peak<br />
Recession<br />
Depression<br />
Fullemployment<br />
Peak Equilibrium<br />
F<br />
Recovery<br />
Trough<br />
O<br />
Trough<br />
Time<br />
X<br />
A) Prosperity<br />
According to Haberler prosperity is a state of affairs in which the real income<br />
consumed, real income produced and level of employment are high or rising, and<br />
there are no idle resources or unemployed workers or very few of either. The salient<br />
features of prosperity are; a high level of output and trade, a high level of effective<br />
demand, a high level of employment and income, a high marginal efficiency of capital,<br />
a state of price inflation, a rising structure of interest rate, a large expansion of bank<br />
credit, overall business optimism, economy tends to be operating almost at a full<br />
capacity along its production possibility curve, profits high but falling, building<br />
construction much and very high in late states, wide spread speculation, a few business<br />
failures, high cost of production and very high in late stages, business inventories high<br />
and very high in later stages.<br />
B) Recession<br />
Where prosperity ends, recession begins. It is a turning point rather than a<br />
phase. It is relatively for a shorter period of time. Its noteworthy features are; sudden<br />
fall in employment, decreasing industrial output, wage rates falling but lag behind<br />
prices, rapid fall in prices, bank loans cut sharply, bank reserves suddenly rise, bank<br />
clearings suddenly fall, high discount rates, falling cost of production, profits disappear,<br />
sudden rise in business failures, little speculation, falling business inventories, building<br />
construction suddenly stop, feeling of hesitation.<br />
160
C) Depression<br />
The state in an economy in which real income consumed, real income produced<br />
and the rate of employment are falling or are subnormal due to idle resources and<br />
capacity is depression. Its salient features are; shrinkage in the volume of output,<br />
trade and transaction, rise in the level of unemployment, price deflation, fall in aggregate<br />
income of the community, fall in wages and profits, fall in the structure of interest rates,<br />
curtailment in the consumption spending by reduction in the level of effective demand,<br />
collapse of the marginal efficiency of capital, decline in the investment demand function,<br />
construction of bank credit, high bank reserves, low discount rates, low cost of<br />
production, money business, failures, very little speculation, low business inventories,<br />
almost nil building construction except public works.<br />
D) Recovery/Revival<br />
It refers to the lower turning point at which an economy undergoes changes<br />
from depression to prosperity. Its important features are; slow rise in employment,<br />
slow increase in industrial output. Wage rates rise but lag behind prices, slow rise in<br />
prices, banks loans expand, slow fall in bank reserves, slow rise in bank clearings,<br />
fairly low discount rates, costs of production rise slowly, speculation rise slowly, business<br />
inventories rise slowly, building construction rise slowly.<br />
* Theories of Business Cycles<br />
There are number of theories of business cycles, classified into monetary<br />
theories, and non-monetary theories. The important theories of business cycles<br />
expected to study are; Samuelson’s theory, Hicks theory and Goodwin’s model.<br />
A) Samuelson’s Theory of Business Cycle<br />
J. M. Keynes explained that ups and downs in investment demand depending<br />
on profit expectations of the entrepreneurs that causes changes in aggregate demand,<br />
which affect the levels of income, output and employment. Keynes also showed effect<br />
of increase and decrease in investment on output and employment. But Keynes did<br />
not explain the cyclical and cumulative nature of the fluctuations in economic activity.<br />
He did not explain importance of accelerator in the explanation of business cycles. P.<br />
A. Samuelson in his seminal paper “Interaction between the Multiplier Analysis and<br />
the Principle of Acceleration” (1939) showed that, it is the interaction between the<br />
multiplier and accelerator that gives fluctuations in economic activity. The multiplier<br />
alone cannot adequately explain the cyclical and cumulative nature of the economic<br />
fluctuations.<br />
Autonomous increase in the level of investment raises income by a magnified<br />
amount depending upon the value of multiplier. This increase in income further induces<br />
the increases in investment through the acceleration effect. The increase in income<br />
brings about increase in aggregate demand for goods and services. To produce more<br />
goods, more capital goods are required, for which extra investment is undertaken.<br />
Thus, the relationship between investment and income is of mutual interaction;<br />
161
investment affects income, which in turn affects investment demand, and in this process<br />
income and employment fluctuate in a cyclical manner.<br />
Increase in income and output takes place by even larger amount, when<br />
accelerator is combined with the Keynesian multiplier when increase in autonomous<br />
investment ( ∆ I a<br />
) takes place, consequently through multiplier effect income increases<br />
, further increase in induced investment through accelerator ( ∆ I d<br />
= V Y) aggregate demand and income increases by even in larger amount.<br />
Fluctuations in investment are main cause of instability in a free private<br />
enterprise economy. This instability further increases due to the interaction of the<br />
multiplier and accelerator. The changes in any component of aggregate demand<br />
produce a multiplier effect whose magnitude depends upon the marginal propensity to<br />
consume. When consumption income and output increase under the influence of<br />
multiplier effect, they induce further changes in investment and the extent of this induced<br />
investment in capital goods industries depends on the capital – output ratio, that is the<br />
interaction between the multiplier and accelerator without any external shocks can<br />
give rise to the business cycles, whose pattern differs depending upon the magnitudes<br />
of the marginal propensity to consume and capital – output ratio.<br />
The model of interaction between multiplier and accelerator can be<br />
mathematically presented as :<br />
Yt = Ct + It<br />
Ct = Ca + C (Yt – 1)<br />
It = Ia + V (Yt – 1 - Yt – 2)<br />
Where Yt, Ct, It = income, Consumption and investment respectively for a period t.<br />
Ca = autonomous consumption<br />
Ia = autonomous investment<br />
C = marginal propensity to consume<br />
V = capital output ratio or accelerator<br />
From the above we get income equation, which states how changes in income,<br />
are dependent on the values of marginal propensity to consume (C) and capital output<br />
ratio (V i. e. accelerator).<br />
Yt = Ca + C (Yt – 1) + I a<br />
+ V (Yt – 1 – Yt – 2)<br />
In static equilibrium, the level of income determined will be :<br />
Y = Ca + cY + I<br />
162
By taking different combinations of the values of marginal propensity to consume<br />
(C), and capital – output ratio (V), Samuelson has described different paths, which the<br />
economy will follow. They are shown in the diagram below.<br />
Y<br />
1.2<br />
1.0<br />
0.8<br />
0.6<br />
0.4<br />
0.2<br />
0.1<br />
O<br />
A<br />
D<br />
E<br />
C<br />
B<br />
Combinations of C and V<br />
X<br />
In the above diagram, region A and B are alike, they after a disturbance caused<br />
by a change in autonomous investment or consumption finally bring about stable<br />
equilibrium in the system.<br />
The values of C and V and the magnitudes of multiplier and accelerator of<br />
region C and D resemble each other but are such that they cause great instability in<br />
the system as both of these values cause successively grater divergence from the<br />
equilibrium level and the system tends to explode. The case of region E lies in between<br />
the two as the combinations of values of C and V in it are such that cause cyclical<br />
movements of income which neither move toward nor away from the equilibrium. All<br />
the above five causes do not give rise to cyclical fluctuations or business cycles. It is<br />
only combinations of C and V lying in regions B, C, E that produce business cycles.<br />
They are only shown below :<br />
163
Y<br />
Income<br />
(Output)<br />
New Equilibrium<br />
Initial Equilibrium<br />
O<br />
Panel (b)<br />
Time<br />
X<br />
Y<br />
Income<br />
(Output)<br />
O<br />
Initial Equilisation<br />
Panel (c)<br />
Time<br />
X<br />
Y<br />
Income<br />
(Output)<br />
Initial Equilisation<br />
O Panel (e) Time<br />
X<br />
Critical Appraisal : This theory is criticised on the following grounds.<br />
1. Samuelson’s theory of business cycle is very difficult to understand.<br />
2. This theory does not give a single or unique analysis of emergence of<br />
business cycles.<br />
3. Due to its difficultness of understanding, it has less applicability.<br />
B) Hicks Theory of Business Cycles<br />
J. R. Hicks in his “Contribution to the Theory of Trade Cycles” has propounded<br />
a complete theory of business cycles based on the interaction between the multiplier<br />
and accelerator by choosing certain values of marginal propensity to consume (C)<br />
and capital output ratio (V). To explain business cycles of real world, Hicks has<br />
incorporated the role of buffers in his analysis. He introduces output ceiling when all<br />
the given resources are fully employed and prevent income and output to go beyond<br />
164
it, he visualises a floor or the lower limit below which income and output cannot go<br />
because some autonomous investment is always taking place.<br />
According to Hicks, cyclical fluctuations in real output of goods and services<br />
take place above and below rising line of trends, or growth of income and output. This<br />
theory explains business cycles along with equilibrium rate of growth. The long run<br />
equilibrium growth of income is determined by the autonomous investment and the<br />
magnitudes of multiplier and accelerator. Hicks assumes that autonomous investment,<br />
depending on technological progress, innovations and population growth, grows at a<br />
constant rate. With further assumptions of stable multiplier and accelerator, equilibrium<br />
income will grow at the same rate as autonomous investment. Therefore, the failure of<br />
actual output to increase along the equilibrium growth path, sometimes to move above<br />
it, and sometimes to move below it determines the business cycles.<br />
According to Hicks, the values of marginal propensity to consume and capital<br />
output ratio fall in either region C or D in figure below. In case of values of these<br />
parameters lie in the region C, they produce cyclical movements whose amplitude<br />
increases over time, and if they fall in region D they produce explosive upward<br />
movement of income or output without oscillations.<br />
Investment and<br />
Income<br />
Y<br />
C<br />
E<br />
L<br />
A<br />
O<br />
P 1 P 2<br />
P O Q 2<br />
Q 1<br />
Time<br />
Q 3<br />
C<br />
E<br />
L<br />
A<br />
X<br />
In the above figure, AA = Autonomous Investment, LL = Flour Line that sets lower<br />
limits below which income (output) cannot fall, EE = shows equilibrium growth path of<br />
national income determined by autonomous investment and effect of multiplier and<br />
accelerator, FF = Full employment ceiling, CC = Ceiling line.<br />
When the economy reaches point P 0<br />
along the path EE, there is an external<br />
shock outburst of investment due to certain innovation or jump in governmental<br />
investment. When the economy experiences an outburst of autonomous investment,<br />
it pushes the economy above the equilibrium growth path EE after point P 0<br />
. The rise in<br />
autonomous investment due to external shock causes national income to increase at<br />
a greater rate than that shown by the slope of EE. This greater increase in national<br />
income will cause further increase in induced investment through acceleration effect.<br />
165
This increase in induced investment cause national income to increase by a magnified<br />
amount through multiplier. So under the combined effect of multiplier and accelerator,<br />
national income or output will rapidly expand along the path from P 0<br />
to P 1<br />
. Movement<br />
from P 0<br />
to P 1<br />
represents the upswing or expansion phase of the business cycle. But<br />
this expansion must stop at P 1<br />
because this is the full employment output ceiling. The<br />
limited human and material resources of the economy do not permit a greater expansion<br />
of national income than shown by the ceiling line CC. Therefore, when point P 1<br />
is<br />
reached the rapid growth of national income must come to an end. Hicks assumes<br />
that full employment ceiling grows at the same rate as autonomous investment.<br />
Therefore, CC slopes getting unlike the very steep slope of the line P 0<br />
to P 1<br />
. When<br />
point P 1<br />
is reached the economy must at the same rate as the usual growth in<br />
autonomous investment.<br />
There is slackening off at point P 2<br />
and national income starts moving toward<br />
equilibrium growth path EE. This movement from P 2<br />
downward represents the down<br />
rising or contraction phase of the business cycle. In this downswing investment falls<br />
off rapidly and therefore multiplier works in the reverse direction. The fall in national<br />
income and output resulting from the sharp fall in induced investment will not stop on<br />
touching the level EE, but will go further down. The economy must consequently move<br />
all the way down from point P 2<br />
to point Q 1<br />
. But at point Q 1<br />
floor has been reached.<br />
When during downswing such conditions arise, accelerator becomes inoperative. After<br />
hitting the flour of the economy may for some time crawl along the flour through the<br />
path Q 1<br />
to Q 2<br />
. In doing so, there is some growth in the level of national income. This<br />
rate of growth as before induces investment and both the multiplier and accelerator<br />
come into operation and the economy will move towards Q 3<br />
and the full employment<br />
ceiling CC. This is how the upswing of cyclical movement again starts.<br />
Critical Appraisal<br />
Following criticisms are levelled against the Hicks theory.<br />
1. According to Kaldor, this theory is based on the principle of acceleration<br />
in its rigid form.<br />
2. According to Duesenbery, the basic concept of multiplier – accelerator<br />
interaction is important one but we cannot really accept to explain<br />
observed cycles by a mechanical application of that concept.<br />
C) Goodwin’s Model of Business Cycles<br />
Goodwin’s model of business cycles like that of Hicks is an extension of the<br />
multiplier – accelerator model of business cycles.<br />
He thinks, there is need to combine growth and cycles. However, introduction of growth<br />
in model of trade cycles by means of growing autonomous investment is not fully<br />
sufficient. Growth in labour force and improvement in techniques are crucial factors in<br />
determining economic growth. These two factors cause persistent growth in productive<br />
166
∗<br />
λ( K − K)<br />
capacity, but not necessarily equal to growth in demand. Adequate growth in demand<br />
is achieved through occasional bursts of innovational investment.<br />
Structural coefficients of the economy such as propensity to consume or save<br />
and capital – output ratio are such as to give explosive oscillations. Investment once<br />
begun carries the free market economy to full employment and this upper limit rises<br />
rapidly with accumulation of capital, which allows the realization of the technological<br />
progress.<br />
The expansion of the economy is constrained by the full employment ceiling. However,<br />
after remaining at the peak, certain forces push it downward again. Thus, in absence<br />
of lags, Goodwin’s model visualizes a two phase cycle, full employment and deep<br />
depression.<br />
Model<br />
Goodwin takes capital stock rather than income as the central explanatory<br />
variable. He rejects the proportionality of capital and output, and explains investment<br />
on the basis of comparison of desired capital stocks with the actual capital stock. He<br />
uses ‘flexible accelerator’ as the explanatory principle for investment. According to<br />
this principle, net investment will be undertaken as lag as desired capital stock is<br />
greater than the existing capital stock. The crucial equation of model of cyclical growth<br />
is that of factors which determine desired capital (K * ) stock is;<br />
K * = VY + β(t)<br />
where V = acceleration coefficient (capital - output ratio)<br />
Y = output,<br />
βt = parameter representing a change in technique or technology<br />
According to equation, innovation or technological advance implies that more<br />
capital is desired with a given output and the accelerator (V) implies that more capital<br />
is desired with increased output. Thus, this equation described the principle of ‘Flexible<br />
Accelerator’.<br />
The pressure to expand capital stock through investment is proportional to the<br />
difference between desired capital stock (K * ) and the actual capital stock (K), subject<br />
to two non-linear constraints. The upper limit is set by maximum output of new capital<br />
goods obtainable with given capital stock and labour, and therefore corresponds to<br />
the full employment ceiling. The lower limit is set by the rate at which capital can be<br />
scrapped at zero gross investment. It follows that,<br />
I =<br />
where, λ = proportion of gap between desired capital stock (K * ) and actual capital<br />
stock (K) since investment leads to the expansion in productive capacity, this equation<br />
represents the supply side of the model. Demand in this model is given by the Keynesian<br />
multiplier, and can be stated as;<br />
167
Y = f (I)<br />
The relation between income or output (Y) and investment (I) depends on the<br />
size of multiplier, which is governed by marginal propensity to consume or save.<br />
Propensity to save is rather small, which ensures higher value of multiplier in the<br />
downsizing of a business cycle.<br />
The complete version of Goodwin’s model;<br />
I = λ [vY + β(t) – K]<br />
From the above equation, capital stocks (K) depends on investment and<br />
technological change (i. e. innovations).<br />
Explanations of Business Cycles<br />
The above model is used by Goodwin to explain business cycles. The net<br />
investment in the model depends on the difference between the actual capital stock<br />
and the desired capital stock. If desired capital stock is greater than the actual capital<br />
stock (K * > K), then this gap between the two determines investment or capital<br />
accumulation. If desired capital stock is less than the actual capital stock, then net<br />
investment will be negative. If desired capital stock is equal to the actual capital stock,<br />
then net investment will be zero.<br />
If K * > K, then I n = I – D<br />
If K * = K, then I n = O<br />
If K * < K, then I n = - D<br />
Suppose technological advancement (i. e. innovation) or βt is absent and the<br />
economy is presently in the upswing, and the desired capital stock exceeds capital<br />
stock, then net investment (I n ) will occur in each period over time until actual capital<br />
stock (K) becomes equal to the desired capital stock (K * ). During the period net<br />
investment of capital accumulation is taking place, it will bring about expansion in<br />
output, income and employment through interaction of multiplier and accelerator and<br />
the economy will move up till the upper limit. When the desired capital stock is reached<br />
investment will slacken. This will cause the economy to more downward through the<br />
interaction of multiplier and accelerator, which will cause rapid fall in output and<br />
employment. Thus, sharp booms are periodically accompanied by prolonged<br />
depression.<br />
The above analysis ignores the two sources of economic growth, according to<br />
Goodwin, which play crucial role in determining the cyclical growth. They are 1) increase<br />
in size of labour force, and 2) increase in productivity of labour due to innovations or<br />
technological progress. As a result of the operation of these two forces, there is rise in<br />
fall employment ceiling level. All growth in the full employment ceiling occurs during<br />
the boom. Innovation (i. e. technological advance) and consequently labour productivity<br />
will require additional investment, this results in prolonged boom period and short<br />
depression period.<br />
168
Critical Appraisal<br />
1. Goodwin assumes an economy whose behaviour is characterised by<br />
tendency towards ‘explosive oscillations’.<br />
2. If economy’s inherent tendency is towards ‘dumped cycles’, then<br />
persistent cycles cannot accounted for by Goodwin theory.<br />
3. According to Ragnar Frisch, persistent random shocks to the system<br />
provides a reasonable explanation of trade cycles.<br />
4. This theory has not any empirical evidence in the analysis of business<br />
cycles.<br />
8.2.4 Policies to Control Business Cycles<br />
Business cycles disrupt economic activity and hinder economic development,<br />
coupled with adversely affect standard of living of the major section of the people.<br />
Hence, their control is essential. following policy measures are useful for their control.<br />
I) Monetary Policy Measures<br />
The monetary policy measures regulate the supply of money, especially bank<br />
money in accordance with the needs of the economy and control business cycles.<br />
A) Bank Rate<br />
The central bank bring about necessary changes in the bank rate, taking into<br />
consideration the state of the business cycle. The increase in bank rate enables to<br />
control the state of prosperity/inflation, and its cut down facilitates the revival of the<br />
economy from the depression.<br />
B) Cash Reserve Ratio<br />
Increase in cash reserve ratio restricts credit expansion and controls the state<br />
of prosperity. Depression can be controlled by decreasing the cash reserve ratio.<br />
C) Open Market Operations<br />
The sale of securities in the market during the prosperity controls credit<br />
expansion as well as growing demand for goods and services, and restricts the state<br />
of prosperity. The purchase of securities facilitates the removal of the economy from<br />
the depression.<br />
D) Selective/Qualitative Measures<br />
Besides quantitative measures, the selective or qualitative credit control<br />
measures like fixation of margin between security and loans, rationing of credit, control<br />
through directives, moral suasion, publicity direct controls are useful in controlling<br />
business cycles with their necessary applications.<br />
II)<br />
Fiscal Policy Measures<br />
The fiscal policy measures regulate the demand for goods and services and<br />
control the phases of business cycles. They are :<br />
169
A) Taxation<br />
Increase in taxation is useful to control the state of prosperity, their reduction is<br />
useful in reviving the economy from the depression.<br />
B) Public Expenditure<br />
The policy of cut down in public expenditure arrests the state of prosperity or<br />
inflation. On the contrary, increase in public expenditure revives the economy from the<br />
depression.<br />
C) Public Debt<br />
The government should raise more and more public debt, especially the internal<br />
public debt, which reduces purchasing power of the people, their demand for goods<br />
and services, and control the prosperity. The repayment of public debt by the<br />
government facilitates the control of the state of depression.<br />
D) Budgetary Policy<br />
The policy of surplus budget is useful to control the prosperity, and deficit budget<br />
is desirable in the control of increasing depression.<br />
E) Savings Policy<br />
The policy of voluntary as well as forced savings is suggested to control higher<br />
intensity of inflation. On the contrary, discouraging savings is useful to restrict the<br />
state of depression.<br />
III)<br />
Other Policy Measures<br />
All other measures not included in money and fiscal measures are included<br />
under this category. They consist of :<br />
A) Production Policy<br />
The policy should attempt to promote the output during the prosperity, and to<br />
curtail the output during the depression.<br />
B) Price Policy<br />
The policy of price control is useful in dealing with the problem of business<br />
cycles. The government should fix upper and lower limits within which only the prices<br />
will fluctuate.<br />
C) Wage Policy<br />
The policy of hike and reduction of wages should be adopted during prosperity<br />
and depression respectively.<br />
D) Unemployment Insurance Scheme<br />
The government should collect unemployment insurance fund from the workers,<br />
especially during the prosperity. It can be useful to compensate the workers during<br />
their unemployment in depression.<br />
170
E) Socialist Economy<br />
The problem of business cycles is the part and parcel of the capitalist economy<br />
due to lack of cooperation and coordination in economic decision making. Hence, the<br />
socialist economy featured by the government decision making is useful in dealing<br />
with the business cycles.<br />
8.3 Summary<br />
The present unit is one of the important units in the syllabus of <strong>Macro</strong> <strong>Economics</strong>.<br />
It includes the problems of inflation and business cycles. This unit thoroughly studies<br />
various issues and aspects of both the inflation and business cycles. The major and<br />
noteworthy aspects of inflation which this unit discusses are; Meaning, Theories, Phillips<br />
Curve Analysis, Policies to Control Inflation. Besides these, under Business Cycles<br />
the issues covered by this unit include Meaning, Phases, Theories, Policies to control<br />
Business Cycles and so on.<br />
8.4 Terms to Remember<br />
1. Inflation : the issue of too much currency.<br />
2. Phillips Curve : the curve which shows an inverse relationship between<br />
inflation and rate of unemployment.<br />
3. Monetary Policy : policy of the central bank to control and regulate the<br />
supply of money and rate of interest.<br />
4. Fiscal Policy : policy of the government about taxation, public<br />
expenditure, public debt, deficit financing.<br />
5. Business Cycles : a fluctuation in aggregate economic activity.<br />
8.5 Objective Questions<br />
A) Choose correct answer from the alternatives given below.<br />
1. ——— is a classical economist.<br />
a) J. M. Keynes b) Irving Fisher c) Amartya Sen d) All the above<br />
2. ——— has given the definition of inflation.<br />
a) Crowther b) Hawtrey c) Coulbourn d) All the above<br />
3. ——— has propounded Monetarist theory of inflation.<br />
a) Irwing Fisher b) J. M. Keynes c) Milton Friedman<br />
d) None of the above<br />
4. The structuralist theory of inflation is recognised in the name of ——<br />
a) Myrdal b) Streeten c) Both the ‘a’ and ‘b’ d) None of the above<br />
5. Phillips curve describes the relationship between ——<br />
a) Inflation and Unemployment b) Growth and Poverty<br />
c) Growth and Inequality d) All the above<br />
171
Answers to the Objective Questions :<br />
A) Choose Conectationative1-B, 2-D, 3-C, 4-E, 5-F<br />
B) Answer in one sentence.<br />
1. What is inflation?<br />
2. What is meant by bank rate?<br />
3. What do you mean by business cycles?<br />
4. What is meant by fiscal policy?<br />
8.6 Answers to the Objective Questions<br />
A) Choose Correct alternatives given below<br />
1 – b, 2 – d, 3 – c, 4 – c, 5 – a.<br />
B) Answer in one sentence<br />
1. Inflation is the issue of too much currency.<br />
2. The rate of interest changed by the central bank on the loans extended to<br />
commercial banks.<br />
3. The budget with public revenue excessive than the public expenditure.<br />
4. A fluctuation in aggregate economic activity is a business cycle.<br />
5. The policy of the government regarding taxation, public expenditure, public<br />
debt, deficit financing is fiscal policy.<br />
8.7 (A) Write short notes :<br />
1) Meaning of Inflation.<br />
2) Keynesian theary of Inflation<br />
3) Tobin's Modified Philip's Curve<br />
4) Monetory measures to control trade cycles.<br />
B) Broad Questions.<br />
1. What is inflation? Describe its types, and suggest measures on the<br />
same.<br />
2. Critically examine the classical theory of inflation.<br />
3. Evaluate the Monetarist theory of inflation.<br />
4. Examine the Keynesian theory of inflation.<br />
5. Elucidate the structuralist theory of inflation.<br />
6. Discuss the Phillips curve analysis of inflation.<br />
7. What are business cycles? Describe their phases, and suggest<br />
measures on their control.<br />
172
8. Examine the Samuelson’s theory of business cycles.<br />
9. Discuss the Hicks theory of business cycles.<br />
10. Describe the Goodwin’s model of business cycles.<br />
8.8 References for further study<br />
1. Jhingan, M. L. (1986), <strong>Macro</strong> Economic Theory, Konark Publishers Pvt.<br />
Ltd., Delhi<br />
2. Jhingan, M. L. (1997), Monetary <strong>Economics</strong>, Konark Publishers Pvt.<br />
Ltd., Delhi<br />
3. Mithani, D. M. (1986), Monetary Theory, Vora and Company, Mumbai.<br />
4. Vaish, M. C. (1989), <strong>Macro</strong>economic Theory, Vikas Publishing House,<br />
New Delhi.<br />
5. Vaish, M. C. (2002), Monetary Theory, Ratan Prakashan Mandir, Agra.<br />
6. Ahuja, H. L. (2010), <strong>Macro</strong> <strong>Economics</strong>, S. Chand & Company Ltd., New<br />
Delhi.<br />
7. Jha, R. (1991), Contemporary <strong>Macro</strong> Economic Theory and Policy, Wiley<br />
Eastern Ltd., New Delhi.<br />
8. Shapiro, E. (1996), <strong>Macro</strong> Economic Analysis, Galgotia Publications,<br />
New Delhi.<br />
9. Ackley, G. (1978), <strong>Macro</strong> <strong>Economics</strong> : Theory and Policy, Macmillan,<br />
New York.<br />
● ● ●<br />
173