

Corporate Water Accounting: An Analysis of Methods and Tools for ...
Corporate Water Accounting: An Analysis of Methods and Tools for ...
Corporate Water Accounting: An Analysis of Methods and Tools for ...

Create successful ePaper yourself
Turn your PDF publications into a flip-book with our unique Google optimized e-Paper software.
41<br />
what is asked <strong>of</strong> companies in respect to their<br />
underst<strong>and</strong>ing <strong>of</strong> their interaction with water<br />
resources. For this analysis, perhaps the most<br />
relevant <strong>of</strong> CDP <strong>Water</strong> Disclosure’s requests<br />
are: 1) an in-depth examination <strong>of</strong> waterrelated<br />
business risks <strong>and</strong> 2) an assessment <strong>of</strong><br />
the local context in which companies operate<br />
(e.g. the proportion <strong>of</strong> facilities located<br />
in water-stressed regions). The CDP <strong>Water</strong><br />
Disclosure In<strong>for</strong>mation Request asks that<br />
companies disclose this data <strong>for</strong> their own facilities,<br />
as well as their suppliers. CDP <strong>Water</strong><br />
Disclosure’s new framework underlines the<br />
fact that not only do these types <strong>of</strong> analysis<br />
help drive down water-related impacts <strong>and</strong><br />
risks, but they are also becoming expected<br />
<strong>of</strong> companies by investors, consumers, <strong>and</strong><br />
other key stakeholders.<br />
<strong>Water</strong> Footprinting<br />
WFs are beginning to be used as a reporting/<br />
communication tool, though the appropriateness<br />
<strong>of</strong> this use is questioned by some. These<br />
concerns are based on the notion that generic<br />
<strong>and</strong> aggregated claims (such as 2,500 liters <strong>of</strong><br />
water to produce one cotton shirt or 960 liters<br />
<strong>of</strong> water to produce a liter <strong>of</strong> wine) are inherently<br />
misleading <strong>and</strong>/or meaningless because<br />
they obscure essential in<strong>for</strong>mation regarding<br />
the local context <strong>and</strong> nature <strong>of</strong> the water use,<br />
<strong>and</strong> there<strong>for</strong>e do not reflect impacts or risks.<br />
For this reason, total water footprint calculations<br />
can be very easily misused <strong>and</strong> misconstrued.<br />
For instance, Raisio, a Finnish food<br />
company, has produced a water “ecolabel” <strong>for</strong><br />
its products that essentially uses a product’s<br />
total water consumption as the basis <strong>for</strong><br />
its scores. Such scores do not speak to the<br />
source <strong>of</strong> that water (i.e. blue or green) or the<br />
conditions <strong>of</strong> the watershed from which it<br />
was taken <strong>and</strong> thus have little value in terms<br />
<strong>of</strong> assessing the sustainability <strong>of</strong> a product’s<br />
water use. That said, more detailed reporting<br />
<strong>of</strong> WF studies has served to help companies<br />
be accountable to (<strong>and</strong> receive feedback from)<br />
key stakeholders, as well as help build a good<br />
reputation relating to water transparency <strong>and</strong><br />
responsible water practices. More generally,<br />
proponents have also identified WF as an<br />
effective awareness-raising tool <strong>for</strong> business,<br />
consumers, <strong>and</strong> policy makers on water issues<br />
worldwide.<br />
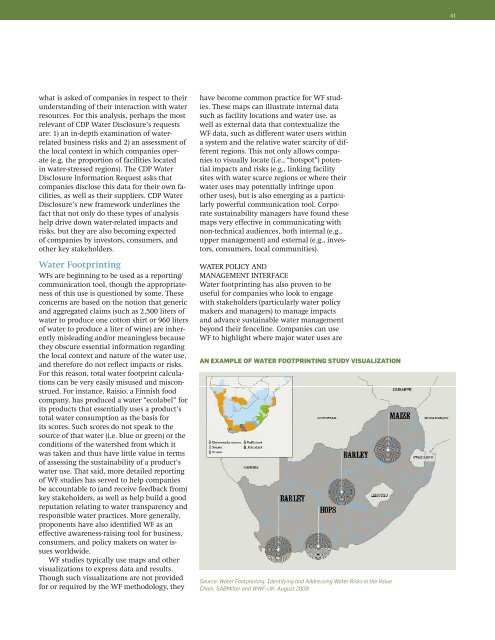
WF studies typically use maps <strong>and</strong> other<br />
visualizations to express data <strong>and</strong> results.<br />
Though such visualizations are not provided<br />
<strong>for</strong> or required by the WF methodology, they<br />
have become common practice <strong>for</strong> WF studies.<br />
These maps can illustrate internal data<br />
such as facility locations <strong>and</strong> water use, as<br />
well as external data that contextualize the<br />
WF data, such as different water users within<br />
a system <strong>and</strong> the relative water scarcity <strong>of</strong> different<br />
regions. This not only allows companies<br />
to visually locate (i.e., “hotspot”) potential<br />
impacts <strong>and</strong> risks (e.g., linking facility<br />
sites with water scarce regions or where their<br />
water uses may potentially infringe upon<br />
other uses), but is also emerging as a particularly<br />
powerful communication tool. <strong>Corporate</strong><br />
sustainability managers have found these<br />
maps very effective in communicating with<br />
non-technical audiences, both internal (e.g.,<br />
upper management) <strong>and</strong> external (e.g., investors,<br />
consumers, local communities).<br />
<strong>Water</strong> policy <strong>and</strong><br />
management interface<br />
<strong>Water</strong> footprinting has also proven to be<br />
useful <strong>for</strong> companies who look to engage<br />
with stakeholders (particularly water policy<br />
makers <strong>and</strong> managers) to manage impacts<br />
<strong>and</strong> advance sustainable water management<br />
beyond their fenceline. Companies can use<br />
WF to highlight where major water uses are<br />
<strong>An</strong> example <strong>of</strong> water footprinting study visualization<br />
Source: <strong>Water</strong> Footprinting: Identifying <strong>and</strong> Addressing <strong>Water</strong> Risks in the Value<br />
Chain. SABMiller <strong>and</strong> WWF-UK. August 2009.


