High Levels of Gene Flow in Bur Oak Revealed by Paternity ...
High Levels of Gene Flow in Bur Oak Revealed by Paternity ...
High Levels of Gene Flow in Bur Oak Revealed by Paternity ...

Create successful ePaper yourself
Turn your PDF publications into a flip-book with our unique Google optimized e-Paper software.
<strong>High</strong> <strong>Levels</strong> <strong>of</strong> <strong>Gene</strong> <strong>Flow</strong> <strong>in</strong> <strong>Bur</strong> <strong>Oak</strong><br />
<strong>Revealed</strong> <strong>by</strong> <strong>Paternity</strong> Analysis Us<strong>in</strong>g<br />
Microsatellites<br />
B. D. Dow and M. V. Ashley<br />
Microsatellite analysis was used to characterize pollen dispersal <strong>in</strong> a stand <strong>of</strong> 62<br />
adult bur oaks (Quercus macrocarpa) <strong>in</strong> northern Ill<strong>in</strong>ois. Us<strong>in</strong>g PCR amplification<br />
<strong>of</strong> four d<strong>in</strong>ucleotide microsatellite loci, pollen donors <strong>of</strong> 282 acorns collected from<br />
three adult trees located <strong>in</strong> different parts <strong>of</strong> the stand were determ<strong>in</strong>ed <strong>by</strong> exclusion.<br />
Overall at least 57% <strong>of</strong> the acorns were poll<strong>in</strong>ated <strong>by</strong> trees outside <strong>of</strong> the<br />
stand, because all adult trees <strong>in</strong> the stand were excluded from paternity. Average<br />
poll<strong>in</strong>ation distance for with<strong>in</strong>-stand poll<strong>in</strong>ations was 75 m, and pollen donors for<br />
two <strong>of</strong> the three maternal trees were randomly dispersed throughout the stand.<br />
These two trees also received more pollen from 50 m away than from near neighbors.<br />
Self-poll<strong>in</strong>ation was rare or nonexistent. This study provides direct evidence<br />
for high levels <strong>of</strong> long-distance poll<strong>in</strong>ation <strong>in</strong> a w<strong>in</strong>d-poll<strong>in</strong>ated species, and contradicts<br />
traditional models <strong>of</strong> w<strong>in</strong>d poll<strong>in</strong>ation which suggest that clouds <strong>of</strong> pollen<br />
dissipate from the source to <strong>in</strong>effectively low densities over short distances. Instead,<br />
the mat<strong>in</strong>g system <strong>of</strong> bur oak seems to be extraord<strong>in</strong>arily efficient at produc<strong>in</strong>g<br />
highly outbred <strong>in</strong>dividuals and ensur<strong>in</strong>g long-range pollen flow, perhaps<br />
through pollen competition or mate choice favor<strong>in</strong>g distant pollen sources.<br />
From the Department <strong>of</strong> Biological Sciences (M/C 066),<br />
University <strong>of</strong> Ill<strong>in</strong>ois at Chicago, 845 West Taylor Street,<br />
Chicago, Ill<strong>in</strong>ois 60607-7060. This work was completed<br />
<strong>in</strong> partial fulfillment <strong>of</strong> the requirements for the doctoral<br />
degree (to B.D.D.) at the Graduate College <strong>of</strong> the<br />
University <strong>of</strong> Ill<strong>in</strong>ois at Chicago. B.D. Dow is currently<br />
at the Department <strong>of</strong> Biology, Buffalo State College, Buffalo,<br />
New York.<br />
Journal <strong>of</strong> Heredity 1998;89:62–70; 0022-1503/98/$5.00<br />
The genetic structure <strong>of</strong> plant populations<br />
is determ<strong>in</strong>ed <strong>in</strong> large part <strong>by</strong> the movement<br />
<strong>of</strong> genes via pollen and seed dispersal.<br />
Because plants are stationary as<br />
adults, the location <strong>of</strong> an <strong>in</strong>dividual plant<br />
relative to conspecifics may <strong>in</strong>fluence the<br />
number <strong>of</strong> mates a plant has, the relatedness<br />
<strong>of</strong> mates, and relative fitness through<br />
male and female function. Pollen dispersal<br />
is probably the most important component<br />
<strong>of</strong> gene flow <strong>in</strong> temperate deciduous<br />
trees with large, relatively immobile seeds.<br />
Most <strong>of</strong> these trees (e.g., oak, hickory, and<br />
walnut) have w<strong>in</strong>d-dispersed pollen.<br />
Poll<strong>in</strong>ation can be studied <strong>by</strong> follow<strong>in</strong>g<br />
the physical movement <strong>of</strong> pollen us<strong>in</strong>g<br />
traps (Greenwood 1986), dyes (L<strong>in</strong>hart et<br />
al. 1987), or the movement <strong>of</strong> poll<strong>in</strong>ators<br />
(Lev<strong>in</strong> and Kerster 1969; Mosqu<strong>in</strong> 1971).<br />
Models <strong>of</strong> pollen movement generally predict<br />
that pollen densities will decl<strong>in</strong>e rapidly<br />
from the source, and most fertilizations<br />
will be effected from near<strong>by</strong> trees<br />
(Faegri and van der Pijl 1979; Lev<strong>in</strong> and<br />
Kerster 1974; Whitehead 1983). More recently,<br />
pollen traps used to measure pollen<br />
densities from many trees have revealed<br />
much higher pollen densities than<br />
would be predicted based upon dispersal<br />
from a po<strong>in</strong>t source (Caron and Leblanc<br />
1992) and higher levels <strong>of</strong> gene flow than<br />
earlier, s<strong>in</strong>gle-source models (Adams<br />
1992).<br />
Such studies <strong>of</strong> pollen movement may<br />
not, however, accurately reflect actual fertilization<br />
and gene flow among local populations.<br />
Allozyme studies <strong>of</strong> <strong>in</strong>sect-poll<strong>in</strong>ated<br />
plants have shown that gene flow is<br />
usually more extensive than observed poll<strong>in</strong>ator<br />
movement (Campbell 1991; Fenster<br />
1991; Schaal 1980). Among w<strong>in</strong>d-poll<strong>in</strong>ated<br />
conifers, gene flow appears to be sufficient<br />
to prevent differentiation (Epperson and<br />
Allard 1989; Gov<strong>in</strong>daraju 1989; Hamrick et<br />
al. 1979, 1995; Loveless and Hamrick<br />
1984). Fewer allozyme studies have been<br />
conducted on deciduous w<strong>in</strong>d-poll<strong>in</strong>ated<br />
trees, but population differentiation is<br />
usually absent <strong>in</strong> these species as well<br />
(Berg and Hamrick 1995; Geburek and<br />
Tripp-Knowles 1994; Sherman-Broyles et<br />
al. 1992). However, allozyme studies generally<br />
lack the resolution necessary to accurately<br />
estimate levels <strong>of</strong> gene flow exceed<strong>in</strong>g<br />
that needed to simply prevent<br />
population differentiation, which may be<br />
accomplished <strong>by</strong> only one or two migrants<br />
per generation (Wright 1931). Furthermore,<br />
it is difficult to use allozyme patterns<br />
to partition gene flow <strong>in</strong>to that effected<br />
through pollen movement versus<br />
that effected <strong>by</strong> seed dispersal.<br />
62
Here we report the application <strong>of</strong> a new<br />
type <strong>of</strong> genetic marker, polymorphic microsatellite<br />
DNA, for paternity analysis<br />
and poll<strong>in</strong>ation studies. Microsatellites are<br />
short, tandemly repeated simple sequences,<br />
1–6 bp <strong>in</strong> length, which are highly polymorphic<br />
for repeat number (Ashley and<br />
Dow 1994). Amplification <strong>of</strong> the microsatellite<br />
region <strong>by</strong> polymerase cha<strong>in</strong> reaction<br />
(PCR) results <strong>in</strong> fully penetrant, Mendelian<br />
<strong>in</strong>herited, codom<strong>in</strong>ant markers<br />
than can be precisely identified <strong>by</strong> length.<br />
Unlike allozyme loci, which do not have<br />
sufficient variability to determ<strong>in</strong>e parentage<br />
<strong>by</strong> exclusion (Chakraborty et al. 1988),<br />
each microsatellite locus has many relatively<br />
rare alleles, and <strong>in</strong> most cases all<br />
but one adult or all adults <strong>in</strong> the local population<br />
can be excluded from paternity us<strong>in</strong>g<br />
a few loci (Dow and Ashley 1996; Dow<br />
et al. 1995). Movement <strong>of</strong> successful pollen<br />
can then be traced <strong>by</strong> exam<strong>in</strong><strong>in</strong>g the<br />
relative locations <strong>of</strong> identified maternal<br />
and paternal trees, and gene flow from pollen<br />
can be estimated from the proportion<br />
<strong>of</strong> poll<strong>in</strong>ations <strong>in</strong> which all trees <strong>in</strong> a stand<br />
are excluded from paternity.<br />
The only assumptions required for microsatellite<br />
paternity analysis are that<br />
there are no mutations between parents<br />
and <strong>of</strong>fspr<strong>in</strong>g and that adults and <strong>of</strong>fspr<strong>in</strong>g<br />
with match<strong>in</strong>g genotypes are related. The<br />
mutation rate <strong>of</strong> microsatellite sequences<br />
has been estimated at 10 4 to 10 5 mutations<br />
per locus per generation (Edwards<br />
et al. 1992; Ellegren 1992; Schlötterer and<br />
Tautz 1992), which is low enough that the<br />
probability <strong>of</strong> a mutation between parents<br />
and <strong>of</strong>fspr<strong>in</strong>g is negligible. The probability<br />
<strong>of</strong> cryptic gene flow (an adult with<strong>in</strong> the<br />
stand match<strong>in</strong>g an acorn <strong>by</strong> chance when<br />
the acorn was actually fertilized <strong>by</strong> pollen<br />
from outside the stand) can be easily calculated<br />
based on allele frequencies (Westneat<br />
and Webster 1994).<br />
We apply microsatellite analysis to characterize<br />
successful pollen donors <strong>of</strong> <strong>in</strong>dividual<br />
seed parents. All adults <strong>in</strong> a stand<br />
<strong>of</strong> bur oaks (Quercus macrocarpa) <strong>in</strong> northern<br />
Ill<strong>in</strong>ois were genotyped at four variable<br />
microsatellite loci, and <strong>of</strong>fspr<strong>in</strong>g<br />
(acorns) <strong>of</strong> trees located <strong>in</strong> different parts<br />
<strong>of</strong> the stand were scored at these loci as<br />
well. The objectives <strong>of</strong> this study were to<br />
(1) evaluate the utility <strong>of</strong> microsatellite<br />
analysis for study<strong>in</strong>g paternity and successful<br />
poll<strong>in</strong>ation; (2) assess the amount<br />
<strong>of</strong> long-distance gene flow <strong>by</strong> determ<strong>in</strong><strong>in</strong>g<br />
the proportion <strong>of</strong> fertilizations effected <strong>by</strong><br />
trees not <strong>in</strong> the stand; (3) characterize the<br />
spatial patterns <strong>of</strong> pollen movement for<br />
fertilization occurr<strong>in</strong>g between paternal<br />
and maternal trees with<strong>in</strong> the stand; and<br />
(4) determ<strong>in</strong>e the rate <strong>of</strong> self-poll<strong>in</strong>ation <strong>in</strong><br />
bur oak.<br />
Materials and Methods<br />
Study Site and Species<br />
The study site is part <strong>of</strong> an abandoned<br />
farm located <strong>in</strong> McHenry County near Harvard,<br />
Ill<strong>in</strong>ois, which was released from agriculture<br />
approximately 20 years ago. The<br />
stand occupies an area approximately 200<br />
m 250 m and consists <strong>of</strong> 62 mature bur<br />
oaks (Q. macrocarpa Michx.) and 16 red<br />
oaks (Q. rubra L.), and likely represents a<br />
fragment <strong>of</strong> presettlement oak savanna. All<br />
adults trees were mapped us<strong>in</strong>g angle and<br />
distance.<br />
Q. macrocarpa is a monoecious, dicogamous,<br />
deciduous tree. On a s<strong>in</strong>gle tree,<br />
male flowers mature and release pollen before<br />
female flowers become receptive to<br />
pollen. Q. macrocarpa is known to hybridize<br />
with Q. alba and Q. muhlenbergii, but<br />
is not known to hybridize with Q. rubra<br />
(Jones 1963). <strong>Oak</strong>s are mast<strong>in</strong>g species,<br />
produc<strong>in</strong>g variable crops <strong>of</strong> acorns <strong>in</strong> different<br />
years. Every tree produced pollen<br />
every year <strong>in</strong> the 3 years that observations<br />
were made. Acorn production varied<br />
among <strong>in</strong>dividual trees. A few trees produced<br />
large crops <strong>of</strong> acorns every year,<br />
but most trees had no observable acorn<br />
production <strong>in</strong> at least 1 year. A coord<strong>in</strong>ated<br />
reproductive effort among all trees was<br />
not observed.<br />
Sample Collection and Microsatellite<br />
Amplification<br />
In early May 1992 and 1994, young leaves<br />
(0.5–2.0 cm long) from each <strong>of</strong> 62 adult<br />
bur oaks at the study site were collected<br />
just after bud break, when tann<strong>in</strong> content<br />
is lowest (Feeny 1970), quick frozen and<br />
stored at 70C. Because our purpose was<br />
to develop a detailed understand<strong>in</strong>g <strong>of</strong><br />
pollen sources used <strong>by</strong> <strong>in</strong>dividual trees,<br />
our sampl<strong>in</strong>g strategy was to exam<strong>in</strong>e as<br />
many acorns as possible from each <strong>of</strong> a<br />
few trees located <strong>in</strong> different parts <strong>of</strong> the<br />
stand. This strategy was expected to reveal<br />
any directional bias <strong>in</strong> poll<strong>in</strong>ation<br />
(e.g., fewer with<strong>in</strong>-stand pollen donors on<br />
the upw<strong>in</strong>d side <strong>of</strong> the stand), distribution<br />
<strong>of</strong> pollen donors around the seed parents<br />
and fertilizations from outside <strong>of</strong> the<br />
stand, which we assumed would be rare.<br />
Acorns were collected from 11 trees, with<br />
the largest crops <strong>in</strong> late August and early<br />
September 1992. Equal numbers <strong>of</strong> acorns<br />
were collected from all sides <strong>of</strong> the tree.<br />
Sound acorns were separated from <strong>in</strong>sect-<strong>in</strong>fested<br />
acorns <strong>by</strong> flotation, stratified<br />
<strong>in</strong> damp sand at 4C for 2–3 months (USDA<br />
1974), and grown <strong>in</strong> a greenhouse. Three<br />
groups <strong>of</strong> half-sibs were found suitable for<br />
this study based on a sample size <strong>of</strong> 96<br />
surviv<strong>in</strong>g seedl<strong>in</strong>gs and location <strong>of</strong> maternal<br />
tree. One maternal tree was located on<br />
the east side (tree 3E), one was <strong>in</strong> the middle<br />
(tree 17M), and one was on the west<br />
side (tree 33W) <strong>of</strong> the stand. Germ<strong>in</strong>ation<br />
rates <strong>of</strong> acorns from these trees were 92%,<br />
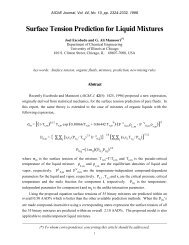
98%, and 95%, respectively. All <strong>of</strong> these<br />
trees were at least 100 m from any tree<br />
outside <strong>of</strong> the stand to the north and<br />
southeast, and greater than 300 m from<br />
conspecifics <strong>in</strong> any other direction (Figure<br />
1). Fully expanded leaves <strong>of</strong> seedl<strong>in</strong>gs<br />
were quick frozen and stored as above.<br />
DNA was extracted from frozen leaves <strong>of</strong><br />
adults and seedl<strong>in</strong>gs us<strong>in</strong>g previously published<br />
protocols (Dow et al. 1995). Amplification<br />
<strong>of</strong> microsatellite loci was performed<br />
us<strong>in</strong>g four primer pairs (MSQ3,<br />
MSQ4, MSQ13, and MSQ16), and genotypes<br />
were scored <strong>by</strong> PCR product length<br />
at each locus as described previously<br />
(Dow and Ashley 1996; Dow et al. 1995).<br />
Differences <strong>in</strong> allele frequencies between<br />
adults and acorns was tested <strong>by</strong> us<strong>in</strong>g<br />
the Kolmogorov–Smirnov test as <strong>in</strong><br />
Mor<strong>in</strong> et al. (1994). The Kolmogorov–Smirnov<br />
test is a nonparametric test <strong>in</strong> which<br />
frequency distributions are arranged cumulatively,<br />
then compared between two<br />
groups. The largest difference <strong>in</strong> cumulative<br />
frequency distribution is the test statistic<br />
D, which has associated critical values<br />
(Ebdon 1985).<br />
Assignment <strong>of</strong> Parentage<br />
Because Mendelian <strong>in</strong>heritance had been<br />
previously established for the microsatellite<br />
loci (Dow et al. 1995), each acorn was<br />
expected to have two alleles per locus for<br />
four loci, one allele derived from each <strong>of</strong><br />
that <strong>in</strong>dividual’s parents. The four loci<br />
used as markers were not l<strong>in</strong>ked. To<br />
match the acorn paternal alleles with the<br />
putative pollen donor, all possible gametes<br />
for each adult (maximum for complete<br />
heterozygosity 2 4 16) and the<br />
paternal alleles <strong>of</strong> each acorn were entered<br />
<strong>in</strong>to a database. If an <strong>of</strong>fspr<strong>in</strong>g<br />
matched both maternal alleles at a locus,<br />
mak<strong>in</strong>g it impossible to dist<strong>in</strong>guish which<br />
allele had come from the pollen donor,<br />
both alleles were entered <strong>in</strong>to the database<br />
with all comb<strong>in</strong>ations <strong>of</strong> its other alleles.<br />
Alleles were grouped at each locus<br />
<strong>in</strong> turn us<strong>in</strong>g the ‘‘sort’’ function <strong>of</strong> the database,<br />
which resulted <strong>in</strong> the match<strong>in</strong>g <strong>of</strong><br />
like genotypes over all four loci. If the pa-<br />
Dow and Ashley • <strong>Bur</strong> <strong>Oak</strong> <strong>Gene</strong> <strong>Flow</strong> 63
Spatial Analysis<br />
In order to test whether pollen donors<br />
were clustered around the seed parent, we<br />
tested the relationship between distance<br />
and poll<strong>in</strong>ation success <strong>in</strong> four ways. First,<br />
to test the relative poll<strong>in</strong>ation success <strong>of</strong><br />
neighbors, a chi-square test for association<br />
was used to test if numbers <strong>of</strong> near<br />
(50 m) and far (50 m) poll<strong>in</strong>ations varied<br />
among trees. Second, Kruskal–Wallis H<br />
tests were used to compare the poll<strong>in</strong>ation<br />
distances <strong>of</strong> each tree to its pollen donors.<br />
This test is a nonparametric method<br />
<strong>of</strong> determ<strong>in</strong><strong>in</strong>g if the three trees had different<br />
overall distances to pollen donors.<br />
Third, to exam<strong>in</strong>e differential poll<strong>in</strong>ation<br />
success at all distances for all pollen donors,<br />
Spearman rank correlation coefficients<br />
were determ<strong>in</strong>ed for the number <strong>of</strong><br />
acorns fertilized <strong>by</strong> each pollen donor (0–<br />
9) and the distance <strong>of</strong> each pollen donor<br />
from the maternal tree. Fourth, jo<strong>in</strong>-count<br />
spatial autocorrelation (sampl<strong>in</strong>g without<br />
replacement) was used to determ<strong>in</strong>e if<br />
pollen donors were clustered around the<br />
maternal tree. Jo<strong>in</strong>-count spatial autocorrelation<br />
does not rely on absolute location<br />
<strong>of</strong> <strong>in</strong>dividuals but relative location <strong>of</strong><br />
neighbors, and is therefore an appropriate<br />
test <strong>of</strong> random dispersion <strong>of</strong> values over<br />
an exist<strong>in</strong>g set <strong>of</strong> po<strong>in</strong>ts, such as location<br />
<strong>of</strong> a tree fixed <strong>in</strong> a stand (Sakai and Oden<br />
1983; Sokal and Oden 1978). Us<strong>in</strong>g a map<br />
<strong>of</strong> the trees <strong>in</strong> the stand, a jo<strong>in</strong>-count network<br />
was made <strong>by</strong> jo<strong>in</strong><strong>in</strong>g each tree to adjacent<br />
trees up to 50 m away, and the analysis<br />
performed as described <strong>by</strong> Ebdon<br />
(1985).<br />
Figure 1. Map <strong>of</strong> study site and surround<strong>in</strong>g stands <strong>of</strong> trees. Straight l<strong>in</strong>es <strong>in</strong>dicate property boundaries. <strong>Bur</strong><br />
oak Q. macrocarpa; red oak Q. rubra; white oak Q. alba.<br />
ternal parent <strong>of</strong> an <strong>of</strong>fspr<strong>in</strong>g was <strong>in</strong> the<br />
stand, it could be identified. In paternity<br />
analysis, there is a chance that two <strong>in</strong>dividuals<br />
share the same genotype <strong>by</strong><br />
chance rather than because they are related.<br />
If a tree with<strong>in</strong> the stand matches an<br />
acorn <strong>by</strong> chance when <strong>in</strong> fact that acorn<br />
was fertilized <strong>by</strong> pollen from outside the<br />
stand, this gene flow event will be undetected,<br />
or ‘‘cryptic’’ (Broyles et al. 1994).<br />
The probability that an adult matched an<br />
unrelated <strong>of</strong>fspr<strong>in</strong>g was calculated follow<strong>in</strong>g<br />
Westneat and Webster (1994). This calculation<br />
has been completely described<br />
elsewhere (Dow and Ashley 1996). The<br />
probability <strong>of</strong> cryptic gene flow was calculated<br />
for each parent-<strong>of</strong>fspr<strong>in</strong>g match.<br />
The sum <strong>of</strong> these probabilities represents<br />
the probable number <strong>of</strong> cryptic gene flow<br />
events among all the acorns <strong>of</strong> a particular<br />
tree. Six <strong>of</strong>fspr<strong>in</strong>g (four from tree 3E and<br />
two from tree 17M) were excluded from all<br />
analyses because PCR amplification was<br />
unsuccessful at one locus.<br />
Results<br />
Null Alleles<br />
Anomalies appeared <strong>in</strong> the <strong>of</strong>fspr<strong>in</strong>g <strong>of</strong><br />
tree 3E at the MSQ3 locus which suggested<br />
the presence <strong>of</strong> a null allele. The existence<br />
<strong>of</strong> null alleles at low frequency is not<br />
unexpected because substitutions or deletions<br />
<strong>in</strong> the flank<strong>in</strong>g region may prevent<br />
b<strong>in</strong>d<strong>in</strong>g <strong>of</strong> PCR primers or <strong>in</strong>terfere with<br />
primer extension (Callen et al. 1993; Paetkau<br />
and Strobeck 1995; Pemberton et al.<br />
1995). Although the <strong>of</strong>fspr<strong>in</strong>g <strong>of</strong> tree 3E all<br />
shared at least one band with the maternal<br />
tree at the other three loci, 49 <strong>of</strong> 93<br />
<strong>of</strong>fspr<strong>in</strong>g did not share a maternal band at<br />
MSQ3. Tree 3E, be<strong>in</strong>g heterozygous for an<br />
amplified allele and a null allele, would<br />
transmit the null allele to about half its <strong>of</strong>fspr<strong>in</strong>g,<br />
and a small proportion <strong>of</strong> these, receiv<strong>in</strong>g<br />
a second null allele from a pollen<br />
donor, would appear to have no microsatellite<br />
bands. All amplifications produced<br />
artifact bands that were longer than the<br />
target microsatellite region, and the presence<br />
<strong>of</strong> these artifact bands <strong>in</strong> <strong>in</strong>dividuals<br />
that were homozygous for the null allele<br />
ruled out the possibility that the PCR had<br />
failed.<br />
Another null allele was suspected at the<br />
MSQ4 locus when a statistically significant<br />
excess <strong>of</strong> homozygotes was found among<br />
64 The Journal <strong>of</strong> Heredity 1998:89(1)
the adults and <strong>in</strong> all groups <strong>of</strong> <strong>of</strong>fspr<strong>in</strong>g.<br />
The presence <strong>of</strong> this allele was confirmed<br />
<strong>by</strong> extract<strong>in</strong>g and amplify<strong>in</strong>g DNA from 16<br />
<strong>of</strong>fspr<strong>in</strong>g <strong>of</strong> tree 14, an apparent homozygote.<br />
Eight <strong>of</strong> the <strong>of</strong>fspr<strong>in</strong>g shared a band<br />
with the maternal tree; eight did not.<br />
Among the adults, there were 17 trees that<br />
were either homozygous for an amplified<br />
allele or heterozygous for the null allele at<br />
locus MSQ3; there were 14 such trees at<br />
locus MSQ4. For the purposes <strong>of</strong> match<strong>in</strong>g<br />
parents to <strong>of</strong>fspr<strong>in</strong>g, all apparently homozygous<br />
<strong>in</strong>dividuals were considered heterozygous<br />
for the null allele. This method<br />
will overestimate the number <strong>of</strong> matches<br />
with<strong>in</strong> the stand but will not exclude any<br />
true parents. Because there was allele <strong>in</strong>formation<br />
at the other loci, the number <strong>of</strong><br />
<strong>of</strong>fspr<strong>in</strong>g matches that <strong>in</strong>cluded <strong>in</strong>ferred<br />
null alleles was low. To estimate allele frequencies,<br />
parents that matched any <strong>of</strong>fspr<strong>in</strong>g<br />
for a null allele were considered<br />
heterozygous and those that did not<br />
match any <strong>of</strong>fspr<strong>in</strong>g for a null allele were<br />
assumed to be true homozygotes.<br />
Allele Frequencies<br />
The total number <strong>of</strong> alleles at each locus<br />
ranged from 14 to 24 (Table 1). At all loci,<br />
a few alleles were found among <strong>of</strong>fspr<strong>in</strong>g<br />
genotypes that were not present <strong>in</strong> the<br />
adults. Heterozygosities ranged from 0.70<br />
to 0.95. The lowest heterozygosities were<br />
generally found among the acorns <strong>of</strong> 33W.<br />
A large majority <strong>of</strong> alleles occurred at frequencies<br />
<strong>of</strong> less than 0.10, and there were<br />
only 6 alleles (<strong>of</strong> 83 total) that had frequencies<br />
higher than 0.20.<br />
Kolmogorov–Smirnov tests were used to<br />
compare the frequencies <strong>of</strong> paternal alleles<br />
<strong>of</strong> each group <strong>of</strong> <strong>of</strong>fspr<strong>in</strong>g to that <strong>of</strong><br />
the parent population. These comparisons<br />
showed no significant differences for either<br />
MSQ3 or MSQ13. These results <strong>in</strong>dicate<br />
that the paternal contribution to the<br />
<strong>of</strong>fspr<strong>in</strong>g at these loci is <strong>in</strong>dist<strong>in</strong>guishable<br />
from a random sample <strong>of</strong> all the variation<br />
present <strong>in</strong> the local adult population.<br />
There were no significant differences for<br />
any locus <strong>in</strong> the <strong>of</strong>fspr<strong>in</strong>g <strong>of</strong> tree 33W. The<br />
<strong>of</strong>fspr<strong>in</strong>g <strong>of</strong> tree 17M had allele frequencies<br />
that differed significantly from the<br />
parent population at loci MSQ4 and<br />
MSQ16, and the <strong>of</strong>fspr<strong>in</strong>g <strong>of</strong> tree 3E differed<br />
significantly at locus MSQ4. Differences<br />
<strong>in</strong> allele frequencies <strong>in</strong>dicate that a<br />
disproportionate number <strong>of</strong> fertilizations<br />
are com<strong>in</strong>g from either a few trees with<strong>in</strong><br />
or from outside <strong>of</strong> the stand. These two<br />
alternatives will be considered <strong>in</strong> more detail<br />
follow<strong>in</strong>g presentation <strong>of</strong> the paternity<br />
analysis.<br />
Table 1. Frequency <strong>of</strong> alleles and heterozygosity<br />
at four microsatellite loci <strong>of</strong> 62 adults and<br />
<strong>of</strong>fspr<strong>in</strong>g from three trees<br />
Locus/allele<br />
MSQ3<br />
191<br />
193<br />
195<br />
196<br />
197<br />
199<br />
201<br />
203<br />
205<br />
207<br />
208<br />
209<br />
211<br />
212<br />
213<br />
215<br />
217<br />
219<br />
221<br />
223<br />
225<br />
227<br />
229<br />
231<br />
Null<br />
Heterozygosity<br />
MSQ4<br />
201<br />
202<br />
203<br />
204<br />
205<br />
206<br />
207<br />
208<br />
209<br />
211<br />
212<br />
213<br />
215<br />
216<br />
217<br />
219<br />
221<br />
223<br />
225<br />
227<br />
229<br />
Null<br />
Heterozygosity<br />
MSQ13<br />
202<br />
222<br />
224<br />
226<br />
228<br />
230<br />
232<br />
234<br />
236<br />
238<br />
240<br />
242<br />
244<br />
246<br />
Heterozygosity<br />
MSQ16<br />
178<br />
180<br />
181<br />
182<br />
183<br />
185<br />
186<br />
187<br />
188<br />
Adults<br />
0.016<br />
0<br />
0.008<br />
0.008<br />
0<br />
0.008<br />
0.016<br />
0.065<br />
0<br />
0.081<br />
0<br />
0.056<br />
0.056<br />
0<br />
0.056<br />
0.137<br />
0.032<br />
0.113<br />
0.081<br />
0.032<br />
0.040<br />
0.016<br />
0.056<br />
0.024<br />
0.097<br />
0.90<br />
0<br />
0.008<br />
0.121<br />
0.161<br />
0.121<br />
0.032<br />
0.073<br />
0<br />
0.056<br />
0.024<br />
0.008<br />
0.048<br />
0.065<br />
0.008<br />
0.065<br />
0.048<br />
0.065<br />
0.008<br />
0.008<br />
0.008<br />
0<br />
0.073<br />
0.90<br />
0<br />
0.008<br />
0.008<br />
0.016<br />
0.065<br />
0<br />
0.234<br />
0.242<br />
0.129<br />
0.089<br />
0.056<br />
0.097<br />
0.032<br />
0.024<br />
0.74<br />
0<br />
0.008<br />
0<br />
0.016<br />
0.024<br />
0.242<br />
0<br />
0.081<br />
0<br />
3E<br />
acorns<br />
0<br />
0<br />
0.011<br />
0<br />
0<br />
0<br />
0.011<br />
0.043<br />
0<br />
0.161<br />
0<br />
0.086<br />
0.075<br />
0<br />
0.011<br />
0.086<br />
0.054<br />
0.108<br />
0.043<br />
0.075<br />
0.043<br />
0.032<br />
0.032<br />
0.065<br />
0.065<br />
0.95<br />
0.010<br />
0.010<br />
0.156<br />
0.177<br />
0.062<br />
0.042<br />
0.115<br />
0<br />
0.104<br />
0.073<br />
0<br />
0.042<br />
0.073<br />
0<br />
0.062<br />
0.042<br />
0.010<br />
0<br />
0.010<br />
0<br />
0<br />
0.010<br />
0.93<br />
0<br />
0<br />
0<br />
0.042<br />
0.052<br />
0<br />
0.219<br />
0.229<br />
0.167<br />
0.031<br />
0.115<br />
0.042<br />
0.073<br />
0.031<br />
0.95<br />
0.011<br />
0<br />
0<br />
0.032<br />
0<br />
0.221<br />
0<br />
0.074<br />
0<br />
17M<br />
acorns<br />
0<br />
0.011<br />
0.011<br />
0<br />
0<br />
0<br />
0.011<br />
0.064<br />
0<br />
0.064<br />
0<br />
0.085<br />
0.160<br />
0<br />
0.021<br />
0.170<br />
0.021<br />
0.128<br />
0.043<br />
0.053<br />
0.011<br />
0.085<br />
0.021<br />
0.032<br />
0.011<br />
0.86<br />
0<br />
0.073<br />
0.135<br />
0.083<br />
0.031<br />
0.010<br />
0.083<br />
0.021<br />
0.021<br />
0.042<br />
0<br />
0.031<br />
0.062<br />
0<br />
0.042<br />
0.021<br />
0.052<br />
0.021<br />
0.146<br />
0<br />
0.010<br />
0.115<br />
0.81<br />
0.010<br />
0.010<br />
0<br />
0<br />
0.052<br />
0.021<br />
0.250<br />
0.125<br />
0.219<br />
0.125<br />
0.042<br />
0.104<br />
0.010<br />
0.031<br />
0.92<br />
0<br />
0<br />
0.010<br />
0.010<br />
0.052<br />
0.188<br />
0.031<br />
0.094<br />
0.010<br />
33W<br />
acorns<br />
0<br />
0<br />
0.021<br />
0<br />
0.010<br />
0<br />
0.010<br />
0.021<br />
0.010<br />
0.062<br />
0.010<br />
0.042<br />
0.083<br />
0.010<br />
0.177<br />
0.094<br />
0.042<br />
0.104<br />
0.146<br />
0.010<br />
0.052<br />
0.031<br />
0<br />
0.010<br />
0.052<br />
0.81<br />
0<br />
0.010<br />
0.125<br />
0.260<br />
0.021<br />
0.062<br />
0.052<br />
0.052<br />
0.010<br />
0.042<br />
0<br />
0.042<br />
0.042<br />
0<br />
0.010<br />
0.010<br />
0.208<br />
0.010<br />
0<br />
0<br />
0<br />
0.042<br />
0.78<br />
0<br />
0<br />
0<br />
0.052<br />
0<br />
0.042<br />
0.167<br />
0.302<br />
0.208<br />
0.083<br />
0.073<br />
0.052<br />
0.010<br />
0.010<br />
0.70<br />
0.010<br />
0.010<br />
0<br />
0.010<br />
0.010<br />
0.229<br />
0.021<br />
0.115<br />
0<br />
Table 1.<br />
Locus/allele<br />
Cont<strong>in</strong>ued<br />
189<br />
191<br />
193<br />
195<br />
197<br />
199<br />
201<br />
203<br />
205<br />
207<br />
209<br />
219<br />
221<br />
Heterozygosity<br />
Adults<br />
0.145<br />
0.145<br />
0.065<br />
0.073<br />
0.048<br />
0.056<br />
0.032<br />
0.024<br />
0.008<br />
0.016<br />
0.016<br />
0<br />
0<br />
0.82<br />
3E<br />
acorns<br />
0.211<br />
0.084<br />
0.074<br />
0.053<br />
0.011<br />
0.032<br />
0.032<br />
0.084<br />
0.053<br />
0<br />
0.021<br />
0.011<br />
0<br />
0.81<br />
17M<br />
acorns<br />
0.260<br />
0.073<br />
0.042<br />
0.052<br />
0.073<br />
0.042<br />
0<br />
0<br />
0.031<br />
0<br />
0.021<br />
0<br />
0.010<br />
0.92<br />
33W<br />
acorns<br />
0.135<br />
0.167<br />
0.104<br />
0.031<br />
0.031<br />
0<br />
0.021<br />
0.031<br />
0.021<br />
0.031<br />
0.021<br />
0<br />
0<br />
0.89<br />
Alleles are named <strong>by</strong> base pair length <strong>of</strong> PCR product.<br />
Frequencies <strong>of</strong> <strong>of</strong>fspr<strong>in</strong>g alleles <strong>in</strong>clude only the paternal<br />
contribution to the genotype. Frequencies and heterozygosities<br />
for loci MSQ3 and MSQ4 could not be precisely<br />
determ<strong>in</strong>ed because <strong>of</strong> the presence <strong>of</strong> null<br />
alleles (see text for estimation procedure).<br />
<strong>Paternity</strong> Analysis<br />
All three trees showed remarkably high<br />
numbers <strong>of</strong> poll<strong>in</strong>ations from outside the<br />
stand. Tree 3E, at the eastern edge <strong>of</strong> the<br />
stand, had the lowest numbers <strong>of</strong> outside<br />
poll<strong>in</strong>ations. The genotypes <strong>of</strong> 47 <strong>of</strong> 92<br />
acorns (51%) <strong>of</strong> tree 3E did not match any<br />
adult <strong>in</strong> the stand. The probable number<br />
<strong>of</strong> cryptic gene flow events <strong>in</strong> the rema<strong>in</strong><strong>in</strong>g<br />
45 acorns was 3.5. In other words, 3–4<br />
<strong>of</strong> these 45 acorns may not have been poll<strong>in</strong>ated<br />
<strong>by</strong> an <strong>in</strong>dividual <strong>of</strong> a match<strong>in</strong>g genotype,<br />
and therefore must have been poll<strong>in</strong>ated<br />
from outside the stand. Correct<strong>in</strong>g<br />
the previous figures for cryptic gene flow<br />
raises the number <strong>of</strong> outside poll<strong>in</strong>ations<br />
to approximately 51 (55%) and lowers the<br />
number <strong>of</strong> with<strong>in</strong>-stand poll<strong>in</strong>ations to 41<br />
(45%). Tree 17M, <strong>in</strong> the middle <strong>of</strong> the<br />
stand, had the highest number <strong>of</strong> outside<br />
poll<strong>in</strong>ations at 59 <strong>of</strong> 94 (63%). Estimated<br />
cryptic gene flow was 3.7, br<strong>in</strong>g<strong>in</strong>g the<br />
probable number <strong>of</strong> outside poll<strong>in</strong>ations<br />
to 63 (67%). Tree 33W, at the western<br />
edge, was <strong>in</strong>termediate at 56 <strong>of</strong> 96 acorns<br />
(58%) poll<strong>in</strong>ated from outside the stand,<br />
or 60 (62%) after correction for cryptic<br />
gene flow. Over all samples, corrected for<br />
cryptic gene flow, 174 <strong>of</strong> 282 acorns, approximately<br />
62%, were poll<strong>in</strong>ated from<br />
outside the stand. Us<strong>in</strong>g the corrected<br />
numbers <strong>of</strong> acorns, a chi-square test <strong>of</strong> association<br />
was done compar<strong>in</strong>g the <strong>of</strong>fspr<strong>in</strong>g<br />
<strong>of</strong> the three trees. No significant difference<br />
<strong>in</strong> the proportion <strong>of</strong> acorns poll<strong>in</strong>ated<br />
from with<strong>in</strong> the stand and outside<br />
the stand was found among the three trees<br />
( 2 2.68, df 2, P .25).<br />
The likelihood <strong>of</strong> a cryptic gene flow<br />
event varied from 0.0008 to 0.42 for <strong>in</strong>dividual<br />
acorns. The frequency distribution<br />
Dow and Ashley • <strong>Bur</strong> <strong>Oak</strong> <strong>Gene</strong> <strong>Flow</strong> 65
Table 2. Frequency distribution <strong>of</strong> the<br />
probabilities that a match<strong>in</strong>g haplotype is an<br />
unrelated <strong>in</strong>dividual for all matches between<br />
putative pollen donors and <strong>of</strong>fspr<strong>in</strong>g cohorts<br />
from three trees<br />
Probability Count Percent<br />
P .05<br />
.05 P .10<br />
.10 P .15<br />
.15 P .20<br />
.20 P .25<br />
.25 P .30<br />
.30 P .35<br />
.35 P .40<br />
.40 P .45<br />
49<br />
28<br />
19<br />
11<br />
4<br />
6<br />
2<br />
0<br />
1<br />
40.8<br />
23.3<br />
15.8<br />
9.2<br />
3.3<br />
5.0<br />
1.7<br />
—<br />
0.8<br />
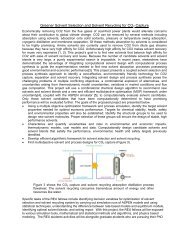
Figure 2. Locations <strong>of</strong> pollen donors for three seed parents: (A) tree 3E, (B) tree 17M, and (C) tree 33W. Filled<br />
squares represent bur oak trunks, open diamonds represent red oak trunks, and polygons represent approximate<br />
crown size. Width <strong>of</strong> l<strong>in</strong>e <strong>in</strong>dicates number <strong>of</strong> poll<strong>in</strong>ations from 1 (th<strong>in</strong>nest l<strong>in</strong>e) to 9 (thickest l<strong>in</strong>e).<br />
<strong>of</strong> these probabilities over all match<strong>in</strong>g<br />
acorns is shown <strong>in</strong> Table 2. Although a few<br />
matches had uncerta<strong>in</strong>ties greater than<br />
0.20, about 80% <strong>of</strong> the matches had uncerta<strong>in</strong>ties<br />
<strong>of</strong> less than 0.15. These probabilities<br />
were used to generate a range <strong>of</strong> values<br />
represent<strong>in</strong>g the most conservative<br />
(‘‘unambiguous’’) estimates at the conventionally<br />
accepted 95% significance level to<br />
the most <strong>in</strong>clusive estimate, us<strong>in</strong>g all potential<br />
matches. Additionally the presence<br />
<strong>of</strong> a few common alleles resulted <strong>in</strong> 13 <strong>of</strong>fspr<strong>in</strong>g<br />
(<strong>of</strong> 120 matches or 282 total) with<br />
2 potential pollen donors. These <strong>in</strong>dividuals<br />
were excluded from the unambiguous<br />
analyses and the match<strong>in</strong>g tree closest to<br />
the seed parent was considered the pollen<br />
donor for the <strong>in</strong>clusive analyses. In most<br />
<strong>of</strong> the analyses, there was no difference <strong>in</strong><br />
the results between the unambiguous and<br />
the <strong>in</strong>clusive groups. We will only present<br />
the <strong>in</strong>clusive results except <strong>in</strong> the case<br />
where the results <strong>of</strong> the two analyses differed.<br />
With<strong>in</strong> the stand, tree 3E had 20 possible<br />
mates, tree 17M had 17 possible<br />
mates, and tree 33W had 18 possible<br />
mates. These numbers were not significantly<br />
different <strong>in</strong> a chi-square test <strong>of</strong> association<br />
( 2 0.36, df 2, P .75). Overall,<br />
38 <strong>of</strong> the 62 trees <strong>in</strong> the stand may<br />
have contributed pollen to these three<br />
trees. Relative numbers <strong>of</strong> fertilizations<br />
from each pollen donor are shown <strong>in</strong> Figure<br />
2. The highest number <strong>of</strong> fertilizations<br />
from a s<strong>in</strong>gle donor for tree 3E was 7, for<br />
tree 17M was 5, and for tree 33W was 9.<br />
Self-poll<strong>in</strong>ation was possible for one acorn<br />
<strong>of</strong> tree 33W, but this <strong>in</strong>dividual also<br />
matched a possible gamete for a tree to<br />
the southwest, so self<strong>in</strong>g cannot be confirmed.<br />
It is <strong>in</strong>terest<strong>in</strong>g to note that pollen<br />
flow from two trees to the northwest <strong>of</strong><br />
tree 3E was not apparently impeded <strong>by</strong><br />
the presence <strong>of</strong> a red oak between them<br />
and tree 3E (Figure 2A). Because no pollen<br />
donor had a disproportionately high number<br />
<strong>of</strong> fertilizations, differential poll<strong>in</strong>ation<br />
success <strong>of</strong> near<strong>by</strong> trees was not sufficient<br />
to expla<strong>in</strong> observed differences <strong>in</strong> allele<br />
frequencies between maternal tree and<br />
acorns, discussed previously for trees<br />
17M and 3E. It is more likely that these<br />
differences arose from the large <strong>in</strong>flux <strong>of</strong><br />
pollen from other stands.<br />
Spatial Analysis<br />
The pattern <strong>of</strong> fertilization <strong>of</strong> the three<br />
trees is shown <strong>in</strong> Figure 2. A jo<strong>in</strong>-count<br />
spatial autocorrelation <strong>of</strong> each tree with<br />
its respective pollen donors <strong>in</strong>dicates that<br />
pollen donors for trees 3E and 17M are<br />
randomly dispersed with<strong>in</strong> the stand. Pollen<br />
donors for tree 33W are significantly<br />
clustered (P .01). The cluster<strong>in</strong>g <strong>of</strong> pollen<br />
donors around tree 33W may account<br />
for the low heterozygosity found at three<br />
<strong>of</strong> the loci <strong>in</strong> the <strong>of</strong>fspr<strong>in</strong>g cohort (Table<br />
1) because many <strong>of</strong> the trees near<strong>by</strong><br />
shared at least one allele with tree 33W.<br />
To further test differences among the<br />
trees, a chi-square test <strong>of</strong> association was<br />
done to determ<strong>in</strong>e if the number <strong>of</strong> acorns<br />
poll<strong>in</strong>ated <strong>by</strong> near neighbors varied<br />
among the trees. ‘‘Near’’ was def<strong>in</strong>ed as 0–<br />
50 m because this range gave adequate expected<br />
values, and a chi-square test<br />
showed no significant differences <strong>in</strong> number<br />
<strong>of</strong> trees with<strong>in</strong> 50 m <strong>of</strong> the three ma-<br />
66 The Journal <strong>of</strong> Heredity 1998:89(1)
Figure 2.<br />
Cont<strong>in</strong>ued.<br />
ternal trees ( 2 1.3, df 2, P .4).<br />
Therefore differences <strong>in</strong> poll<strong>in</strong>ations<br />
would not be a direct result <strong>of</strong> more or<br />
fewer neighbor<strong>in</strong>g trees. Tree 3E had 11<br />
poll<strong>in</strong>ations from near trees and 36 poll<strong>in</strong>ations<br />
from with<strong>in</strong>-stand trees more than<br />
50 m away (‘‘distant’’). Tree 17M had 8<br />
near and 15 distant poll<strong>in</strong>ations, and tree<br />
33W had 23 near and 12 distant poll<strong>in</strong>ations.<br />
A chi-square test <strong>of</strong> association for<br />
the number <strong>of</strong> poll<strong>in</strong>ations <strong>in</strong> the two distance<br />
classes revealed significant differences<br />
<strong>in</strong> the number <strong>of</strong> apparent poll<strong>in</strong>ations<br />
from trees 50 m or closer and those<br />
with<strong>in</strong> the stand but more than 50 m away<br />
( 2 15.3, df 2, P .001). Tree 3E had<br />
fewer near poll<strong>in</strong>ations than expected <strong>by</strong><br />
chance, tree 17M was close to expected,<br />
and tree 33W had more than expected<br />
near poll<strong>in</strong>ations. Although the number <strong>of</strong><br />
trees with<strong>in</strong> 50 m was not significantly different,<br />
the spatial pattern <strong>of</strong> these trees<br />
was not the same. Trees around tree 33W<br />
were closer overall than neighbors <strong>of</strong> the<br />
other trees. The mean distance between<br />
tree 33W and trees with<strong>in</strong> 50 m is 18.4 <br />
10.1 m. (SD) while mean distances to<br />
neighbors with<strong>in</strong> 50 m is 44.3 9.5 m for<br />
tree 17M and 44.7 4.3 m for tree 3E.<br />
These distances are significantly different<br />
(Kruskal–Wallis H test, P .0089). Tree<br />
33W, then, is the only tree to receive pollen<br />
frequently from its neighbors, and its<br />
neighbors are closer than neighbors <strong>of</strong> the<br />
other two trees. These results suggest that<br />
a near-neighbor advantage may exist over<br />
very short distances, but disappears with<strong>in</strong><br />
about 45 m.<br />
The mean distances <strong>of</strong> pollen donors<br />
from trees 3E and 17M were longer than<br />
for tree 33W. The mean distance between<br />
tree 3E and its pollen donors was 68.6 <br />
22.9 m (SD) for unambiguous matches and<br />
75.3 28.7 m for all matches. For tree<br />
17M, mean distance was 79.6 44.7 m<br />
(unambiguous) or 88.8 49.6 m (all). Tree<br />
33W had the shortest mean distances and<br />
the highest variability at 64.3 82.4 m for<br />
unambiguous matches and 63.0 70.8 m<br />
for all matches. These differences are not<br />
significant for the unambiguous matches,<br />
but are highly significant for all matches<br />
(Kruskal–Wallis H test, P .0044).<br />
The Spearman rank correlation coefficient<br />
was used to exam<strong>in</strong>e the relationship<br />
between <strong>in</strong>dividual poll<strong>in</strong>ation success<br />
and distance from the maternal tree. The<br />
number <strong>of</strong> acorns poll<strong>in</strong>ated <strong>by</strong> <strong>in</strong>dividual<br />
trees <strong>in</strong> the stand ranged from 0 to 9, with<br />
a mode <strong>of</strong> 0, so there were many tied<br />
ranks. It was therefore appropriate to correct<br />
the correlation coefficient for ties<br />
(Ebdon 1985). Given the previously discussed<br />
cluster<strong>in</strong>g <strong>of</strong> pollen donors around<br />
tree 33W, it was not surpris<strong>in</strong>g that the<br />
Spearman coefficient was significant for<br />
the association <strong>of</strong> fertilization and distance<br />
from the maternal tree (r s 0.35,<br />
P .008). The negative value <strong>of</strong> the correlation<br />
<strong>in</strong>dicates an <strong>in</strong>verse relationship,<br />
that is, closer trees fertilize more seeds.<br />
Also as might be expected, pollen donors<br />
<strong>of</strong> tree 17M showed no significant correlation<br />
between distance and the number<br />
<strong>of</strong> fertilizations (r s 0.05, P .72). Although<br />
tree 3E seemed similar to tree 17M<br />
<strong>in</strong> tests <strong>of</strong> cluster<strong>in</strong>g and neighbor fertilizations,<br />
trees contribut<strong>in</strong>g pollen to this<br />
tree had the strongest association <strong>of</strong> distance<br />
and number <strong>of</strong> fertilizations <strong>of</strong> the<br />
three trees studied, although the relationship<br />
was still fairly weak (r s 0.45, P <br />
.0005). Thus, while a large proportion <strong>of</strong><br />
effective pollen did not come from trees<br />
with<strong>in</strong> 50 m <strong>of</strong> the tree, the overall trend<br />
for the entire stand <strong>in</strong>dicates that near<br />
trees had a fertilization advantage over<br />
distant trees <strong>in</strong> mat<strong>in</strong>g with tree 3E. In this<br />
analysis <strong>of</strong> fertilization from with<strong>in</strong> the<br />
stand, it is important to bear <strong>in</strong> m<strong>in</strong>d that<br />
more than half <strong>of</strong> the acorns from any tree<br />
were fertilized <strong>by</strong> pollen from outside the<br />
stand.<br />
Discussion<br />
Each microsatellite locus <strong>in</strong> this study was<br />
highly variable. The number <strong>of</strong> alleles per<br />
Dow and Ashley • <strong>Bur</strong> <strong>Oak</strong> <strong>Gene</strong> <strong>Flow</strong> 67
Figure 2.<br />
Cont<strong>in</strong>ued.<br />
locus ranged from 14 to 24, with a total <strong>of</strong><br />
83 alleles over four loci. The most common<br />
allele had a frequency <strong>of</strong> 0.24. More<br />
than half (55.6%) <strong>of</strong> these alleles were<br />
present at frequencies <strong>of</strong> less than 0.05,<br />
meet<strong>in</strong>g the general criteria for rarity. Microsatellites<br />
therefore have the large numbers<br />
<strong>of</strong> rare alleles that are required to<br />
perform paternity analyses <strong>by</strong> exclusion.<br />
Of 282 <strong>of</strong>fspr<strong>in</strong>g studied 269 (95%)<br />
matched either one or no paternal parent<br />
<strong>in</strong> the stand. In the rema<strong>in</strong><strong>in</strong>g 13 cases<br />
(5%), assignment <strong>of</strong> paternity could be<br />
narrowed down to two adults.<br />
The presence <strong>of</strong> a few relatively common<br />
alleles resulted <strong>in</strong> some <strong>of</strong> the matches<br />
between parent and <strong>of</strong>fspr<strong>in</strong>g be<strong>in</strong>g<br />
somewhat uncerta<strong>in</strong> (probability <strong>of</strong><br />
match<strong>in</strong>g <strong>by</strong> chance was greater than<br />
0.05). Even with this uncerta<strong>in</strong>ty, however,<br />
microsatellite paternity analysis has several<br />
advantages over allozyme methods. In<br />
most-likely paternity analysis us<strong>in</strong>g allozymes,<br />
assignment <strong>of</strong> paternity is biased<br />
toward homozygous <strong>in</strong>dividuals so that a<br />
heterozygous <strong>in</strong>dividual may not be<br />
matched to its true <strong>of</strong>fspr<strong>in</strong>g (Adams et al.<br />
1992). Furthermore, a high proportion <strong>of</strong><br />
<strong>of</strong>fspr<strong>in</strong>g <strong>of</strong>ten must be discarded from<br />
allozyme analysis <strong>of</strong> parentage because alleles<br />
are too common to be <strong>in</strong>formative<br />
(Godt and Hamrick 1993; Meagher 1986).<br />
<strong>Paternity</strong> exclusion us<strong>in</strong>g microsatellites<br />
will not exclude a true parent, even if certa<strong>in</strong>ty<br />
is sometimes relatively low, and all<br />
<strong>of</strong>fspr<strong>in</strong>g can be <strong>in</strong>cluded <strong>in</strong> the analysis.<br />
Us<strong>in</strong>g four microsatellite loci, 80% <strong>of</strong> the<br />
parent-<strong>of</strong>fspr<strong>in</strong>g matches had certa<strong>in</strong>ties<br />
<strong>of</strong> 85% or better, which reflects the correct<br />
match most <strong>of</strong> the time. An additional locus<br />
<strong>of</strong> similar variability would probably<br />
lower the likelihood <strong>of</strong> an unrelated match<br />
to 0.05 or less for all <strong>of</strong>fspr<strong>in</strong>g.<br />
Our analysis <strong>of</strong> paternity <strong>in</strong> bur oaks has<br />
revealed several remarkable aspects <strong>of</strong><br />
w<strong>in</strong>d poll<strong>in</strong>ation. Primary among these is<br />
that at least 57% <strong>of</strong> all the acorns <strong>in</strong>cluded<br />
<strong>in</strong> the study were fertilized <strong>by</strong> trees outside<br />
the stand, the pollen travel<strong>in</strong>g at least<br />
100 m from the pollen donors. This value<br />
<strong>in</strong>creases to 62% when corrected for the<br />
probability <strong>of</strong> cryptic gene flow. This proportion<br />
<strong>of</strong> alien poll<strong>in</strong>ations was with<strong>in</strong><br />
the range <strong>of</strong> pollen contam<strong>in</strong>ation (32–<br />
83%) measured <strong>by</strong> pollen traps <strong>in</strong> a w<strong>in</strong>ddispersed<br />
conifer orchard (Caron and<br />
Leblanc 1992). As with all pollen trap studies,<br />
no <strong>in</strong>formation was ga<strong>in</strong>ed on what<br />
pollen does with<strong>in</strong> the stand. Microsatellite<br />
analysis comb<strong>in</strong>ed with pollen trap<br />
studies could better establish the relationship<br />
between pollen movement and effective<br />
poll<strong>in</strong>ation, which will lead to better<br />
predictions <strong>of</strong> genetic structure based on<br />
poll<strong>in</strong>ation mechanism (Loveless and<br />
Hamrick 1984).<br />
Our estimate <strong>of</strong> gene flow is substantially<br />
higher than that reported <strong>in</strong> allozyme<br />
studies <strong>of</strong> conifers (16 migrants per<br />
generation <strong>in</strong> ponderosa p<strong>in</strong>e, Hamrick et<br />
al. 1989; 11 migrants per generation <strong>in</strong> limber<br />
p<strong>in</strong>e, Schuster et al. 1989) and elm (2–<br />
3 migrants per generation, Sherman-Broyles<br />
et al. 1992). Even though the number<br />
<strong>of</strong> migrants refers to <strong>in</strong>dividuals that survive<br />
to reproductive maturity, our results<br />
suggest that, <strong>in</strong> the absence <strong>of</strong> selection<br />
for local genotypes, over half <strong>of</strong> the members<br />
<strong>of</strong> each generation will have paternal<br />
alleles from outside the stand.<br />
Studies <strong>of</strong> crops have shown that pollen<br />
flow from outside the field was limited to<br />
the w<strong>in</strong>dward side. Because a pollen trap<br />
study suggested a southeast bias <strong>in</strong> pollen<br />
deposition when averaged over several<br />
days (Dow 1995), we expected that tree<br />
33W, on the northwest side, would have<br />
the highest proportion <strong>of</strong> seeds poll<strong>in</strong>ated<br />
from outside the stand, and tree 3E, on the<br />
east side, would be poll<strong>in</strong>ated primarily <strong>by</strong><br />
trees from <strong>in</strong>side the stand. Pollen deposition<br />
data from <strong>in</strong>dividual days <strong>in</strong>dicated<br />
variable directions <strong>in</strong> peak deposition<br />
(Dow 1995), therefore an alternative hypothesis<br />
was that the number <strong>of</strong> poll<strong>in</strong>ations<br />
from outside the stand may be strict-<br />
68 The Journal <strong>of</strong> Heredity 1998:89(1)
ly related to the distance from the nearest<br />
stand. In this case, tree 3E would be expected<br />
to have more outside poll<strong>in</strong>ations<br />
that tree 33W, because the distance between<br />
tree 3E and the nearest tree outside<br />
the stand was approximately 100 m<br />
(southeast), while this distance for tree<br />
33W was about 200 m (northeast). However,<br />
the number <strong>of</strong> alien poll<strong>in</strong>ations was<br />
not significantly different for trees <strong>in</strong> different<br />
parts <strong>of</strong> the stand, suggest<strong>in</strong>g that<br />
neither direction nor distance from neighbor<strong>in</strong>g<br />
stands were major determ<strong>in</strong>ants <strong>in</strong><br />
poll<strong>in</strong>ation success.<br />
Microsatellite analysis can be used not<br />
only to estimate gene flow but to determ<strong>in</strong>e<br />
the pattern <strong>of</strong> pollen dispersal with<strong>in</strong><br />
the stand. Because <strong>in</strong>dividual pollen donors<br />
are identified, actual distance <strong>of</strong> pollen<br />
movement with<strong>in</strong> the stand can be<br />
measured. The mean pollen dispersal distance<br />
exceeded 60 m for all maternal<br />
trees. The distance between potential pollen<br />
donors and tree 17M was not correlated<br />
with the number <strong>of</strong> acorns fertilized.<br />
The distance to pollen donors and the<br />
number <strong>of</strong> acorns fertilized was significantly<br />
correlated for trees 3E and 33W, but<br />
the relationship was not strong. Distance<br />
between trees may <strong>in</strong>fluence poll<strong>in</strong>ation,<br />
but it is probably not a major determ<strong>in</strong>ant<br />
<strong>of</strong> poll<strong>in</strong>ation success. Successful self-poll<strong>in</strong>ation<br />
<strong>in</strong> bur oaks, if it occurs at all, is<br />
exceed<strong>in</strong>gly rare.<br />
The spatial relationship among maternal<br />
trees and their pollen donors varied. The<br />
pollen donors <strong>of</strong> two trees, tree 3E and<br />
tree 17M, appeared to be dispersed at random<br />
throughout the stand, and neighbor<strong>in</strong>g<br />
trees had no apparent fertilization advantage.<br />
Tree 33W, which had closer<br />
neighbors than tree 3E or 17M, had a higher<br />
proportion <strong>of</strong> neighbor mat<strong>in</strong>gs than<br />
the other two trees, and also showed significant<br />
cluster<strong>in</strong>g <strong>of</strong> pollen donors. This<br />
was the only evidence <strong>of</strong> nonrandom mat<strong>in</strong>g<br />
<strong>in</strong> the population, and the acorns fertilized<br />
<strong>by</strong> neighbors comprised less than<br />
24% <strong>of</strong> the total sample for this tree.<br />
Neighbor<strong>in</strong>g trees may have an advantage<br />
at very short distances, but this effect apparently<br />
dim<strong>in</strong>ishes <strong>by</strong> about 45 m from<br />
the maternal tree. Another factor which<br />
may be important <strong>in</strong> nonrandom mat<strong>in</strong>g is<br />
that this tree was farther from the nearest<br />
neighbor<strong>in</strong>g stands than either tree 17M<br />
or 3E. However, this greater distance<br />
would lead to an expectation that there<br />
would be fewer poll<strong>in</strong>ations from outside<br />
the stand, and there was no difference<br />
among the three trees for this variable.<br />
This result also suggests that the presence<br />
<strong>of</strong> near neighbors does not <strong>in</strong>hibit pollen<br />
flow from distant sources. It would be <strong>in</strong>terest<strong>in</strong>g<br />
to determ<strong>in</strong>e if gene flow is <strong>in</strong>hibited<br />
<strong>in</strong> large, dense stands <strong>of</strong> trees.<br />
The generally low <strong>in</strong>cidence <strong>of</strong> neighbor<br />
poll<strong>in</strong>ations and high <strong>in</strong>cidence <strong>of</strong> gene<br />
flow suggests that poll<strong>in</strong>ation success <strong>of</strong><br />
w<strong>in</strong>d-dispersed pollen does not follow<br />
standard models based on air flow dynamics<br />
<strong>of</strong> dispersal from a s<strong>in</strong>gle source. Over<br />
evolutionary time, pollen gra<strong>in</strong>s have been<br />
selected for size, mass, buoyancy, and other<br />
characteristics, but the fact rema<strong>in</strong>s<br />
that pollen will become diluted <strong>in</strong> air as it<br />
travels from its source (Faegri and van der<br />
Pijl 1979; Lev<strong>in</strong> and Kerster 1974). A limited<br />
pollen trap study at this site suggested<br />
that pollen densities did fall <strong>of</strong>f rapidly<br />
with distance from the source tree (Dow<br />
1995). We have shown that much <strong>of</strong> the<br />
pollen that effectively fertilizes seeds<br />
comes from a source some distance from<br />
the maternal tree. One possible explanation<br />
is that theoretical models <strong>of</strong> pollen<br />
dispersal from a s<strong>in</strong>gle source do not represent<br />
actual pollen movement from many<br />
<strong>in</strong>dividuals, and that pollen densities do<br />
not drop as sharply as these models predict.<br />
The leptokurtic tails <strong>of</strong> the distributions<br />
<strong>of</strong> s<strong>in</strong>gle trees may overlap to form<br />
a pollen cloud around a maternal tree (Adams<br />
1992) that would provide that tree<br />
with access to many pollen donors. It is<br />
also possible that cluster<strong>in</strong>g <strong>of</strong> pollen<br />
gra<strong>in</strong>s may cause the distribution <strong>of</strong> fertilizations<br />
to be flatter and broader than the<br />
distribution <strong>of</strong> pollen (Tonsor 1985).<br />
Another explanation for the high number<br />
<strong>of</strong> fertilizations from outside the stand<br />
is that there may be some mechanism <strong>by</strong><br />
which a tree can ‘‘choose’’ pollen from distant<br />
sources over the more dense pollen<br />
from near<strong>by</strong>. If trees with<strong>in</strong> the stand<br />
shared more alleles with each other than<br />
with trees outside the stand, pollen from<br />
outside the stand could then be favored<br />
over with<strong>in</strong>-stand pollen based on genetic<br />
dissimilarity. Selection <strong>in</strong> oaks may occur<br />
<strong>by</strong> delayed fertilization, selective abortion,<br />
or embryo competition (Willson and<br />
<strong>Bur</strong>ley 1983). Germ<strong>in</strong>ation rates <strong>of</strong> developed<br />
acorns were greater than 90% for all<br />
samples, suggest<strong>in</strong>g that the selective process<br />
occurs prior to acorn maturation.<br />
The tim<strong>in</strong>g <strong>of</strong> pollen release is a third<br />
possible explanation for the observed fertilization<br />
pattern. Pollen release is generally<br />
believed to be regulated <strong>by</strong> environmental<br />
cues (Whitehead 1983), yet the<br />
pr<strong>in</strong>ciple <strong>of</strong> dichogamy is that some trees<br />
flower slightly ahead <strong>of</strong> others so that the<br />
pollen <strong>of</strong> a tree is released before its stigmas<br />
are receptive, but while another tree<br />
is receptive. Thus observed pollen donors<br />
may have been the only trees releas<strong>in</strong>g<br />
pollen when the maternal trees had receptive<br />
stigmas. We do not have accurate field<br />
observations <strong>of</strong> the flower<strong>in</strong>g release<br />
times <strong>of</strong> all the trees <strong>in</strong> the stand, so we<br />
cannot determ<strong>in</strong>e if this was a factor <strong>in</strong><br />
the observed with<strong>in</strong>-stand poll<strong>in</strong>ations.<br />
However, as Willson and <strong>Bur</strong>ley (1983)<br />
suggest, the stigma may be able to sample<br />
pollen for a month, which is as long or longer<br />
than the period <strong>in</strong> which all pollen release<br />
occurs. Thus staggered times <strong>of</strong> pollen<br />
release, while effective <strong>in</strong> prevent<strong>in</strong>g<br />
self-fertilizations, may not be sufficient to<br />
expla<strong>in</strong> the low <strong>in</strong>cidence <strong>of</strong> with<strong>in</strong>-stand<br />
fertilizations.<br />
Conclusions<br />
W<strong>in</strong>d poll<strong>in</strong>ation <strong>in</strong> bur oaks seems to be<br />
extraord<strong>in</strong>arily efficient at produc<strong>in</strong>g highly<br />
outbred <strong>in</strong>dividuals and ensur<strong>in</strong>g longrange<br />
pollen flow. The high numbers <strong>of</strong> fertilizations<br />
from outside the stand contradict<br />
traditional models <strong>of</strong> pollen movement,<br />
but can expla<strong>in</strong> the results <strong>of</strong> allozyme<br />
studies show<strong>in</strong>g little population differentiation<br />
<strong>in</strong> w<strong>in</strong>d-poll<strong>in</strong>ated plants.<br />
Because paternity could be determ<strong>in</strong>ed <strong>by</strong><br />
exclusion, a very detailed picture <strong>of</strong> fertilization<br />
can be obta<strong>in</strong>ed through the use <strong>of</strong><br />
microsatellite analysis.<br />
References<br />
Adams WT, 1992. <strong>Gene</strong> dispersal with<strong>in</strong> forest tree populations.<br />
New Forest 6:217–240.<br />
Adams WT, Griff<strong>in</strong> AR, and Moran GF, 1992. Us<strong>in</strong>g paternity<br />
analysis to measure effective pollen dispersal <strong>in</strong><br />
plant populations. Am Nat 140:762–780.<br />
Ashley MV and Dow BD, 1994. The use <strong>of</strong> microsatellites<br />
for genetic analysis <strong>of</strong> natural populations. In: Molecular<br />
ecology and evolution: approaches and applications<br />
(Schierwater B, Streit B, Wagner GP, and De-<br />
Salle R, eds). Basel: Birkhäuser Verlag; 185–201.<br />
Berg EE and Hamrick JL, 1995. F<strong>in</strong>e-scale genetic structure<br />
<strong>of</strong> a turkey oak forest. Evolution 49:110–120.<br />
Broyles SB, Schnabel A, and Wyatt R, 1994. Evidence<br />
for long-distance pollen dispersal <strong>in</strong> milkweeds (Asclepias<br />
exaltata). Evolution 48:1032–1040.<br />
Callen, DF, Thompson AD, Shen Y, Phillips HA, Richards<br />
RI, Mulley JC, and Sutherland GR, 1993. Incidence and<br />
orig<strong>in</strong> <strong>of</strong> ‘‘null’’ alleles <strong>in</strong> the (AC)n microsatellite markers.<br />
Am J Hum <strong>Gene</strong>t 52:922–927.<br />
Campbell DR, 1991. Compar<strong>in</strong>g pollen dispersal and<br />
gene flow <strong>in</strong> a natural population. Evolution 45:1965–<br />
1968.<br />
Caron GE and Leblanc R, 1992. Pollen contam<strong>in</strong>ation <strong>in</strong><br />
a small black spruce seedl<strong>in</strong>g seed orchard for 3 consecutive<br />
years. Forest Ecol Manage 53:245–261.<br />
Chakraborty R, Meagher TR, and Smouse PE, 1988. Parentage<br />
analysis with genetic markers <strong>in</strong> natural populations.<br />
I. The expected proportion <strong>of</strong> <strong>of</strong>fspr<strong>in</strong>g with<br />
unambiguous paternity. <strong>Gene</strong>tics 118:527–536.<br />
Dow and Ashley • <strong>Bur</strong> <strong>Oak</strong> <strong>Gene</strong> <strong>Flow</strong> 69
Dow BD, 1995. Characterization <strong>of</strong> mat<strong>in</strong>g system <strong>of</strong><br />
bur oak (Quercus macrocarpa) us<strong>in</strong>g microsatellite DNA<br />
markers (PhD dissertation). Chicago, Ill<strong>in</strong>ois: University<br />
<strong>of</strong> Ill<strong>in</strong>ois at Chicago.<br />
Dow BD and Ashley MV, 1996. Microsatellite analysis <strong>of</strong><br />
seed dispersal and parentage <strong>of</strong> sapl<strong>in</strong>gs <strong>in</strong> bur oak,<br />
Quercus macrocarpa. Mol Ecol 5:615–627.<br />
Dow BD, Ashley MV, and Howe HF, 1995. Characterization<br />
<strong>of</strong> highly variable (GA/CT) n microsatellites <strong>in</strong> the<br />
bur oak, Quercus macrocarpa. Theor Appl <strong>Gene</strong>t 91:<br />
137–141.<br />
Ebdon D, 1985. Statistics <strong>in</strong> geography, 2nd ed. Cambridge,<br />
Massachusetts: Basil Blackwell.<br />
Edwards A, Hammond HA, J<strong>in</strong> L, Caskey CT, and Chakraborty<br />
R, 1992. <strong>Gene</strong>tic variation at five trimeric and<br />
tetrameric tandem repeat loci <strong>in</strong> four human population<br />
groups. Genomics 12:241–253.<br />
Ellegren H, 1992. Polymerase-cha<strong>in</strong> reaction (PCR)<br />
analysis <strong>of</strong> microsatellites—a new approach to studies<br />
<strong>of</strong> genetic relationships <strong>in</strong> birds. Auk 109:886–895.<br />
Epperson BK, and Allard RW, 1989. Spatial autocorrelation<br />
analysis <strong>of</strong> the distribution <strong>of</strong> genotypes with<strong>in</strong><br />
populations <strong>of</strong> lodgepole p<strong>in</strong>e. <strong>Gene</strong>tics 121:369–377.<br />
Faegri K and van der Pijl L, 1979. The pr<strong>in</strong>ciples <strong>of</strong> poll<strong>in</strong>ation<br />
ecology. New York: Pergamon Press.<br />
Feeny P, 1970. Seasonal changes <strong>in</strong> oak leaf tann<strong>in</strong>s and<br />
nutrients as a cause <strong>of</strong> spr<strong>in</strong>g feed<strong>in</strong>g <strong>by</strong> w<strong>in</strong>ter moth<br />
caterpillars. Ecology 51:565–581.<br />
Fenster CB, 1991. <strong>Gene</strong> flow <strong>in</strong> Chamaecrista fasciculata<br />
(Legum<strong>in</strong>osae). I. <strong>Gene</strong> dispersal. Evolution 45:398–<br />
409.<br />
Geburek T and Tripp-Knowles P, 1994. <strong>Gene</strong>tic architecture<br />
<strong>in</strong> bur oak, Quercus macrocarpa (Fagaceae), <strong>in</strong>ferred<br />
<strong>by</strong> means <strong>of</strong> spatial autocorrelation analysis.<br />
Plant Syst Evol 189:63–74.<br />
Godt MW and Hamrick JL, 1993. Patterns and levels <strong>of</strong><br />
pollen-mediated gene flow <strong>in</strong> Lathyrus latifolius. Evolution<br />
47:98–110.<br />
Gov<strong>in</strong>daraju DR, 1989. Estimates <strong>of</strong> gene flow <strong>in</strong> forest<br />
trees. Biol J L<strong>in</strong>n Soc 37:345–357.<br />
Greenwood MS, 1986. <strong>Gene</strong> exchange <strong>in</strong> loblolly p<strong>in</strong>e:<br />
the relation between poll<strong>in</strong>ation mechanism, female receptivity<br />
and pollen availability. Am J Bot 73:1443–<br />
1451.<br />
Hamrick JL, L<strong>in</strong>hart YB, and Mitton JB, 1979. Relationships<br />
between life history characteristics and electrophoretically<br />
detectable genetic variation <strong>in</strong> plants.<br />
Annu Rev Ecol Syst 10:173–200.<br />
Hamrick JL, Blanton HM, and Hamrick KJ, 1989. <strong>Gene</strong>tic<br />
structure <strong>of</strong> geographically marg<strong>in</strong>al populations <strong>of</strong><br />
ponderosa p<strong>in</strong>e. Am J Bot 76:1559–1568.<br />
Hamrick JL, Godt MW, and Sherman-Broyles SL, 1995.<br />
<strong>Gene</strong> flow among plant populations: Evidence from genetic<br />
markers. In: Experimental and molecular approaches<br />
to plant biosystematics (Hoch PH and Stephenson<br />
AG, eds). St. Louis: Missouri Botanical Garden<br />
Press; 215–232.<br />
Jones GN, 1963. Flora <strong>of</strong> Ill<strong>in</strong>ois, 3rd ed. The American<br />
Midland Naturalist, Monograph No. 7. Notre Dame, Indiana:<br />
University <strong>of</strong> Notre Dame.<br />
Lev<strong>in</strong> DA and Kerster HW, 1969. The dependence <strong>of</strong><br />
bee-mediated pollen and gene dispersal upon plant diversity.<br />
Evolution 23:560–571.<br />
Lev<strong>in</strong> DA and Kerster HW, 1974. <strong>Gene</strong> flow <strong>in</strong> seed<br />
plants. Evol Biol 7:139–220<br />
L<strong>in</strong>hart YB, Bus<strong>by</strong> WH, Beach JH, and Fe<strong>in</strong>s<strong>in</strong>ger P,<br />
1987. Forager behavior, pollen dispersal and <strong>in</strong>breed<strong>in</strong>g<br />
<strong>in</strong> two species <strong>of</strong> humm<strong>in</strong>gbird-poll<strong>in</strong>ated plants. Evolution<br />
41:679–682.<br />
Loveless MD and Hamrick JL, 1984. Ecological determ<strong>in</strong>ants<br />
<strong>of</strong> genetic structure <strong>in</strong> plant populations. Annu<br />
Rev Ecol and Syst 15:65–95.<br />
Meagher TR, 1986. Analysis <strong>of</strong> paternity with<strong>in</strong> a natural<br />
population <strong>of</strong> Chamaelirium luteum. 1. Identification<br />
<strong>of</strong> most-likely male parents. Am Nat 128:199–215.<br />
Mor<strong>in</strong> PA, Moore JJ, Chakraborty R, J<strong>in</strong> L, Goodall J,<br />
and Woodruff DS, 1994. K<strong>in</strong> selection, social structure,<br />
gene flow, and the evolution <strong>of</strong> chimpanzees. Science<br />
265:1193–1201.<br />
Mosqu<strong>in</strong> T, 1971. Competition for poll<strong>in</strong>ators as a stimulus<br />
for the evolution <strong>of</strong> flower<strong>in</strong>g time. Oikos 22:398–<br />
402.<br />
Paetkau D and Strobeck C, 1995. The molecular basis<br />
and evolutionary history <strong>of</strong> a microsatellite null allele<br />
<strong>in</strong> bears. Mol Ecol 4:519–520.<br />
Pemberton JM, Slate J, Bancr<strong>of</strong>t DR, and Barrett JA,<br />
1995. Nonamplify<strong>in</strong>g alleles at microsatellite loci: a caution<br />
<strong>of</strong> parentage and population studies. Mol Ecol 4:<br />
249–252.<br />
Sakai AK and Oden NL, 1983. Spatial pattern <strong>of</strong> sex expression<br />
<strong>in</strong> silver maple (Acer sacchar<strong>in</strong>um L.): Morisita’s<br />
<strong>in</strong>dex and spatial autocorrelation. Am Nat 122:489–<br />
508.<br />
Schaal BA, 1980. Measurement <strong>of</strong> gene flow <strong>in</strong> Lup<strong>in</strong>us<br />
texensis. Nature 284:450–451.<br />
Schlötterer C and Tautz D, 1992. Slippage synthesis <strong>of</strong><br />
simple sequence DNA. Nucleic Acids Res 20:211–215.<br />
Schuster WS, Alles DL, and Mitton JB, 1989. <strong>Gene</strong> flow<br />
<strong>in</strong> limber p<strong>in</strong>e: Evidence from poll<strong>in</strong>ation phenology<br />
and genetic differentiation along an elevational transect.<br />
Am J Bot 76:1395–1403.<br />
Sherman-Broyles SL, Broyles SB, and Hamrick JL, 1992.<br />
Geographic distribution <strong>of</strong> allozyme variation <strong>in</strong> Ulmus<br />
crassifolia. Syst Bot 17:33–41.<br />
Sokal RR and Oden NL, 1978. Spatial autocorrelation <strong>in</strong><br />
biology. 1. Methodology. Biol J L<strong>in</strong>n Soc 10:199–228.<br />
Tonsor SJ, 1985. Leptokurtic pollen-flow, non-leptokurtic<br />
gene-flow <strong>in</strong> a w<strong>in</strong>d-poll<strong>in</strong>ated herb, Plantago lanceolata<br />
L. Oecologia 67:442–446.<br />
USDA Forest Service, 1974. Seeds <strong>of</strong> woody plants <strong>in</strong><br />
the United States. U.S. Department <strong>of</strong> Agriculture, Agricultural<br />
Handbook No. 450.<br />
Westneat DF and Webster MS, 1994. Molecular analysis<br />
<strong>of</strong> k<strong>in</strong>ship <strong>in</strong> birds: <strong>in</strong>terest<strong>in</strong>g questions and useful<br />
techniques. In: Molecular ecology and evolution: approaches<br />
and applications (Schierwater B, Streit B,<br />
Wagner GP, and DeSalle R, eds). Basel: Birkhäuser Verlag;<br />
91–126.<br />
Whitehead DR, 1983. W<strong>in</strong>d poll<strong>in</strong>ation: some ecological<br />
and evolutionary perspectives. In: Poll<strong>in</strong>ation biology<br />
(Real L, ed). New York: Academic Press; 97–108.<br />
Willson MF and <strong>Bur</strong>ley N, 1983. Mate choice <strong>in</strong> plants.<br />
Pr<strong>in</strong>ceton, New Jersey: Pr<strong>in</strong>ceton University Press.<br />
Wright S, 1931. Evolution <strong>in</strong> Mendelian populations. <strong>Gene</strong>tics<br />
16:97–159.<br />
Received November 15, 1996<br />
Accepted May 5, 1997<br />
Correspond<strong>in</strong>g Editor: Hal<strong>in</strong>a Skorupska<br />
70 The Journal <strong>of</strong> Heredity 1998:89(1)