Citibank ® Custom Reporting System User Guide
Citibank ® Custom Reporting System User Guide
Citibank ® Custom Reporting System User Guide

You also want an ePaper? Increase the reach of your titles
YUMPU automatically turns print PDFs into web optimized ePapers that Google loves.
<strong>Citibank</strong> <strong>Custom</strong> <strong>Reporting</strong> <strong>System</strong> <strong>User</strong> <strong>Guide</strong> | Edit a Report from the Report Viewer<br />
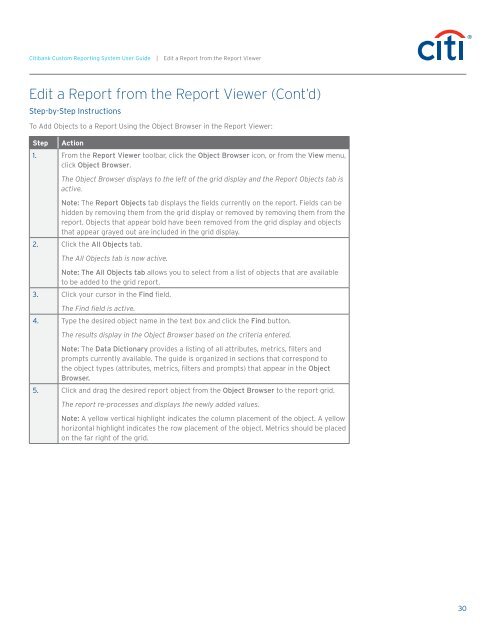
Edit a Report from the Report Viewer (Cont’d)<br />
Step-by-Step Instructions<br />
To Add Objects to a Report Using the Object Browser in the Report Viewer:<br />
Step<br />
Action<br />
1. From the Report Viewer toolbar, click the Object Browser icon, or from the View menu,<br />
click Object Browser.<br />
The Object Browser displays to the left of the grid display and the Report Objects tab is<br />
active.<br />
Note: The Report Objects tab displays the fields currently on the report. Fields can be<br />
hidden by removing them from the grid display or removed by removing them from the<br />
report. Objects that appear bold have been removed from the grid display and objects<br />
that appear grayed out are included in the grid display.<br />
2. Click the All Objects tab.<br />
The All Objects tab is now active.<br />
Note: The All Objects tab allows you to select from a list of objects that are available<br />
to be added to the grid report.<br />
3. Click your cursor in the Find field.<br />
The Find field is active.<br />
4. Type the desired object name in the text box and click the Find button.<br />
The results display in the Object Browser based on the criteria entered.<br />
Note: The Data Dictionary provides a listing of all attributes, metrics, filters and<br />
prompts currently available. The guide is organized in sections that correspond to<br />
the object types (attributes, metrics, filters and prompts) that appear in the Object<br />
Browser.<br />
5. Click and drag the desired report object from the Object Browser to the report grid.<br />
The report re-processes and displays the newly added values.<br />
Note: A yellow vertical highlight indicates the column placement of the object. A yellow<br />
horizontal highlight indicates the row placement of the object. Metrics should be placed<br />
on the far right of the grid.<br />
30