Temporary Migration, Human Capital, and Language Fluency ... - UCL
Temporary Migration, Human Capital, and Language Fluency ... - UCL
Temporary Migration, Human Capital, and Language Fluency ... - UCL

Create successful ePaper yourself
Turn your PDF publications into a flip-book with our unique Google optimized e-Paper software.
<strong>Temporary</strong> migration, human capital, <strong>and</strong> language ¯uency of migrants 305<br />
intended actions in the future. Even if these intentions are not realized, they<br />
will have caused a certain past behavioural pattern. 8<br />
Pro®ciency in the spoken language is self-reported <strong>and</strong> observed on a<br />
scale from 1 to 5. 9 About 41 percent of the sample reports speaking the<br />
German language well or very well, 40 percent on an intermediate level, <strong>and</strong><br />
19 percent poorly or very poorly. For the empirical analysis, the language<br />
information is condensed into a binary variable, being equal to 1 if the<br />
migrant reports speaking the language well or very well, <strong>and</strong> zero otherwise.<br />
This follows a common practice in this type of analysis, <strong>and</strong> simpli®es the<br />
estimation considerably.<br />
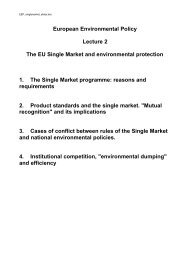
Table 2 presents some numbers on the variable totdur (rows 1, 2), the<br />
percentage of individuals who classify themselves into the language category<br />
well or very well (row 3), <strong>and</strong> the number of years of a future intended<br />
duration (rows 4, 5). 269 observations (36.9%) are right censored in the<br />
sense that individuals intend to return after retirement age, or to remain<br />
permanently. It is clear from the numbers in the table that the distribution of<br />
durations is skewed to the right, <strong>and</strong> it peaks at durations of between 16 <strong>and</strong><br />
20 years. 10 The numbers in the third row indicate that language pro®ciency<br />
Table 2. Total <strong>and</strong> intended future duration<br />
Total Duration (Years)<br />
1±5 6±10 11±15 16±20 21±25 26±30 31±35 36±40 . 40<br />
No. Obs. 3 21 66 136 134 98 91 81 93<br />
Percentage 0.41 2.88 9.05 18.65 18.38 13.44 12.48 11.11 12.75<br />
<strong>Language</strong> well<br />
or very well<br />
(percentage)<br />
0.00 35.00 25.75 32.35 39.55 37.14 40.65 49.38 64.51<br />
Intended Future Duration (Years)<br />
No. Obs. 270 185 76 79 38 50 23 6 2<br />
Percentage 37.03 25.37 10.42 10.83 5.40 6.85 3.15 0.82 0.27<br />
8 This line of reasoning underlies Galor <strong>and</strong> Stark's (1991) conclusion that positive return<br />
probabilities lead to higher performance of migrants, as compared to natives.<br />
9 The problem of using self-reported language skills has been emphasized repeatedly in the<br />
literature. However, test-based measures of language abilities are rarely available in microdata<br />
sets, <strong>and</strong> language studies are almost exclusively based on self-reported measures. An<br />
exception is Rivera-Batiz (1990).<br />
10 This pattern seems to be consistent with ®ndings for other countries. LaLonde <strong>and</strong> Topel<br />
(1992) report that in the US, some return migration occurs shortly after arrival, although a<br />
great deal occurs several decades after immigration. Since the data used for this analysis stem<br />
from 1984, but active recruitment of labour migrants had stopped as early as 1973, the data<br />
undersample those migrants who remained only for short periods.<br />
# The editors of the Sc<strong>and</strong>inavian Journal of Economics 1999.