PaSim, RothC, CENTURY and DNDC - University College Cork
PaSim, RothC, CENTURY and DNDC - University College Cork
PaSim, RothC, CENTURY and DNDC - University College Cork

You also want an ePaper? Increase the reach of your titles
YUMPU automatically turns print PDFs into web optimized ePapers that Google loves.
STRIVE<br />
Report Series No.20<br />
Evaluation of Models<br />
(<strong>PaSim</strong>, <strong>RothC</strong>, <strong>CENTURY</strong><br />
<strong>and</strong> <strong>DNDC</strong>) for Simulation<br />
of Grassl<strong>and</strong> Carbon<br />
Cycling at Plot, Field <strong>and</strong><br />
Regional Scale<br />
STRIVE<br />
Environmental Protection<br />
Agency Programme<br />
2007-2013
Environmental Protection Agency<br />
The Environmental Protection Agency (EPA) is<br />
a statutory body responsible for protecting<br />
the environment in Irel<strong>and</strong>. We regulate <strong>and</strong><br />
police activities that might otherwise cause<br />
pollution. We ensure there is solid<br />
information on environmental trends so that<br />
necessary actions are taken. Our priorities are<br />
protecting the Irish environment <strong>and</strong><br />
ensuring that development is sustainable.<br />
The EPA is an independent public body<br />
established in July 1993 under the<br />
Environmental Protection Agency Act, 1992.<br />
Its sponsor in Government is the Department<br />
of the Environment, Heritage <strong>and</strong> Local<br />
Government.<br />
OUR RESPONSIBILITIES<br />
LICENSING<br />
We license the following to ensure that their emissions<br />
do not endanger human health or harm the environment:<br />
<br />
<br />
<br />
<br />
<br />
waste facilities (e.g., l<strong>and</strong>fills,<br />
incinerators, waste transfer stations);<br />
large scale industrial activities<br />
(e.g., pharmaceutical manufacturing,<br />
cement manufacturing, power plants);<br />
intensive agriculture;<br />
the contained use <strong>and</strong> controlled release<br />
of Genetically Modified Organisms (GMOs);<br />
large petrol storage facilities.<br />
NATIONAL ENVIRONMENTAL ENFORCEMENT<br />
Conducting over 2,000 audits <strong>and</strong> inspections of<br />
EPA licensed facilities every year.<br />
Overseeing local authorities’ environmental<br />
protection responsibilities in the areas of - air,<br />
noise, waste, waste-water <strong>and</strong> water quality.<br />
Working with local authorities <strong>and</strong> the Gardaí to<br />
stamp out illegal waste activity by co-ordinating a<br />
national enforcement network, targeting offenders,<br />
conducting investigations <strong>and</strong> overseeing<br />
remediation.<br />
Prosecuting those who flout environmental law <strong>and</strong><br />
damage the environment as a result of their actions.<br />
MONITORING, ANALYSING AND REPORTING ON THE<br />
ENVIRONMENT<br />
<br />
<br />
Monitoring air quality <strong>and</strong> the quality of rivers,<br />
lakes, tidal waters <strong>and</strong> ground waters; measuring<br />
water levels <strong>and</strong> river flows.<br />
Independent reporting to inform decision making by<br />
national <strong>and</strong> local government.<br />
REGULATING IRELAND’S GREENHOUSE GAS EMISSIONS<br />
Quantifying Irel<strong>and</strong>’s emissions of greenhouse gases<br />
in the context of our Kyoto commitments.<br />
Implementing the Emissions Trading Directive,<br />
involving over 100 companies who are major<br />
generators of carbon dioxide in Irel<strong>and</strong>.<br />
ENVIRONMENTAL RESEARCH AND DEVELOPMENT<br />
Co-ordinating research on environmental issues<br />
(including air <strong>and</strong> water quality, climate change,<br />
biodiversity, environmental technologies).<br />
STRATEGIC ENVIRONMENTAL ASSESSMENT<br />
Assessing the impact of plans <strong>and</strong> programmes on<br />
the Irish environment (such as waste management<br />
<strong>and</strong> development plans).<br />
ENVIRONMENTAL PLANNING, EDUCATION AND<br />
GUIDANCE<br />
<br />
<br />
Providing guidance to the public <strong>and</strong> to industry on<br />
various environmental topics (including licence<br />
applications, waste prevention <strong>and</strong> environmental<br />
regulations).<br />
Generating greater environmental awareness<br />
(through environmental television programmes <strong>and</strong><br />
primary <strong>and</strong> secondary schools’ resource packs).<br />
PROACTIVE WASTE MANAGEMENT<br />
Promoting waste prevention <strong>and</strong> minimisation<br />
projects through the co-ordination of the National<br />
Waste Prevention Programme, including input into<br />
the implementation of Producer Responsibility<br />
Initiatives.<br />
Enforcing Regulations such as Waste Electrical <strong>and</strong><br />
Electronic Equipment (WEEE) <strong>and</strong> Restriction of<br />
Hazardous Substances (RoHS) <strong>and</strong> substances that<br />
deplete the ozone layer.<br />
Developing a National Hazardous Waste Management<br />
Plan to prevent <strong>and</strong> manage hazardous waste.<br />
MANAGEMENT AND STRUCTURE OF THE EPA<br />
The organisation is managed by a full time Board,<br />
consisting of a Director General <strong>and</strong> four Directors.<br />
The work of the EPA is carried out across four offices:<br />
Office of Climate, Licensing <strong>and</strong> Resource Use<br />
Office of Environmental Enforcement<br />
Office of Environmental Assessment<br />
Office of Communications <strong>and</strong> Corporate Services<br />
The EPA is assisted by an Advisory Committee of twelve<br />
members who meet several times a year to discuss<br />
issues of concern <strong>and</strong> offer advice to the Board.
EPA STRIVE Programme 2007–2013<br />
Evaluation of Models<br />
(<strong>PaSim</strong>, <strong>RothC</strong>, <strong>CENTURY</strong> <strong>and</strong> <strong>DNDC</strong>) for<br />
Simulation of Grassl<strong>and</strong> Carbon Cycling at Plot,<br />
Field <strong>and</strong> Regional Scale<br />
(2005-FS-32-M1)<br />
STRIVE Report<br />
Prepared for the Environmental Protection Agency<br />
by<br />
Centre for Hydrology, Micrometeorology <strong>and</strong> Climate Change<br />
Department of Civil <strong>and</strong> Environmental Engineering<br />
<strong>University</strong> <strong>College</strong> <strong>Cork</strong><br />
Irel<strong>and</strong><br />
Authors:<br />
Kenneth A. Byrne<br />
Ger Kiely<br />
ENVIRONMENTAL PROTECTION AGENCY<br />
An Ghníomhaireacht um Chaomhú Comhshaoil<br />
PO Box 3000, Johnstown Castle Estate, County Wexford, Irel<strong>and</strong><br />
Telephone: +353 53 91 60600 Fax +353 53 91 60699<br />
Email: info@epa.ie Website: www.epa.ie
© Environmental Protection Agency 2008<br />
ACKNOWLEDGEMENTS<br />
This report is published as part of the Science, Technology, Research <strong>and</strong> Innovation for the<br />
Environment (STRIVE) Programme 2007–2013. The programme is financed by the Irish Government<br />
under the National Development Plan 2007–2013. It is administered on behalf of the Department of<br />
the Environment, Heritage <strong>and</strong> Local Government by the Environmental Protection Agency which<br />
has the statutory function of coordinating <strong>and</strong> promoting environmental research.<br />
Thanks to Dr Paul Leahy, <strong>University</strong> <strong>College</strong> <strong>Cork</strong>, for his support with this work. Thanks to Tido<br />
Semmler, Elisa Nishimura <strong>and</strong> Ray McGrath of Met Éireann for providing data from the regional<br />
climate model downscaling of the Intergovernmental Panel on Climate Change (IPCC) scenarios used<br />
in Section 3.<br />
DISCLAIMER<br />
Although every effort has been made to ensure the accuracy of the material contained in this publication,<br />
complete accuracy cannot be guaranteed. Neither the Environmental Protection Agency nor the<br />
author(s) accept any responsibility whatsoever for loss or damage occasioned or claimed to have<br />
been occasioned, in part or in full, as a consequence of any person acting, or refraining from acting,<br />
as a result of a matter contained in this publication. All or part of this publication may be reproduced<br />
without further permission, provided the source is acknowledged. The EPA STRIVE Programme<br />
addresses the need for research in Irel<strong>and</strong> to inform policy makers <strong>and</strong> other stakeholders on a range<br />
of questions in relation to environmental protection. These reports are intended as contributions to the<br />
necessary debate on the protection of the environment.<br />
EPA STRIVE PROGRAMME 2007–2013<br />
Published by the Environmental Protection Agency, Irel<strong>and</strong><br />
PRINTED ON RECYCLED PAPER<br />
ISBN: 978-1-84095-148-6<br />
Price: Free<br />
Online version<br />
ii
Details of Project Partners<br />
Kenneth A. Byrne<br />
Centre for Hydrology, Micrometeorology<br />
<strong>and</strong> Climate Change<br />
Department of Civil <strong>and</strong><br />
Environmental Engineering<br />
<strong>University</strong> <strong>College</strong> <strong>Cork</strong><br />
Irel<strong>and</strong><br />
Tel.: +353-(0)21-4903025<br />
E-mail: k.byrne@ucc.ie<br />
Ger Kiely<br />
Centre for Hydrology, Micrometeorology<br />
<strong>and</strong> Climate Change<br />
Department of Civil <strong>and</strong><br />
Environmental Engineering<br />
<strong>University</strong> <strong>College</strong> <strong>Cork</strong><br />
Irel<strong>and</strong><br />
Tel.: +353-(0)21-4902965<br />
E-mail: g.kiely@ucc.ie<br />
iii
Table of Contents<br />
Acknowledgements<br />
Disclaimer<br />
Details of Project Partners<br />
Executive Summary<br />
ii<br />
ii<br />
iii<br />
vii<br />
1 Introduction 1<br />
2 Use of the <strong>RothC</strong>, <strong>CENTURY</strong>, <strong>DNDC</strong> <strong>and</strong> <strong>PaSim</strong> Models for Modelling Soil<br />
Organic Carbon Stock Changes in Grassl<strong>and</strong>s 2<br />
2. 1 Background 2<br />
2.2 Objective 2<br />
2.3 Description of Models 2<br />
2.4 Discussion 13<br />
3 Effect of Future Climate Change on Soil Carbon Stocks in Irish Grassl<strong>and</strong>s<br />
– A Model Comparison 17<br />
3.1 Introduction 17<br />
3.2 Materials <strong>and</strong> Methods 18<br />
3.3 Results 22<br />
3.4 Discussion 26<br />
4 Conclusions <strong>and</strong> Recommendations 28<br />
References 29<br />
Acronyms 35<br />
v
Executive Summary<br />
Biogeochemical models are increasingly used to simulate<br />
greenhouse gas (GHG) exchange <strong>and</strong> carbon (C) cycling<br />
in terrestrial ecosystems. Models enable the integration<br />
of processes <strong>and</strong> can be upscaled from plot to field <strong>and</strong><br />
regional scale. In addition, such models are becoming<br />
increasingly important in the development of GHG<br />
accounting systems. There is a need to investigate the<br />
applicability of such models to the major ecosystem types<br />
in Irel<strong>and</strong>.<br />
A literature review was carried out to evaluate the use<br />
of the <strong>RothC</strong>, <strong>CENTURY</strong>, <strong>DNDC</strong> <strong>and</strong> <strong>PaSim</strong> models for<br />
modelling soil organic carbon (SOC) stock changes in Irish<br />
grassl<strong>and</strong>s (Chapter 2). <strong>RothC</strong>, <strong>CENTURY</strong> <strong>and</strong> <strong>DNDC</strong><br />
have simulated SOC stock changes in mineral soils under<br />
grassl<strong>and</strong>, arable <strong>and</strong> forest cover. <strong>PaSim</strong> has not been<br />
used similarly. Based on this review, <strong>CENTURY</strong> <strong>and</strong> <strong>RothC</strong><br />
are the most suitable models for simulating SOC stock<br />
changes in grassl<strong>and</strong> soils in Irel<strong>and</strong>. Where assessments<br />
of nitrous oxide (N 2 O) emissions are to be carried out in<br />
t<strong>and</strong>em with SOC stock change investigations, the <strong>DNDC</strong><br />
model should be considered.<br />
The potential response to climate change of SOC stocks<br />
in two grassl<strong>and</strong> sites in Irel<strong>and</strong> with contrasting soil<br />
<strong>and</strong> climatic conditions was assessed using the <strong>RothC</strong>,<br />
<strong>CENTURY</strong> <strong>and</strong> <strong>DNDC</strong> models (Section 3). The future<br />
climate was simulated using regionally downscaled datasets<br />
for the period 2021–2060 for a range of Intergovernmental<br />
Panel on Climate Change (IPCC) emission scenarios. All<br />
three models predicted a reduction in SOC stocks at the<br />
<strong>Cork</strong> site, with variation between models <strong>and</strong> scenarios.<br />
The range of reduction of SOC was 1.9 to 7.4 t C ha –1 ,<br />
equivalent to a per cent loss range of 1.4 to 5.4%. At the<br />
Wexford site, the <strong>CENTURY</strong> <strong>and</strong> <strong>DNDC</strong> models predicted<br />
small changes in SOC, while <strong>RothC</strong> predicted losses of<br />
2.3 to 4.4 t C ha –1 , equivalent to a per cent loss range<br />
of 2.9 to 5.7%. Although these models should be tested<br />
at more sites, <strong>RothC</strong> <strong>and</strong> <strong>CENTURY</strong> appear to be more<br />
suitable than <strong>DNDC</strong> for simulating future changes in SOC<br />
stocks in Irish soils.<br />
There is an urgent need to establish experiments which<br />
will provide data on long-term changes in SOC stocks,<br />
<strong>and</strong> provide a sound basis for further model comparisons<br />
<strong>and</strong> regional- <strong>and</strong> national-scale assessments. Suitable<br />
datasets relating to climate, soils <strong>and</strong> l<strong>and</strong> management<br />
should be collated <strong>and</strong> harmonised so that a geographic<br />
information system (GIS)-based platform for model<br />
upscaling can be developed <strong>and</strong> information gaps<br />
identified.<br />
vii
viii
Evaluation of Models (<strong>PaSim</strong>, <strong>RothC</strong>, <strong>CENTURY</strong> <strong>and</strong> <strong>DNDC</strong>)<br />
for Simulation of Grassl<strong>and</strong> Carbon Cycling at Plot, Field <strong>and</strong> Regional Scale<br />
1 Introduction<br />
Anthropogenic activity is driving the enrichment of<br />
greenhouse gases (GHGs) in the atmosphere, with fossil<br />
fuel usage <strong>and</strong> l<strong>and</strong>-use change being the principal<br />
agents for CO 2 , <strong>and</strong> agriculture being the principal source<br />
of methane (CH 4 ) <strong>and</strong> nitrous oxide (N 2 O). It is now<br />
widely accepted that this is causing climate change which<br />
could result in more extreme weather events, with severe<br />
implications for ecosystems, health, infrastructure <strong>and</strong><br />
property. The terrestrial biosphere is a key component of<br />
the global carbon (C) cycle, with soils being estimated to<br />
contain 2011 Pg (1 Pg = 1 Gt = 10 15 g) of organic C to<br />
1 m depth. This is about four times the amount of C in<br />
vegetation <strong>and</strong> twice the amount in the atmosphere (Bolin<br />
et al. 2000). Although estimates of human emissions are<br />
relatively well understood, less is known about how GHGs<br />
are cycled between ecosystems <strong>and</strong> the atmosphere, <strong>and</strong><br />
how climate change could perturb these cycles. In addition<br />
to this there is a need for scientific tools to account for<br />
GHG balances in different l<strong>and</strong>-use systems <strong>and</strong> to<br />
support national GHG reporting requirements pursuant<br />
to the United Nations Framework Convention on Climate<br />
Change <strong>and</strong> its Kyoto Protocol.<br />
Grassl<strong>and</strong>s are one of the Earth’s most abundant l<strong>and</strong><br />
cover types <strong>and</strong> account for approximately 40.5% of the<br />
terrestrial l<strong>and</strong> area (White et al. 2000). There is a growing<br />
body of knowledge about CO 2 exchange at field <strong>and</strong><br />
l<strong>and</strong>scape level (e.g. Flanagan et al. 2002; Gilmanov et<br />
al. 2007; Novick et al. 2004) which shows that grassl<strong>and</strong><br />
can act as both a source <strong>and</strong> a sink of CO 2 . Grassl<strong>and</strong> is<br />
the dominant l<strong>and</strong> use in Irel<strong>and</strong>. Eaton et al. (in press)<br />
estimated that, in 2000, grassl<strong>and</strong>s accounted for 53.3%<br />
of the l<strong>and</strong> area of Irel<strong>and</strong> <strong>and</strong> 25% of soil organic carbon<br />
(SOC) stocks to 1 m depth. Studies using eddy covariance<br />
(Jaksic et al. 2006a) <strong>and</strong> chamber techniques (Byrne et<br />
al. 2005) suggest that Irish grassl<strong>and</strong>s are moderate sinks<br />
for CO 2 .<br />
Biogeochemical models are increasingly used to<br />
simulate GHG exchange <strong>and</strong> carbon cycling in terrestrial<br />
ecosystems. Models enable the integration of processes<br />
<strong>and</strong> can be upscaled from plot to field <strong>and</strong> regional scale.<br />
In addition, such models are becoming increasingly<br />
important in the development of GHG accounting systems.<br />
There is a need to investigate the applicability of models<br />
to simulate <strong>and</strong> predict carbon stocks <strong>and</strong> GHG exchange<br />
in Irish grassl<strong>and</strong>s. Given this background, this study had<br />
the following objectives.<br />
1 To conduct a literature review of the <strong>RothC</strong>, <strong>CENTURY</strong>,<br />
<strong>DNDC</strong> <strong>and</strong> <strong>PaSim</strong> models, <strong>and</strong> to evaluate their use<br />
for modelling SOC stock changes in Irish grassl<strong>and</strong>s<br />
(Section 2).<br />
2 To use the <strong>RothC</strong>, <strong>CENTURY</strong> <strong>and</strong> <strong>DNDC</strong> models to<br />
investigate the potential response to climate change<br />
of SOC stocks in two grassl<strong>and</strong> sites in Irel<strong>and</strong> with<br />
contrasting soil <strong>and</strong> climatic conditions.<br />
1
Byrne <strong>and</strong> Kiely (2005-FS-32-M1)<br />
2 Use of the <strong>RothC</strong>, <strong>CENTURY</strong>, <strong>DNDC</strong> <strong>and</strong> <strong>PaSim</strong> Models<br />
for Modelling Soil Organic Carbon Stock Changes in<br />
Grassl<strong>and</strong>s<br />
2. 1 Background<br />
Biogeochemical models are an increasingly used tool in<br />
studies of biosphere–atmosphere exchange of GHGs.<br />
There are a number of reasons for this. The carbon cycle<br />
is very complex <strong>and</strong> multilayered <strong>and</strong> it is therefore not<br />
possible to measure experimentally all of its components<br />
across the range of temporal <strong>and</strong> spatial scales necessary.<br />
For example, measuring changes in SOC stocks in<br />
extremely difficult because soils are highly variable <strong>and</strong><br />
models are frequently used to estimate current <strong>and</strong> future<br />
stock changes. While models are not a substitute for<br />
measurements, they do allow integration of processes<br />
<strong>and</strong> advance the underst<strong>and</strong>ing of same. In addition,<br />
once models are adequately calibrated, they can be used<br />
to investigate the effect of changes in management <strong>and</strong><br />
climate, as well as providing a research tool which can be<br />
used to upscale from plot to field <strong>and</strong> regional level.<br />
2.2 Objective<br />
The objective of this chapter is to review the relevant<br />
literature in relation to the existing models <strong>RothC</strong>,<br />
<strong>CENTURY</strong>, <strong>DNDC</strong> <strong>and</strong> <strong>PaSim</strong> <strong>and</strong> to evaluate their<br />
application to SOC stock changes in grassl<strong>and</strong>s at plot,<br />
field <strong>and</strong> regional scales.<br />
2.3 Description of Models<br />
2.3.1 <strong>RothC</strong><br />
The Rothamsted Carbon model (<strong>RothC</strong>) is a processbased<br />
model of carbon turnover in non-waterlogged soils.<br />
It was developed at Rothamsted Research in the UK<br />
using data from the Rothamsted long-term experiments<br />
(Hart 1984; Jenkinson et al. 1987; Jenkinson <strong>and</strong> Rayner<br />
1977). It was originally developed for <strong>and</strong> parameterised<br />
to model the turnover of organic carbon in arable soils<br />
at plot level under a range of soil <strong>and</strong> climatic conditions<br />
(Coleman <strong>and</strong> Jenkinson 1996). It has been extended to<br />
model turnover at plot level in grassl<strong>and</strong> (Coleman et al.<br />
1997) <strong>and</strong> forest sites (Falloon <strong>and</strong> Smith 2002; Smith et<br />
al. 2006). It models the effects of soil type, temperature,<br />
moisture content <strong>and</strong> plant cover on carbon turnover in<br />
non-waterlogged soils. It uses a monthly time step to<br />
calculate total organic carbon (t ha –1 ), microbial biomass<br />
carbon (t ha –1 ) <strong>and</strong> 14°C (from which the radiocarbon<br />
age of the soil can be calculated) on a year to centuries<br />
timescale (Jenkinson 1990; Jenkinson et al. 1991;<br />
Jenkinson <strong>and</strong> Coleman 1994; Jenkinson et al. 1992).<br />
The model calculates the SOC stock on an annual basis<br />
from which the rate of change can be inferred. The <strong>RothC</strong><br />
website is at http://www.rothamsted.bbsrc.ac.uk/aen/<br />
carbon/rothc.htm. As <strong>RothC</strong> does not work well for organic<br />
soils, a new model, ECOSSE, has been developed as an<br />
alternative (Smith et al. 2007b).<br />
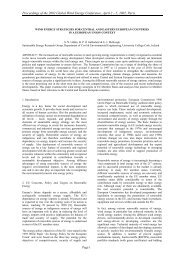
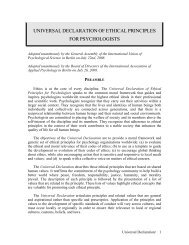
2.3.1.1 Structure of <strong>RothC</strong><br />
At the start of the <strong>RothC</strong> simulation, SOC (t C ha –1 ) is<br />
divided into decomposable plant material (DPM) <strong>and</strong><br />
resistant plant material (RPM), both of which decompose<br />
by first-order kinetics to give CO 2 (which is lost from the<br />
system), microbial biomass (BIO) <strong>and</strong> humified organic<br />
matter (HUM). SOC is split into four active compartments<br />
<strong>and</strong> a small amount of inert organic matter (IOM). The four<br />
active compartments are DPM, RPM, BIO <strong>and</strong> HUM. Each<br />
compartment decomposes by a first-order process with its<br />
own characteristic rate. The IOM compartment is resistant<br />
to decomposition. The structure of the model is shown in<br />
Figure 2.1.<br />
Incoming plant carbon is split between DPM <strong>and</strong> RPM,<br />
depending on the DPM/RPM ratio of the particular<br />
incoming plant material. For example, for most agricultural<br />
<strong>and</strong> improved grassl<strong>and</strong>, <strong>RothC</strong> uses a DPM/RPM ratio<br />
of 1.44, i.e. 59% of the plant material is DPM <strong>and</strong> 41% is<br />
RPM. For deciduous or tropical woodl<strong>and</strong> a DPM/RPM<br />
2
compartments<strong>and</strong>asmaamountonertorancmatterIOM).heouractecompartmentsareDPM<br />
RPMBIO<strong>and</strong>HUM.achcompartmentdecomposesbyarstorderprocesswthtsowncharacterstc<br />
rate.heIOMcompartment Evaluation sresstanttodecomposton.hestructureothemodesshownnure<br />
of Models (<strong>PaSim</strong>, <strong>RothC</strong>, <strong>CENTURY</strong> <strong>and</strong> <strong>DNDC</strong>)<br />
for Simulation of Grassl<strong>and</strong> Carbon Cycling at Plot, Field <strong>and</strong> Regional Scale<br />
2.1.<br />
<br />
DPM<br />
Decay<br />
RPM:resstantpantmateratCha 1 )<br />
DPM:decomposabepantmateratCha 1 )<br />
BIO:mcrobabomasstCha 1 )<br />
HUM:humedorancmattertCha 1 )<br />
Oranc<br />
IOM:nertorancmattertCha 1 )<br />
nputs<br />
CO 2<br />
RPM<br />
Decay<br />
BIO<br />
Decay<br />
HUM<br />
Decay<br />
CO 2<br />
BIO<br />
Decay<br />
IOM<br />
HUM<br />
<br />
Figure 2.1 Partitioning of the basic components of organic matter in the soil in <strong>RothC</strong> (Coleman <strong>and</strong> Jenkinson 2005).<br />
<br />
<br />
<br />
bottomIOMbo<br />
connectedtoa<br />
IncomnpantcarbonssptbetweenDPM<strong>and</strong>RPMdependnontheDPM/RPMratoothepartcuar<br />
ratio of 0.25 is used, so 20% is DPM <strong>and</strong> 80% is RPM. into the pools DPM, RPM, BIO <strong>and</strong> HUM. It also estimates<br />
ncomn pant matera. or eampe or most arcutura <strong>and</strong> mproed rass<strong>and</strong> <strong>RothC</strong> uses a<br />
All incoming plant material passes through these two the loss of CO 2 (t C ha –1 ) due to decomposition of organic<br />
DPM/RPMratoo1..e.othepantmaterasDPM<strong>and</strong>1sRPM.ordecduousortropca<br />
compartments once.<br />
matter <strong>and</strong> can be used to assess the dynamics of 13 C.<br />
wood<strong>and</strong>aDPM/RPMratoo.2susedso2sDPM<strong>and</strong>sRPM.ncomnpantmatera<br />
Both DPM passesthrouhthesetwocompartmentsonce.<br />
<strong>and</strong> RPM decompose to form CO 2 (which is 2.3.1.4 Use <strong>and</strong> performance of <strong>RothC</strong><br />
emitted to the atmosphere), BIO <strong>and</strong> HUM. The proportion<br />
that goes to CO 2 <strong>and</strong> to BIO + HUM is determined by the<br />
clay content of the soil. The BIO + HUM is then split into<br />
46% BIO <strong>and</strong> 54% HUM. BIO <strong>and</strong> HUM both decompose<br />
<br />
to form more CO 2 , BIO <strong>and</strong> HUM. Farmyard manure<br />
(FYM) is assumed to be more decomposed than normal<br />
plant material. It is split in the following way: DPM 49%,<br />
RPM 49% <strong>and</strong> HUM 2%.<br />
2.3.1.2 Inputs to <strong>RothC</strong><br />
<strong>RothC</strong> operates on a monthly time step <strong>and</strong> its major input<br />
variables are soil texture <strong>and</strong> weather data. These are<br />
listed in Table 2.1.<br />
2.3.1.3 Outputs from <strong>RothC</strong><br />
The <strong>RothC</strong> model estimates the total SOC stock<br />
(t C ha –1 ) at monthly or annual intervals <strong>and</strong> partitions it<br />
<br />
As stated above, <strong>RothC</strong> was originally developed for<br />
arable soils but has been extended to other site types.<br />
It has been successfully applied to long-term, plot-level<br />
experiments across a range of soil <strong>and</strong> climatic conditions,<br />
including grassl<strong>and</strong>, cropl<strong>and</strong> <strong>and</strong> forest soils in the UK<br />
(Coleman et al. 1997); forest soils in the USA (Coleman<br />
et al. 1997); <strong>and</strong> arable soils in Germany (Coleman et al.<br />
1997), Australia (Coleman et al. 1997), the Czech Republic<br />
(Coleman et al. 1997), China (Guo et al. 2007; Yang et<br />
al. 2003) <strong>and</strong> Kenya (Kamoni et al. 2007b) (Table 2.2).<br />
It has also been used to simulate SOC changes in various<br />
arable rotations, including s<strong>and</strong>y soils in Thail<strong>and</strong> (Wu et<br />
al. 1998) <strong>and</strong> calcareous clay soils in Syria (Jenkinson<br />
et al. 1999). Marked deviations from experimental data<br />
have been reported by Ludwig (2005) for maize cultivation<br />
on a silty soil in Germany, <strong>and</strong> by Lobe et al. (2005) for<br />
3
Byrne <strong>and</strong> Kiely (2005-FS-32-M1)<br />
Table 2.1 Summary inputs to <strong>RothC</strong>.<br />
Time step Meteorology Soil <strong>and</strong> plant Management<br />
Month<br />
Precipitation (mm)<br />
1 Open-pan evaporation<br />
(mm)<br />
2 Average air<br />
temperature (°C)<br />
3 Clay content (%)<br />
Depth of soil sample (cm)<br />
4 Estimate of decomposability of incoming plant<br />
material<br />
5 Soil cover<br />
6 Monthly input of plant residues (t C ha –1 )<br />
7 Monthly input of farmyard manure (t C ha –1 )<br />
1 Rainfall <strong>and</strong> open-pan evaporation are used to calculate the topsoil moisture deficit (mm) (TSMD), as it is easier to obtain rainfall <strong>and</strong> pan evaporation data,<br />
from which the TSMD is calculated, rather than monthly measurements of the actual topsoil moisture deficit.<br />
2 Air temperature is used rather than soil temperature because it is more easily obtainable for most sites. For the Rothamsted Research station, monthly air<br />
temperature satisfactorily represents the monthly mean soil temperature in the surface 20 cm, showing a difference of only +1 o C of the annual minimum <strong>and</strong> –1 o C<br />
of the annual maximum (Coleman <strong>and</strong> Jenkinson 2005).<br />
3 Clay content is used to calculate how much plant-available water the topsoil can hold; it also affects the way organic matter decomposes. For a description of how<br />
decomposition rate constants <strong>and</strong> TSMD are calculated see Coleman <strong>and</strong> Jenkinson (2005).<br />
4 An estimate of the decomposability of the incoming plant material – the DPM/RPM ratio (t C ha –1 / t C ha –1 ) (discussed above). Guideline values are given in the<br />
<strong>RothC</strong> manual (Coleman <strong>and</strong> Jenkinson 2005).<br />
5 It is necessary to indicate whether or not the soil is vegetated because decomposition has been found to be faster in fallow soil than in cropped soil, even when<br />
the cropped soil is not allowed to dry out (Jenkinson et al. 1987; Sommers et al. 1981; Sparling et al. 1982). In the model input files the soil cover is classified as<br />
‘fallow’ or ‘covered’ on a monthly basis.<br />
6 The plant residue input is the amount of carbon that is put into the soil per month (t C ha –1 ), including carbon released from roots during crop growth. As this<br />
input is rarely known, the model is most often run ‘in reverse’, generating input from known soil, site <strong>and</strong> weather data.<br />
7 The amount of FYM (t C ha –1 ) put on the soil, if any, is input separately, because FYM is treated slightly differently from inputs of fresh plant residues.<br />
coarse textured arable soils in South Africa. Coleman<br />
<strong>and</strong> Jenkinson (2005) advise that it should be used<br />
cautiously on subsoils, soils developed on recent volcanic<br />
ash, <strong>and</strong> tundra <strong>and</strong> taiga soils, <strong>and</strong> not at all on soils<br />
that are permanently waterlogged. <strong>RothC</strong> has also been<br />
applied successfully in simulating changes in SOC stocks<br />
due to l<strong>and</strong>-use change. Romanya et al. (2000) used a<br />
chronosequence approach to study changes in SOC after<br />
afforestation of Mediterranean agricultural soils <strong>and</strong> found<br />
that the changes in SOC were accurately simulated by<br />
<strong>RothC</strong>. Cerri et al. (2003; 2007a) used data from 11 site<br />
specific ‘forest to pasture’ chronosequences in the Brazilian<br />
Amazon <strong>and</strong> found that <strong>RothC</strong> accurately simulated<br />
the decline in SOC following clearance <strong>and</strong> conversion<br />
to grassl<strong>and</strong>.<br />
The <strong>RothC</strong> model has been linked to spatial databases<br />
(or GISs) to estimate changes in regional SOC stocks.<br />
This has a number of advantages in that it allows the<br />
local soil attributes, meteorological conditions <strong>and</strong> l<strong>and</strong><br />
use to be taken into account, enables dynamic estimates,<br />
facilitates scenario analysis <strong>and</strong> allows areas of particular<br />
SOC sequestration to be identified. The first such analysis<br />
was that carried out by Falloon et al. (1998b). The future<br />
SOC stock changes in an area of 24,804 km 2 in Hungary<br />
were predicted by combining <strong>RothC</strong> with soil data for<br />
351 polygons with unique soil, l<strong>and</strong> form, lithology, l<strong>and</strong><br />
use <strong>and</strong> meteorological data. Falloon et al. (2006) have<br />
combined <strong>RothC</strong> with 1 km × 1 km soils, l<strong>and</strong> use <strong>and</strong> l<strong>and</strong>use<br />
change data with climatic data to develop a system<br />
which can be used to investigate the effects of changes<br />
in l<strong>and</strong> use, l<strong>and</strong> management <strong>and</strong> climate change on<br />
national SOC stocks in the UK (including Northern Irel<strong>and</strong>).<br />
Smith et al. (2006) have used a similar approach, at<br />
18 km × 18 km resolution, to estimate the changes in<br />
mineral soils in European forests for the period 1990–<br />
2100. Using the same resolution, Smith (2005) estimated<br />
changes in SOC stocks of European cropl<strong>and</strong>s <strong>and</strong><br />
grassl<strong>and</strong>s during the period 1990–2080. More recently,<br />
Smith et al. (2007a) estimated changes in SOC stocks of<br />
cropl<strong>and</strong> mineral soils of European Russia <strong>and</strong> the Ukraine<br />
during the period 1990–2070 (resolution not stated). <strong>RothC</strong><br />
has also been combined with spatial data to predict SOC<br />
stock in Kenya between 1990 <strong>and</strong> 2030 (Cerri et al. 2007b),<br />
in the Brazilian Amazon between 2000 <strong>and</strong> 2030 (Kamoni<br />
et al. 2007a), <strong>and</strong> in Jordan between 2000 <strong>and</strong> 2030<br />
(Al-Adamat et al. 2007).<br />
4
Evaluation of Models (<strong>PaSim</strong>, <strong>RothC</strong>, <strong>CENTURY</strong> <strong>and</strong> <strong>DNDC</strong>)<br />
for Simulation of Grassl<strong>and</strong> Carbon Cycling at Plot, Field <strong>and</strong> Regional Scale<br />
Table 2.2 Synthesis of published studies using <strong>RothC</strong> to simulate changes in SOC in long-term experiments.<br />
Country Climate Ecosystem Site comments Performance Reference<br />
Rothamsted, UK Temperate Forest Geescroft Wilderness,<br />
naturally regenerated<br />
forest<br />
Good reproduction of increase<br />
in soil C <strong>and</strong> radiocarbon<br />
content of soil C<br />
Coleman et al. (1997)<br />
Rothamsted, UK Temperate Fallow Highfield Bare Fallow,<br />
grazed until 1959,<br />
fallow thereafter<br />
Measured decline in soil C<br />
initially faster than <strong>RothC</strong>, but<br />
gap narrowed<br />
Coleman et al. (1997)<br />
Rothamsted, UK Temperate Grassl<strong>and</strong> Park-grass<br />
experiment, grassl<strong>and</strong><br />
for 300 years<br />
Reasonable fit to changes<br />
in soil C in unmanured <strong>and</strong><br />
fertilised plots.<br />
Poor reproduction in plots<br />
treated with FYM <strong>and</strong> fishmeal<br />
Coleman et al. (1997)<br />
Ruzynê, Czech<br />
Republic<br />
Cool, temperate Arable Ruzynê experiment,<br />
continuous cultivation<br />
for 100s of years<br />
Good agreement with<br />
measurements for fertilised<br />
plots. Poor agreement in plots<br />
receiving N <strong>and</strong> FYM due to<br />
variability in measurements<br />
Coleman et al. (1997)<br />
Tamworth,<br />
Australia<br />
Temperate,<br />
subtropical<br />
Arable<br />
Tamworth experiment,<br />
cultivation for 130<br />
years<br />
Poor fit to measurements Coleman et al. (1997)<br />
Waite, Australia<br />
Temperate,<br />
subtropical<br />
Arable<br />
Decline in soil C due to<br />
cultivation reproduced well<br />
Coleman et al. (1997)<br />
China Cool, temperate Arable Long-term fertilisation<br />
trial<br />
Accurate simulation of changes<br />
in soil C<br />
Yang et al. (2003)<br />
China Cool, temperate Arable Long-term fertilisation<br />
trial<br />
Accurate simulation of changes<br />
in soil C<br />
Yang et al. (2003)<br />
China Cool, temperate Arable Long-term experiments<br />
set up in early 1980s<br />
Accurate simulation of changes<br />
in soil C<br />
Guo et al. (2007)<br />
Kenya Tropical Arable Two experiments, 26<br />
<strong>and</strong> 13 years long<br />
Good agreement with<br />
measurements, but poor for<br />
intercropping<br />
Kamoni et al. (2007b)<br />
2.3.2 <strong>CENTURY</strong><br />
<strong>CENTURY</strong> was originally developed for grassl<strong>and</strong> soils<br />
(Parton et al. 1987) but has been widely used for arable<br />
(e.g. Falloon <strong>and</strong> Smith 2002) <strong>and</strong> forest soils (e.g.<br />
Kirschbaum <strong>and</strong> Paul 2002). Similarly to <strong>RothC</strong> it operates<br />
on a monthly time step <strong>and</strong> its major input variables are<br />
soil texture <strong>and</strong> weather data.<br />
The <strong>CENTURY</strong> model simulates the long-term dynamics<br />
of C, nitrogen (N), phosphorus (P) <strong>and</strong> sulphur (S) for<br />
different plant–soil systems. The model can simulate the<br />
dynamics of grassl<strong>and</strong> systems, agricultural crop systems,<br />
forest systems <strong>and</strong> savannah systems. The grassl<strong>and</strong>/<br />
crop <strong>and</strong> forest systems have different plant production<br />
submodels that are linked to a common soil organic matter<br />
(SOM) submodel. The savannah submodel uses the<br />
grassl<strong>and</strong>/crop <strong>and</strong> forest subsystems <strong>and</strong> allows for the<br />
two subsystems to interact through shading effects <strong>and</strong><br />
nitrogen competition. The SOM submodel simulates the<br />
flow of C, N, P <strong>and</strong> S through plant litter <strong>and</strong> the different<br />
inorganic <strong>and</strong> organic pools in the soil. The model runs<br />
using a monthly time step. A detailed description of the<br />
model (<strong>CENTURY</strong> 4) <strong>and</strong> the user manual are available<br />
at http://www.nrel.colostate.edu/projects/century/nrel.htm.<br />
Model documentation is available in Parton et al. (1992).<br />
5
Byrne <strong>and</strong> Kiely (2005-FS-32-M1)<br />
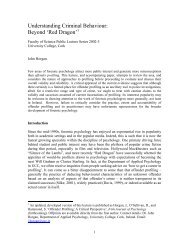
2.3.2.1 Structure of <strong>CENTURY</strong><br />
The soil organic matter submodel is based on multiple<br />
compartments for SOM <strong>and</strong> is similar to other models of<br />
SOM dynamics (Jenkinson 1990; Jenkinson <strong>and</strong> Rayner<br />
1977; van Veen <strong>and</strong> Paul 1981). Figure 2.2 illustrates<br />
the pools <strong>and</strong> flows of carbon in <strong>CENTURY</strong>. The model<br />
includes three soil organic matter pools (active, slow <strong>and</strong><br />
passive) with different potential decomposition rates,<br />
above-ground <strong>and</strong> below-ground litter pools, <strong>and</strong> a surface<br />
microbial pool, which is associated with decomposing<br />
surface litter.<br />
Figure 2.2 Structure of the soil carbon submodel in <strong>CENTURY</strong> (Parton et al. 1992).<br />
6
Evaluation of Models (<strong>PaSim</strong>, <strong>RothC</strong>, <strong>CENTURY</strong> <strong>and</strong> <strong>DNDC</strong>)<br />
for Simulation of Grassl<strong>and</strong> Carbon Cycling at Plot, Field <strong>and</strong> Regional Scale<br />
Table 2.3 Summary inputs to <strong>CENTURY</strong>.<br />
Time step Meteorology Soil <strong>and</strong> plant Management<br />
Month<br />
Precipitation (mm)<br />
Clay content (%)<br />
2 Lignin content of plant material<br />
Average maximum <strong>and</strong><br />
minimum air temperature (°C)<br />
Depth of soil sample (cm)<br />
1 Initial soil C, N, P <strong>and</strong> S levels (g m –2 )<br />
3 Atmospheric <strong>and</strong> soil N inputs (g N m –2 yr –1 )<br />
1 The user can choose to run the model considering only C <strong>and</strong> N dynamics, or C, N <strong>and</strong> P, or C, N, P <strong>and</strong> S.<br />
2 This can generally be estimated from existing literature.<br />
3 Inputs of N in fertiliser <strong>and</strong> animal slurry or manure application should be available from management records. Atmospheric inputs of N can be estimated<br />
from literature.<br />
2.3.2.2 Inputs to <strong>CENTURY</strong><br />
The <strong>CENTURY</strong> model operates on a monthly time step<br />
<strong>and</strong> its major input variables are soil texture <strong>and</strong> weather<br />
data. These are listed in Table 2.3.<br />
2.3.2.3 Use <strong>and</strong> performance of <strong>CENTURY</strong><br />
As stated above, <strong>CENTURY</strong> was originally developed for<br />
pasture soils but has been extended to other site types.<br />
Parton et al. (1993) tested <strong>CENTURY</strong> using observed<br />
data from 11 temperate <strong>and</strong> tropical grassl<strong>and</strong>s around<br />
the world. They found that soil C <strong>and</strong> N levels could be<br />
simulated to within ±25% of the observed values (100 <strong>and</strong><br />
75% of the time respectively) for a diverse set of soils.<br />
<strong>CENTURY</strong> has been successfully applied to long-term,<br />
plot-level experiments across a range of soil <strong>and</strong> climatic<br />
conditions (Table 2.4), including grassl<strong>and</strong>, cropl<strong>and</strong> <strong>and</strong><br />
forest soils in the UK (Kelly et al. 1997); forest soils in the<br />
USA (Kelly et al. 1997); arable soils in Germany (Kelly<br />
et al. 1997), Denmark (Foereid <strong>and</strong> Høgh-Jensen 2004),<br />
Australia (Kelly et al. 1997), the Czech Republic (Kelly<br />
et al. 1997) <strong>and</strong> Kenya (Cerri et al. 2007b); grassl<strong>and</strong><br />
soils in Germany (Werth et al. 2005) <strong>and</strong> grassl<strong>and</strong><br />
converted to continuous fallow in Russia (Mikhailova et<br />
al. 2000). <strong>CENTURY</strong> has also been applied successfully<br />
to chronosequence-based experiments. Romanya et<br />
al. (2000) used a chronosequence approach to study<br />
changes in SOC after afforestation of Mediterranean<br />
agricultural soils, <strong>and</strong> found that the changes in SOC were<br />
accurately simulated by <strong>CENTURY</strong>. Cerri et al. (2004;<br />
2007a) found that <strong>CENTURY</strong> was able to reproduce the<br />
change in SOC stocks following conversion of forest in the<br />
Brazilian Amazon to grassl<strong>and</strong>.<br />
The <strong>CENTURY</strong> model has also been linked to spatially<br />
defined datasets to make regional assessment of SOC<br />
stock changes with changing l<strong>and</strong> use <strong>and</strong> management.<br />
Burke et al. (1990) combined <strong>CENTURY</strong> with climate <strong>and</strong><br />
soil data to simulate spatial variability in carbon storage<br />
<strong>and</strong> fluxes within grassl<strong>and</strong> ecosystems in Colorado at 2.5<br />
km × 2.5 km resolution. Burke (1991) extended this work<br />
to cover the entire Great Plains <strong>and</strong> adjacent areas of<br />
the Central Lowl<strong>and</strong>s in the USA. Ardö <strong>and</strong> Olson (2003)<br />
combined <strong>CENTURY</strong> with l<strong>and</strong> use, climate <strong>and</strong> soil data<br />
to assess changes in SOC at 1 km × 1 km resolution over<br />
an area of 262,144 km 2 in Sudan. In a similar synthesis,<br />
Parton et al. (2004) estimated SOC stocks in Senegal<br />
during the period 1991–2001 at 10 km × 10 km resolution. It<br />
has been used to assess SOC stock changes in grassl<strong>and</strong><br />
soils in 16 states of the USA (Paustian et al. 2001) <strong>and</strong> in<br />
cropl<strong>and</strong>s of the USA (EPA 2006). In recent work it has<br />
been combined with spatial datasets to assess SOC stock<br />
changes in the Brazilian Amazon between 2000 <strong>and</strong> 2030<br />
(Cerri et al. 2007b), in Kenya between 1990 <strong>and</strong> 2030<br />
(Kamoni et al. 2007a), <strong>and</strong> in Jordan between 2000 <strong>and</strong><br />
2030 (Al-Adamat et al. 2007).<br />
2.3.3 <strong>DNDC</strong><br />
The denitrification–decomposition (<strong>DNDC</strong>) model is<br />
a process-based computer simulation model of soil C<br />
<strong>and</strong> N biogeochemistry (Li 1996, 1992a, b, 1994). The<br />
model operates at a daily time step <strong>and</strong> consists of two<br />
components. The first component, consisting of the soil<br />
climate, crop growth <strong>and</strong> decomposition submodels,<br />
predicts soil temperature, moisture, pH, redox potential (Eh)<br />
<strong>and</strong> substrate concentration profiles driven by ecological<br />
drivers (e.g. climate, soil, vegetation <strong>and</strong> anthropogenic<br />
7
Byrne <strong>and</strong> Kiely (2005-FS-32-M1)<br />
activity). The second component, consisting of the<br />
nitrification, denitrification <strong>and</strong> fermentation submodels,<br />
predicts NO, N 2 O, N 2 , CH 4 <strong>and</strong> NH 3 fluxes based on the<br />
modelled soil environmental factors. The entire model<br />
forms a bridge between C <strong>and</strong> N biogeochemical cycles<br />
<strong>and</strong> the basic ecological drivers. Further information<br />
on the model <strong>and</strong> the user manual are available at<br />
http://www.dndc.sr.unh.edu/.<br />
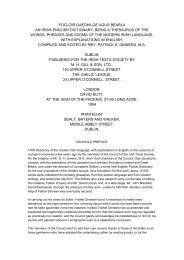
2.3.3.1 Structure of <strong>DNDC</strong><br />
In <strong>DNDC</strong>, SOC resides in four major pools: plant residue<br />
(i.e. litter), microbial biomass, humads (i.e. active humus)<br />
<strong>and</strong> passive humus. Each pool consists of two or three<br />
subpools with different specific decomposition rates.<br />
The daily decomposition rate for each subpool is regulated<br />
by the pool size, the specific decomposition rate, soil clay<br />
content, N availability, soil temperature <strong>and</strong> soil moisture.<br />
When SOC in a pool decomposes, the decomposed<br />
carbon is partially allocated into other SOC pools, <strong>and</strong><br />
partially lost as CO 2 . Dissolved organic carbon (DOC)<br />
is produced as an intermediate during decomposition,<br />
<strong>and</strong> can be immediately consumed by the soil microbes.<br />
The structure of the model is shown in Figure 2.3.<br />
Table 2.4 Synthesis of published studies using <strong>CENTURY</strong> to simulate changes in SOC in long-term experiments.<br />
Country Climate Ecosystem Site treatments Performance Reference<br />
Halle, Germany Temperate Arable Bad Lauchstädt long-term<br />
fertiliser experiment<br />
Good agreement between<br />
model <strong>and</strong> observations of<br />
soil C<br />
Kelly et al. (1997)<br />
Rothamsted,<br />
UK<br />
Temperate Grassl<strong>and</strong> Park-grass experiment,<br />
grassl<strong>and</strong> for 300 years<br />
Good reproduction of increase<br />
of soil C due to addition of<br />
FYM<br />
Kelly et al. (1997)<br />
Ruzynê, Czech<br />
Republic<br />
Cool,<br />
temperate<br />
Arable<br />
Ruzynê experiment,<br />
continuous cultivation for<br />
100s of years<br />
Good agreement with<br />
measurements for manured<br />
plots, poor agreement in<br />
control plots<br />
Kelly et al. (1997)<br />
Tamworth,<br />
Australia<br />
Temperate,<br />
subtropical<br />
Arable<br />
Tamworth experiment,<br />
cultivation for 130 years<br />
Good agreement with<br />
measurements<br />
Kelly et al. (1997)<br />
Waite, Australia<br />
Temperate,<br />
subtropical<br />
Arable<br />
Decline in soil C due to<br />
cultivation reproduced well<br />
Kelly et al. (1997)<br />
Rothamsted,<br />
UK<br />
Temperate Forest Geescroft Wilderness,<br />
naturally regenerated forest<br />
Observations suggest<br />
increasing soil C while model<br />
levels off<br />
Kelly et al. (1997)<br />
Carolina, USA<br />
Temperate,<br />
subtropical<br />
Forest<br />
Calhoun experimental<br />
Forest, plantation forest<br />
Good reproduction of increase<br />
in soil C following conversion<br />
from arable to forest<br />
Kelly et al. (1997)<br />
Kursk, Russia Continental Arable Grassl<strong>and</strong> converted to<br />
arable<br />
Successful simulation of soil C<br />
during 50 years of fallow<br />
Mikhailova et al.<br />
(2000)<br />
Asov, Denmark Temperate Arable 30-year experiment Good relationship between<br />
model <strong>and</strong> observations<br />
Foerid <strong>and</strong> Høgh-<br />
Jensen (2004)<br />
Baden-<br />
Württemberg,<br />
Germany<br />
Temperate Grassl<strong>and</strong> 27-year experiment Good relationship between<br />
model <strong>and</strong> observations<br />
Werth et al.<br />
(2005)<br />
Kenya Tropical Arable Two experiments, 26 <strong>and</strong> 13<br />
years long<br />
Good agreement with<br />
measurements<br />
Kamoni et al.<br />
(2007b)<br />
8
Evaluation of Models (<strong>PaSim</strong>, <strong>RothC</strong>, <strong>CENTURY</strong> <strong>and</strong> <strong>DNDC</strong>)<br />
for Simulation of Grassl<strong>and</strong> Carbon Cycling at Plot, Field <strong>and</strong> Regional Scale<br />
Ecological<br />
drivers<br />
Climate Soil Vegetation Human activity<br />
Annual<br />
average<br />
temp.<br />
LAI-regulated<br />
albedo.<br />
Soil temp.<br />
profile<br />
Soil moist.<br />
profile<br />
Soil climate<br />
Potential<br />
evapotrans.<br />
evap. trans.<br />
O 2<br />
diffusion<br />
Soil Eh<br />
profile<br />
Vertical<br />
water<br />
flow<br />
O 2<br />
use<br />
Water dem<strong>and</strong><br />
Water uptake<br />
Water stress<br />
Root respiration<br />
Plant growth<br />
N-dem<strong>and</strong><br />
N-uptake<br />
Daily growth<br />
roots<br />
stems<br />
Effect of temperature <strong>and</strong> moisture on decomposition<br />
grain<br />
Very labile Labile Resistant<br />
CO 2<br />
Labile Resistant<br />
NH 4<br />
+<br />
DOC<br />
Decomposition<br />
Labile Resistant<br />
Passive humus<br />
litter<br />
microbes<br />
humads<br />
Soil<br />
environmental<br />
factors<br />
Temperature Moisture pH<br />
Eh Substrates: NH 4<br />
+ , NO3<br />
- , DOC<br />
NO<br />
Nitrate<br />
denitrifier<br />
DOC<br />
DOC<br />
nitrifiers<br />
NH 4<br />
+<br />
Soil Eh<br />
CH 4<br />
production CH 4<br />
N 2<br />
O<br />
N 2<br />
NO 2<br />
-<br />
Denitrification<br />
Nitrite<br />
denitrifier<br />
N 2<br />
O<br />
denitrifier<br />
NO 3<br />
-<br />
NO 3<br />
-<br />
N 2<br />
O<br />
Nitrification<br />
NO<br />
NH 3 Clay<br />
NH<br />
+<br />
4<br />
NH 3<br />
aerenchyma<br />
DOC<br />
Fermentation<br />
CH 4<br />
oxidation<br />
CH 4<br />
transport<br />
Figure 2.3 Structure of the <strong>DNDC</strong> model (Li et al. 1997).<br />
9
Byrne <strong>and</strong> Kiely (2005-FS-32-M1)<br />
Table 2.5 Summary inputs to <strong>DNDC</strong>.<br />
Time<br />
step<br />
Meteorology Soil <strong>and</strong> plant Management<br />
Day<br />
Precipitation (mm)<br />
4 Soil texture<br />
10 Crop physiological <strong>and</strong> phenological<br />
Maximum air temperature (°C)<br />
Clay content (%)<br />
parameters<br />
Minimum air temperature (°C)<br />
Bulk density (g cm –3 )<br />
Amount <strong>and</strong> type of fertiliser applied (kg ha –1 )<br />
1 N concentration in rainfall<br />
pH<br />
Manure application (kg C ha –1 )<br />
(mg N l –1 )<br />
5 Field capacity (0–1)<br />
Duration of grazing season (days) <strong>and</strong> number<br />
2 Atmospheric background NH 3<br />
6 Wilting point (0–1)<br />
of animals (head ha –1 )<br />
conc. (µg N m –3 )<br />
Hydraulic conductivity (mm hr –1 )<br />
Time <strong>and</strong> number of grass cuttings (kg C ha –1 )<br />
3 Atmospheric background CO 2<br />
7 Porosity (0–1)<br />
conc. (ppm)<br />
Slope (%)<br />
Carbon content of surface soil (kg C kg –1 )<br />
8 Initial NO 3<br />
–<br />
content of surface soil (mg N kg –1 )<br />
9 Initial NH 4<br />
+<br />
content of surface soil (mg N kg –1 )<br />
1, 2 These can be determined from literature.<br />
2 These can be determined from literature. The default value is 0.06 µg N m –3 .<br />
3 This has a default value of 350 ppm.<br />
4 A range of soil texture classes are provided from which one can be chosen.<br />
5 Water-filled porosity at soil field capacity. When soil texture is selected a default value is provided. This can be changed by the user.<br />
6 Water-filled porosity at soil wilting point. When soil texture is selected a default value is provided. This can be changed by the user.<br />
7 The volume percentage of the total soil bulk not occupied by solid particles.<br />
8 Initial NO<br />
– 3 content of surface soil (mg N kg –1 ).<br />
9 Initial NH<br />
+ 4 content of surface soil (mg N kg –1 ).<br />
10 Default values for a range of crops are provided.<br />
2.3.3.2 Inputs to <strong>DNDC</strong><br />
The <strong>DNDC</strong> model operates on a daily time step <strong>and</strong> its<br />
major input variables are listed in Table 2.5.<br />
2.3.3.3 Use <strong>and</strong> performance of <strong>DNDC</strong><br />
The <strong>DNDC</strong> model has reproduced long <strong>and</strong> short-term<br />
changes in SOC across a range of soil types, l<strong>and</strong><br />
uses <strong>and</strong> climates, including bare soils with residue<br />
incorporation in Germany <strong>and</strong> Costa Rica (Li et al. 1997;<br />
1994); grassl<strong>and</strong> soils in Germany <strong>and</strong> the UK (Li et al.<br />
1997; 1994); <strong>and</strong> arable soils in the USA (Li et al. 1994),<br />
Germany, the Czech Republic, Australia (Li et al. 1997;<br />
1994) <strong>and</strong> China (Li et al. 2003) (Table 2.6).<br />
The <strong>DNDC</strong> model has been widely used for regional-scale<br />
assessments. Tang et al. (2006) estimated SOC stocks<br />
in cropl<strong>and</strong> soils in China by combining a GIS database<br />
(resolution not stated) of climate, soil properties, cropping<br />
systems <strong>and</strong> management practices with <strong>DNDC</strong>. Applying<br />
a similar approach, Sleutel et al. (2006a) estimated SOC<br />
stock changes in cropl<strong>and</strong>s in Fl<strong>and</strong>ers, northern Belgium,<br />
during 1990–2000 <strong>and</strong>, based on this, assessed the<br />
effect of management options of SOC stock changes<br />
during 2006–2012 (Sleutel et al. 2006b). Levy et al.<br />
(2007) simulated fluxes of CO 2 <strong>and</strong> N 2 O from European<br />
grassl<strong>and</strong>s at 50 km × 50 km resolution by combining<br />
<strong>DNDC</strong> with input datasets for grassl<strong>and</strong> area, climate,<br />
soils <strong>and</strong> nitrogen deposition in each grid cell. The typical<br />
grassl<strong>and</strong>-management regime within each grid cell<br />
was determined from a biogeographical classification<br />
of European grassl<strong>and</strong>s <strong>and</strong> consultation with national<br />
experts in each biogeographical region.<br />
Other applications of <strong>DNDC</strong> include simulation of N 2 O<br />
fluxes in grassl<strong>and</strong>s (Beheydt et al. 2007; Hsieh et al.<br />
2005; Saggar et al. 2007) <strong>and</strong> arable soils (Beheydt et al.<br />
2007; Farahbakhshazad et al. 2007; Tonitto et al. 2007),<br />
as well as CH 4 <strong>and</strong> N 2 O fluxes in rice fields (Babu et al.<br />
2006; Pathak et al. 2005). Li et al. (2000) linked <strong>DNDC</strong><br />
to a forest physiological model (i.e. PnET developed by<br />
Aber <strong>and</strong> Federer (1992)) to form a forest biogeochemical<br />
model, PnET-N-<strong>DNDC</strong>. This model has been used to<br />
predict carbon sequestration (Miehle et al. 2006) <strong>and</strong><br />
trace-gas emissions (Butterbach-Bahl et al. 2001) in forest<br />
ecosystems. A wetl<strong>and</strong> version of the model has also<br />
10
Evaluation of Models (<strong>PaSim</strong>, <strong>RothC</strong>, <strong>CENTURY</strong> <strong>and</strong> <strong>DNDC</strong>)<br />
for Simulation of Grassl<strong>and</strong> Carbon Cycling at Plot, Field <strong>and</strong> Regional Scale<br />
Table 2.6 Synthesis of published studies using <strong>DNDC</strong> to simulate changes in SOC in long- <strong>and</strong> short-term<br />
experiments.<br />
Country Climate Ecosystem Site treatments Performance Reference<br />
Costa Rica Tropical Bare soil Residue incorporation<br />
during 1 year<br />
Germany Temperate Bare soil Residue incorporation<br />
during 9 years<br />
Germany Temperate Grassl<strong>and</strong> Soil CO 2 emissions<br />
measured for 1 year<br />
Missouri, USA Temperate Arable Soil CO 2 emissions<br />
measured for 1 year<br />
Illinois, USA Temperate Arable Morrow plots, 86-year<br />
soil C dynamics<br />
Observed<br />
<strong>and</strong> modelled<br />
decomposition rates<br />
very similar<br />
Field <strong>and</strong> simulated<br />
results in good<br />
agreement<br />
Simulated annual CO 2<br />
flux slightly lower than<br />
measured<br />
Simulated annual<br />
CO 2 flux similar to<br />
measured<br />
Decline of soil C in all<br />
treatments simulated<br />
well<br />
Li et al. (1994)<br />
Li et al. (1994)<br />
Li et al. (1994)<br />
Li et al. (1994)<br />
Li et al. (1994)<br />
Rothamsted,<br />
UK<br />
Temperate Grassl<strong>and</strong> Park-grass experiment,<br />
grassl<strong>and</strong> for 300 years<br />
Good reproduction<br />
of change of soil C in<br />
plots managed for hay<br />
Li et al. (1997)<br />
Waite, Australia<br />
Temperate,<br />
subtropical<br />
Arable<br />
Decline in soil C<br />
due to cultivation<br />
reproduced well<br />
Li et al. (1997)<br />
Halle, Germany Temperate Arable Bad Lauchstädt longterm<br />
fertiliser experiment<br />
Good agreement<br />
between model<br />
<strong>and</strong> observations of<br />
increase in soil C<br />
Li et al. (1997)<br />
Tamworth,<br />
Australia<br />
Temperate,<br />
subtropical<br />
Arable<br />
Tamworth experiment,<br />
cultivation for 130 years<br />
Measurements<br />
variable but good<br />
agreement with model<br />
Li et al. (1997)<br />
Ruzynê, Czech<br />
Republic<br />
Cool, temperate Arable Ruzynê experiment,<br />
continuous cultivation for<br />
100s of years<br />
Good agreement<br />
with measurements<br />
for control plots,<br />
poor agreement in<br />
manured plots<br />
Li et al. (1997)<br />
China Temperate Arable Four-crop rotation<br />
experiments of 6–10<br />
years duration<br />
Modelled <strong>and</strong><br />
observed changes in<br />
soil C agree well<br />
Li et al. (2003)<br />
been developed, Wetl<strong>and</strong>-<strong>DNDC</strong>, to simulate C dynamics<br />
<strong>and</strong> CH 4 emissions in wetl<strong>and</strong> ecosystems (Zhang et al.<br />
2002). This version of <strong>DNDC</strong> has been further applied to<br />
forested wetl<strong>and</strong>s (Cui et al. 2005a; b).<br />
2.3.4 <strong>PaSim</strong><br />
The <strong>PaSim</strong> model is a process-based ecosystem model<br />
which simulates the carbon, nitrogen <strong>and</strong> water balances<br />
of the atmosphere–plant–soil system <strong>and</strong> can be used to<br />
predict dry-matter production of a fertilised <strong>and</strong> cut, mixedperennial<br />
meadow (Riedo et al. 1998). Extensions to the<br />
model have been carried out by Schmid et al. (2001)<br />
in relation to the production <strong>and</strong> emission of N 2 O from<br />
grassl<strong>and</strong>, <strong>and</strong> by Riedo et al. (2002) in relation to the<br />
exchange of ammonia with the atmosphere. More recently,<br />
Vuichard et al. (2007b) have adapted the model in relation<br />
to water stress, senescence <strong>and</strong> the effects of diet quality<br />
on the emissions of CH 4 from grazing animals.<br />
2.3.4.1 Structure of <strong>PaSim</strong><br />
The model has five submodels: soil physics, soil biology,<br />
plant, animal <strong>and</strong> microclimate (Figure 2.4). <strong>PaSim</strong><br />
is driven with hourly meteorological input data for<br />
radiation, air temperature, vapour pressure, wind speed,<br />
precipitation, <strong>and</strong> atmospheric concentration of CO 2 <strong>and</strong><br />
ammonia (NH 3 ). <strong>PaSim</strong> integrates the l<strong>and</strong>-management<br />
practices of grass cutting, grazing <strong>and</strong> the application of<br />
fertiliser <strong>and</strong> slurry.<br />
11
Byrne <strong>and</strong> Kiely (2005-FS-32-M1)<br />
Precipitation<br />
loalraiation<br />
Temperatre<br />
aporpressre<br />
CO 2 concentration<br />
Microclimate<br />
smoel<br />
Manaement<br />
options<br />
Plant<br />
smoel<br />
Animal<br />
smoel<br />
oilpysics<br />
smoel<br />
oilioloy<br />
smoel<br />
atercontent<br />
Temperatre<br />
Nfertilisation<br />
Neposition<br />
<br />
<br />
Figure<br />
<br />
2.4 Submodels, driving variables <strong>and</strong> internal fluxes of carbon, nitrogen <strong>and</strong> water in the <strong>PaSim</strong> model<br />
(from Riedo et al. 1998).<br />
<br />
The plant submodel was developed on the basis of the 2.3.4.2 Inputs to <strong>PaSim</strong><br />
Te Paimmoeloperatesonanorly time step anitsmaorinptarialesaresoiltetrean<br />
Hurley Pasture model (Thornley <strong>and</strong> Verbane 1989) <strong>and</strong><br />
eaterataTesearelisteinTale2<br />
The <strong>PaSim</strong> model operates on an hourly time step <strong>and</strong> its<br />
simulates shoot <strong>and</strong> root growth in relation to C <strong>and</strong> N<br />
major input variables are soil texture <strong>and</strong> weather data.<br />
uptake, energy fluxes <strong>and</strong> soil moisture conditions. The<br />
These are listed in Table 2.7.<br />
microclimate<br />
<br />
submodel is used to calculate the interception<br />
of radiation by the canopy, <strong>and</strong> the energy balances of 2.3.4.3 Use <strong>and</strong> performance of <strong>PaSim</strong><br />
<br />
the orly canopy <strong>and</strong> soil AirtemperatreC<br />
surface. Canopy development oilp is<br />
The <strong>PaSim</strong> model Amontantimeoffertiliser<br />
has been evaluated at a wide range<br />
divided into two distinct aporpressre<br />
stages, a reproductive 3 oiltetre stage<br />
of grassl<strong>and</strong> sites applicationa in Europe. Riedo –1 et al. (1998) found<br />
<strong>and</strong> a vegetative stage. Pa A transition from reproductive Claycontent that the difference ManreapplicationCa between simulated <strong>and</strong> –1 measured <br />
to vegetative growth is aiationmol<br />
triggered after a sustained lensitycm period<br />
dry-matter –3 production rationofrainseason<br />
for two climatically different sites in<br />
of air temperatures above antam a base –2 level. In addition, atratesoilater<br />
after Switzerl<strong>and</strong> was aysannmerofanimals<br />
between –6 <strong>and</strong> +21%. Riedo et al. (1999)<br />
the second cut the canopy Precipitationmm<br />
is automatically assumed contentm to 3 m –3 combined the model eaa with –1 statistically downscaled climate<br />
be in the vegetative inspee<br />
state. The soil biology submodel<br />
4 ielcapacity change scenarios Timeannmerofrass<br />
to investigate the effect of climate<br />
calculates plant available ms –1 soil C <strong>and</strong> N <strong>and</strong> is 5 iltinpoint<br />
derived change on dry-matter cttinsCa production –1 at two grassl<strong>and</strong> sites.<br />
from the <strong>CENTURY</strong> 1 model Atmosperic (Parton et al. 1987). atrateyralic<br />
The Working in the Swiss Alps, Riedo et al. (2000) used the<br />
animal submodel allows the effects of grazing animals to model to quantify the effect of elevated CO 2 <strong>and</strong> climate<br />
be incorporated.<br />
change on net primary production <strong>and</strong> carbon stocks, <strong>and</strong><br />
<br />
<br />
<br />
ertol<br />
clearertop<br />
eteenea<br />
spaceafter<br />
tetale<br />
12
Evaluation of Models (<strong>PaSim</strong>, <strong>RothC</strong>, <strong>CENTURY</strong> <strong>and</strong> <strong>DNDC</strong>)<br />
for Simulation of Grassl<strong>and</strong> Carbon Cycling at Plot, Field <strong>and</strong> Regional Scale<br />
Table 2.7 Summary inputs to <strong>PaSim</strong>.<br />
Time step Meteorology Soil <strong>and</strong> plant Management<br />
Hourly<br />
Air temperature (°C)<br />
Vapour pressure (Pa)<br />
Radiation (mol quanta m –2 )<br />
Precipitation (mm)<br />
Wind speed (m s –1 )<br />
1 Atmospheric background NH 3 conc.<br />
(µg N m –3 )<br />
2 Atmospheric background CO 2 conc. (ppm)<br />
Soil pH<br />
3 Soil texture<br />
Clay content (%)<br />
Bulk density (g cm –3 )<br />
Saturated-soil water content<br />
(m 3 m –3 )<br />
4 Field capacity<br />
5 Wilting point<br />
Amount <strong>and</strong> time of fertiliser application<br />
(kg ha –1 )<br />
Manure application (kg C ha –1 )<br />
Duration of grazing season (days) <strong>and</strong><br />
number of animals (head ha –1 )<br />
Time <strong>and</strong> number of grass cuttings<br />
(kg C ha –1 )<br />
Saturated hydraulic conductivity<br />
(mm day –1 )<br />
6 Depth of soil layers (m)<br />
Carbon content of soil (kg C kg –1 )<br />
1,2 These can be determined from literature.<br />
3 Relative proportions of s<strong>and</strong>, silt <strong>and</strong> clay.<br />
4 Water-filled porosity at soil field capacity.<br />
5 Water-filled porosity at soil wilting point.<br />
6 Soil profile can be divided into three soil layers, the depths of which can be can be estimated when calibrating the model (Lawton et al. 2006).<br />
found that in two out of three grassl<strong>and</strong> sites there was<br />
a reduction in SOC stocks. Schmid et al. (2001) found<br />
that the model reproduced N 2 O production <strong>and</strong> emissions<br />
for two field sites in Switzerl<strong>and</strong>. Working at a grassl<strong>and</strong><br />
in Scotl<strong>and</strong>, Riedo et al. (2002) found good agreement<br />
between <strong>PaSim</strong> <strong>and</strong> micrometeorological measurements<br />
of NH 4 . Soussana et al. (2004) used <strong>PaSim</strong> to estimate<br />
the greenhouse gas balance of a pasture site in the<br />
French Massif Central under a range of grazing intensities<br />
<strong>and</strong> N fertiliser applications. In a study at a grassl<strong>and</strong> site<br />
in south-west Irel<strong>and</strong>, Lawton et al. (2006) simulated net<br />
ecosystem CO 2 exchange at a grassl<strong>and</strong> site <strong>and</strong> found<br />
good agreement between the model output <strong>and</strong> observed<br />
net ecosystem CO 2 exchange in the growing season but<br />
not so good in the winter period. Vuichard et al. (2007b)<br />
tested <strong>PaSim</strong> against in-situ measurements of biomass<br />
<strong>and</strong> CO 2 <strong>and</strong> CH 4 fluxes at five European grassl<strong>and</strong><br />
sites. They found good agreement between the observed<br />
seasonal cycle of biomass <strong>and</strong> CO 2 <strong>and</strong> CH 4 fluxes <strong>and</strong><br />
the model output. However, the large uncertainties in<br />
biomass measurements <strong>and</strong> leaf-area index (LAI) made<br />
accurate simulation difficult. Calanca et al. (2007) used<br />
<strong>PaSim</strong> to simulate fluxes of CO 2 <strong>and</strong> N 2 O at five grassl<strong>and</strong><br />
sites in Europe <strong>and</strong> found reasonable agreement between<br />
measured <strong>and</strong> modelled ecosystem respiration <strong>and</strong> net<br />
ecosystem CO 2 exchange. Modelled N 2 O emissions were<br />
2–10 times higher than observed.<br />
To date, only one study has combined <strong>PaSim</strong> with spatial<br />
data to carry out a regional-scale assessment. Vuichard<br />
et al. (2007a) combined <strong>PaSim</strong> with remote-sensing data<br />
to map fluxes of CO 2 , N 2 O <strong>and</strong> CH 4 within European<br />
grassl<strong>and</strong>s at ~108 km × 108 km resolution. Input data<br />
included climate <strong>and</strong> weather data, soil <strong>and</strong> l<strong>and</strong>-cover<br />
information <strong>and</strong> grassl<strong>and</strong> management (cutting or<br />
grazing only).<br />
2.4 Discussion<br />
A conceptual framework for upscaling SOC models from<br />
plot to region has been developed by Paustian et al.<br />
(1995) (Figure 2.5). The main components of this work<br />
are as follows.<br />
1 The models are evaluated in order to assess <strong>and</strong><br />
improve their performance in the conditions found in<br />
the study area. This will utilise long-term experimental<br />
datasets (where available) <strong>and</strong> results from relevant<br />
field <strong>and</strong> laboratory-based studies.<br />
2 Information is collected on the spatial <strong>and</strong> temporal<br />
variation of driving variables across the region.<br />
This includes data on soils, climate, l<strong>and</strong> use <strong>and</strong><br />
management, <strong>and</strong> is managed in a GIS. This data<br />
is input to the simulation model to represent regional<br />
patterns <strong>and</strong> dynamics.<br />
3 Assessment of changes in SOC stocks.<br />
13
Byrne <strong>and</strong> Kiely (2005-FS-32-M1)<br />
Models such as <strong>RothC</strong>, <strong>CENTURY</strong>, <strong>DNDC</strong> <strong>and</strong> <strong>PaSim</strong><br />
were originally developed to study ecosystem behaviour<br />
at the site or plot level (e.g. a pasture or a forest st<strong>and</strong>).<br />
An inherent aspect of their development is the assumption<br />
that driving variables such as climate <strong>and</strong> soil properties<br />
are homogeneous across the site or plot. These models<br />
can be considered as one dimensional in that they<br />
consider only soil variation with depth <strong>and</strong> not spatial<br />
variation. They are structurally complex <strong>and</strong> account<br />
for variation in the decomposition of different organic<br />
compounds by considering multiple organic matter<br />
fractions. Decomposition follows first-order kinetics, i.e. a<br />
constant fractional loss per unit time, of different organic<br />
matter fractions, with the potential rate being modified<br />
by a variety of soil environmental conditions. In general,<br />
a relatively large number of rate controls representing<br />
soil environmental conditions are considered in these<br />
models, including soil temperature, soil moisture, soil<br />
pH, soil texture <strong>and</strong> nutrient concentrations, as well as<br />
other factors such as litter composition <strong>and</strong> disturbance<br />
or management regimes. Given that these models were<br />
developed for ecosystem-based investigations, they tend<br />
to be detailed <strong>and</strong> to be applied in relatively data-rich<br />
environments.<br />
The <strong>RothC</strong>, <strong>CENTURY</strong> <strong>and</strong> <strong>DNDC</strong> models have<br />
simulated changes in SOC stocks in long-term, plot-scale<br />
experiments across a range of climatic, soil <strong>and</strong> l<strong>and</strong>use<br />
conditions. Although the <strong>PaSim</strong> model has not been<br />
evaluated in a similar fashion, the fact that the soil biology<br />
submodel is based on the <strong>CENTURY</strong> model suggests<br />
that it would perform well in long-term experiments<br />
in grassl<strong>and</strong>. Smith et al. (1997b) compared nine soil<br />
organic matter models using data from seven long-term<br />
experiments. <strong>RothC</strong> produced low errors for all datasets<br />
except for some experimental treatments. Smith et al.<br />
(1997a) attributed this to the use of the same conditions to<br />
initialise the model for all treatments, whereas treatment<br />
specific initial conditions would have reduced the error.<br />
<strong>CENTURY</strong> produced low errors for all datasets <strong>and</strong><br />
performed best for grassl<strong>and</strong> <strong>and</strong> arable systems. <strong>DNDC</strong><br />
produced consistently low errors for grassl<strong>and</strong> <strong>and</strong> arable<br />
simulations <strong>and</strong> was not tested on forest soil data.<br />
There is increasing interest in using SOC models to<br />
estimate SOC stock changes at regional level. While it<br />
may seem appropriate to first apply such models at field<br />
scale, this is not done. There are a number of reasons for<br />
this. Firstly, these models are one dimensional <strong>and</strong> do<br />
not consider spatial variation. Furthermore, for field-based<br />
experiments the input data required to run these models<br />
is usually available at a single point. For example, soil<br />
samples are usually taken at soil pits that are considered to<br />
be representative of the study area. Such experiments are<br />
generally not carried out at field level because the amount<br />
of soil <strong>and</strong> related analyses required would be prohibitively<br />
expensive. Furthermore there is less background<br />
variation in plot-based experiments compared to fieldbased<br />
experiments (due, for example, to spatial variation<br />
in soil properties) which permits statistical detection of<br />
treatment effects, etc. Similarly, meteorological data is<br />
normally collected at one location which is considered to<br />
be representative of the study area.<br />
It is st<strong>and</strong>ard practice to upscale SOC models from<br />
plot to regional level. Regional analysis involves the<br />
subdivision of the study area into a number of spatial<br />
units (i.e. grid cells) for which unique sets of driving<br />
variables (e.g. climate, soils, l<strong>and</strong> use <strong>and</strong> management)<br />
are derived <strong>and</strong> then supplied to the model. Each spatial<br />
unit is treated independently, i.e. there are no interacting<br />
processes between them. A limitation of this method is<br />
that exchanges between grid cells such as water <strong>and</strong> soil<br />
(i.e. erosion) are not included. Progress has been made in<br />
addressing this deficiency. For example, <strong>CENTURY</strong> has<br />
been incorporated in a new model (erosion–deposition–<br />
carbon model (EDCM)) developed by Liu et al. (2003),<br />
which simulates the effect of rainfall-induced soil erosion<br />
<strong>and</strong> deposition on SOC dynamics.<br />
As stated above, these models assume spatial<br />
homogeneity, but when applied at coarser spatial scales<br />
this assumption may not hold. In general, aggregation<br />
errors are minimal when the relationship between the<br />
independent variable (to be aggregated) <strong>and</strong> dependent<br />
variable is linear (Paustian et al. 1997). In contrast, when<br />
the relationship is non-linear, aggregation error can be<br />
significant. For example, the relationship between SOC<br />
14
Evaluation of Models (<strong>PaSim</strong>, <strong>RothC</strong>, <strong>CENTURY</strong> <strong>and</strong> <strong>DNDC</strong>)<br />
for Simulation of Grassl<strong>and</strong> Carbon Cycling at Plot, Field <strong>and</strong> Regional Scale<br />
Regional information<br />
Research direction<br />
Potential sequestration of C<br />
in North American agroecosystems<br />
Prediction<br />
Research direction<br />
Prediction<br />
(A)<br />
Process information<br />
Experiments<br />
- Lab microcosms<br />
- Growth chambers<br />
- Field<br />
Process models<br />
- Decomposition<br />
- Nutrient cycling<br />
- Heat transfer<br />
- Water/solute flow<br />
- Crop growth<br />
Integration<br />
Synthesis<br />
Agroecosystem/SOM<br />
model<br />
Validation<br />
Parametrisation<br />
Long-term experiments<br />
Driving<br />
variables<br />
Geographic information<br />
Weather station network<br />
Soils data<br />
- Pedon databases<br />
- Soil association maps<br />
L<strong>and</strong>use data<br />
- County agricultural statistics<br />
- L<strong>and</strong> resource maps<br />
- Remote sensing<br />
(B)<br />
Figure 2.5 A conceptual diagram showing the integration of process information, long-term experiment data<br />
<strong>and</strong> site networks, simulation modelling <strong>and</strong> regional GIS databases. Box A denotes components which can<br />
be applied for local-scale analyses (i.e at a particular location) <strong>and</strong> Box B denotes components which are<br />
necessary for regional-scale analyses (from Paustian et al. 1995).<br />
<strong>and</strong> soil texture is non-linear. Consequently, when two<br />
different soil textures are aggregated, there will be an<br />
error in the prediction of SOC. This was demonstrated in a<br />
simulation study by Burke et al. (1990) using <strong>CENTURY</strong>.<br />
They found that simulated primary production, which<br />
responds in a linear fashion to precipitation (Parton et al.<br />
1987), was insensitive to increasing spatial aggregation. In<br />
contrast, SOC levels were more sensitive to the scale of<br />
spatial aggregation, primarily due to the effect of averaging<br />
soil texture. Decomposition <strong>and</strong> the seasonality of primary<br />
production are affected by climatic factors (i.e. temperature<br />
<strong>and</strong> precipitation), which vary spatially <strong>and</strong> temporally.<br />
Thus, the effects of both spatial <strong>and</strong> temporal averaging<br />
of climate data need to be considered. Ojima et al. (1991)<br />
demonstrated the effect of using either monthly or annually<br />
averaged output from a general circulation model to predict<br />
SOC change in the Great Plains of the USA. There were<br />
distinct differences in predicted patterns of SOC for the<br />
same mean annual temperature change, depending on<br />
whether temperature change was expressed on a monthly<br />
basis or if it was ‘aggregated’ over the year.<br />
The choice of model for simulating <strong>and</strong> predicting SOC<br />
stocks in Irish grassl<strong>and</strong> will be based on a number of<br />
criteria including: (i) Is the model appropriate to soil<br />
<strong>and</strong> climate conditions in Irel<strong>and</strong>? (ii) Are there suitable<br />
datasets available for testing the models? (iii) Are the<br />
model inputs available at a range of scales?<br />
Three of the models (<strong>RothC</strong>, <strong>CENTURY</strong> <strong>and</strong> <strong>DNDC</strong>)<br />
have been used to simulate SOC stocks in temperate<br />
conditions. This suggests that they would be suitable<br />
for Irish conditions. Although <strong>PaSim</strong> has not been used<br />
specifically to model SOC stock changes, it has been<br />
used to simulate net ecosystem CO 2 exchange in a range<br />
of grassl<strong>and</strong>s, including two sites in Irel<strong>and</strong> (Lawton et al.<br />
2006; Vuichard et al. 2007b). As stated previously, the<br />
soil biology submodel of <strong>PaSim</strong> is based on <strong>CENTURY</strong>.<br />
Consequently it may act similarly in simulating SOC stock<br />
changes. <strong>RothC</strong> is the simplest of the models <strong>and</strong> is the<br />
least dem<strong>and</strong>ing in terms of data inputs. <strong>CENTURY</strong> is<br />
more complex <strong>and</strong> somewhat more dem<strong>and</strong>ing in terms<br />
of inputs. Both models operate on a monthly time step,<br />
which is sufficient to capture temporal dynamics in SOC.<br />
<strong>DNDC</strong> <strong>and</strong> <strong>PaSim</strong> are different in that they require more<br />
inputs (particularly <strong>PaSim</strong>) <strong>and</strong> operate at daily <strong>and</strong> hourly<br />
time steps respectively.<br />
15
Byrne <strong>and</strong> Kiely (2005-FS-32-M1)<br />
Although long-term, field-based experiments are a vital<br />
component of research into SOC dynamics (Richter et al.<br />
2007), no such experiments exist in Irel<strong>and</strong>. The National<br />
Soils Database (Fay et al. 2007) provides baseline soil<br />
geochemistry data (including SOC) for the top 10 cm<br />
of Irish soils. The EPA-funded SoilC project (Eaton et<br />
al. 2007) will provide data on SOC stocks in a range<br />
of grassl<strong>and</strong> sites which can be used to initialise SOC<br />
models. These sites should be developed as benchmark<br />
or reference sites which can be re-sampled at 5–10 year<br />
intervals. This would increase the capacity to calibrate <strong>and</strong><br />
validate SOC models for Irish conditions. Results of sitespecific<br />
studies can also provide valuable input to models<br />
(e.g. Byrne <strong>and</strong> Kiely 2006; Byrne et al. 2005; Jaksic et al.<br />
2006b; Lawton et al. 2006).<br />
When upscaling models to the regional or national scale,<br />
the grid resolution is a critical issue. If the grid is too<br />
coarse it may not adequately reflect spatial variation in<br />
soil <strong>and</strong> climatic conditions. For instance, Vuichard et al.<br />
(2007a) used a 108 km × 108 km grid for a Europeanwide<br />
assessment <strong>and</strong> suggest that, while this resolution<br />
may be sufficient to represent regional meteorological<br />
regimes, it would be too coarse to capture local spatial<br />
heterogeneities <strong>and</strong> their impact on grassl<strong>and</strong> GHG fluxes.<br />
In contrast, Falloon et al. estimated changes in UK soils at<br />
1 km × 1 km resolution. Using a regional climate model,<br />
the C4I project (McGrath et al. 2005) developed a 40-year<br />
simulation of the past climate (1961–2000) at 13 km ×<br />
13 km resolution for Irel<strong>and</strong>. The model was then used<br />
to simulate the future climate for a range of scenarios.<br />
Tomlinson estimated SOC stocks in the Republic of<br />
Irel<strong>and</strong> for 1990 <strong>and</strong> 2000 at 2 km × 2 km resolution.<br />
When considering which models to use to assess changes<br />
in SOC stocks in grassl<strong>and</strong> soils across a range of scales,<br />
<strong>RothC</strong> <strong>and</strong> <strong>CENTURY</strong> should be considered first. This is<br />
because they require fewer inputs than <strong>DNDC</strong> <strong>and</strong> <strong>PaSim</strong>,<br />
<strong>and</strong> have been more widely used to simulate <strong>and</strong> predict<br />
changes in SOC stocks. If other aspects of the carbon<br />
cycle (apart from SOC) are to be modelled, then <strong>DNDC</strong><br />
<strong>and</strong> <strong>PaSim</strong> should be considered. For regional-scale<br />
studies there is a clear need to assemble in GIS format all<br />
potential data sources in relation to soils, climate <strong>and</strong> l<strong>and</strong><br />
use. A key issue in this is how data is aggregated (e.g.<br />
Is the soil modelled to a common depth across profiles<br />
or total depth for each profile?). As discussed earlier this<br />
may affect the results of any modelling exercise.<br />
16
Evaluation of Models (<strong>PaSim</strong>, <strong>RothC</strong>, <strong>CENTURY</strong> <strong>and</strong> <strong>DNDC</strong>)<br />
for Simulation of Grassl<strong>and</strong> Carbon Cycling at Plot, Field <strong>and</strong> Regional Scale<br />
3 Effect of Future Climate Change on Soil Carbon Stocks<br />
in Irish Grassl<strong>and</strong>s – A Model Comparison<br />
3.1 Introduction<br />
Soils are an integral component of the global carbon<br />
budget <strong>and</strong> are estimated to contain 2011 Pg (1 Pg = 1<br />
Gt = 10 15 g) of organic carbon to 1 m depth (Bolin et al.<br />
2000). This is about four times the amount of carbon in<br />
vegetation <strong>and</strong> twice the amount in the atmosphere (Bolin<br />
et al. 2000). Consequently there is much scientific interest<br />
in soil carbon stocks <strong>and</strong> their potential feedback to climate<br />
change (Davidson <strong>and</strong> Janssens 2007). Grassl<strong>and</strong>s<br />
occupy some 62.7 million ha in the EU 25 plus Norway<br />
<strong>and</strong> Switzerl<strong>and</strong> (Janssens et al. 2005). Grassl<strong>and</strong> is<br />
the dominant l<strong>and</strong> use in Irel<strong>and</strong>. Eaton et al. (in press)<br />
estimated that, in 2000, grassl<strong>and</strong>s accounted for 53.3%<br />
of the l<strong>and</strong> area of Irel<strong>and</strong> <strong>and</strong> 25% of SOC stocks to 1 m<br />
depth. Despite this, the potential response of SOC in Irish<br />
grassl<strong>and</strong>s to climate change has not been assessed.<br />
Process-based models have been widely used to<br />
investigate the effect of l<strong>and</strong>-use change, climatic change<br />
<strong>and</strong> different management practices on SOC (e.g. Kamoni<br />
et al. 2007a; Li et al. 2003; Smith et al. 2005). The <strong>RothC</strong><br />
model was originally developed to model the turnover of<br />
organic carbon in arable soils at plot scale under a range<br />
of soil <strong>and</strong> climatic conditions (Coleman <strong>and</strong> Jenkinson<br />
1996). It has been extended to model carbon turnover at<br />
plot scale in grassl<strong>and</strong> (Coleman et al. 1997) <strong>and</strong> forest<br />
sites (Falloon <strong>and</strong> Smith 2002; Smith et al. 2006). It has<br />
also been combined with spatial databases to carry out<br />
regional assessments of changes in soil carbon stocks.<br />
For example, Smith et al. (2005) projected changes in<br />
soil carbon stocks in European grassl<strong>and</strong>s under future<br />
climate <strong>and</strong> l<strong>and</strong>-use change <strong>and</strong> estimated that soil<br />
carbon stocks (to 30 cm depth) will fall by between 5.9<br />
<strong>and</strong> 9.3 t C ha –1 between 1990 <strong>and</strong> 2080. They found<br />
that these losses would be reduced by increased organic<br />
matter input to the soil as a result of enhanced productivity<br />
<strong>and</strong> projected changes in technology.<br />
The <strong>CENTURY</strong> model was originally developed for<br />
grassl<strong>and</strong> soils (Parton et al. 1987), <strong>and</strong> in addition to<br />
being applied to a range of grassl<strong>and</strong> soils (e.g. Parton<br />
et al. 1993; Werth et al. 2005) has been widely used for<br />
arable (e.g. Falloon <strong>and</strong> Smith 2002) <strong>and</strong> forest soils<br />
(e.g. Kirschbaum <strong>and</strong> Paul 2002). Parton et al. (1995)<br />
modelled the impact of climate change <strong>and</strong> increasing<br />
atmospheric CO 2 for 31 temperate <strong>and</strong> tropical grassl<strong>and</strong><br />
sites using <strong>CENTURY</strong>. They found that climate change<br />
caused soil carbon to decrease overall, with a loss of<br />
4 Pg from global grassl<strong>and</strong>s after 50 years. <strong>CENTURY</strong><br />
has also been linked to spatially defined datasets to make<br />
regional assessments of soil carbon stock changes with<br />
changing l<strong>and</strong> use <strong>and</strong> management (e.g. Kamoni et al.<br />
2007a; Paustian et al. 2001).<br />
The <strong>DNDC</strong> model is a process-based simulation model of<br />
soil carbon <strong>and</strong> nitrogen biogeochemistry (Li et al. 1996;<br />
1992a; b; 1994). It has reproduced long- <strong>and</strong> short-term<br />
changes in soil carbon across a range of soil types, l<strong>and</strong><br />
uses <strong>and</strong> climates (Li et al. 1997; 1994; 2003). It has been<br />
used to investigate the effect of future climate change on<br />
nitrous oxide emissions from soils (Hsieh et al. 2005)<br />
<strong>and</strong> has also been combined with spatial databases for<br />
regional-scale applications (Sleutel et al. 2006a, b; Tang<br />
et al. 2006).<br />
In this chapter we use the three models <strong>RothC</strong>, <strong>CENTURY</strong><br />
<strong>and</strong> <strong>DNDC</strong> to investigate the potential response to climate<br />
change of SOC stocks in two grassl<strong>and</strong> sites in Irel<strong>and</strong><br />
with contrasting soil <strong>and</strong> climatic conditions. Regionally<br />
downscaled datasets for the period 2021–2060 derived<br />
by McGrath et al. (2005) for a range of IPCC emission<br />
scenarios (Nakicenovic <strong>and</strong> Swart 2000) are used to<br />
simulate future climate. We compare the models in terms<br />
of data inputs, predicted change in SOC stocks <strong>and</strong> their<br />
potential for application at regional <strong>and</strong> national level.<br />
17
Byrne <strong>and</strong> Kiely (2005-FS-32-M1)<br />
3.2 Materials <strong>and</strong> Methods<br />
3.2.1 Site description<br />
Two sites were chosen for this study. The first site (<strong>Cork</strong>)<br />
was located in an area of intensively managed grassl<strong>and</strong><br />
180 m above sea level in County <strong>Cork</strong>, southern Irel<strong>and</strong><br />
(51º N, 8º W). The climate is temperate maritime with<br />
an average rainfall of 1470 mm yr –1 <strong>and</strong> an annual daily<br />
mean temperature of 6.2ºC in January <strong>and</strong> 13.7ºC in July.<br />
The dominant soil type is gleysol (FAO–UNESCO 1974)<br />
with 39% s<strong>and</strong>, 44% silt, 17% clay <strong>and</strong> a bulk density<br />
of 1.17 g cm –3 . The soil pH is 5.4 <strong>and</strong> the SOC content<br />
(0–10 cm) is 3.9–5.9% (Byrne et al. 2005). The dominant<br />
grass species is perennial ryegrass (Lolium perenne L.)<br />
with smaller amounts of meadow foxtail (Alopecurus<br />
pratensis L.) <strong>and</strong> Yorkshire fog (Holcus lanatus L.). Grass<br />
production rates are in the range 7.6–14 t dry matter<br />
ha –1 yr –1 (Byrne et al. 2005).<br />
The second site (Wexford) is located at the Teagasc<br />
Wexford Castle Research Centre, Wexford Castle, Co.<br />
Wexford in south-east Irel<strong>and</strong> (52º N, 6º W) <strong>and</strong> is described<br />
by Hyde et al. (2006) as follows. The mean annual rainfall<br />
is 1014 mm <strong>and</strong> the mean annual temperature is 10ºC.<br />
The soil is a gleyic cambisol (FAO–UNESCO 1974) with<br />
18% s<strong>and</strong>, 38% silt <strong>and</strong> 18% clay <strong>and</strong> a bulk density of<br />
1.23 g cm –3 . The soil pH is 5.8 <strong>and</strong> the C <strong>and</strong> N content<br />
are 3.2% <strong>and</strong> 0.28% respectively. The pasture is perennial<br />
ryegrass (Lolium perenne L.).<br />
3.2.2 Description of models <strong>and</strong> model inputs<br />
For a full description of the <strong>RothC</strong>, <strong>CENTURY</strong> <strong>and</strong> <strong>DNDC</strong><br />
models see Section 2 of this report.<br />
The climatic inputs were derived from the work of McGrath<br />
et al. (2005) who used a regional climate model (RCM)<br />
to create a 40-year simulation of the past climate (1961–<br />
2000) on a grid of 13 km × 13 km over Irel<strong>and</strong>. Following<br />
verification of the RCM performance in recreating the<br />
recent past climate, McGrath et al. (2005) used the model<br />
to simulate the future climate for the period 2021–2060<br />
for a range of IPCC emission scenarios (Nakicenovic<br />
<strong>and</strong> Swart 2000). The emission scenarios are described<br />
in Table 3.1. See McGrath et al. (2005) for a list of the<br />
Table 3.1 Characteristics of the IPCC climate scenarios used by McGrath et al. (2005) to drive the RCM to<br />
generate the climate scenarios used in this study.<br />
Scenario<br />
A1B<br />
A2<br />
B1<br />
Characteristics<br />
Very rapid economic growth<br />
Global population that peaks in mid-century <strong>and</strong> declines<br />
Rapid introduction of new <strong>and</strong> more efficient technologies<br />
Major underlying themes are convergence among regions, capacity building <strong>and</strong> increased cultural <strong>and</strong> social<br />
interactions, with a substantial reduction in regional differences in per capita income<br />
Balance between fossil-intensive <strong>and</strong> non-fossil energy sources<br />
Medium–high emissions<br />
The world is very heterogeneous<br />
Underlying theme is self-reliance <strong>and</strong> preservation of local identities<br />
Fertility patterns across regions converge very slowly<br />
Continuously increasing population<br />
Economic development is primarily regionally oriented<br />
Per capita economic growth <strong>and</strong> technological change more fragmented <strong>and</strong> slower than other storylines<br />
Same global population, that peaks in mid-century <strong>and</strong> declines thereafter, as in the A1 storyline, rapid change in<br />
economic structures toward a service <strong>and</strong> information economy<br />
Reductions in material intensity <strong>and</strong> the introduction of clean <strong>and</strong> resource-efficient technologies<br />
Emphasis is on global solutions to economic, social <strong>and</strong> environmental sustainability, including improved equity, but<br />
without additional climate initiatives<br />
18
Evaluation of Models (<strong>PaSim</strong>, <strong>RothC</strong>, <strong>CENTURY</strong> <strong>and</strong> <strong>DNDC</strong>)<br />
for Simulation of Grassl<strong>and</strong> Carbon Cycling at Plot, Field <strong>and</strong> Regional Scale<br />
meteorological products simulated. Average monthly<br />
climatic data for 1961–2000 <strong>and</strong> for the A2, A1B <strong>and</strong><br />
B1 emission scenarios were bilinearly interpolated from<br />
the four nearest grid points of the 13 km × 13 km grid<br />
to the locations of the study sites (McGrath, personal<br />
communication). Differences in topography were not taken<br />
into account. These monthly climatic data formed the basis<br />
of the climatic inputs to the <strong>RothC</strong>, <strong>CENTURY</strong> <strong>and</strong> <strong>DNDC</strong><br />
models. For <strong>RothC</strong> the climatic inputs were average<br />
monthly air temperature (°C), total monthly precipitation<br />
(mm) <strong>and</strong> total monthly open-pan evaporation (mm).<br />
Average monthly air temperature (°C) <strong>and</strong> total monthly<br />
Table 3.2 Climate <strong>and</strong> soil properties used as inputs for <strong>RothC</strong>, <strong>CENTURY</strong> <strong>and</strong> <strong>DNDC</strong> at the <strong>Cork</strong> site.<br />
Input <strong>RothC</strong> <strong>CENTURY</strong> <strong>DNDC</strong><br />
Climate properties<br />
Average monthly air<br />
temperature (°C)<br />
Total monthly precipitation<br />
(mm)<br />
Total monthly open-pan<br />
evaporation (mm)<br />
Minimum monthly air<br />
temperature (°C)<br />
Maximum monthly air<br />
temperature (°C)<br />
Total monthly precipitation<br />
(mm)<br />
Maximum daily air<br />
temperature (°C)<br />
Minimum daily air<br />
temperature (°C)<br />
Total daily precipitation<br />
(cm)<br />
Soil<br />
L<strong>and</strong>-use type<br />
–<br />
–<br />
15 Moist grassl<strong>and</strong><br />
Soil-texture class<br />
–<br />
–<br />
16 Silt loam/loam<br />
Depth (cm)<br />
1 20<br />
3 20<br />
17 20<br />
S<strong>and</strong> fraction<br />
–<br />
4 0.39<br />
–<br />
Silt fraction<br />
–<br />
5 0.44<br />
–<br />
Clay fraction<br />
2 0.17<br />
6 0.17<br />
18 0.17<br />
Bulk density<br />
–<br />
7 1.17 g cm –3<br />
19 1.17 g cm –3<br />
Wilting point<br />
–<br />
8 0.11 (VSMC*, 0–1)<br />
20 0.20 (WFPS † , 0–1)<br />
Field capacity<br />
–<br />
9 0.25 (VSMC*, 0–1)<br />
21 0.40 (WFPS † , 0–1)<br />
Saturated hydraulic conductivity<br />
–<br />
–<br />
22 0.025 m hr –1<br />
Porosity<br />
–<br />
–<br />
23 0.45 (0–1)<br />
Depth of water retention layer (cm)<br />
–<br />
–<br />
24 100<br />
pH<br />
–<br />
10 5.4<br />
25 5.4<br />
C in surface organic matter with fast turnover<br />
–<br />
11 50 g C m –2<br />
–<br />
C in SOM with fast turnover<br />
–<br />
12 409 g C m –2<br />
–<br />
C in SOM with intermediate turnover<br />
–<br />
13 5997 g C m –2<br />
–<br />
C in SOM with slow turnover<br />
–<br />
14 7224 g C m –2<br />
–<br />
Initial SOC content in surface soil (0–5 cm)<br />
–<br />
–<br />
26 0.072 kg C kg –1<br />
Initial NO 3<br />
–<br />
concentration in surface soil<br />
–<br />
–<br />
27 21.6 mg N kg –1<br />
Initial NH 4<br />
+<br />
concentration in surface soil<br />
–<br />
–<br />
28 2.16 mg N kg –1 ,<br />
* Volumetric soil moisture content.<br />
† Water-filled porosity.<br />
1, 3, 17 Soil depth set at 20 cm to allow comparison between model outputs.<br />
2, 4, 5, 6, 7, 10, 18, 19, 25 Byrne et al. (2005).<br />
8,9 Saxton et al. (1986).<br />
11, 12, 13, 14, 24 Best estimate.<br />
15, 16, 20, 21, 22, 23, 26, 27, 28 Model default.<br />
19
Byrne <strong>and</strong> Kiely (2005-FS-32-M1)<br />
precipitation (mm) were derived from the work of McGrath<br />
et al. (2005) as described above. Total monthly open-pan<br />
evaporation is required for <strong>RothC</strong> <strong>and</strong> this was calculated<br />
using the method of Penman (1948). The climatic inputs for<br />
<strong>CENTURY</strong> were minimum monthly air temperature (°C),<br />
maximum monthly air temperature (°C) <strong>and</strong> total monthly<br />
precipitation (mm). The <strong>DNDC</strong> model operates at a daily<br />
time step <strong>and</strong> it was therefore necessary to construct daily<br />
time series of maximum air temperature (°C), minimum<br />
air temperature (°C) <strong>and</strong> total precipitation (cm) for<br />
1961–2000 <strong>and</strong> for each of the three emission scenarios.<br />
This was done as follows. Daily time series of maximum air<br />
temperature, minimum air temperature <strong>and</strong> precipitation<br />
were collated using meteorological measurements made<br />
at the study sites during 2004. These were then adjusted<br />
so that their mean minimum <strong>and</strong> maximum monthly<br />
temperatures <strong>and</strong> total monthly precipitation values were<br />
the same as the monthly values produced by the RCM<br />
simulations for the study site.<br />
The climatic <strong>and</strong> soil inputs for each of the three SOC<br />
models are detailed in Tables 3.2 <strong>and</strong> 3.3.<br />
Table 3.3 Climate <strong>and</strong> soil properties used as inputs for <strong>RothC</strong>, <strong>CENTURY</strong> <strong>and</strong> <strong>DNDC</strong> at the Wexford site.<br />
Input <strong>RothC</strong> <strong>CENTURY</strong> <strong>DNDC</strong><br />
Climate properties<br />
Average monthly air<br />
temperature (°C)<br />
Total monthly<br />
precipitation (mm)<br />
Total monthly open-pan<br />
evaporation (mm)<br />
Minimum monthly air<br />
temperature (°C)<br />
Maximum monthly<br />
air temperature (°C)<br />
Total monthly<br />
precipitation (mm)<br />
Maximum daily air<br />
temperature (°C)<br />
Minimum daily air<br />
temperature (°C)<br />
Total daily precipitation<br />
(cm)<br />
Soil<br />
L<strong>and</strong>-use type<br />
Soil texture class<br />
Depth (cm)<br />
S<strong>and</strong> fraction<br />
Silt fraction<br />
–<br />
–<br />
1 20<br />
–<br />
–<br />
–<br />
–<br />
3 20<br />
4 0.38<br />
5 0.44<br />
15 Moist grassl<strong>and</strong><br />
16 Loam<br />
17 20<br />
–<br />
–<br />
Clay fraction<br />
2 0.18<br />
6 0.18<br />
18 0.18<br />
Bulk density<br />
–<br />
7 1.23 g cm –3<br />
19 1.23 g cm –3<br />
Wilting point<br />
–<br />
8 0.11 (VSMC, 0–1)<br />
20 0.22 (WFPS, 0–1)<br />
Field capacity<br />
Saturated hydraulic conductivity<br />
Porosity<br />
Depth of water retention layer (cm)<br />
pH<br />
C in surface organic matter with fast turnover<br />
C in SOM with fast turnover<br />
C in SOM with intermediate turnover<br />
C in SOM with slow turnover<br />
Initial SOC content in surface soil (0–5 cm)<br />
Initial NO<br />
– 3 concentration in surface soil<br />
Initial NH<br />
+ 4 concentration in surface soil<br />
–<br />
–<br />
–<br />
–<br />
–<br />
–<br />
–<br />
–<br />
–<br />
–<br />
–<br />
–<br />
9 0.25 (VSMC, 0–1)<br />
–<br />
–<br />
–<br />
10 5.8<br />
11 50 g C m –2<br />
12 236 g C m –2,<br />
13 3464 g C m –2<br />
14 4172 g C m –2<br />
–<br />
–<br />
–<br />
21 0.49 (WFPS, 0–1)<br />
22 0.025 m hr –1<br />
23 0.45 (0–1)<br />
24 100<br />
25 5.8<br />
–<br />
–<br />
–<br />
–<br />
26 0.039 kg C kg –1<br />
27 11.7 mg N kg –1<br />
28 1.17 mg N kg –1<br />
1, 3, 17 Soil depth set at 20 cm to allow comparison between model outputs.<br />
2, 4, 5, 6, 7, 10, 18, 19, 25 Hyde et al. (2006).<br />
8, 9 Saxton et al. (1986).<br />
11, 12, 13, 14, 24 Best estimate.<br />
15, 16, 20, 21, 22, 23, 26, 27, 28 Model default.<br />
20
Evaluation of Models (<strong>PaSim</strong>, <strong>RothC</strong>, <strong>CENTURY</strong> <strong>and</strong> <strong>DNDC</strong>)<br />
for Simulation of Grassl<strong>and</strong> Carbon Cycling at Plot, Field <strong>and</strong> Regional Scale<br />
3.2.3 Running the models<br />
3.2.3.1 <strong>RothC</strong><br />
When the annual returns to the soil are not know they<br />
can be calculated using the total SOC content of the soil<br />
to 20 cm depth. For the <strong>Cork</strong> site, the SOC content to 20<br />
cm depth was 136.31 t C ha –1 <strong>and</strong> the IOM content of the<br />
soil was assumed to be 0.049 × (total organic carbon) 1.139<br />
from Falloon et al. (1998a). For the Wexford site the TOC<br />
content of the soil to 20 cm depth was 78.72 t C ha –1 <strong>and</strong><br />
the IOM content was calculated as for <strong>Cork</strong>. By running<br />
the model in reverse using the ‘Calculate plant inputs<br />
knowing total carbon’ mode the annual returns of C to<br />
the soil required to reach the measured SOC content for<br />
equilibrium content were calculated for both sites (Table<br />
3.4). The model was then run to equilibrium for each<br />
site using the estimated soil inputs <strong>and</strong> constant climatic<br />
conditions. The constant climatic conditions were taken<br />
to be the average conditions during 1961–2000. The<br />
simulations were then continued from 2021 to 2060 using<br />
the same soil inputs <strong>and</strong> the climatic data for each of the<br />
three IPCC emission scenarios.<br />
Table 3.4 Annual plant inputs to the soil at the <strong>Cork</strong><br />
<strong>and</strong> Wexford sites calculated using the ‘Calculate<br />
plant inputs knowing total carbon’ mode of <strong>RothC</strong>.<br />
Plant residue (t C ha –1 )<br />
Month <strong>Cork</strong> Wexford<br />
January 0.14 0.11<br />
February 0.14 0.11<br />
March 0.14 0.11<br />
April 0.56 0.23<br />
May 0.56 0.23<br />
June 0.56 0.23<br />
July 0.14 0.23<br />
August 0.14 0.23<br />
September 1.96 1.26<br />
October 1.96 1.26<br />
November 1.96 1.26<br />
December 0.14 0.11<br />
Total 8.40 5.37<br />
3.2.3.2 <strong>CENTURY</strong><br />
<strong>CENTURY</strong> was first run to equilibrium for each site using<br />
the climatic <strong>and</strong> soil data shown in Tables 3.2 <strong>and</strong> 3.3. For<br />
the <strong>Cork</strong> site model runs, management events <strong>and</strong> crop<br />
growth controls were scheduled as follows: ‘Niwot Ridge’<br />
was chosen as the crop type for the plant submodel (see<br />
Metherell et al. (1993) for further information). The first<br />
month of crop growth was January <strong>and</strong> the last month<br />
was December. The grazing season was from March<br />
to October <strong>and</strong> the grazing system chosen was ‘New<br />
Zeal<strong>and</strong> pasture management’ (see Metherell et al.<br />
(1993) for further information). Fertiliser was assumed to<br />
be applied once a month from March to August at a rate of<br />
1g N m –2 (the N1 fertiliser application option). The model<br />
runs for the Wexford site were similar except that the<br />
grazing system chosen was ‘Graze low intensity moderate<br />
effect on production’ <strong>and</strong> no fertiliser was applied.<br />
The model was run to equilibrium for 5000 years at each<br />
site using constant climatic conditions were taken to be<br />
the average conditions during 1961–2000. Following this,<br />
the simulations were continued from 2021 to 2060 for<br />
each of the three IPCC scenarios using the same soil,<br />
climatic <strong>and</strong> management inputs.<br />
3.2.3.3 <strong>DNDC</strong><br />
Unlike <strong>RothC</strong> <strong>and</strong> <strong>CENTURY</strong>, <strong>DNDC</strong> is not run to<br />
equilibrium over several thous<strong>and</strong> years but is calibrated<br />
using the results of field experiments (e.g. Sleutel et al.<br />
2006a; Zhang et al. 2006). For this study <strong>DNDC</strong> was<br />
initialised for each site using the climatic <strong>and</strong> soil data in<br />
Tables 3.2 <strong>and</strong> 3.3 as input. For the model initialisation<br />
the climatic conditions which were taken to be the average<br />
conditions during 1961–2000. Management events were<br />
scheduled as follows: at both sites the grazing season<br />
began on March 15 <strong>and</strong> end on October 15 with 20 hours<br />
grazing per day <strong>and</strong> two cattle per hectare. For the <strong>Cork</strong><br />
site, fertiliser was applied at a rate of 18 kg N (NH 4 NO 3 )<br />
ha –1 of on the first day of March, May, July <strong>and</strong> September<br />
respectively. For the Wexford site, fertiliser was applied at<br />
a rate of 15 kg N (NH 4 NO 3 ) ha –1 (1.5 g N m –2 ) of on the first<br />
day of March, May, July <strong>and</strong> September respectively. The<br />
crop type was perennial grass <strong>and</strong> growth was simulated<br />
21
Byrne <strong>and</strong> Kiely (2005-FS-32-M1)<br />
Table 3.5 Parameters for perennial grass in the crop submodel of <strong>DNDC</strong> at the <strong>Cork</strong> site.<br />
Grain Leaf + stem Root<br />
Maximum biomass (kg C ha –1 )<br />
280<br />
7000<br />
6720<br />
Biomass fraction<br />
0.02<br />
0.5<br />
0.48<br />
Biomass C/N ratio<br />
15<br />
25<br />
30<br />
Total N dem<strong>and</strong> (kg N ha –1 )<br />
552.67<br />
Accumulative thermal degree days<br />
2500<br />
Water dem<strong>and</strong> (g H 2 O g DM –1 )<br />
550<br />
N-fixation index<br />
1.01<br />
Maximum LAI<br />
3<br />
Table 3.6 Parameters for perennial grass in the crop submodel of <strong>DNDC</strong> at the Wexford site.<br />
Grain Leaf + stem Root<br />
Maximum biomass (kg C ha –1 )<br />
320<br />
8000<br />
7680<br />
Biomass fraction<br />
0.02<br />
0.5<br />
0.48<br />
Biomass C/N ratio<br />
15<br />
25<br />
30<br />
Total N dem<strong>and</strong> (kg N ha –1 )<br />
597.33<br />
Accumulative thermal degree days<br />
2500<br />
Water dem<strong>and</strong> (g H 2 O g DM –1 )<br />
550<br />
N-fixation index<br />
1.01<br />
Maximum LAI<br />
3<br />
using the empirical growth module. The crop parameters<br />
used for each site are listed in Tables 3.5 <strong>and</strong> 3.6. During<br />
the model runs it was found that after 70 years the SOC<br />
stock in the top 20 cm varied by no more than 0.13%<br />
<strong>and</strong> 0.88% of the initial values at the <strong>Cork</strong> <strong>and</strong> Wexford<br />
sites respectively, <strong>and</strong> was considered to be stabilised.<br />
Following this 70 year initialisation period the simulations<br />
were continued from 2021 to 2060 for each of the three<br />
IPCC SRES scenarios using the same soil, climatic <strong>and</strong><br />
management inputs.<br />
3.3 Results<br />
3.3.1 Output of the McGrath et al. (2005) RCM<br />
for the <strong>Cork</strong> <strong>and</strong> Wexford sites<br />
All three future climate scenarios from the RCM of McGrath<br />
et al. (2005) predict changes in rainfall <strong>and</strong> temperature at<br />
the <strong>Cork</strong> site during 2021–2060 compared to 1961–2000<br />
(Figures 3.1 <strong>and</strong> 3.2). Average annual precipitation during<br />
1961–2000 is 1829 mm. The average annual precipitation<br />
predicted for 2021–2060 is 1819 mm, 1797 mm <strong>and</strong> 1799<br />
mm for the A1B, A2 <strong>and</strong> B1 scenarios respectively (Figure<br />
3.1a). The annual distribution of precipitation is changed<br />
under the climate scenarios compared to 1961–2000, with<br />
higher rainfall from January to March <strong>and</strong> after August,<br />
<strong>and</strong> lower rainfall in the spring <strong>and</strong> summer (Figure 3.1a).<br />
The mean monthly air temperature is increased by an<br />
average of 1.08ºC, 0.82ºC <strong>and</strong> 0.54ºC for the A1B, A2 <strong>and</strong><br />
B1 scenarios respectively (Figure 3.2a). The minimum<br />
<strong>and</strong> maximum monthly air temperature is raised in each<br />
scenario by a similar amount (Figure 3.2b, c).<br />
Output from the RCM of McGrath et al. (2005) shows<br />
that the Wexford site experiences lower rainfall <strong>and</strong><br />
higher temperatures than the <strong>Cork</strong> site (Figures 3.1 <strong>and</strong><br />
3.2). Average annual precipitation during 1961–2000 is<br />
1281 mm <strong>and</strong> is very similar at 1283 mm, 1298 mm <strong>and</strong><br />
1290 mm for the A1B, A2 <strong>and</strong> B1 scenarios respectively<br />
(Figure 3.1b). As in the <strong>Cork</strong> site, the annual distribution of<br />
22
Evaluation of Models (<strong>PaSim</strong>, <strong>RothC</strong>, <strong>CENTURY</strong> <strong>and</strong> <strong>DNDC</strong>)<br />
for Simulation of Grassl<strong>and</strong> Carbon Cycling at Plot, Field <strong>and</strong> Regional Scale<br />
200<br />
(a)<br />
200<br />
(b)<br />
Precipitation (mm month -1 )<br />
180<br />
160<br />
140<br />
120<br />
100<br />
80<br />
60<br />
February<br />
March<br />
April<br />
May<br />
January<br />
1961-2000<br />
A1B<br />
A2<br />
B1<br />
June<br />
July<br />
August<br />
September<br />
Month<br />
October<br />
November<br />
December<br />
180<br />
160<br />
140<br />
120<br />
100<br />
80<br />
60<br />
January<br />
February<br />
March<br />
April<br />
May<br />
June<br />
July<br />
1961-2000<br />
A1B<br />
A2<br />
B1<br />
Month<br />
August<br />
September<br />
October<br />
November<br />
December<br />
Figure 3.1 Total monthly precipitation at (a) the <strong>Cork</strong> site <strong>and</strong> (b) the Wexford site during 1961–2000 <strong>and</strong> during<br />
2021–2060 for each of the three IPCC scenarios A1B, A2 <strong>and</strong> B1.<br />
precipitation is changed under each scenario, with lower<br />
rainfall between March <strong>and</strong> July. The mean monthly air<br />
temperature is increased by an average of 1.10ºC, 0.86ºC<br />
<strong>and</strong> 0.55ºC for the A1B, A2 <strong>and</strong> B1 scenarios respectively<br />
(Figure 3.2d). The minimum <strong>and</strong> maximum monthly air<br />
temperatures are raised in each scenario by a similar<br />
amount (Figure 3.2e, f).<br />
3.3.2 Projected changes in SOC stocks<br />
All three models predicted a reduction in SOC stocks at<br />
the <strong>Cork</strong> site during 2021–2060 for each climate change<br />
scenario (Figure 3.3) with variation between models <strong>and</strong><br />
scenarios. The range of reduction of SOC was 1.9 to<br />
7.4 t C ha –1 , equivalent to a per cent loss range of 1.4 to<br />
5.4%. Although the higher rainfall during the winter months<br />
may retard decomposition, this does not compensate for<br />
increased decomposition due to the higher temperatures<br />
<strong>and</strong> reduced summer rainfall. The lowest reductions<br />
in SOC were predicted by <strong>CENTURY</strong>, with an average<br />
reduction of 3.4 t C ha –1 , 2.5 t C ha –1 <strong>and</strong> 1.9 t C ha –1<br />
during 2021–2060 for the A1B, A2 <strong>and</strong> B1 scenarios<br />
respectively. The changes predicted by <strong>RothC</strong> <strong>and</strong><br />
<strong>DNDC</strong> were similar for the A1B <strong>and</strong> A2 scenarios. <strong>RothC</strong><br />
predicted a reduction of 7.4 t C ha –1 <strong>and</strong> 5.7 t C ha –1 for<br />
the A1B <strong>and</strong> A2 scenarios, while <strong>DNDC</strong> predicted losses<br />
of 7.0 t C ha –1 <strong>and</strong> 6.2 t C ha –1 . For the B1 scenario,<br />
<strong>RothC</strong> <strong>and</strong> <strong>DNDC</strong> predicted reductions of 3.9 t C ha –1<br />
<strong>and</strong> 2.0 t C ha –1 respectively. These reductions may be<br />
attributed to the increased temperatures <strong>and</strong> reduced<br />
summer precipitation associated with the climate change<br />
scenarios. If productivity is increased as a result of climate<br />
change, it may increase organic matter inputs sufficiently<br />
to compensate for the projected losses of SOC.<br />
Although the McGrath et al. (2005) RCM predicts a shift<br />
towards drier summers <strong>and</strong> wetter winters as well as<br />
warmer temperatures at the Wexford site, the models<br />
predict a different response of SOC to the climate change<br />
scenarios compared to the <strong>Cork</strong> site (Figure 3.3). Both<br />
<strong>DNDC</strong> <strong>and</strong> <strong>CENTURY</strong> predict small changes in SOC<br />
stocks. The <strong>DNDC</strong> model predicts a SOC increase of<br />
0.7 t C ha –1 (0.86%) during 2021–2060 for all scenarios<br />
(Figure 3.3d, e, f). This suggests that the <strong>DNDC</strong> model<br />
is insensitive to the differences in precipitation <strong>and</strong><br />
temperature between the scenarios. The losses of SOC<br />
predicted by <strong>CENTURY</strong> vary between 0.05 <strong>and</strong> 0.7 t C ha –1<br />
(0.07–0.94%) <strong>and</strong> are likely to not be detectable using<br />
conventional methods (Figure 3.3d, e, f). In contrast,<br />
<strong>RothC</strong> predicts losses of 4.4 t C ha –1 , 3.5 t C ha –1 <strong>and</strong><br />
2.3 t C ha –1 during 2021–2060 for the A1B, A2 <strong>and</strong> B1<br />
scenarios respectively (Figure 3.3d, e, f).<br />
23
Byrne <strong>and</strong> Kiely (2005-FS-32-M1)<br />
Meanmonthlyairtemperature()<br />
18<br />
16<br />
14<br />
12<br />
10<br />
8<br />
6<br />
4<br />
(a)<br />
January<br />
February<br />
March<br />
April<br />
May<br />
June<br />
July<br />
Month<br />
1612000<br />
A1B<br />
A2<br />
B1<br />
August<br />
October<br />
November<br />
December<br />
September<br />
18<br />
16<br />
14<br />
12<br />
10<br />
8<br />
6<br />
4<br />
(b)<br />
January<br />
February<br />
March<br />
April<br />
May<br />
June<br />
July<br />
August<br />
September<br />
Month<br />
1612000<br />
A1B<br />
A2<br />
B1<br />
October<br />
November<br />
December<br />
Minimummonthlyairtemperature()<br />
Maimummonthlyairtemperature()<br />
10<br />
8<br />
6<br />
4<br />
2<br />
0<br />
2<br />
4<br />
24<br />
22<br />
20<br />
18<br />
16<br />
14<br />
12<br />
10<br />
(c)<br />
January<br />
(e)<br />
January<br />
February<br />
March<br />
February<br />
March<br />
April<br />
April<br />
May<br />
June<br />
July<br />
Month<br />
May<br />
June<br />
July<br />
August<br />
1612000<br />
A1B<br />
A2<br />
B1<br />
August<br />
September<br />
1612000<br />
A1B<br />
A2<br />
B1<br />
September<br />
October<br />
October<br />
November<br />
November<br />
December<br />
December<br />
January<br />
February<br />
March<br />
April<br />
May<br />
June<br />
July<br />
August<br />
September<br />
October<br />
November<br />
December<br />
Month<br />
Month<br />
Month<br />
<br />
<br />
Figure 3.2 Mean monthly air temperature (°C) at (a) the <strong>Cork</strong> site <strong>and</strong> (b) the Wexford site; minimum monthly<br />
<br />
air temperature (°C) at (c) the <strong>Cork</strong> site <strong>and</strong> (d) the Wexford site; <strong>and</strong> maximum monthly air temperature (°C) at<br />
(e) the <strong>Cork</strong> site <strong>and</strong> (f) the Wexford site, during 1961–2000 <strong>and</strong> during 2021–2060 for each of the three IPCC <br />
scenarios A1B, A2 <strong>and</strong> B1.<br />
<br />
14<br />
12<br />
10<br />
8<br />
6<br />
4<br />
2<br />
20<br />
18<br />
16<br />
14<br />
12<br />
10<br />
8<br />
6<br />
(d)<br />
(f)<br />
February<br />
March<br />
April<br />
May<br />
June<br />
January<br />
July<br />
1612000<br />
A1B<br />
A2<br />
B1<br />
1612000<br />
A1B<br />
A2<br />
B1<br />
September<br />
October<br />
November<br />
December<br />
August<br />
24
Evaluation of Models (<strong>PaSim</strong>, <strong>RothC</strong>, <strong>CENTURY</strong> <strong>and</strong> <strong>DNDC</strong>)<br />
for Simulation of Grassl<strong>and</strong> Carbon Cycling at Plot, Field <strong>and</strong> Regional Scale<br />
138<br />
136<br />
(a)<br />
1Cor<br />
79<br />
78<br />
77<br />
(b)<br />
1eford<br />
tCha 1<br />
134<br />
132<br />
76<br />
75<br />
130<br />
Century<br />
<strong>RothC</strong><br />
<strong>DNDC</strong><br />
74<br />
73<br />
Century<br />
<strong>RothC</strong><br />
<strong>DNDC</strong><br />
128<br />
2020 2030 2040 2050 2060<br />
Year<br />
72<br />
2020 2030 2040 2050 2060<br />
Year<br />
2Cor<br />
2eford<br />
138<br />
136<br />
(c)<br />
79<br />
78<br />
77<br />
(d)<br />
tCha 1<br />
134<br />
132<br />
76<br />
75<br />
130<br />
Century<br />
<strong>RothC</strong><br />
<strong>DNDC</strong><br />
128<br />
72<br />
2020 2030 2040 2050 2060 2020 2030 2040 2050 2060<br />
Year<br />
74<br />
73<br />
Century<br />
<strong>RothC</strong><br />
<strong>DNDC</strong><br />
Year<br />
1Cor<br />
1eford<br />
138<br />
136<br />
(e)<br />
79<br />
78<br />
77<br />
(f)<br />
tCha 1<br />
134<br />
132<br />
130<br />
Century<br />
<strong>RothC</strong><br />
<strong>DNDC</strong><br />
128<br />
72<br />
2020 2030 2040 2050 2060 2020 2030 2040 2050 2060<br />
Year<br />
Year<br />
<br />
<br />
Figure <br />
3.3 Change in SOC in the top 20 cm predicted by <strong>RothC</strong>, <strong>CENTURY</strong> <strong>and</strong> <strong>DNDC</strong> during 2021–2060 at the<br />
<strong>Cork</strong> site <strong>and</strong> the Wexford site for each of the three IPCC emission scenarios tested.<br />
<br />
<br />
76<br />
75<br />
74<br />
73<br />
Century<br />
<strong>RothC</strong><br />
<strong>DNDC</strong><br />
<br />
25
Byrne <strong>and</strong> Kiely (2005-FS-32-M1)<br />
3.4 Discussion<br />
This study illustrates the potential response of SOC<br />
stocks in Irish grassl<strong>and</strong>s to projected changes in climate.<br />
Comparison of the results between sites <strong>and</strong> models<br />
indicates that there will be contrasting responses between<br />
soils with different SOC stocks <strong>and</strong> climate regimes. The<br />
<strong>Cork</strong> site, which has 43% more SOC than the Wexford<br />
site, seems more likely to lose SOC. However, the losses<br />
at the <strong>Cork</strong> site for all three models <strong>and</strong> at the Wexford<br />
site for <strong>RothC</strong> are small when compared to other studies.<br />
For example, using the <strong>CENTURY</strong> model, Ojima et al.<br />
(1993) <strong>and</strong> Parton et al. (1995) found that SOC in humid<br />
temperate grassl<strong>and</strong>s was reduced by as much as 4.4%<br />
after 50 years in response to temperature increases of<br />
2–5°C. In a study of European grassl<strong>and</strong> soils, Smith et<br />
al. (2005) found that climate impacts would reduce the<br />
mean grassl<strong>and</strong> soil carbon stock by 10 to 14% of the<br />
1990 level by 2080. Bellamy et al. (2005) found that C<br />
was lost from the top 0–15 cm of soils in Engl<strong>and</strong> <strong>and</strong><br />
Wales at a rate of 0.6% yr –1 between 1978 <strong>and</strong> 2003<br />
<strong>and</strong> suggested that this may be linked to climate change.<br />
The amount of precipitation in the humid temperature<br />
sites studied by Ojima et al. (1993) <strong>and</strong> Parton et al.<br />
(1995) (543–936 mm yr –1 ) is considerably less than the<br />
average at the <strong>Cork</strong> <strong>and</strong> Wexford sites (1470 mm <strong>and</strong><br />
1281 mm yr –1 respectively) <strong>and</strong> may account for the<br />
small SOC losses reported in this study. Recent work at<br />
the <strong>Cork</strong> site by Jaksic et al. (2006a) site suggests that<br />
it is less likely to suffer moisture stress, <strong>and</strong> therefore<br />
increased decomposition, as a result of climate change.<br />
Jaksic et al. (2006a) compared net ecosystem exchange<br />
(NEE) between two years of contrasting precipitation<br />
(1785 mm <strong>and</strong> 1185 mm yr –1 ) <strong>and</strong> found that NEE was<br />
not sensitive to variation in precipitation. This suggests<br />
that major changes in annual precipitation are unlikely to<br />
cause a major increase in decomposition <strong>and</strong> associated<br />
CO 2 losses. While there may be increased summertime<br />
losses of SOC, decomposition may remain relatively<br />
unchanged during the winter months as a result of the<br />
increased precipitation.<br />
Comparison of the results from these two humid sites<br />
suggests that the potential reduction in SOC stocks is<br />
likely to increase with increasing rainfall <strong>and</strong> SOC stock.<br />
In such circumstances, soils at high elevation <strong>and</strong> in the<br />
west of the country would be most vulnerable to climate<br />
change.<br />
When considered at a farm scale, the losses of SOC are<br />
quite small (%), however they may be quite significant<br />
at national scale. As mentioned previously, Eaton et al.<br />
(in press) estimated that grassl<strong>and</strong> accounts for 53.3%<br />
(3.772 M ha) of the l<strong>and</strong> area in the Republic of Irel<strong>and</strong>.<br />
A SOC loss of 0.1 t C ha –1 yr –1 would equate to a total<br />
loss of 0.377 million t C yr –1 if all grassl<strong>and</strong>s responded<br />
in a similar fashion to the site studied here. This estimate<br />
illustrates the need to investigate the potential effect<br />
of climate change on SOC stocks in grassl<strong>and</strong> with<br />
varying precipitation ranges, soil types, C content <strong>and</strong><br />
management practices.<br />
While SOC stocks may be reduced as a consequence<br />
of climate change, increased productivity as a result<br />
of changes in temperature, precipitation <strong>and</strong> CO 2<br />
concentration may increase litter production <strong>and</strong> thereby<br />
increase SOC stocks. In a study of European grassl<strong>and</strong>s,<br />
Smith et al. (2005) found that changes in net primary<br />
productivity compensated for losses of SOC in three out<br />
of four scenarios examined. Holden <strong>and</strong> Brereton (2002)<br />
studied the potential effect of climate change on grass<br />
yield in Irel<strong>and</strong> <strong>and</strong> found that summertime drought would<br />
lead to reduced grass yield over large parts of the south<br />
<strong>and</strong> east of the country. This would suggest that losses<br />
of SOC would not be compensated for by increased<br />
productivity <strong>and</strong> associated litter production.<br />
All three SOC models gave largely similar results at the<br />
<strong>Cork</strong> site but gave divergent results when applied to the<br />
Wexford site. <strong>RothC</strong> <strong>and</strong> <strong>CENTURY</strong> were developed to<br />
model C dynamics in soil <strong>and</strong> have been widely used for<br />
that purpose. They require relatively few inputs (Table 3.2)<br />
which is advantageous when testing them across a range<br />
of soil <strong>and</strong> climatic conditions. However, there is some<br />
doubt about the suitability of <strong>CENTURY</strong>, given that it<br />
26
Evaluation of Models (<strong>PaSim</strong>, <strong>RothC</strong>, <strong>CENTURY</strong> <strong>and</strong> <strong>DNDC</strong>)<br />
for Simulation of Grassl<strong>and</strong> Carbon Cycling at Plot, Field <strong>and</strong> Regional Scale<br />
was not possible to incorporate fertiliser application (<strong>and</strong><br />
therefore capture current management practices) in the<br />
model runs. In contrast to <strong>RothC</strong> <strong>and</strong> <strong>CENTURY</strong>, <strong>DNDC</strong><br />
requires more input. Unlike <strong>RothC</strong> <strong>and</strong> <strong>CENTURY</strong> it has<br />
been more widely applied to simulate <strong>and</strong> predict soil<br />
N 2 O emissions rather than changes in SOC. While these<br />
models should be tested at more sites, the results of this<br />
study suggest that <strong>RothC</strong> <strong>and</strong> <strong>CENTURY</strong> are the most<br />
preferable for simulating future changes in SOC stocks.<br />
A major shortcoming in assessing the applicability of these<br />
models to Irish conditions is the lack of soil, climatic <strong>and</strong><br />
management data from long-term experiments similar to<br />
those employed for model applications elsewhere (Kelly<br />
et al. 1997; Li et al. 1997; Smith et al. 1997b). Paustian<br />
et al. (1997) consider this to be an essential prerequisite<br />
to upscaling to regional <strong>and</strong> national level. There is<br />
therefore an urgent need to establish experiments which<br />
will provide such data <strong>and</strong> provide a sound basis for<br />
further model comparisons <strong>and</strong> regional- <strong>and</strong> nationalscale<br />
assessments.<br />
27
Byrne <strong>and</strong> Kiely (2005-FS-32-M1)<br />
4 Conclusions <strong>and</strong> Recommendations<br />
When considering which models to use to assess changes<br />
in SOC stocks in grassl<strong>and</strong> soils across a range of scales,<br />
<strong>RothC</strong> <strong>and</strong> <strong>CENTURY</strong> should be considered first. This is<br />
because they require fewer inputs than <strong>DNDC</strong> <strong>and</strong> <strong>PaSim</strong><br />
<strong>and</strong> have been more widely used to simulate <strong>and</strong> predict<br />
changes in SOC stocks. All three SOC models predicted a<br />
reduction in SOC stocks at the <strong>Cork</strong> site during 2021–2060<br />
for each climate change scenario, with variation between<br />
models <strong>and</strong> scenarios. The range of reduction of SOC<br />
was 1.9 to 7.4 t C ha –1 . In contrast, <strong>DNDC</strong> <strong>and</strong> <strong>CENTURY</strong><br />
predicted a small change in SOC at the Wexford site <strong>and</strong><br />
<strong>RothC</strong> predicted a loss of 2.3 to 4.4 t C ha –1 . Based on the<br />
results of Section 3, <strong>CENTURY</strong> <strong>and</strong> <strong>RothC</strong> are the most<br />
suitable models for further testing <strong>and</strong> calibration. There is<br />
an urgent need to establish long-term experiments across<br />
the range of soil, management <strong>and</strong> l<strong>and</strong>-use conditions in<br />
Irel<strong>and</strong>. This would provide vital information which could<br />
be used to calibrate models at site scale <strong>and</strong> make future<br />
predictions. Suitable datasets relating to climate, soils <strong>and</strong><br />
l<strong>and</strong> management should be collated <strong>and</strong> harmonised so<br />
that a GIS-based platform for model upscaling can be<br />
developed <strong>and</strong> information gaps identified.<br />
28
Evaluation of Models (<strong>PaSim</strong>, <strong>RothC</strong>, <strong>CENTURY</strong> <strong>and</strong> <strong>DNDC</strong>)<br />
for Simulation of Grassl<strong>and</strong> Carbon Cycling at Plot, Field <strong>and</strong> Regional Scale<br />
References<br />
Aber JD, Federer CA (1992) A generalized, lumpedparameter<br />
model of photosynthesis, evapotranspiration<br />
<strong>and</strong> net primary production in temperate <strong>and</strong> boreal<br />
forest ecosystems. Oecologia 92:463–474.<br />
Al-Adamat R, Rawajfih Z, Easter M, Paustian K, Coleman<br />
K, Milne E, Falloon P, Powlson DS, Batjes NH (2007)<br />
Predicted soil organic carbon stocks <strong>and</strong> changes<br />
in Jordan between 2000 <strong>and</strong> 2030 made using the<br />
GEFSOC modelling system. Agriculture, Ecosystems<br />
& Environment 122:35–45.<br />
Ardö J, Olsson L (2003) Assessment of soil organic carbon<br />
in semi-arid Sudan using GIS <strong>and</strong> the <strong>CENTURY</strong><br />
model. Journal of Arid Environments 54:633–651.<br />
Babu Y, Li C, Frolking S, Nayak D, Adhya T (2006) Field<br />
validation of <strong>DNDC</strong> model for methane <strong>and</strong> nitrous<br />
oxide emissions from rice-based production systems<br />
of India. Nutrient Cycling in Agroecosystems 74:157–<br />
174.<br />
Beheydt D, Boeckx P, Sleutel S, Li C, Van Cleemput O<br />
(2007) Validation of <strong>DNDC</strong> for 22 long-term N 2 O field<br />
emission measurements. Atmospheric Environment<br />
41:6196–6211.<br />
Bellamy PH, Lovel<strong>and</strong> PJ, Bradley RI, Lark RM, Kirk GJD<br />
(2005) Carbon losses from all soils across Engl<strong>and</strong> <strong>and</strong><br />
Wales 1978–2003. Nature 437:245–248.<br />
Bolin B, Sukumar R, Ciais P, Cramer W, Jarvis P, Kheshgi<br />
H, Nobre C, Semenov S, Steffen S (2000) Global<br />
perspective. In L<strong>and</strong> Use, L<strong>and</strong>-Use Change, <strong>and</strong><br />
Forestry. Eds. R T Watson, I R Noble, B Bolin, N H<br />
Ravindranath, D J Verardo <strong>and</strong> D J Dokken. pp. 23–<br />
52. Cambridge <strong>University</strong> Press, Cambridge, United<br />
Kingdom.<br />
Burke IC, Kittel TGF, Lauenroth WK, Snook P, Yonker<br />
CM, Parton WJ (1991) Regional analysis of the<br />
central Great Plains – Sensitivity to cimate variability.<br />
BioScience 41:685–692.<br />
Burke IC, Schimel DS, Yonker CM, Parton WJ, Joyce LA,<br />
Lauenroth WK (1990) Regional modeling of grassl<strong>and</strong><br />
biogeochemisty using GIS. L<strong>and</strong>scape Ecology 4:45–<br />
54.<br />
Butterbach-Bahl K, Stange F, Papen H, Li CS (2001)<br />
Regional inventory of nitric oxide <strong>and</strong> nitrous oxide<br />
emissions for forest soils of southeast Germany using<br />
the biogeochemical model PnET-N-<strong>DNDC</strong>. Journal of<br />
Geophysical Research – Atmospheres 106:34155–<br />
34166.<br />
Byrne KA, Kiely G (2006) Partitioning of respiration in<br />
an intensively managed grassl<strong>and</strong>. Plant <strong>and</strong> Soil<br />
282:281–289. doi:210.1007/s11104-11005-16065-z.<br />
Byrne KA, Kiely G, Leahy P (2005) CO 2 fluxes in adjacent<br />
new <strong>and</strong> permanent temperate grassl<strong>and</strong>s. Agricultural<br />
<strong>and</strong> Forest Meteorology 135:82–92.<br />
Calanca P, Vuichard N, Campbell C, Viovy N, Cozic A,<br />
Fuhrer J, Soussana J-F (2007) Simulating the fluxes of<br />
CO 2 <strong>and</strong> N 2 O in European grassl<strong>and</strong>s with the Pasture<br />
Simulation Model (<strong>PaSim</strong>). Agriculture, Ecosystems &<br />
Environment 121:164–174.<br />
Cerri CEP, Cerri CC, Paustian K, Bernoux M, Mellilo JM<br />
(2004) Combining soil C <strong>and</strong> N spatial variability <strong>and</strong><br />
modeling approaches for measuring <strong>and</strong> monitoring<br />
soil carbon sequestration. Environmental Management<br />
33:S274–S288.<br />
Cerri CEP, Coleman K, Jenkinson DS, Bernoux M,<br />
Victoria R, Cerri CC (2003) Modeling soil carbon from<br />
forest <strong>and</strong> pasture ecosystems of Amazon, Brazil. Soil<br />
Science Society of America Journal 67:1879–1887.<br />
Cerri CEP, Easter M, Paustian K, Killian K, Coleman K,<br />
Bernoux M, Falloon P, Powlson DS, Batjes N, Milne<br />
E, Cerri CC (2007a) Simulating SOC changes in 11<br />
l<strong>and</strong> use change chronosequences from the Brazilian<br />
Amazon with <strong>RothC</strong> <strong>and</strong> Century models. Agriculture,<br />
Ecosystems & Environment 122:46–57.<br />
Cerri CEP, Easter M, Paustian K, Killian K, Coleman K,<br />
Bernoux M, Falloon P, Powlson DS, Batjes NH, Milne E,<br />
Cerri CC (2007b) Predicted soil organic carbon stocks<br />
<strong>and</strong> changes in the Brazilian Amazon between 2000<br />
<strong>and</strong> 2030. Agriculture, Ecosystems & Environment<br />
122:58–72.<br />
Coleman K, Jenkinson DS (1996) <strong>RothC</strong> 26.3 – A model<br />
for the turnover of carbon in soil. In Evaluation of Soil<br />
Organic Matter Models Using Existing, Long-Term<br />
Datasets. Eds. DS Powlson, P Smith <strong>and</strong> JU Smith.<br />
pp. 237–246. NATO ASI Series I, Vol. 38. Springer-<br />
Verlag, Heidelberg.<br />
Coleman K, Jenkinson DS (2005) <strong>RothC</strong> 26.3 – A model<br />
for the turnover of carbon in soil: Model description <strong>and</strong><br />
users guide. Lawes Agricultural Trust, Harpenden.<br />
Coleman K, Jenkinson DS, Crocker GJ, Grace PR,<br />
Klir J, Korschens M, Poulton PR, Richter DD (1997)<br />
Simulating trends in soil organic carbon in long-term<br />
experiments using <strong>RothC</strong>-26.3. Geoderma 81:29–44.<br />
29
Byrne <strong>and</strong> Kiely (2005-FS-32-M1)<br />
Cui J, Li C, Sun G, Trettin C (2005a) Linkage of MIKE SHE<br />
to Wetl<strong>and</strong>-<strong>DNDC</strong> for carbon budgeting <strong>and</strong> anaerobic<br />
biogeochemistry simulation. Biogeochemistry 72:147–<br />
167.<br />
Cui J, Li C, Trettin C (2005b) Analyzing the ecosystem<br />
carbon <strong>and</strong> hydrologic characteristics of forested<br />
wetl<strong>and</strong> using a biogeochemical process model. Global<br />
Change Biology 11:278–289. doi:210.1111/j.1365-<br />
2486.2005.00900.x.<br />
Davidson EA, Janssens IA (2007) Temperature sensitivity<br />
of soil carbon decomposition <strong>and</strong> feedbacks to climate<br />
change. Nature 440:165–173.<br />
Eaton J, McGoff N, Byrne KA, Leahy P, Kiely G (2008)<br />
L<strong>and</strong> cover change <strong>and</strong> soil organic carbon stocks in<br />
the Republic of Irel<strong>and</strong> 1851–2000. Climatic Change<br />
91(3-4): 317–334.<br />
Eaton JM, McGoff NM, Byrne K, Leahy P, Kiely G<br />
(2007) Influence of soil type, l<strong>and</strong> use, precipitation<br />
<strong>and</strong> topography on soil organic carbon in Irel<strong>and</strong>.<br />
In Greenhouse gas fluxes in terrestrial ecosystems<br />
in Irel<strong>and</strong>, September 20, Delgany, Co. Wicklow,<br />
Irel<strong>and</strong>.<br />
EPA (USA) (2006) Inventory of U.S. Greenhouse Gas<br />
Emissions <strong>and</strong> Sinks: 1990–2004. US Environmental<br />
Protection Agency.<br />
Falloon P, Smith P (2002) Simulating SOC changes in<br />
long-term experiments with <strong>RothC</strong> <strong>and</strong> <strong>CENTURY</strong>:<br />
Model evaluation for a regional scale experiment. Soil<br />
Use <strong>and</strong> Management 18:101–111.<br />
Falloon P, Smith P, Bradley RI, Milne R, Tomlinson R,<br />
Viner D, Livermore M, Brown T (2006) <strong>RothC</strong>UK – A<br />
dynamic modelling system for estimating changes in<br />
soil C from mineral soils at 1-km resolution in the UK.<br />
Soil Use <strong>and</strong> Management 22:274–288. doi:210.1111/<br />
j.1475-2743.2006.00028.x.<br />
Falloon P, Smith P, Coleman K, Marshall S (1998a)<br />
Estimating the size of the inert organic matter pool<br />
from total soil organic carbon content for use in the<br />
Rothamsted carbon model. Soil Biol Biochem 30:1207–<br />
1211.<br />
Falloon PD, Smith P, Smith JU, Szabó J, Coleman K,<br />
Marshall S (1998b) Regional estimates of carbon<br />
sequestration potential: Linking the Rothamsted<br />
Carbon Model to GIS databases. Biology <strong>and</strong> Fertility<br />
of Soils 27:236–241.<br />
FAO–UNESCO (1974) FAO–UNESCO Soil Map of the<br />
World: Legend. UNESCO, Paris.<br />
Farahbakhshazad N, Dinnes DL, Li C, Jaynes DB, Salas W<br />
(2007) Modeling biogeochemical impacts of alternative<br />
management practices for a row-crop field in Iowa.<br />
Agriculture, Ecosystems & Environment 123:30–48.<br />
Fay D, McGrath D, Zhang C, Carrigg C, O’Flaherty V,<br />
Kramers G, Carton OT, Grennan E (2007) Towards<br />
A National Soil Database – Synthesis Report.<br />
Environmental Protection Agency, Co. Wexford,<br />
Irel<strong>and</strong>.<br />
Flanagan LB, Wever LA, Carlson PJ (2002) Seasonal<br />
<strong>and</strong> interannual variation in carbon dioxide exchange<br />
<strong>and</strong> carbon balance in a northern temperate grassl<strong>and</strong>.<br />
Global Change Biology 8:599–615.<br />
Foereid B, Høgh-Jensen H (2004) Carbon sequestration<br />
potential of organic agriculture in northern Europe<br />
– A modelling approach. Nutrient Cycling in<br />
Agroecosystems 68:13–24.<br />
Gilmanov TG, Soussana JF, Aires L, Allard V, Ammann<br />
C, Balzarolo M, Barcza Z, Bernhofer C, Campbell CL,<br />
Cernusca A, Cescatti A, Clifton-Brown J, Dirks BOM,<br />
Dore S, Eugster W, Fuhrer J, Gimeno C, Gruenwald T,<br />
Haszpra L, Hensen A, Ibrom A, Jacobs AFG, Jones MB,<br />
Lanigan G, Laurila T, Lohila A, G.Manca, Marcolla B,<br />
Nagy Z, Pilegaard K, Pinter K, Pio C, Raschi A, Rogiers<br />
N, Sanz MJ, Stefani P, Sutton M, Tuba Z, Valentini<br />
R, Williams ML, Wohlfahrt G (2007) Partitioning<br />
European grassl<strong>and</strong> net ecosystem CO 2 exchange into<br />
gross primary productivity <strong>and</strong> ecosystem respiration<br />
using light response function analysis. Agriculture,<br />
Ecosystems & Environment 121:93–120.<br />
Guo L, Falloon P, Coleman K, Zhou B, Li Y, Lin E, Zhang<br />
F (2007) Application of the <strong>RothC</strong> model to the results<br />
of long-term experiments on typical upl<strong>and</strong> soils in<br />
northern China. Soil Use <strong>and</strong> Management 23:63–70.<br />
doi:10.1111/j.1475-2743.2006.00056.x.<br />
Hart PBS (1984) Effects of soil type <strong>and</strong> past cropping on<br />
the nitrogen supplying ability of arable soils. <strong>University</strong><br />
of Reading, UK.<br />
Holden NM, Brereton AJ (2002) An assessment of the<br />
potential impact of climate change on grass yield in<br />
Irel<strong>and</strong> over the next 100 years. Ir J Agric Food Res<br />
41:213–226.<br />
Hsieh C-I, Leahy P, Kiely G, Li C (2005) The effect of<br />
climate perturbations on N 2 O emissions from a fertilised<br />
humid grassl<strong>and</strong>. Nutrient Cycling in Agroecosystems<br />
73:15–23. doi:10.1007/s10705-10005-17129-10704.<br />
Hyde BP, Hawkins MJ, Fanning AF, Noonan D, Ryan M,<br />
O’Toole P, Carton OT (2006) Nitrous oxide emissions<br />
from a fertilized <strong>and</strong> grazed grassl<strong>and</strong> in the south<br />
east of Irel<strong>and</strong>. Nutrient Cycling in Agroecosystems<br />
75:187–200.<br />
Jaksic J, Kiely G, Albertson J, Oren R, Katul G, Leahy<br />
P, Byrne KA (2006a) Net ecosystem exchange of<br />
grassl<strong>and</strong> in contrasting wet <strong>and</strong> dry years. Agricultural<br />
<strong>and</strong> Forest Meteorology 139:323–334. .<br />
30
Evaluation of Models (<strong>PaSim</strong>, <strong>RothC</strong>, <strong>CENTURY</strong> <strong>and</strong> <strong>DNDC</strong>)<br />
for Simulation of Grassl<strong>and</strong> Carbon Cycling at Plot, Field <strong>and</strong> Regional Scale<br />
Jaksic J, Kiely G, Albertson J, Oren R, Katul G, Leahy<br />
P, Byrne KA (2006b) Net ecosystem exchange of<br />
grassl<strong>and</strong> in contrasting wet <strong>and</strong> dry years. Agricultural<br />
<strong>and</strong> Forest Meteorology 139:323-334. doi:310.1016/j.<br />
agrformet.2006.1007.1009.<br />
Janssens IA, Freibauer A, Schlamadinger B, Ceulemans<br />
R, Ciais P, Dolman AJ, Heimann M, Nabuurs G-J,<br />
Smith P, Valentini R, Schulze E-D (2005) The carbon<br />
budget of terrestrial ecosystems at country-scale – A<br />
European case study. Biogeosciences 2:15–26.<br />
Jenkinson DS (1990) The turnover of organic carbon <strong>and</strong><br />
nitrogen in soil. Philosophical Transactions of the Royal<br />
Society of London B 329:361–368.<br />
Jenkinson DS, Adams DE, Wild A (1991) Model estimates<br />
of CO 2 emissions from soils in response to global<br />
warming. Nature 351:304–306.<br />
Jenkinson DS, Coleman K (1994) Calculating the annual<br />
input of organic matter to soil from measurements of<br />
total organic carbon <strong>and</strong> radiocarbon. Eur J Soil Sci<br />
45:167–174.<br />
Jenkinson DS, Harkness DD, Vance ED (1992) Calculating<br />
net primary production <strong>and</strong> annaul input of organic<br />
matter to soil from the amount <strong>and</strong> radiocarbon content<br />
of soil organic matter. Soil Biol Biochem 24:295–308.<br />
Jenkinson DS, Harris HC, Ryan J, McNeill AM, Pilbeam<br />
CJ, Coleman K (1999) Organic matter turnover in a<br />
calcareous clay soil from Syria under a two-course<br />
cereal rotation. Soil Biology <strong>and</strong> Biochemistry 31:687–<br />
693.<br />
Jenkinson DS, Hart PBS, Rayner JH, Parry LC (1987)<br />
Modelling the turnover of soil organic matter in longterm<br />
experiments. Intecol Bulletin 15:1–8.<br />
Jenkinson DS, Rayner JH (1977) The turnover of soil<br />
organic matter in some of the Rothamsted classical<br />
experiments. Soil Sci 123:298–305.<br />
Kamoni PT, Gicheru PT, Wokabi SM, Easter M, Milne E,<br />
Coleman K, Falloon P, Paustian K (2007a) Predicted<br />
soil organic carbon stocks <strong>and</strong> changes in Kenya<br />
between 1990 <strong>and</strong> 2030. Agric Ecosyst Environ<br />
122:105–113.<br />
Kamoni PT, Gicheru PT, Wokabi SM, Easter M, Milne E,<br />
Coleman K, Falloon P, Paustian K, Killian K, Kih<strong>and</strong>a<br />
FM (2007b) Evaluation of two soil carbon models using<br />
two Kenyan long term experimental datasets. Agric<br />
Ecosys Environ 122:95–104.<br />
Kelly RH, Parton WJ, Crocker GJ, Graced PR, Klir J,<br />
Korschens M, Poulton PR, Richter DD (1997) Simulating<br />
trends in soil organic carbon in long-term experiments<br />
using the century model. Geoderma 81:75–90.<br />
Kirschbaum MUF, Paul KI (2002) Modelling C <strong>and</strong> N<br />
dynamics in forest soils with a modified version of<br />
the <strong>CENTURY</strong> model. Soil Biology <strong>and</strong> Biochemistry<br />
34:341–354.<br />
Lawton D, Leahy P, Kiely G, Byrne KA, Calanca P<br />
(2006) Modeling of net ecosystem exchange <strong>and</strong><br />
its components for a humid grassl<strong>and</strong> ecosystem.<br />
Journal of Geophysical Research – Biogeosciences<br />
111:G04013. doi:04010.01029/02006JG000160.<br />
Levy PE, Mobbs DC, Jones SK, Milne R, Campbell C,<br />
Sutton MA (2007) Simulation of fluxes of greenhouse<br />
gases from European grassl<strong>and</strong>s using the <strong>DNDC</strong><br />
model. Agriculture, Ecosystems & Environment<br />
121:186–192.<br />
Li C (1996) The <strong>DNDC</strong> model. In Evaluation of Soil<br />
Organic Matter Models Using Existing, Long-Term<br />
Datasets. Eds. D S Powlson, P Smith <strong>and</strong> J U Smith.<br />
pp. 263–267. NATO ASI Series I, Vol. 38. Springer-<br />
Verlag, Heidelberg.<br />
Li C, Frolking S, Crocker GJ, Grace PR, Klir J, Korchens<br />
M, Poulton PR (1997) Simulating trends in soil organic<br />
carbon in long-term experiments using the <strong>DNDC</strong><br />
model. Geoderma 81:45–60.<br />
Li C, Frolking S, Frolking TA (1992a) A model of nitrous<br />
oxide evolution from soil driven by rainfall events: 1.<br />
Model structure <strong>and</strong> sensitivity. Journal of Geophysical<br />
Research – Atmospheres 9759–9776.<br />
Li C, Frolking S, Frolking TA (1992b) A model of nitrous<br />
oxide evolution from soil driven by rainfall events: 2.<br />
Model applications. Journal of Geophysical Research<br />
– Atmospheres 9777–9783.<br />
Li C, Frolking S, Harriss R (1994) Modeling carbon<br />
biogeochemistry in agricultural soils. Global<br />
Biogeochem Cycles 8:237–254.<br />
Li C, Zhuang Y, Frolking S, Galloway J, Harriss R, Moore<br />
B, Schimel D, Wang X (2003) Modeling soil organic<br />
carbon change in cropl<strong>and</strong>s of China. Ecol Appl<br />
13:327–336.<br />
Li CS, Aber J, Stange F, Butterbach-Bahl K, Papen H<br />
(2000) A process-oriented model of N 2 O <strong>and</strong> NO<br />
emissions from forest soils: 1. Model development.<br />
Journal of Geophysical Research – Atmospheres<br />
105:4369–4384.<br />
Liu S, Bliss N, Sundquist E, Huntingdon TG (2003) Modeling<br />
carbon dynamics in vegetation <strong>and</strong> soil under the impact<br />
of soil erosion <strong>and</strong> deposition. Global Biogechemical<br />
Cycles 17:1074. doi:1010.1029/2002GB002010.<br />
Lobe I, Bol R, Ludwig B, Du Preez CC, Amelung W<br />
(2005) Savanna-derived organic matter remaining in<br />
arable soils of the South African Highveld long-term<br />
mixed cropping: Evidence from 13C <strong>and</strong> 15N natural<br />
abundance. Soil Biology <strong>and</strong> Biochemistry 37:1898–<br />
1909.<br />
31
Byrne <strong>and</strong> Kiely (2005-FS-32-M1)<br />
Ludwig B, Helfrich M, Flessa H (2005) Modelling the longterm<br />
stabilization of carbon from Maize in a silty soil.<br />
Plant <strong>and</strong> Soil 278:315–325.<br />
McGrath R, Nishimura E, Nolan P, Semmler T, Sweeney<br />
C, Wang S (2005) Climate Change: Regional Climate<br />
Model Predictions for Irel<strong>and</strong>. p. 45. Environmental<br />
Protection Agency, ERTDI Report Series No. 36.<br />
Metherell AK, Harding LA, Cole CV, Parton WJ (1993)<br />
<strong>CENTURY</strong> Soil Organic Matter Model Environment,<br />
Technical Documentation, Agroecosystem Version 4.0.<br />
Great Plains System Research Unit, Technical Report<br />
No. 4, USDA-ARS, Fort Collins, Colorado.<br />
Miehle P, Livesley SJ, Feikema PM, Li C, Arndt SK (2006)<br />
Assessing productivity <strong>and</strong> carbon sequestration<br />
capacity of Eucalyptus globulus plantations using the<br />
process model forest-<strong>DNDC</strong>: Calibration <strong>and</strong> validation.<br />
Ecological Modelling 192:83–94.<br />
Mikhailova EA, Bryant RB, DeGloria SD, Post CJ,<br />
Vassenev II (2000) Modeling soil organic matter<br />
dynamics after conversion of native grassl<strong>and</strong> to longterm<br />
continuous fallow using the <strong>CENTURY</strong> model.<br />
Ecological Modelling 132:247–257.<br />
Nakicenovic N, Swart S Eds. (2000) Special Report on<br />
Emission Scenarios: A Special Report of Working<br />
Group III of the Intergovernmental Panel on Climate<br />
Change. Cambridge <strong>University</strong> Press, Cambridge, UK.<br />
pp. 599.<br />
Novick KA, Stoy PC, Katul GG, Ellsworth DS, Siqueira<br />
MBS, Juang J, Oren R (2004) Carbon dioxide <strong>and</strong><br />
water vapour exchange in a warm temperate grassl<strong>and</strong>.<br />
Oecologia 138:259–274.<br />
Ojima DS, Kittel TGF, Rosswall T, Walker BH (1991)<br />
Critical issues for underst<strong>and</strong>ing global change effects<br />
on terrestrial ecosystems. Ecological Applications<br />
1:316–325.<br />
Ojima DS, Parton WJ, Schimel DS, Scurlock JMO, Kittel<br />
TGF (1993) Modeling the effects of climatic <strong>and</strong> CO 2<br />
changes on grassl<strong>and</strong> storage of soil C. Water Air Soil<br />
Poll 70:643–657.<br />
Parton W, Tappan G, Ojima D, Tschakert P (2004)<br />
Ecological impact of historical <strong>and</strong> future l<strong>and</strong>-use<br />
patterns in Senegal. Journal of Arid Environments<br />
59:605–623.<br />
Parton WJ, Schimel DS, Cole CV, Ojima DS (1987)<br />
Analysis of factors controlling soil organic matter levels<br />
in Great Plains grassl<strong>and</strong>s. Soil Science Society of<br />
America Journal 51:1173–1179.<br />
Parton WJ, Scurlock JMO, Ojima DS, Gilmanov TG,<br />
Scholes RJ, Schimel DS, Kirchner T, Menaut J-C,<br />
Seastedt T, Garcia Moya E, Kamnalrut A, Kinyamario<br />
JI (1993) Observations <strong>and</strong> modeling of biomass <strong>and</strong><br />
soil organic matter dynamics for the grassl<strong>and</strong> biome<br />
worldwide. Glob Biogeoch Cyc 7:785–810.<br />
Parton WJ, Scurlock JMO, Ojima DS, Schimel DS, Hall<br />
DO (1995) Impact of climate change on grassl<strong>and</strong><br />
production <strong>and</strong> soil carbon worldwide. Global Change<br />
Biology 1:13–22.<br />
Pathak H, Li C, Wassmann R (2005) Greenhouse gas<br />
emissions from Indian rice fields: Calibration <strong>and</strong><br />
upscaling using the <strong>DNDC</strong> model. Biogeosciences<br />
2:113–123.<br />
Paustian K, Elliott ET, Collins HP, Vernon Cole C, Paul E<br />
(1995) Using a network of long-term experiments for<br />
analysis of soil carbon dynamics <strong>and</strong> global change:<br />
The North American model. Australian Journal of<br />
Experimental Agriculture 35:929–939.<br />
Paustian K, Elliott ET, Killian K, Cipra J, Bluhm G, Smith<br />
JL (2001) Modeling <strong>and</strong> regional assessment of soil<br />
carbon: A case study of the Conservation Reserve<br />
Program. In Soil Management for Enhancing Carbon<br />
Sequestration, Special publication of the Soil Science<br />
Society of America, Madison, WI. Eds. R Lal <strong>and</strong> K<br />
McSweeney. pp. 207–225.<br />
Paustian K, Levine E, Post WM, Ryzhova IM (1997)<br />
The use of models to integrate information <strong>and</strong><br />
underst<strong>and</strong>ing of soil C at the regional scale. Geoderma<br />
79:227–260.<br />
Penman HL (1948) Natural evaporation from open water,<br />
bare soil <strong>and</strong> grass. Proceedings of the Royal Society<br />
of London A193:120–146.<br />
Richter DD, Hofmockel M, Callaham MA, Powlson DS,<br />
Smith P (2007) Long-term soil experiments: Keys to<br />
managing Earth’s rapidly changing ecosystems. Soil<br />
Science Society of America Journal 71:266–279.<br />
Riedo M, Grub A, Rosset M, Fuhrer J (1998) A pasture<br />
simulation model for dry matter production, <strong>and</strong> fluxes<br />
of carbon, nitrogen, water <strong>and</strong> energy. Ecological<br />
Modelling 105:141–183.<br />
Riedo M, Gyalistras D, Fischlin A, Fuhrer J (1999)<br />
Using an ecosystem model linked to GCM-derived<br />
local weather scenarios to analyse effects of climate<br />
change <strong>and</strong> elevated CO2 on dry matter production<br />
<strong>and</strong> partitioning, <strong>and</strong> water use in temperate managed<br />
grassl<strong>and</strong>s. Global Change Biology 5:213–223.<br />
Riedo M, Gyalistras D, Fuhrer J (2000) Net primary<br />
production <strong>and</strong> carbon stocks in differently managed<br />
grassl<strong>and</strong>s: Simulation of site-specific sensitivity to an<br />
increase in atmospheric CO 2 <strong>and</strong> to climate change.<br />
Ecological Modelling 134:207–227.<br />
Riedo M, Milford C, Schmidt M, Sutton MA (2002)<br />
Coupling soil-plant-atmosphere exchange of ammonia<br />
with ecosystem functioning in grassl<strong>and</strong>s. Ecological<br />
Modelling 158:83–110.<br />
32
Evaluation of Models (<strong>PaSim</strong>, <strong>RothC</strong>, <strong>CENTURY</strong> <strong>and</strong> <strong>DNDC</strong>)<br />
for Simulation of Grassl<strong>and</strong> Carbon Cycling at Plot, Field <strong>and</strong> Regional Scale<br />
Romanya J, Cortina J, Falloon P, Coleman K, Smith P<br />
(2000) Modelling changes in soil organic matter after<br />
planting fast-growing Pinus radiata on Mediterranean<br />
agricultural soils. European Journal of Soil Science<br />
51:627-641. doi:610.1046/j.1365-2389.2000.00343.x.<br />
Saggar S, Giltrap DL, Li C, Tate KR (2007) Modelling<br />
nitrous oxide emissions from grazed grassl<strong>and</strong>s in<br />
New Zeal<strong>and</strong>. Agriculture, Ecosystems & Environment<br />
119:205–216.<br />
Saxton KE, Rawls WJ, Romberger SJ, Papendick RI<br />
(1986) Estimating generalized soil-water characteristics<br />
from texture. Soil Science Society of America Journal<br />
50:1031–1036.<br />
Schmid M, Neftel A, Riedo M, Fuhrer J (2001) Processbased<br />
modelling of nitrous oxide emissions from<br />
different nitrogen sources in mown grassl<strong>and</strong>. Nutrient<br />
Cycling in Agroecosystems 60:177–187.<br />
Sleutel S, De Neve S, Beheydt D, Li C, Hofman G (2006a)<br />
Regional simulation of long-term organic carbon stock<br />
changes in cropl<strong>and</strong> soils using the <strong>DNDC</strong> model: 1.<br />
Large-scale model validation against a spatially explicit<br />
data set. Soil Use <strong>and</strong> Management 22:342–351.<br />
Sleutel S, De Neve S, Beheydt D, Li C, Hofman G (2006b)<br />
Regional simulation of long-term organic carbon stock<br />
changes in cropl<strong>and</strong> soils using the <strong>DNDC</strong> model: 2.<br />
Scenario analysis of management options. Soil Use<br />
<strong>and</strong> Management 22:352–361.<br />
Smith J, Smith P, Wattenbach M, Gottschalk P,<br />
Romanenkov VA, Shevtsova LK, Sirotenko OD,<br />
Rukhovich DI, Koroleva PV, Romanenko IA, Lisovoi<br />
NV (2007a) Projected changes in the organic carbon<br />
stocks of cropl<strong>and</strong> mineral soils of European Russia<br />
<strong>and</strong> the Ukraine, 1990–2070. Global Change Biology<br />
13:342–356. doi:310.1111/j.1365-2486.2006.01297.x.<br />
Smith J, Smith P, Wattenbach M, Zaehle S, Hiederer R,<br />
Jones RJA, Montanarella L, Rounsvell MDA, Reginster<br />
I, Ewert F (2005) Projected changes in mineral soil<br />
carbon of European cropl<strong>and</strong>s <strong>and</strong> grassl<strong>and</strong>s, 1990–<br />
2080. Global Change Biol 11:2141–2152.<br />
Smith P, Smith J, Flynn H, Killham K, Rangel-Castro I,<br />
Foereid B, Aitkenhead M, Chapman S, Towers W,<br />
Bell J, Lumsdon D, Milne R, Thomson A, Simmons I,<br />
Skiba U, Reynolds B, Evans C, Frogbrook Z, Bradley I,<br />
Whitmore A, Falloon P (2007b) ECOSSE – Estimating<br />
carbon in organic soils sequestration <strong>and</strong> emissions,<br />
final report. p. 177. Scottish Executive, Environment <strong>and</strong><br />
Rural Affairs Department, Environmental Research.<br />
Smith P, Smith J, Wattenbach M, Meyer J, Lindner M,<br />
Zaehle S, Hiederer R, Jones RJA, Montanarella L,<br />
Rounsevell M, Reginster I, Kankaanpää S (2006)<br />
Projected changes in mineral soil carbon of European<br />
forests, 1990–2100. Canadian Journal of Soil Science<br />
86:159–169.<br />
Smith P, Smith JU, Powlson DS, McGill WB, Arah<br />
JRM, Chertov OG, Coleman K, Franko U, Frolking<br />
S, Jenkinson DS (1997a) A comparison of the<br />
performance of nine soil organic matter models using<br />
datasets from seven long-term experiments. Geoderma<br />
81:153–225.<br />
Smith P, Smith JU, Powlson DS, McGill WB, Arah JRM,<br />
Chertov OG, Coleman K, Franko U, Frolking S,<br />
Jenkinson DS, Jensen LS, Kelly RH, Klein-Gunnewiek<br />
H, Komarov AS, Li C, Molina JAE, Mueller T, Parton<br />
WJ, Thornley JHM, Whitmore AP (1997b) A comparison<br />
of the performance of nine soil organic matter models<br />
using datasets from seven long-term experiments.<br />
Geoderma 81:153–225.<br />
Sommers LE, Gilmour CM, Wilding RE, Beck SM (1981)<br />
Effect of water potential <strong>and</strong> decomposition processes<br />
in soils. Water Potential Relations in Soil Microbiology.<br />
Special publication of the Soil Science Society of<br />
America No. 9, 97–117, Madison, WI.<br />
Soussana J-F, Loiseau P, Vuichard N, Ceschia E,<br />
Balesdent J, Chevallier T, Arrouays D (2004) Carbon<br />
cycling <strong>and</strong> sequestration opportunities in temperate<br />
grassl<strong>and</strong>s. Soil Use <strong>and</strong> Management 20:219–230.<br />
Sparling GP, Cheshire MV, Mundie CM (1982) Effect of<br />
barley plants on the decomposition of 14C-labelled soil<br />
organic matter. Journal of Soil Science 33:89–100.<br />
Tang H, Qiu J, Van Ranst E, Li C (2006) Estimations of<br />
soil organic carbon storage in cropl<strong>and</strong> of China based<br />
on <strong>DNDC</strong> model. Geoderma 134:200–206.<br />
Thornley JHM, Verbane FLJ (1989) A model of nitrogen<br />
flows in grassl<strong>and</strong>. Plant Cell Environ. 12:863–886.<br />
Tonitto C, David M, Li C, Drinkwater L (2007) Application of<br />
the <strong>DNDC</strong> model to tile-drained Illinois agroecosystems:<br />
Model comparison of conventional <strong>and</strong> diversified<br />
rotations. Nutrient Cycling in Agroecosystems 78:65–<br />
81.<br />
van Veen JA, Paul EA (1981) Organic carbon dynamics<br />
in grassl<strong>and</strong> soils. 1. Background information <strong>and</strong><br />
computer simulation. Canadian Journal of Soil Science<br />
61:185–201.<br />
Vuichard N, Ciais P, Viovy N, Calanca P, Soussana<br />
JF (2007a) Estimating the greenhouse gas<br />
fluxes of European grassl<strong>and</strong>s with a process<br />
based model: 2. Simulations at the continental<br />
level. Global Biogechemical Cycles 21:GB1005.<br />
doi:1010.1029/2005GB002612.<br />
Vuichard N, Soussana JF, Ciais P, Viovy N, Ammann<br />
C, Calanca P, Clifton-Brown J, Fuhrer J, Jones M,<br />
Martin C (2007b) Estimating the greenhouse gas<br />
fluxes of European grassl<strong>and</strong>s with a process based<br />
model: 1. Model evaluation from in situ measurements.<br />
Global Biogechemical Cycles 21:GB1004.<br />
doi:1010.1029/2005GB002611.<br />
33
Byrne <strong>and</strong> Kiely (2005-FS-32-M1)<br />
Werth M, Brauckmann H-J, Broll G, Schreiber K-F (2005)<br />
Analysis <strong>and</strong> simulation of soil organic-carbon stocks in<br />
grassl<strong>and</strong> ecosystems in SW Germany. J Pl Nutr Soil<br />
Sci 168:472–482.<br />
White R, Murray S, Rohweder M (2000) Pilot Analysis of<br />
Global Ecosystems (PAGE): Grassl<strong>and</strong> ecosystems.<br />
World Resources Institute, Washington, D.C.<br />
Wu J, O’Donnell AG, Syers JK, Adey MA, Vityakon P<br />
(1998) Modelling soil organic matter changes in leyarable<br />
rotations in s<strong>and</strong>y soils of Northeast Thail<strong>and</strong>.<br />
European Journal of Soil Science 49:463–470.<br />
doi:410.1046/j.1365-2389.1998.4930463.x.<br />
Yang XM, Zhang XP, Fang HJ, Zhu P, Ren J, Wang LC<br />
(2003) Long-term effects of fertilization on soil organic<br />
carbon changes in continuous corn of Northeast China:<br />
<strong>RothC</strong> model simulations. Environmental Management<br />
32:459–465.<br />
Zhang F, Li C, Wang Z, Wu H (2006) Modeling impacts<br />
of management alternatives on soil carbon storage of<br />
farml<strong>and</strong> in Northwest China. Biogeosciences 3:451–<br />
466.<br />
Zhang Y, Li C, Trettin C, Li H, Sun G (2002) An integrated<br />
model of soil, hydrology <strong>and</strong> vegetation for carbon<br />
dynamics in wetl<strong>and</strong> ecosystems. Global Biogechemical<br />
Cycles 16:1061. doi:1010.1029/2001GB001838.<br />
34
Evaluation of Models (<strong>PaSim</strong>, <strong>RothC</strong>, <strong>CENTURY</strong> <strong>and</strong> <strong>DNDC</strong>)<br />
for Simulation of Grassl<strong>and</strong> Carbon Cycling at Plot, Field <strong>and</strong> Regional Scale<br />
Acronyms<br />
BIO<br />
<strong>DNDC</strong><br />
DOC<br />
DPM<br />
EDCM<br />
FYM<br />
GHG<br />
IOM<br />
LAI<br />
NEE<br />
RCM<br />
<strong>RothC</strong><br />
RPM<br />
SOC<br />
SOM<br />
TSMD<br />
VSMC<br />
WFPS<br />
microbial biomass<br />
denitrification–decomposition<br />
dissolved organic carbon<br />
decomposable plant material<br />
erosion–deposition–carbon model<br />
farmyard manure<br />
greenhouse gas<br />
inert organic matter<br />
leaf area index<br />
net ecosystem exchange<br />
regional climate model<br />
Rothamsted Carbon Model<br />
resistant plant material<br />
soil organic carbon<br />
soil organic matter<br />
topsoil moisture deficit<br />
volumetric soil moisture content<br />
water-filled porosity<br />
35
An Ghníomhaireacht um Chaomhnú Comhshaoil<br />
Is í an Gníomhaireacht um Chaomhnú<br />
Comhshaoil (EPA) comhlachta reachtúil a<br />
chosnaíonn an comhshaol do mhuintir na tíre<br />
go léir. Rialaímid agus déanaimid maoirsiú ar<br />
ghníomhaíochtaí a d'fhéadfadh truailliú a<br />
chruthú murach sin. Cinntímid go bhfuil eolas<br />
cruinn ann ar threochtaí comhshaoil ionas<br />
go nglactar aon chéim is gá. Is iad na<br />
príomh-nithe a bhfuilimid gníomhach leo<br />
ná comhshaol na hÉireann a chosaint agus<br />
cinntiú go bhfuil forbairt inbhuanaithe.<br />
Is comhlacht poiblí neamhspleách í an<br />
Ghníomhaireacht um Chaomhnú Comhshaoil<br />
(EPA) a bunaíodh i mí Iúil 1993 faoin<br />
Acht fán nGníomhaireacht um Chaomhnú<br />
Comhshaoil 1992. Ó thaobh an Rialtais, is í<br />
an Roinn Comhshaoil agus Rialtais Áitiúil a<br />
dhéanann urraíocht uirthi.<br />
ÁR bhFREAGRACHTAÍ<br />
CEADÚNÚ<br />
Bíonn ceadúnais á n-eisiúint againn i gcomhair na nithe<br />
seo a leanas chun a chinntiú nach mbíonn astuithe uathu<br />
ag cur sláinte an phobail ná an comhshaol i mbaol:<br />
áiseanna dramhaíola (m.sh., líonadh talún,<br />
loisceoirí, stáisiúin aistrithe dramhaíola);<br />
gníomhaíochtaí tionsclaíocha ar scála mór (m.sh.,<br />
déantúsaíocht cógaisíochta, déantúsaíocht<br />
stroighne, stáisiúin chumhachta);<br />
diantalmhaíocht;<br />
úsáid faoi shrian agus scaoileadh smachtaithe<br />
Orgánach Géinathraithe (GMO);<br />
mór-áiseanna stórais peitreail.<br />
FEIDHMIÚ COMHSHAOIL NÁISIÚNTA<br />
Stiúradh os cionn 2,000 iniúchadh agus cigireacht<br />
de áiseanna a fuair ceadúnas ón nGníomhaireacht<br />
gach bliain.<br />
Maoirsiú freagrachtaí cosanta comhshaoil údarás<br />
áitiúla thar sé earnáil - aer, fuaim, dramhaíl,<br />
dramhuisce agus caighdeán uisce.<br />
Obair le húdaráis áitiúla agus leis na Gardaí chun<br />
stop a chur le gníomhaíocht mhídhleathach<br />
dramhaíola trí comhordú a dhéanamh ar líonra<br />
forfheidhmithe náisiúnta, díriú isteach ar chiontóirí,<br />
stiúradh fiosrúcháin agus maoirsiú leigheas na<br />
bhfadhbanna.<br />
An dlí a chur orthu siúd a bhriseann dlí comhshaoil<br />
agus a dhéanann dochar don chomhshaol mar<br />
thoradh ar a ngníomhaíochtaí.<br />
MONATÓIREACHT, ANAILÍS AGUS TUAIRISCIÚ AR<br />
AN GCOMHSHAOL<br />
<br />
<br />
Monatóireacht ar chaighdeán aeir agus caighdeáin<br />
aibhneacha, locha, uiscí taoide agus uiscí talaimh;<br />
leibhéil agus sruth aibhneacha a thomhas.<br />
Tuairisciú neamhspleách chun cabhrú le rialtais<br />
náisiúnta agus áitiúla cinntí a dhéanamh.<br />
RIALÚ ASTUITHE GÁIS CEAPTHA TEASA NA HÉIREANN<br />
Cainníochtú astuithe gáis ceaptha teasa na<br />
hÉireann i gcomhthéacs ár dtiomantas Kyoto.<br />
Cur i bhfeidhm na Treorach um Thrádáil Astuithe, a<br />
bhfuil baint aige le hos cionn 100 cuideachta atá<br />
ina mór-ghineadóirí dé-ocsaíd charbóin in Éirinn.<br />
TAIGHDE AGUS FORBAIRT COMHSHAOIL<br />
Taighde ar shaincheisteanna comhshaoil a chomhordú<br />
(cosúil le caighdéan aeir agus uisce, athrú aeráide,<br />
bithéagsúlacht, teicneolaíochtaí comhshaoil).<br />
MEASÚNÚ STRAITÉISEACH COMHSHAOIL<br />
Ag déanamh measúnú ar thionchar phleananna agus<br />
chláracha ar chomhshaol na hÉireann (cosúil le<br />
pleananna bainistíochta dramhaíola agus forbartha).<br />
PLEANÁIL, OIDEACHAS AGUS TREOIR CHOMHSHAOIL<br />
Treoir a thabhairt don phobal agus do thionscal ar<br />
cheisteanna comhshaoil éagsúla (m.sh., iarratais ar<br />
cheadúnais, seachaint dramhaíola agus rialacháin<br />
chomhshaoil).<br />
Eolas níos fearr ar an gcomhshaol a scaipeadh (trí<br />
cláracha teilifíse comhshaoil agus pacáistí<br />
acmhainne do bhunscoileanna agus do<br />
mheánscoileanna).<br />
BAINISTÍOCHT DRAMHAÍOLA FHORGHNÍOMHACH<br />
Cur chun cinn seachaint agus laghdú dramhaíola trí<br />
chomhordú An Chláir Náisiúnta um Chosc<br />
Dramhaíola, lena n-áirítear cur i bhfeidhm na<br />
dTionscnamh Freagrachta Táirgeoirí.<br />
Cur i bhfeidhm Rialachán ar nós na treoracha maidir<br />
le Trealamh Leictreach agus Leictreonach Caite agus<br />
le Srianadh Substaintí Guaiseacha agus substaintí a<br />
dhéanann ídiú ar an gcrios ózóin.<br />
Plean Náisiúnta Bainistíochta um Dramhaíl<br />
Ghuaiseach a fhorbairt chun dramhaíl ghuaiseach a<br />
sheachaint agus a bhainistiú.<br />
STRUCHTÚR NA GNÍOMHAIREACHTA<br />
Bunaíodh an Ghníomhaireacht i 1993 chun comhshaol<br />
na hÉireann a chosaint. Tá an eagraíocht á bhainistiú<br />
ag Bord lánaimseartha, ar a bhfuil Príomhstiúrthóir<br />
agus ceithre Stiúrthóir.<br />
Tá obair na Gníomhaireachta ar siúl trí ceithre Oifig:<br />
An Oifig Aeráide, Ceadúnaithe agus Úsáide<br />
Acmhainní<br />
An Oifig um Fhorfheidhmiúchán Comhshaoil<br />
An Oifig um Measúnacht Comhshaoil<br />
An Oifig Cumarsáide agus Seirbhísí Corparáide<br />
Tá Coiste Comhairleach ag an nGníomhaireacht le<br />
cabhrú léi. Tá dáréag ball air agus tagann siad le chéile<br />
cúpla uair in aghaidh na bliana le plé a dhéanamh ar<br />
cheisteanna ar ábhar imní iad agus le comhairle a<br />
thabhairt don Bhord.
Science, Technology, Research <strong>and</strong> Innovation for the Environment (STRIVE) 2007-2013<br />
The Science, Technology, Research <strong>and</strong> Innovation for the Environment (STRIVE) programme covers<br />
the period 2007 to 2013.<br />
The programme comprises three key measures: Sustainable Development, Cleaner Production <strong>and</strong><br />
Environmental Technologies, <strong>and</strong> A Healthy Environment; together with two supporting measures:<br />
EPA Environmental Research Centre (ERC) <strong>and</strong> Capacity & Capability Building. The seven principal<br />
thematic areas for the programme are Climate Change; Waste, Resource Management <strong>and</strong> Chemicals;<br />
Water Quality <strong>and</strong> the Aquatic Environment; Air Quality, Atmospheric Deposition <strong>and</strong> Noise; Impacts<br />
on Biodiversity; Soils <strong>and</strong> L<strong>and</strong>-use; <strong>and</strong> Socio-economic Considerations. In addition, other emerging<br />
issues will be addressed as the need arises.<br />
The funding for the programme (approximately €100 million) comes from the Environmental Research<br />
Sub-Programme of the National Development Plan (NDP), the Inter-Departmental Committee for the<br />
Strategy for Science, Technology <strong>and</strong> Innovation (IDC-SSTI); <strong>and</strong> EPA core funding <strong>and</strong> co-funding by<br />
economic sectors.<br />
The EPA has a statutory role to co-ordinate environmental research in Irel<strong>and</strong> <strong>and</strong> is organising <strong>and</strong><br />
administering the STRIVE programme on behalf of the Department of the Environment, Heritage <strong>and</strong><br />
Local Government.<br />
ENVIRONMENTAL PROTECTION AGENCY<br />
PO Box 3000, Johnstown Castle Estate, Co. Wexford, Irel<strong>and</strong><br />
t 053 916 0600 f 053 916 0699<br />
LoCall 1890 33 55 99<br />
e info@epa.ie w http://www.epa.ie