UBI Banca Group
UBI Banca Group
UBI Banca Group

Create successful ePaper yourself
Turn your PDF publications into a flip-book with our unique Google optimized e-Paper software.
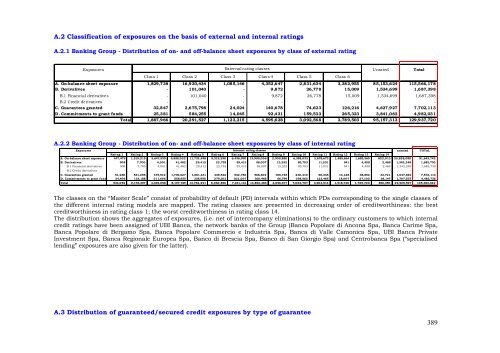
A.2 Classification of exposures on the basis of external and internal ratings<br />
A.2.1 Banking <strong>Group</strong> - Distribution of on- and off-balance sheet exposures by class of external rating<br />
Exposures External rating classes Unrated Total<br />
Class 1 Class 2 Class 3 Class 4 Class 5 Class 6<br />
A. On-balance sheet exposure 1,829,738 16,930,434 1,085,146 4,352,647 2,831,634 3,382,955 85,153,624 115,566,178<br />
B. Derivatives - 101,040 - 9,872 26,778 15,009 1,534,699 1,687,398<br />
B.1 Financial derivatives - 101,040 - 9,872 26,778 15,009 1,534,699 1,687,398<br />
B.2 Credit derivatives - - - - - - - -<br />
C. Guarantees granted 32,847 2,675,798 24,024 140,678 74,623 126,216 4,627,927 7,702,113<br />
D. Commitments to grant funds 25,381 584,255 14,045 92,431 159,533 265,323 3,841,063 4,982,031<br />
Total 1,887,966 20,291,527 1,123,215 4,595,628 3,092,568 3,789,503 95,157,313 129,937,720<br />
A.2.2 Banking <strong>Group</strong> - Distribution of on- and off-balance sheet exposures by class of internal rating<br />
Exposures Internal rating classes<br />
unrated TOTAL<br />
Rating 1 Rating 2 Rating 3 Rating 4 Rating 5 Rating 6 Rating 7 Rating 8 Rating 9 Rating 10 Rating 11 Rating 12 Rating 13 Rating 14<br />
A. On-balance sheet exposure 447,479 1,519,215 3,647,539 5,858,022 11,732,498 5,319,290 6,436,990 13,905,006 2,909,880 6,398,033 3,678,673 1,485,664 1,655,360 822,013 25,828,080 91,643,742<br />
B. Derivatives 908 7,700 4,001 41,482 29,412 22,755 59,413 58,007 13,252 85,703 11,031 941 4,408 2,469 1,342,248 1,683,730<br />
B.1 Financial derivatives 908 7,700 4,001 41,482 29,412 22,755 59,413 58,007 13,252 85,703 11,031 941 4,408 2,469 1,342,248 1,683,730<br />
B.2 Credit derivatives - - - - - - - - - - - - - - - -<br />
C. Guarantees granted 51,260 531,295 475,912 1,739,627 1,661,431 439,542 532,750 568,402 106,745 240,410 90,345 14,128 38,852 33,721 1,047,694 7,572,114<br />
D. Commitments to grant funds 34,406 118,188 211,606 558,655 338,950 279,303 302,007 360,968 66,799 298,560 123,465 18,007 27,100 38,147 1,707,575 4,483,736<br />
Total 534,052 2,176,397 4,339,058 8,197,785 13,762,291 6,060,890 7,331,161 14,892,383 3,096,677 7,022,707 3,903,514 1,518,740 1,725,720 896,350 29,925,597 105,383,322<br />
The classes on the “Master Scale” consist of probability of default (PD) intervals within which PDs corresponding to the single classes of<br />
the different internal rating models are mapped. The rating classes are presented in decreasing order of creditworthiness: the best<br />
creditworthiness in rating class 1; the worst creditworthiness in rating class 14.<br />
The distribution shows the aggregates of exposures, (i.e. net of intercompany eliminations) to the ordinary customers to which internal<br />
credit ratings have been assigned of <strong>UBI</strong> <strong>Banca</strong>, the network banks of the <strong>Group</strong> (<strong>Banca</strong> Popolare di Ancona Spa, <strong>Banca</strong> Carime Spa,<br />
<strong>Banca</strong> Popolare di Bergamo Spa, <strong>Banca</strong> Popolare Commercio e Industria Spa, <strong>Banca</strong> di Valle Camonica Spa, <strong>UBI</strong> <strong>Banca</strong> Private<br />
Investment Spa, <strong>Banca</strong> Regionale Europea Spa, Banco di Brescia Spa, Banco di San Giorgio Spa) and Centrobanca Spa (“specialised<br />
lending” exposures are also given for the latter).<br />
A.3 Distribution of guaranteed/secured credit exposures by type of guarantee<br />
389