- Page 2 and 3:
Joint stock co-operative company Re
- Page 4 and 5:
▪ Principal risks and uncertainti
- Page 6 and 7:
REPORT ON CORPORATE GOVERNANCE AND
- Page 8 and 9:
A low risk profile The Group has no
- Page 10 and 11:
UBI Banca: company officers Honorar
- Page 12:
UBI Banca Group: the main investmen
- Page 15 and 16:
The rating As the sovereign debt cr
- Page 17 and 18:
Notice of call 1 An Ordinary Genera
- Page 21 and 22:
The macroeconomic scenario In a gen
- Page 23 and 24:
Monetary policy action taken by the
- Page 25 and 26:
imports (+24.9%) than in exports (+
- Page 27 and 28:
permanently balance public accounts
- Page 29 and 30:
In the light of the very serious cr
- Page 31 and 32:
total of the variable component of
- Page 33 and 34:
The “hour glass” shaped distrib
- Page 35 and 36:
dynamic use of credit recovery serv
- Page 37 and 38:
The contribution of the outstanding
- Page 39 and 40:
4 th -7 th July 2011 (offer period
- Page 41 and 42:
Action undertaken on the branch net
- Page 43 and 44:
Disposal of UBI Pramerica SGR opera
- Page 45 and 46:
Finally, the UBI Banca Group increa
- Page 47 and 48:
• the “Italian Banking Associat
- Page 49 and 50:
- the global financial crisis, whic
- Page 51 and 52:
As a result of new loan disbursemen
- Page 53 and 54:
Again with regard to financial educ
- Page 55 and 56:
As concerns the Foreign-Commercial
- Page 57 and 58:
This dialogue with customers is not
- Page 59 and 60:
The distribution network and positi
- Page 61 and 62:
The Italian distribution network of
- Page 63 and 64:
Remote channels Market coverage by
- Page 65 and 66:
• private individual customers ca
- Page 67 and 68:
Human resources The composition of
- Page 69 and 70: The percentage of part-time employe
- Page 71 and 72: Personnel management policies and i
- Page 73 and 74: • the implementation of the “Va
- Page 75 and 76: editions were published in 2011). A
- Page 77 and 78: 15. Barberini Sa (100% controlled)
- Page 79 and 80: Companies consolidated using the eq
- Page 81 and 82: - 22 nd February 2011: UBI Banca de
- Page 83 and 84: total price of €77 million. Conse
- Page 85 and 86: Reclassified consolidated financial
- Page 87 and 88: Reclassified consolidated income st
- Page 89 and 90: Reclassified consolidated income st
- Page 91 and 92: Notes to the reclassified consolida
- Page 93 and 94: marked improvement compared to €8
- Page 95 and 96: elation to higher volumes of busine
- Page 97 and 98: equity investments (including PerMi
- Page 99 and 100: (+0.9%). The changes summarise the
- Page 101 and 102: Brescia and €116.3 million of imp
- Page 103 and 104: - the partial non deductibility of
- Page 105 and 106: The comments that follow are based
- Page 107 and 108: Total funding Total group funding,
- Page 109 and 110: On the other hand, while significan
- Page 111 and 112: In detail, institutional funding wa
- Page 113 and 114: The public tender offer to purchase
- Page 115 and 116: As concerns mutual investment funds
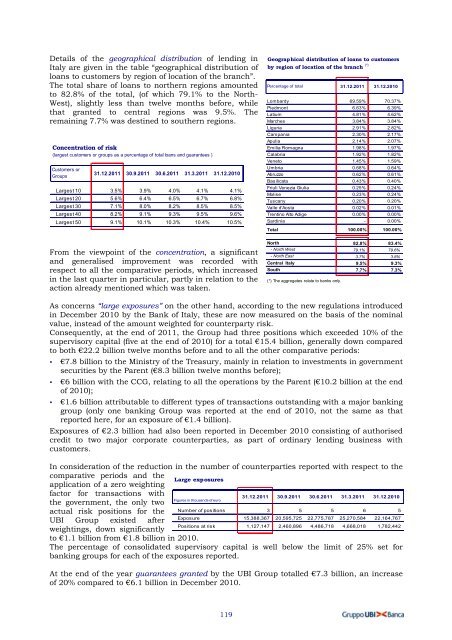
- Page 117 and 118: General banking business with custo
- Page 119: The ratio of lending to funding in
- Page 123 and 124: unsecured non-performing loans (€
- Page 125 and 126: Loans to customers: changes in dete
- Page 127 and 128: The interbank market and the liquid
- Page 129 and 130: Loans to banks: composition Changes
- Page 131 and 132: The collateral pool also benefited
- Page 133 and 134: Financial assets The year 2011 was
- Page 135 and 136: - the Centrobanca corporate bond po
- Page 137 and 138: Financial instruments held for trad
- Page 139 and 140: Financial liabilities held for trad
- Page 141 and 142: As concerns, on the other hand, por
- Page 143 and 144: Exposures to some types of products
- Page 145 and 146: SPE underlying assets Figures in mi
- Page 147 and 148: The table below summarises on- and
- Page 149 and 150: OTC interest rate derivatives: deta
- Page 151 and 152: OTC derivatives: first five counter
- Page 153 and 154: Fair value reserves of available-fo
- Page 155 and 156: illion) and on the other hand for t
- Page 157 and 158: The system of internal control The
- Page 159 and 160: from the scope of the regulations f
- Page 161 and 162: Consolidated companies: the princip
- Page 163 and 164: Direct funding from customers Figur
- Page 165 and 166: The performance of the main consoli
- Page 167 and 168: exposures secured by real estate pr
- Page 169 and 170: million) and other services (+€5.
- Page 171 and 172:
BANCA POPOLARE COMMERCIO E INDUSTRI
- Page 173 and 174:
accounts and deposits and term depo
- Page 175 and 176:
- net interest income reached €16
- Page 177 and 178:
BANCA POPOLARE DI ANCONA SPA Figure
- Page 179 and 180:
under management, which fell overal
- Page 181 and 182:
million) and the repurchase of own
- Page 183 and 184:
CENTROBANCA SPA Figures in thousand
- Page 185 and 186:
principally to new classifications
- Page 187 and 188:
- the net result for financial acti
- Page 189 and 190:
IW BANK SPA Figures in thousands of
- Page 191 and 192:
overdrafts, while the remaining €
- Page 193 and 194:
y the “Company restructuring prog
- Page 195 and 196:
UBI PRAMERICA SGR SPA Figures in th
- Page 197 and 198:
UBI FACTOR SPA Figures in thousands
- Page 199 and 200:
impaired loans - attributable mainl
- Page 201 and 202:
managers of Banca Popolare Commerci
- Page 203 and 204:
Development Decree - Decree Law No.
- Page 205 and 206:
‐ the tax treatment of provisions
- Page 207 and 208:
a different criterion is used to ca
- Page 209 and 210:
Further details of tax inspections
- Page 211 and 212:
In 2011, UBI Banca obtained visibil
- Page 213 and 214:
meetings with representatives of bo
- Page 215 and 216:
Legislation on the protection of pe
- Page 217 and 218:
• risks defined as measurable, fo
- Page 219 and 220:
uncertainty surrounding the outcome
- Page 221 and 222:
Compliance of corporate health and
- Page 223 and 224:
STATEMENT OF THE CHIEF EXECUTIVE OF
- Page 225 and 226:
Certification of the consolidated f
- Page 227 and 228:
Independent auditors’ report 226
- Page 229 and 230:
228
- Page 231 and 232:
Consolidated Balance Sheet
- Page 233 and 234:
Consolidated Income Statement figur
- Page 235 and 236:
Statement of changes in consolidate
- Page 237 and 238:
Consolidated Statement of Cash Flow
- Page 239 and 240:
PART A - Accounting policies A.1 -
- Page 241 and 242:
Accounting policies The accounting
- Page 243 and 244:
The income statement of the investo
- Page 245 and 246:
39. UBI Finance Srl Milan euro 10,0
- Page 247 and 248:
▪ ▪ ▪ 14 th March 2012: the U
- Page 249 and 250:
consequent absence of taxable incom
- Page 251 and 252:
List of the main IFRS standards end
- Page 253 and 254:
Reg. 1126/2008, SIC 7 Introduction
- Page 255 and 256:
1.2. Definition of financial assets
- Page 257 and 258:
performance by stock markets rather
- Page 259 and 260:
3.4 Derecognition criteria Held-to-
- Page 261 and 262:
original loan contract, or in the p
- Page 263 and 264:
The methods used for measurement of
- Page 265 and 266:
6.3 Measurement criteria Investment
- Page 267 and 268:
individual renewals, or if the asse
- Page 269 and 270:
An intangible asset is recognised i
- Page 271 and 272:
(a) within asset item 120 of the ba
- Page 273 and 274:
10.1. Current tax assets and liabil
- Page 275 and 276:
might affect the amount required to
- Page 277 and 278:
14.3.2 Post-employment benefits and
- Page 279 and 280:
Interest is recognised on an accrua
- Page 281 and 282:
Level 2 Where no prices are availab
- Page 283 and 284:
A.3.2.1 Accounting portfolios: dist
- Page 285 and 286:
2.2 Financial assets held for tradi
- Page 287 and 288:
3.3. Financial assets at fair value
- Page 289 and 290:
4.4 Available-for-sale financial as
- Page 291 and 292:
6.2 Loans to banks: assets subject
- Page 293 and 294:
- 5 % auto sector; - 3 % aeronautic
- Page 295 and 296:
SECTION 10 Equity investments - Ite
- Page 297 and 298:
10.3 Annual changes in equity inves
- Page 299 and 300:
SECTION 11 Technical reserves of re
- Page 301 and 302:
These valuation methods were perfor
- Page 303 and 304:
Details of the item “Goodwill”
- Page 305 and 306:
13.2 Annual changes in intangible a
- Page 307 and 308:
comparable transactions for corpora
- Page 309 and 310:
Second level impairment test Becaus
- Page 311 and 312:
Cash Generating Unit Increase in th
- Page 313 and 314:
No deferred tax assets were recogni
- Page 315 and 316:
14.7 Other information The tables a
- Page 317 and 318:
15.2 Other information Nothing to r
- Page 319 and 320:
SECTION 2 Due to customers - Item 2
- Page 321 and 322:
Details of item A.1 “Subordinated
- Page 323 and 324:
SECTION 4 Financial liabilities hel
- Page 325 and 326:
6.2 Hedging derivatives: compositio
- Page 327 and 328:
11.2 Other information The demograp
- Page 329 and 330:
demographic tables; the characteri
- Page 331 and 332:
Changes in liabilities in 2011 for
- Page 333 and 334:
The economic and financial assumpti
- Page 335 and 336:
• degree of “innovation” in t
- Page 337 and 338:
year, for 2004 the tax authorities
- Page 339 and 340:
Banca Carime (2003 and 2004) increa
- Page 341 and 342:
15.2 Share capital - Number of shar
- Page 343 and 344:
Also, with regard to the conversion
- Page 345 and 346:
UBI Leasing SpA + €353 thousand R
- Page 347 and 348:
5. Management and intermediation on
- Page 349 and 350:
1.4 Interest expense and similar: c
- Page 351 and 352:
2.2 Commission expense: composition
- Page 353 and 354:
SECTION 6 Income (loss) from dispos
- Page 355 and 356:
8.2 Net impairment losses on availa
- Page 357 and 358:
SECTION 9 Net premiums - Item 150 9
- Page 359 and 360:
SECTION 12 Net provisions for risks
- Page 361 and 362:
SECTION 16 Profits (losses) of equi
- Page 363 and 364:
SECTION 19 Profits (losses) on disp
- Page 365 and 366:
SECTION 21 Post-tax profit after ta
- Page 367 and 368:
(v) (vi) (vii) (viii) (ix) (x) on 5
- Page 369 and 370:
368
- Page 371 and 372:
- AMA) - in combined use with the t
- Page 373 and 374:
1.2 Policies for the management of
- Page 375 and 376:
- it works with the Rating Desk and
- Page 377 and 378:
Credit processes within the network
- Page 379 and 380:
Credit risk management policy A pro
- Page 381 and 382:
Policy for the distribution of mort
- Page 383 and 384:
- pledge. In the case of mortgage c
- Page 385 and 386:
Quantitative information A. Credit
- Page 387 and 388:
A.1.3 Banking Group - On- and off-b
- Page 389 and 390:
A.1.7 Banking Group - On-balance sh
- Page 391 and 392:
A.3.1 Banking Group - Guaranteed/se
- Page 393 and 394:
B. Distribution and concentration o
- Page 395 and 396:
B.3 Banking group - Geographical di
- Page 397 and 398:
of a loan portfolio was signed, whi
- Page 399 and 400:
• performing loans resulting from
- Page 401 and 402:
Orio Finance 3 Originator UBI Banca
- Page 403 and 404:
Tabella 7: 190090O|1 - NOTA C.1.6 I
- Page 405 and 406:
C.2 Transfers C.2.1 Financial asset
- Page 407 and 408:
C.3 Banking Group - Covered bond op
- Page 409 and 410:
transferred. Each of these swaps ha
- Page 411 and 412:
3. management of the operations. Th
- Page 413 and 414:
Subsequently, in November 2011, aft
- Page 415 and 416:
D. Banking group - Models for the m
- Page 417 and 418:
one day VaR limit for the UBI Group
- Page 419 and 420:
Backtesting analysis Backtesting an
- Page 421 and 422:
The analysis shows a very heightene
- Page 423 and 424:
different hypotheses for the elasti
- Page 425 and 426:
2.3 Currency risk Qualitative infor
- Page 427 and 428:
2.4 Derivative financial instrument
- Page 429 and 430:
A.3 Financial derivatives: gross po
- Page 431 and 432:
A.7 OTC financial derivatives: bank
- Page 433 and 434:
B. Credit derivatives B.1 Credit de
- Page 435 and 436:
The system for the management of li
- Page 437 and 438:
Quantitative information 1.1 Distri
- Page 439 and 440:
1.3 Distribution over time by resid
- Page 441 and 442:
1.5 Distribution over time by resid
- Page 443 and 444:
4 BANKING GROUP - OPERATIONAL RISKS
- Page 445 and 446:
- Local Operational Risk Support Of
- Page 447 and 448:
16031). It must also be underlined
- Page 449 and 450:
Quantitative information The graphs
- Page 451 and 452:
Operational losses detected in 2011
- Page 453 and 454:
B. Quantitative information Informa
- Page 455 and 456:
Section 2 - Capital and banking sup
- Page 457 and 458:
deductions and negative filters, to
- Page 459 and 460:
PART G - Business combination trans
- Page 461 and 462:
the consolidated income tax act) co
- Page 463 and 464:
Transactions with related parties -
- Page 465 and 466:
Principal income statement items wi
- Page 467 and 468:
it is calculated on the basis of th
- Page 469 and 470:
Distribution by business segment: b
- Page 471:
Assistance activities (risk assessm