

Chapter 2 Regional Summaries - Texas Water Development Board
Chapter 2 Regional Summaries - Texas Water Development Board
Chapter 2 Regional Summaries - Texas Water Development Board

You also want an ePaper? Increase the reach of your titles
YUMPU automatically turns print PDFs into web optimized ePapers that Google loves.
WAT E R FOR TEXAS 2012 STATE WATER PLAN<br />
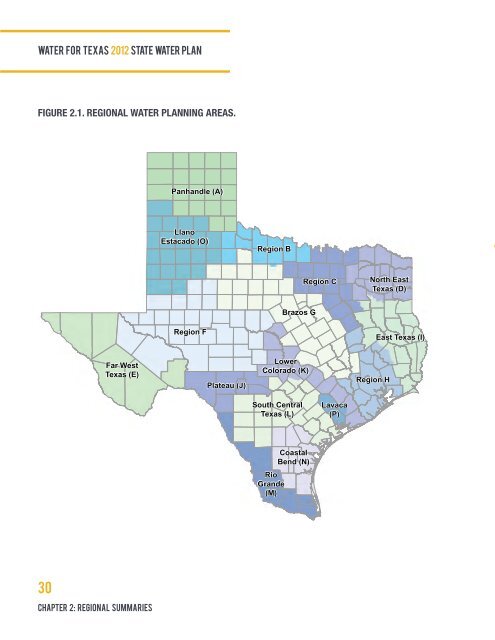
FIGURE 2.1. REGIONAL WATER PLANNING AREAS.<br />
Panhandle (A)<br />
Llano<br />
Estacado (O)<br />
Region B<br />
Region C<br />
North East<br />
<strong>Texas</strong> (D)<br />
Brazos G<br />
Region F<br />
East <strong>Texas</strong> (I)<br />
Far West<br />
<strong>Texas</strong> (E)<br />
Plateau (J)<br />
Lower<br />
Colorado (K)<br />
Region H<br />
South Central<br />
<strong>Texas</strong> (L)<br />
Lavaca<br />
(P)<br />
Rio<br />
Grande<br />
(M)<br />
Coastal<br />
Bend (N)<br />
30<br />
<strong>Chapter</strong> 2: REGIONAL summaries
WAT E R FOR TEXAS 2012 STATE WATER PLAN<br />
2 <strong>Regional</strong><br />
<strong>Summaries</strong><br />
The 16 regional water planning groups are the foundation for developing the regional water plans and the state<br />
water plan. With technical and administrative assistance from TWDB, each group worked to create a regional<br />
water plan that would meet the water supply needs of their planning area during a drought of record. <strong>Chapter</strong><br />
2 of this report summarizes key findings from each regional plan including<br />
• a brief description of each region;<br />
• highlights of each plan;<br />
• population and water demand projections;<br />
• existing water supplies, including groundwater, surface water, and reuse;<br />
• future water supply needs;<br />
• recommended water management strategies and their costs;<br />
• water conservation recommendations;<br />
• select major water management strategies;<br />
• a description of region-specific studies; and<br />
• planning group members and interests represented.<br />
Individual regional water plans and a comprehensive database of regional water plan information are available<br />
on the TWDB’s website. In addition, Appendix A contains a detailed table of recommended and alternative<br />
water management strategies for each region, including total capital and unit costs for each strategy and water<br />
supply volumes projected for each strategy by decade.<br />
31<br />
<strong>Chapter</strong> 2: REGIONAL summaries
2 Summary of the<br />
Panhandle (A) Region<br />
The Panhandle <strong>Regional</strong> <strong>Water</strong> Planning<br />
Area includes 21 counties split between the<br />
Canadian and Red River basins.<br />
The Panhandle <strong>Regional</strong> <strong>Water</strong> Planning Area includes 21 counties split between the Canadian and Red River<br />
basins (Figure A.1). The major cities in the region include Amarillo, Pampa, Borger, and Dumas. Groundwater<br />
from the Ogallala Aquifer is the region’s primary source of water and is used at a rate that exceeds recharge. The<br />
economy of this region is grounded in agribusiness. The 2011 Panhandle (A) <strong>Regional</strong> <strong>Water</strong> Plan can be found<br />
on the TWDB Web site at https://www.twdb.state.tx.us/wrpi/rwp/3rdRound/2011_RWP/RegionA/.<br />
PLAN HIGHLIGHTS<br />
• Additional supply needed in 2060—418,414 acre-feet per year<br />
• Recommended water management strategy volume in 2060—648,221 acre-feet per year<br />
• Total capital cost—$739 million<br />
• Conservation accounts for 86 percent of 2060 strategy volumes<br />
• Conservation primarily associated with irrigation<br />
• Significant groundwater development<br />
• Significant unmet irrigation needs in near-term<br />
32<br />
<strong>Chapter</strong> 2: Panhandle (A) region summary<br />
WAT E R FOR TEXAS 2012 STATE WATER PLAN
FIGURE A.1. PANHANDLE (A) REGIONAL WATER PLANNING AREA.<br />
Dallam<br />
Sherman<br />
Hansford<br />
Ochiltree<br />
Lipscomb<br />
Hartley<br />
Moore<br />
Hutchinson<br />
Roberts<br />
Hemphill<br />
Canadian River<br />
Oldham<br />
Potter<br />
Carson<br />
Gray<br />
Wheeler<br />
Region A<br />
Region A<br />
Major Rivers<br />
Cities<br />
Major Rivers<br />
Cities<br />
Existing Reservoirs<br />
Ogallala Aquifer<br />
Seymour Aquifer<br />
Randall<br />
Armstrong<br />
Donley<br />
Collingsworth<br />
Existing Reservoirs Blaine Aquifer (outcrop)*<br />
Red River<br />
Blaine Aquifer (subsurface)*<br />
Ogallala Aquifer<br />
Dockum Aquifer*<br />
Seymour Aquifer<br />
* Minor aquifer (only shown where there is no major aquifer)<br />
Blaine Aquifer (outcrop)*<br />
Hall<br />
Childress<br />
Blaine Aquifer (subsurface)*<br />
Dockum Aquifer*<br />
* Minor aquifer (only shown where there is no major aquifer)<br />
WAT E R FOR TEXAS 2012 STATE WATER PLAN<br />
33<br />
<strong>Chapter</strong> 2: Panhandle (A) region summary
POPULATION AND WATER DEMANDS<br />
Approximately 2 percent of the state’s total population resided in the Panhandle Region in the year 2010. Between<br />
2010 and 2060, population is projected to increase 39 percent to 541,035. The region’s total water demands,<br />
however, are projected to decrease, driven by a decline in agricultural irrigation, which is by far the largest water<br />
user in the region (Table A.1, Figure A.2).<br />
EXISTING WATER SUPPLIES<br />
The region primarily relies upon groundwater supply sources, with approximately 88 percent (Table A.1) of<br />
the existing water supply in the Panhandle Region coming from the Ogallala Aquifer. Other aquifers (Blaine,<br />
Dockum, Seymour, and Rita Blanca) provide approximately 7 percent of the total supply, and surface water,<br />
including Lake Meredith and Greenbelt Lake, contributes another 3 percent of supplies. Reuse contributes the<br />
remaining 2 percent of existing water supply in the planning area. Within the region, of the supplies available<br />
from the Ogallala Aquifer, 85 percent is used for irrigation purposes (Table A.1, Figure A.2). Based on the region’s<br />
adopted water management policy, annual water supplies for the region from the Ogallala Aquifer are projected<br />
to decline 37 percent by 2060.<br />
NEEDS<br />
In the event of drought, water needs occur across the region in all decades (Table A.1, Figure A.2). The majority<br />
of the needs are in irrigation, with some other, smaller needs, primarily in municipal and manufacturing.<br />
RECOMMENDED WATER MANAGEMENT STRATEGIES AND COST<br />
The Panhandle Planning Group recommended water management strategies focused on conservation and<br />
groundwater development. It also recommended connecting to the Palo Duro Reservoir. In all, the strategies<br />
would provide 648,221 acre-feet of additional water supply by the year 2060 (Figure A.3) at a total capital cost<br />
of $739 million (Appendix A). However, the Canadian River Municipal <strong>Water</strong> Authority will provide some of<br />
this water to customers in the Llano Estacado Region. Because there were no economically feasible strategies<br />
identified to meet their needs, up to six counties in the region have unmet irrigation needs across the planning<br />
horizon, and 30,307 acre-feet of unmet irrigation needs in 2060.<br />
CONSERVATION RECOMMENDATIONS<br />
Conservation strategies represent 86 percent of the total volume of water associated with all recommended<br />
strategies (Figures A.3 and A.4). <strong>Water</strong> conservation was recommended for every municipal need and for<br />
all irrigation water user groups in the region. Irrigation conservation would be achieved through irrigation<br />
equipment improvements, conservation tillage practices, and the adoption of drought-resistant crop varieties.<br />
34<br />
<strong>Chapter</strong> 2: Panhandle (A) region summary<br />
WAT E R FOR TEXAS 2012 STATE WATER PLAN
TABLE A.1. POPULATION, WATER SUPPLY, DEMAND, AND NEEDS 2010–2060<br />
Projected Population<br />
2010 2020 2030 2040 2050 2060<br />
388,104 423,380 453,354 484,954 516,729 541,035<br />
Existing Supplies (acre-feet per year)<br />
Surface water 40,636 47,381 47,348 47,284 47,189 47,043<br />
Groundwater 1,131,151 1,018,554 951,799 877,961 790,795 714,438<br />
Reuse 25,129 28,928 30,620 32,528 34,598 37,577<br />
Total <strong>Water</strong> Supply 1,196,916 1,094,863 1,029,767 957,773 872,582 799,058<br />
Demands (acre-feet per year)<br />
Municipal 68,137 72,793 76,638 80,648 84,614 87,658<br />
County-other 9,468 11,097 12,550 14,035 15,516 16,584<br />
Manufacturing 43,930 47,275 49,998 52,612 54,860 58,231<br />
Mining 14,012 14,065 13,218 11,696 10,495 9,542<br />
Irrigation 1,429,990 1,311,372 1,271,548 1,203,332 1,066,736 936,929<br />
Steam-electric 25,139 26,996 29,116 30,907 33,163 37,415<br />
Livestock 37,668 43,345 45,487 47,842 50,436 53,285<br />
Total <strong>Water</strong> Demands 1,628,344 1,526,943 1,498,555 1,441,072 1,315,820 1,199,644<br />
Needs (acre-feet per year)<br />
Municipal 0 967 7,354 13,968 20,492 25,712<br />
County-other 0 108 1,190 2,663 4,235 5,502<br />
Manufacturing 173 800 1,317 2,845 4,212 5,866<br />
Irrigation 454,628 452,144 477,338 482,226 433,155 381,180<br />
Steam-electric 75 99 117 128 136 154<br />
Total <strong>Water</strong> Needs 454,876 454,118 487,316 501,830 462,230 418,414<br />
A<br />
FIGURE A.2. 2060 PANHANDLE REGION EXISTING SUPPLIES, PROJECTED DEMANDS, AND<br />
IDENTIFIED WATER NEEDS BY WATER USE CATEGORY (ACRE-FEET PER YEAR).<br />
1,000,000<br />
900,000<br />
800,000<br />
700,000<br />
600,000<br />
500,000<br />
400,000<br />
Existing <strong>Water</strong> Supplies<br />
Projected <strong>Water</strong> Demands<br />
Identified <strong>Water</strong> Needs<br />
A-2<br />
300,000<br />
200,000<br />
100,000<br />
0<br />
MUNICIPAL MANUFACTURING MINING IRRIGATION STEAM-ELECTRIC LIVESTOCK<br />
WAT E R FOR TEXAS 2012 STATE WATER PLAN<br />
35<br />
<strong>Chapter</strong> 2: Panhandle (A) region summary
SELECT MAJOR WATER MANAGEMENT STRATEGIES<br />
• Roberts County Well Field (City of Amarillo) would provide up to 22,420 acre-feet per year of groundwater<br />
in the year 2060 with a capital cost of $287 million.<br />
• Roberts County Well Field (Canadian River Municipal <strong>Water</strong> Authority) would provide 15,000 acre-feet per<br />
year of groundwater starting in 2030 with a capital cost of $22 million.<br />
• Potter County Well Field would provide up to 11,182 acre-feet per year of groundwater starting in 2020 with<br />
a capital cost of $129 million.<br />
• Irrigation conservation would provide up to 552,385 acre-feet per year of water in 2060 with no capital cost.<br />
REGION-SPECIFIC STUDIES<br />
The <strong>Regional</strong> <strong>Water</strong> Planning Group developed one region-specific study during the initial phase of the third<br />
planning cycle. The final report documenting the findings can be found on the TWDB Web site at https://www.<br />
twdb.state.tx.us/wrpi/rwp/rwp_study.asp#a.<br />
• Ogallala Recharge Study – Groundwater Recharge in Central High Plains of <strong>Texas</strong>: Roberts and Hemphill<br />
Counties<br />
PANHANDLE PLANNING GROUP MEMBERS AND INTERESTS REPRESENTED<br />
Voting members during adoption of the 2011 <strong>Regional</strong> <strong>Water</strong> Plan:<br />
C. E. Williams (Chair), water districts; Emmett Autry, municipalities; Tom Bailiff, water districts; Joe Baumgardner,<br />
agriculture; Cole Camp, environmental; Nolan Clark, environmental; Vernon Cook, county; Charles Cooke, water<br />
utilities; Jim Derington, river authorities; Rusty Gilmore, small business; Janet Guthrie, public; Bill Hallerberg,<br />
industries; Kendall Harris, agriculture; Gale Henslee, electric generating utilities; Denise Jett, industries; David<br />
Landis, municipalities; Grady Skaggs, environmental; John M. Sweeten, higher education; Janet Tregellas,<br />
agriculture; Steve Walthour, water districts; Ben Weinheimer, agriculture; John C. Williams, water districts<br />
Former voting members during the 2006 – 2011 planning cycle:<br />
Richard Bowers, water districts; Dan Coffey, municipalities; B.A. Donelson, agriculture; Bobbie Kidd, water<br />
districts; Inge Brady Rapstine, environmental; Rudie Tate, agriculture<br />
36<br />
<strong>Chapter</strong> 2: Panhandle (A) region summary<br />
WAT E R FOR TEXAS 2012 STATE WATER PLAN
FIGURE A.3. RECOMMENDED WATER MANAGEMENT STRATEGY WATER SUPPLY VOLUMES FOR<br />
2010–2060 (ACRE-FEET PER YEAR).<br />
700,000<br />
600,000<br />
500,000<br />
400,000<br />
300,000<br />
200,000<br />
Weather Modification<br />
Other Surface <strong>Water</strong><br />
Groundwater<br />
Irrigation Conservation<br />
Municipal Conservation<br />
Total <strong>Water</strong> Needs<br />
A3<br />
100,000<br />
0<br />
2010 2020 2030 2040 2050 2060<br />
FIGURE A.4. 2060 RECOMMENDED WATER MANAGEMENT STRATEGIES–RELATIVE SHARE OF SUPPLY.<br />
Other Surface <strong>Water</strong><br />
0.6%<br />
Irrigation Conservation<br />
85.2%<br />
Groundwater<br />
11.1%<br />
A-4<br />
Weather Modification<br />
2.3%<br />
Municipal Conservation<br />
0.7%<br />
WAT E R FOR TEXAS 2012 STATE WATER PLAN<br />
37<br />
<strong>Chapter</strong> 2: Panhandle (A) region summary
2 Summary of<br />
Region B<br />
The Region B <strong>Regional</strong> <strong>Water</strong> Planning Area<br />
encompasses all or parts of 11 counties in<br />
north central <strong>Texas</strong> bordering the Red River.<br />
The Region B <strong>Regional</strong> <strong>Water</strong> Planning Area encompasses all or parts of 11 counties in north central <strong>Texas</strong><br />
bordering the Red River. Parts of three river basins (Red, Brazos, and Trinity) lie within the region (Figure B.1).<br />
The major cities in the region include Wichita Falls, Burkburnett, and Vernon. The main components of the<br />
region’s economy are farming, mineral production, and ranching. The 2011 Region B <strong>Regional</strong> <strong>Water</strong> Plan can be<br />
found on the TWDB Web site at: https://www.twdb.state.tx.us/wrpi/rwp/3rdRound/2011_RWP/RegionB/.<br />
PLAN HIGHLIGHTS<br />
• Additional supply needed in 2060—40,397 acre-feet per year<br />
• Recommended water management strategy volume in 2060—77,003 acre-feet per year<br />
• Total capital cost—$499 million<br />
• Conservation accounts for 19 percent of 2060 strategy volumes<br />
• One new major reservoir (Ringgold)<br />
• Limited unmet irrigation needs in 2010<br />
38<br />
<strong>Chapter</strong> 2: region B summary<br />
WAT E R FOR TEXAS 2012 STATE WATER PLAN
FIGURE B.1. REGION B REGIONAL WATER PLANNING AREA.<br />
Hardeman<br />
Red River<br />
Cottle<br />
Foard<br />
Wilbarger<br />
Wichita<br />
King<br />
Baylor<br />
Archer<br />
Clay<br />
Montague<br />
Region B<br />
Brazos River<br />
Young<br />
Trinity River<br />
Major Rivers<br />
Cities<br />
Region B<br />
Existing Reservoirs<br />
Major Rivers<br />
Seymour Aquifer<br />
Trinity Aquifer (outcrop)<br />
Cities<br />
Trinity Aquifer (subsurface)<br />
Existing Reservoirs<br />
Blaine Aquifer (outcrop)*<br />
Seymour Aquifer<br />
Blaine Aquifer (subsurface)*<br />
Trinity Aquifer (outcrop)<br />
* Minor aquifer (only shown where there is no major aquifer)<br />
Trinity Aquifer (subsurface)<br />
Blaine Aquifer (outcrop)*<br />
Blaine Aquifer (subsurface)*<br />
* Minor aquifer (only shown where there is no major aquifer)<br />
WAT E R FOR TEXAS 2012 STATE WATER PLAN<br />
39<br />
<strong>Chapter</strong> 2: region B summary
POPULATION AND WATER DEMANDS<br />
Just less than 1 percent of the state’s total population resided in Region B in the year 2010. Between 2010 and<br />
2060, its population is projected to increase 5 percent to 221,734. However, total water demands are projected to<br />
decrease slightly, by approximately 1 percent (Table B.1, Figure B.2.) Agricultural irrigation is the largest share<br />
of the regional demand but decreases over the planning period by 9 percent due to anticipated future irrigation<br />
efficiency. Municipal water demands account for the second largest water use in Region B and are expected to<br />
decrease by 5 percent over the planning cycle.<br />
EXISTING WATER SUPPLIES<br />
The region relies on both surface and groundwater sources. Its total existing water supply is projected to decline<br />
by 12 percent to 152,582 acre-feet in 2060 (Table B.1, Figure B.2). Surface water supplies to the region come from<br />
12 reservoirs within the region and one reservoir (Greenbelt) located in the Panhandle Region. The Lake Kemp<br />
and Lake Diversion System represent the largest single source of surface water to Region B, providing 33 percent<br />
of the region’s supplies in 2010.<br />
The Seymour Aquifer is the source of the majority of the groundwater in the region, providing 29 percent of<br />
the region’s projected supplies in 2060. Other aquifers, including the Blaine and Trinity aquifers, are projected<br />
to provide 9 percent of the region’s supply in 2060. Significant water quality issues impact both surface and<br />
groundwater sources in the region. In the headwater region of the Wichita River, saline springs affect the quality<br />
of surface water supplies. In addition, users of the Seymour Aquifer have had to treat for elevated nitrate<br />
concentrations in the water.<br />
NEEDS<br />
The majority of Region B water needs are associated with irrigation and steam-electric uses. Irrigation water<br />
needs account for 97 percent of Region B water needs in 2010. By 2060 irrigation water use will account for 72<br />
percent of needs and 27 percent of needs will be associated with steam-electric (Table B.1, Figure B.2). Countyother<br />
and mining needs also exist throughout the planning cycle.<br />
The region also emphasized planning for municipal and manufacturing entities that had little or no supplies<br />
above their projected water demands. This additional planning was considered necessary because of uncertainty<br />
related to the potential for droughts worse than the drought of record and for uncertainty associated with<br />
potential climate change. For these entities, Region B considered providing additional supplies equivalent to 20<br />
percent of their projected demands. This Region B planning criterion identified water needs for six additional<br />
water user groups.<br />
RECOMMENDED WATER MANAGEMENT STRATEGIES AND COST<br />
The Region B Planning Group recommended water management strategies including groundwater development,<br />
direct reuse, reservoir system operation changes, and construction of Lake Ringgold. In all, the strategies would<br />
provide 77,003 acre-feet of additional water supply by the year 2060 (Figures B.3 and B.4) at a total capital cost of<br />
40<br />
<strong>Chapter</strong> 2: region B summary<br />
WAT E R FOR TEXAS 2012 STATE WATER PLAN
TABLE B.1. POPULATION, WATER SUPPLY, DEMAND, AND NEEDS 2010–2060<br />
Projected Population<br />
2010 2020 2030 2040 2050 2060<br />
210,642 218,918 223,251 224,165 223,215 221,734<br />
Existing Supplies (acre-feet per year)<br />
Surface water 115,509 111,239 106,991 102,724 98,477 94,179<br />
Groundwater 58,456 58,439 58,431 58,410 58,403 58,403<br />
Total <strong>Water</strong> Supply 173,965 169,678 165,422 161,134 156,880 152,582<br />
Demands (acre-feet per year)<br />
Municipal 36,695 35,394 35,964 35,532 35,107 34,964<br />
County-other 4,269 4,261 4,232 4,132 3,855 3,732<br />
Manufacturing 3,547 3,755 3,968 4,260 4,524 4,524<br />
Mining 909 845 811 785 792 792<br />
Irrigation 99,895 97,702 95,537 93,400 91,292 91,292<br />
Steam-electric 13,360 17,360 21,360 21,360 21,360 21,360<br />
Livestock 12,489 12,489 12,489 12,489 12,489 12,489<br />
Total <strong>Water</strong> Demands 171,164 171,806 174,361 171,958 169,419 169,153<br />
Needs (acre-feet per year)<br />
County-other 437 468 491 502 460 462<br />
Mining 177 153 145 149 162 162<br />
Irrigation 22,945 23,926 24,909 25,893 26,876 29,058<br />
Steam-electric 0 3,800 8,529 9,258 9,987 10,715<br />
Total <strong>Water</strong> Needs 23,559 28,347 34,074 35,802 37,485 40,397<br />
B<br />
FIGURE B.2. 2060 REGION B EXISTING SUPPLIES, PROJECTED DEMANDS, AND IDENTIFIED WATER<br />
NEEDS BY WATER USE CATEGORY (ACRE-FEET PER YEAR).<br />
100,000<br />
90,000<br />
80,000<br />
70,000<br />
60,000<br />
50,000<br />
Existing <strong>Water</strong> Supplies<br />
Projected <strong>Water</strong> Demands<br />
Identified <strong>Water</strong> Needs<br />
B-2<br />
40,000<br />
30,000<br />
20,000<br />
10,000<br />
0<br />
MUNICIPAL MANUFACTURING MINING IRRIGATION STEAM-ELECTRIC LIVESTOCK<br />
WAT E R FOR TEXAS 2012 STATE WATER PLAN<br />
41<br />
<strong>Chapter</strong> 2: region B summary
$499.2 million (Appendix A). Implementing the recommended water management strategies will meet regional<br />
needs projected to occur for 2020 and beyond.<br />
CONSERVATION RECOMMENDATIONS<br />
Conservation strategies for municipal and irrigation water users represent 19 percent of the total volume of<br />
water associated with all recommended strategies in 2060. Municipal water conservation was recommended<br />
for every municipal and county-other water user group with a need. Irrigation conservation is planned to be<br />
accomplished through an irrigation canal lining strategy.<br />
SELECT MAJOR WATER MANAGEMENT STRATEGIES<br />
• Construction of Lake Ringgold would provide 27,000 acre-feet per year of water starting in the year 2050<br />
with a capital cost of $383 million.<br />
• Increasing the water conservation pool at Lake Kemp would provide up to 24,834 acre-feet per year of water<br />
in 2020 with a capital cost of $130,000.<br />
• Enclosing canal laterals for surface water conveyance in pipe would provide 13,034 acre-feet per year starting<br />
in the year 2010 with a capital cost of $7.7 million.<br />
• Wichita Basin Chloride Control Project would contribute to the provision of 26,500 acre-feet per year of<br />
surface water starting in 2010 with a capital cost of $95 million.<br />
REGION-SPECIFIC STUDIES<br />
The <strong>Regional</strong> <strong>Water</strong> Planning Group developed one region-specific study during the initial phase of the third<br />
planning cycle. The final report documenting the findings can be found on the TWDB Web-site at https://www.<br />
twdb.state.tx.us/wrpi/rwp/rwp_study.asp#b.<br />
• Wichita County <strong>Water</strong> Improvement District Number 2 <strong>Water</strong> Conservation Implementation Plan<br />
REGION B PLANNING GROUP MEMBERS AND INTERESTS REPRESENTED<br />
Voting members during adoption of the 2011 <strong>Regional</strong> <strong>Water</strong> Plan:<br />
Curtis Campbell (Chair), river authorities; Jimmy Banks, water districts; Charlie Bell, counties; J.K. Rooter<br />
Brite, environmental; Ed Garnett, municipalities; Dale Hughes, agriculture; Robert Kincaid, municipalities;<br />
Kenneth Liggett, counties; Mike McGuire, water districts; Dean Myers, small business; Kenneth Patton, electric<br />
generating utilities; Jerry Payne, public; Wilson Scaling, agriculture; Tom Stephens, industries; Pamela Stephens,<br />
environmental; Russell Schreiber, municipalities; Jeff Watts, water utilities<br />
Former voting members during the 2006 – 2011 planning cycle:<br />
Mark Barton, electric generating utilities; Kelly Couch, municipalities; Paul Hawkins, public; Tommy Holub,<br />
water utilities; Norman Horner, environmental; Joe Johnson, Jr., industries; Kenneth McNabb, counties<br />
42<br />
<strong>Chapter</strong> 2: region B summary<br />
WAT E R FOR TEXAS 2012 STATE WATER PLAN
FIGURE B.3. RECOMMENDED WATER MANAGEMENT STRATEGY WATER SUPPLY VOLUMES FOR<br />
2010–2060 (ACRE-FEET PER YEAR).<br />
80,000<br />
70,000<br />
60,000<br />
50,000<br />
40,000<br />
30,000<br />
20,000<br />
Other Surface <strong>Water</strong><br />
New Major Reservoir<br />
Reuse<br />
Groundwater<br />
Irrigation Conservation<br />
Municipal Conservation<br />
Total <strong>Water</strong> Needs<br />
B3<br />
10,000<br />
0<br />
2010 2020 2030 2040 2050 2060<br />
FIGURE B.4. 2060 RECOMMENDED WATER MANAGEMENT STRATEGIES–RELATIVE SHARE OF SUPPLY.<br />
Other Surface <strong>Water</strong><br />
44.7%<br />
B-4<br />
New Major Reservoir<br />
35.1%<br />
Groundwater<br />
1.0%<br />
Reuse<br />
0.2%<br />
Municipal Conservation<br />
2.2%<br />
Irrigation Conservation<br />
16.9%<br />
WAT E R FOR TEXAS 2012 STATE WATER PLAN<br />
43<br />
<strong>Chapter</strong> 2: region B summary
2 Summary of<br />
Region C<br />
The Region C <strong>Regional</strong> <strong>Water</strong> Planning Area<br />
includes all or parts of 16 counties.<br />
The Region C <strong>Regional</strong> <strong>Water</strong> Planning Area includes all or parts of 16 counties (Figure C.1). Overlapping much<br />
of the upper portion of the Trinity River Basin, Region C also includes smaller parts of the Red, Brazos, Sulphur,<br />
and Sabine river basins. The Dallas-Fort Worth metropolitan area is centrally located in the region, and its<br />
surrounding counties are among the fastest growing in the state. Major economic sectors in the region include<br />
service, trade, manufacturing, and government. The 2011 Region C <strong>Regional</strong> <strong>Water</strong> Plan can be found on the<br />
TWDB Web site at https://www.twdb.state.tx.us/wrpi/rwp/3rdRound/2011_RWP/RegionC/.<br />
PLAN HIGHLIGHTS<br />
• Additional supply needed in 2060—1,588,236 acre-feet per year<br />
• Recommended water management strategy volume in 2060—2,360,302 acre-feet per year<br />
• Total capital cost—$21.5 billion<br />
• Conservation accounts for 12 percent of 2060 strategy volumes<br />
• Reuse accounts for 11 percent of 2060 strategy volumes<br />
• Four new major reservoirs (Ralph Hall, Lower Bois d’Arc, Marvin Nichols, Fastrill Replacement Project)<br />
• Significant costs associated with numerous conveyance projects<br />
44<br />
<strong>Chapter</strong> 2: region C summary<br />
WAT E R FOR TEXAS 2012 STATE WATER PLAN
FIGURE C.1. REGION C REGIONAL WATER PLANNING AREA.<br />
Red River<br />
Cooke<br />
Grayson<br />
Fannin<br />
Trinity River<br />
Jack Wise Denton<br />
Collin<br />
Rockwall<br />
Region C<br />
Parker<br />
Tarrant<br />
Dallas<br />
Major Rivers<br />
Cities<br />
Kaufman<br />
Trinity River<br />
Existing Reservoirs<br />
Carrizo - Wilcox Aquifer (outcrop)<br />
Ellis<br />
Carrizo - Wilcox Aquifer (subsurface)<br />
Region C<br />
Trinity Aquifer (outcrop)<br />
Major Rivers<br />
Trinity Aquifer (subsurface)<br />
Cities<br />
Nacatoch Aquifer (outcrop)*<br />
Existing Reservoirs<br />
Nacatoch Aquifer (subsurface)*<br />
Carrizo - Wilcox Aquifer (outcrop)<br />
Queen City Aquifer*<br />
Carrizo - Wilcox Aquifer (subsurface)<br />
Woodbine Aquifer (outcrop)*<br />
Woodbine<br />
Trinity<br />
Aquifer<br />
Aquifer<br />
(subsurface)*<br />
(outcrop)<br />
Trinity Aquifer (subsurface)<br />
* Minor aquifer (only shown where there is no major aquifer)<br />
Nacatoch Aquifer (outcrop)*<br />
Navarro<br />
Freestone<br />
Henderson<br />
Nacatoch Aquifer (subsurface)*<br />
Queen City Aquifer*<br />
Woodbine Aquifer (outcrop)*<br />
Woodbine Aquifer (subsurface)*<br />
* Minor aquifer (only shown where there is no major aquifer)<br />
WAT E R FOR TEXAS 2012 STATE WATER PLAN<br />
45<br />
<strong>Chapter</strong> 2: region c summary
POPULATION AND WATER DEMANDS<br />
Approximately 26 percent of <strong>Texas</strong>’ population resided in Region C in the year 2010. By 2060, the population<br />
of the region is projected to grow 96 percent to 13,045,592. Projections indicate that by 2060 Region C water<br />
demands will increase 86 percent (Table C.1). Municipal demands are projected to increase by 91 percent by<br />
2060 and will account for 88 percent of the total projected Region C demands. With the exception of livestock<br />
demands, which remain constant, all categories of water demands are projected to increase over the planning<br />
horizon (Table C.1, Figure C.2).<br />
EXISTING WATER SUPPLIES<br />
The total water supply in Region C is projected to decline by about 3 percent by 2060 (Table C.1, Figure C.2). This<br />
projected decline is due to reservoir sedimentation. Existing reservoirs within Region C are projected to provide<br />
nearly 58 percent of total water supplies in the region, while surface water supplies located outside of the region<br />
account for another 22 percent. Groundwater from the Trinity Aquifer and several minor aquifers provides<br />
approximately 7 percent of supplies. Currently authorized reuse provides 10 percent of the available supply to<br />
Region C. The remaining 2 percent of the water supply comes from local sources, such as run-of-river permits.<br />
NEEDS<br />
The majority of water supply needs in Region C are for municipal uses (Table C.1, Figure C.2). By 2060, water<br />
supply needs in the region are projected to total 1,588,236 acre-feet. Ninety-two percent of this projected need<br />
(1,459,025 acre-feet) is for municipal users and county-other.<br />
RECOMMENDED WATER MANAGEMENT STRATEGIES AND COST<br />
Region C considered a variety of water management strategies to meet needs. In all, the strategies provide an<br />
additional 2.4 million acre-feet by 2060 (Figures C.3 and C.4), with a total capital cost of $21.5 billion (Appendix<br />
A) if all the recommended water management strategies are implemented. The plan recommends four new<br />
major reservoirs: Lower Bois d’Arc, Ralph Hall, Marvin Nichols, and Fastrill Replacement Project.<br />
CONSERVATION RECOMMENDATIONS<br />
Conservation strategies account for approximately 12 percent (290,709 acre-feet) of the total volume of water<br />
associated with all recommended strategies. A basic conservation package, including education, pricing<br />
structure, water waste prohibitions, water system audits, and plumbing code changes, was recommended for all<br />
municipal water user groups in Region C. An expanded conservation package, including additional strategies<br />
such as landscape irrigation restrictions and residential water audits, was recommended for some municipal<br />
water user groups.<br />
46<br />
<strong>Chapter</strong> 2: region C summary<br />
WAT E R FOR TEXAS 2012 STATE WATER PLAN
TABLE C.1. POPULATION, WATER SUPPLY, DEMAND, AND NEEDS 2010–2060<br />
2010 2020 2030 2040 2050 2060<br />
Projected Population 6,670,493 7,971,728 9,171,650 10,399,038 11,645,686 13,045,592<br />
Existing Supplies (acre-feet per year)<br />
Surface water 1,481,272 1,406,598 1,359,808 1,343,319 1,328,097 1,305,588<br />
Groundwater 125,939 121,827 121,916 122,074 122,117 122,106<br />
Reuse 182,686 231,816 273,003 293,292 300,143 307,129<br />
Total <strong>Water</strong> Supplies 1,789,897 1,760,241 1,754,727 1,758,685 1,750,357 1,734,823<br />
Demands (acre-feet per year)<br />
Municipal 1,512,231 1,796,086 2,048,664 2,304,240 2,571,450 2,882,356<br />
County-other 34,738 37,584 38,932 39,874 40,725 41,800<br />
Manufacturing 72,026 81,273 90,010 98,486 105,808 110,597<br />
Mining 41,520 38,961 41,630 44,486 47,435 50,200<br />
Irrigation 40,776 40,966 41,165 41,373 41,596 41,831<br />
Steam-electric 40,813 64,625 98,088 107,394 116,058 126,428<br />
Livestock 19,248 19,248 19,248 19,248 19,248 19,248<br />
Total <strong>Water</strong> Demands 1,761,352 2,078,743 2,377,737 2,655,101 2,942,320 3,272,460<br />
C<br />
Needs (acre-feet per year)<br />
Municipal 67,519 362,099 614,610 859,838 1,127,749 1,445,025<br />
County-other 87 5,158 7,931 10,118 12,295 14,302<br />
Manufacturing 557 11,946 21,151 30,369 39,640 48,894<br />
Mining 414 4,909 10,036 14,782 19,445 23,779<br />
Irrigation 510 2,588 3,412 4,007 4,492 4,913<br />
Steam-electric 0 13,217 29,696 34,835 40,997 51,323<br />
Total <strong>Water</strong> Needs 69,087 399,917 686,836 953,949 1,244,618 1,588,236<br />
FIGURE C.2. 2060 REGION C EXISTING SUPPLIES, PROJECTED DEMANDS, AND IDENTIFIED WATER<br />
NEEDS BY WATER USE CATEGORY (ACRE-FEET PER YEAR).<br />
3,500,000<br />
3,000,000<br />
2,500,000<br />
2,000,000<br />
Existing <strong>Water</strong> Supplies<br />
Projected <strong>Water</strong> Demands<br />
Identified <strong>Water</strong> Needs<br />
C-2<br />
1,500,000<br />
1,000,000<br />
500,000<br />
0<br />
MUNICIPAL MANUFACTURING MINING IRRIGATION STEAM-ELECTRIC LIVESTOCK<br />
WAT E R FOR TEXAS 2012 STATE WATER PLAN<br />
47<br />
<strong>Chapter</strong> 2: region c summary
SELECT MAJOR WATER MANAGEMENT STRATEGIES<br />
• Toledo Bend Reservoir supply would provide up to 400,229 acre-feet per year of water with a capital cost of<br />
$2.4 billion (with Region I entities responsible for 20 percent of cost).<br />
• Marvin Nichols Reservoir would provide up to 472,300 acre-feet per year of water with a capital cost of $3.4<br />
billion.<br />
• Reallocation of the flood pool of Wright Patman Lake would provide 112,100 acre-feet per year of water<br />
starting in the year 2040 with a capital cost of $897 million.<br />
• The Lake Tawakoni pipeline project would provide up to 77,994 acre-feet per year of water in 2010 with a<br />
capital cost of $496 million.<br />
REGION-SPECIFIC STUDIES<br />
The <strong>Regional</strong> <strong>Water</strong> Planning Group developed seven region-specific studies during the initial phase of the third<br />
planning cycle. The final reports documenting the findings can be found on the TWDB Web site at https://www.<br />
twdb.state.tx.us/wrpi/rwp/rwp_study.asp#c.<br />
• <strong>Water</strong> Supply Study for Ellis County, Johnson County, Southern Dallas County, and Southern Tarrant County<br />
• <strong>Water</strong> Supply Study for Parker and Wise Counties<br />
• Direct, Non-Potable Reuse Guidance Document<br />
• Indirect Reuse Guidance Document<br />
• Region C <strong>Water</strong> Conservation and Reuse Study<br />
• County-Wide Meetings Memorandum<br />
• Toledo Bend Pipeline Project Coordination Activities Technical Memorandum<br />
REGION C PLANNING GROUP MEMBERS AND INTERESTS REPRESENTED<br />
Voting members during adoption of the 2011 <strong>Regional</strong> <strong>Water</strong> Plan:<br />
James (Jim) Parks (Chair), water districts; Steve Berry, environmental; Bill Ceverha, public; Jerry W. Chapman,<br />
water districts; Frank Crumb, municipalities; Russell Laughlin, industries; Bill Lewis, small business; G.K.<br />
Maenius, counties; Howard Martin, municipalities; Jim McCarter, water utilities; Paul Phillips, municipalities;<br />
Jody Puckett, municipalities; Robert O. Scott, environmental; Gary Spicer, electric generating utilities; Connie<br />
Standridge, water utilities; Jack Stevens, water districts; Danny Vance, river authorities; Mary E. Vogelson,<br />
public; Tom Woodward, agriculture<br />
Former voting members during the 2006 – 2011 planning cycle:<br />
Brad Barnes, agriculture; Roy Eaton, small business; Dale Fisseler, municipalities; Bob Johnson, municipalities;<br />
Jerry Johnson, electric generating utilities; Elaine Petrus, environmental; Marsh Rice, public; Paul Zweicker,<br />
electric generating utilities<br />
48<br />
<strong>Chapter</strong> 2: region C summary<br />
WAT E R FOR TEXAS 2012 STATE WATER PLAN
FIGURE C.3. RECOMMENDED WATER MANAGEMENT STRATEGY WATER SUPPLY VOLUMES FOR<br />
2010–2060 (ACRE-FEET PER YEAR).<br />
2,500,000<br />
2,000,000<br />
1,500,000<br />
1,000,000<br />
Other Surface <strong>Water</strong><br />
New Major Reservoir<br />
Reuse<br />
Groundwater<br />
Other Conservation<br />
Irrigation Conservation<br />
Municipal Conservation<br />
Total <strong>Water</strong> Needs<br />
500,000<br />
0<br />
2010 2020 2030 2040 2050 2060<br />
FIGURE C.4. 2060 RECOMMENDED WATER MANAGEMENT STRATEGIES–RELATIVE SHARE OF SUPPLY.<br />
Other Surface <strong>Water</strong><br />
45.1%<br />
Groundwater<br />
0.2%<br />
Reuse<br />
11.6%<br />
C-4<br />
Municipal Conservation<br />
12.1%<br />
New Major Reservoir<br />
30.8%<br />
Other Conservation<br />
0.1%<br />
Irrigation Conservation<br />
0.1%<br />
WAT E R FOR TEXAS 2012 STATE WATER PLAN<br />
49<br />
<strong>Chapter</strong> 2: region c summary
2 Summary of<br />
North East <strong>Texas</strong> (D) Region<br />
The North East <strong>Texas</strong> <strong>Regional</strong> <strong>Water</strong><br />
Planning Area encompasses all or parts<br />
of 19 counties.<br />
The North East <strong>Texas</strong> <strong>Regional</strong> <strong>Water</strong> Planning Area encompasses all or parts of 19 counties (Figure D.1). While<br />
largely rural, the region includes the cities of Longview, Texarkana, and Greenville. The planning area overlaps<br />
large portions of the Red, Sulphur, Cypress, and Sabine river basins and smaller parts of the Trinity and Neches<br />
river basins. The North East <strong>Texas</strong> Region’s main economic base is agribusiness, including a variety of crops, as<br />
well as cattle and poultry production. Timber, oil and gas, and mining are significant industries in the eastern<br />
portion of the region. In the western portion of the region, many residents are employed in the Dallas-Fort Worth<br />
metropolitan area. The 2011 North East <strong>Texas</strong> (D) <strong>Regional</strong> <strong>Water</strong> Plan can be found on the TWDB Web site at<br />
https://www.twdb.state.tx.us/wrpi/rwp/3rdRound/2011_RWP/RegionD/.<br />
PLAN HIGHLIGHTS<br />
• Additional supply needed in 2060—96,142 acre-feet per year<br />
• Recommended water management strategy volume in 2060—98,466 acre-feet per year<br />
• Total capital cost—$39 million<br />
• Limited unmet irrigation needs<br />
• Surface water contract strategies to meet most needs including contracting for water from new reservoir in<br />
Region C<br />
• Opposition to Marvin Nichols Reservoir<br />
• Three unique stream segments recommended for designation (Figure ES.8)<br />
50<br />
<strong>Chapter</strong> 2: North East <strong>Texas</strong> (D) Region s u m m a ry<br />
WAT E R FOR TEXAS 2012 STATE WATER PLAN
FIGURE D.1. NORTH EAST TEXAS (D) REGIONAL WATER PLANNING AREA.<br />
Red River<br />
Sulphur River<br />
Lamar<br />
Red River<br />
Bowie<br />
Sabine River<br />
Delta<br />
Hunt<br />
Hopkins<br />
Franklin<br />
Titus<br />
Morris<br />
Region D<br />
Cass<br />
Major Rivers<br />
Cities<br />
Camp<br />
Existing Reservoirs<br />
Carrizo - Wilcox Aquifer (outcrop)<br />
Carrizo - Wilcox Aquifer (subsurface)<br />
Rains<br />
Wood<br />
Upshur<br />
Marion<br />
Trinity Aquifer (subsurface)<br />
Blossom Aquifer (outcrop)*<br />
Blossom Aquifer (subsurface)*<br />
Van Zandt<br />
Gregg<br />
Harrison<br />
Nacatoch Aquifer (outcrop)*<br />
Region D<br />
Nacatoch Aquifer (subsurface)*<br />
Major Rivers<br />
Queen City Aquifer*<br />
Neches River<br />
Cities<br />
Woodbine Aquifer (outcrop)*<br />
Existing Reservoirs<br />
Woodbine Aquifer (subsurface)*<br />
Carrizo - Wilcox Aquifer (outcrop)<br />
* Minor aquifer (only shown where there is no major aquifer)<br />
Carrizo - Wilcox Aquifer (subsurface)<br />
Trinity Aquifer (subsurface)<br />
Blossom Aquifer (outcrop)*<br />
Blossom Aquifer (subsurface)*<br />
Nacatoch Aquifer (outcrop)*<br />
Nacatoch Aquifer (subsurface)*<br />
Queen City Aquifer*<br />
Woodbine Aquifer (outcrop)*<br />
Woodbine Aquifer (subsurface)*<br />
* Minor aquifer (only shown where there is no major aquifer)<br />
Smith<br />
Cypress River<br />
WAT E R FOR TEXAS 2012 STATE WATER PLAN<br />
51<br />
<strong>Chapter</strong> 2: North East <strong>Texas</strong> (D) Region s u m m a ry
POPULATION AND WATER DEMANDS<br />
Approximately 3 percent of the state’s total population resided in the North East <strong>Texas</strong> Region in the year 2010.<br />
By 2060, the region’s population is projected to grow 57 percent to 1,213,095. <strong>Water</strong> demands for the region are<br />
projected to increase 50 percent (Table D.1). Throughout the planning period, manufacturing makes up the largest<br />
portion of demands, with the total volume of its demands increasing by 40 percent (Table D.1). Steam-electric<br />
and municipal demands will also increase significantly. By 2060, demand for steam-electric power generation<br />
is projected to more than double, and municipal demand will increase about 51 percent (Table D.1, Figure D.2).<br />
EXISTING WATER SUPPLIES<br />
The total existing water supply for the North East <strong>Texas</strong> Region was estimated to be approximately 999,745<br />
acre-feet in 2010, increasing to 1,036,488 acre-feet in 2060 (Table D.1, Figure D.2). Existing supplies increase<br />
over the planning horizon to reflect new uses, including groundwater wells and surface water contracts. In<br />
2010, surface water, primarily from the Sabine, Cypress, and Sulphur river basins, was projected to provide 83<br />
percent of existing supplies, and the remaining 17 percent was equally divided between groundwater and reuse.<br />
Major aquifers include the Carrizo-Wilcox Aquifer in the central and southern part of the region and the Trinity<br />
Aquifer in the north.<br />
NEEDS<br />
In 2010, the total water supply volume was not accessible to all users in the region. As a result, the North<br />
East <strong>Texas</strong> Region was projected to have a water supply need of 10,252 acre-feet, with steam-electric power<br />
generation needs making up approximately 84 percent of the total, or 8,639 acre-feet (Table D.1, Figure D.2).<br />
By 2060, water supply needs are projected to total 96,142 acre-feet. Steam-electric power generation needs will<br />
account for nearly 81 percent of the total needs, while the remaining needs will affect municipal, rural, and<br />
irrigated agriculture users.<br />
RECOMMENDED WATER MANAGEMENT STRATEGIES AND COST<br />
Of the 61 identified shortages in the region, 21 are the result of contract expirations. However, the planning<br />
group assumed that all contracts would be renewed. For the remaining projected shortages, the planning group<br />
recommended two types of water management strategies to meet needs: new groundwater wells and new<br />
surface water purchases. If fully implemented, recommended water management strategies would provide an<br />
additional 98,466 acre-feet of supply in the year 2060 (Figures D.3 and D.4) at a total capital cost of $38.5 million<br />
(Appendix A). Although groundwater will provide more individual water user groups with water, surface water<br />
constitutes approximately 93 percent of the total volume of supply from recommended water management<br />
strategies (Figure D.4).<br />
52<br />
<strong>Chapter</strong> 2: North East <strong>Texas</strong> (D) Region s u m m a ry<br />
WAT E R FOR TEXAS 2012 STATE WATER PLAN
TABLE D.1. POPULATION, WATER SUPPLY, DEMAND, AND NEEDS 2010–2060<br />
Projected Population<br />
2010 2020 2030 2040 2050 2060<br />
772,163 843,027 908,748 978,298 1,073,570 1,213,095<br />
Existing Supplies (acre-feet per year)<br />
Surface water 831,239 838,379 843,707 848,652 855,180 864,067<br />
Groundwater 84,864 87,501 89,332 90,800 92,361 94,786<br />
Reuse 83,642 78,247 72,821 67,505 68,761 77,635<br />
Total <strong>Water</strong> Supplies 999,745 1,004,127 1,005,860 1,006,957 1,016,302 1,036,488<br />
Demands (acre-feet per year)<br />
Municipal 90,171 96,359 102,345 109,227 119,821 135,811<br />
County-other 29,780 32,352 34,404 36,177 38,637 42,367<br />
Manufacturing 301,091 328,568 351,427 373,504 392,387 421,496<br />
Mining 8,802 9,605 10,108 10,595 11,111 11,625<br />
Irrigation 15,504 15,415 15,329 15,182 14,949 14,728<br />
Steam-electric 89,038 96,492 112,809 132,703 156,951 186,509<br />
Livestock 26,690 26,736 26,785 26,698 26,554 26,441<br />
Total <strong>Water</strong> Demands 561,076 605,527 653,207 704,086 760,410 838,977<br />
Needs (acre-feet per year)<br />
Municipal 1,404 2,082 2,834 3,856 8,190 16,711<br />
County-other 153 276 411 587 748 1,574<br />
Irrigation 56 0 14 115 238 388<br />
Steam-electric 8,639 12,366 15,437 27,396 50,829 77,469<br />
Total <strong>Water</strong> Needs 10,252 14,724 18,696 31,954 60,005 96,142<br />
D<br />
FIGURE D.2. 2060 NORTH EAST TEXAS (D) EXISTING SUPPLIES, PROJECTED DEMANDS, AND<br />
IDENTIFIED WATER NEEDS BY WATER USE CATEGORY (ACRE-FEET PER YEAR).<br />
500,000<br />
450,000<br />
400,000<br />
350,000<br />
300,000<br />
250,000<br />
Existing <strong>Water</strong> Supplies<br />
Projected <strong>Water</strong> Demands<br />
Identified <strong>Water</strong> Needs<br />
D-2<br />
200,000<br />
150,000<br />
100,000<br />
50,000<br />
0<br />
MUNICIPAL MANUFACTURING MINING IRRIGATION STEAM-ELECTRIC LIVESTOCK<br />
WAT E R FOR TEXAS 2012 STATE WATER PLAN<br />
53<br />
<strong>Chapter</strong> 2: North East <strong>Texas</strong> (D) Region s u m m a ry
CONSERVATION RECOMMENDATIONS<br />
The North East <strong>Texas</strong> Planning Group considered conservation strategies for each water user group with a need<br />
and a per capita water use greater than 140 gallons per capita per day. Because costs of conservation strategies<br />
were relatively high due to the small size of the entities and amounts of water involved, the region did not<br />
recommend conservation as a water management strategy.<br />
SELECT MAJOR WATER MANAGEMENT STRATEGIES<br />
• Increasing existing contracts would provide up to 59,473 acre-feet per year of surface water, and some<br />
groundwater, in the year 2060 with no capital costs, only annual costs of contracts.<br />
• New surface water contracts would provide up to 32,231 acre-feet per year of water in 2060 with a capital<br />
cost of $6.3 million.<br />
• Drilling new wells would provide 6,757 acre-feet per year of water in 2060 with a capital cost of $32.3 million.<br />
REGION-SPECIFIC STUDIES<br />
The <strong>Regional</strong> <strong>Water</strong> Planning Group developed two region-specific studies during the initial phase of the third<br />
planning cycle. The final reports documenting the findings can be found on the TWDB Web site at https://www.<br />
twdb.state.tx.us/wrpi/rwp/rwp_study.asp#d.<br />
• Further Evaluation of Sub-<strong>Regional</strong> <strong>Water</strong> Supply Master Plans<br />
• Brackish Groundwater Study<br />
NORTH EAST TEXAS PLANNING GROUP MEMBERS AND INTERESTS REPRESENTED<br />
Voting members during adoption of the 2011 <strong>Regional</strong> <strong>Water</strong> Plan:<br />
Richard LeTourneau (Chair), environmental; Max Bain, counties; Keith Bonds, municipalities; Adam Bradley,<br />
agriculture; Greg Carter, electric generating utilities; Gary Cheatwood, public; Nancy Clements, agriculture;<br />
Darwin Douthit, agriculture; Mike Dunn, municipalities; Jim Eidson, environmental; Scott Hammer, industries;<br />
Troy Henry, river authorities; Don Hightower, counties; Sam Long, counties; Bret McCoy, small business; Sharron<br />
Nabors, agriculture; Jim Nickerson, industries; Don Patterson, counties; Ken Shaw, industries; Shirley Shumake,<br />
public; Bob Staton, small business; Doug Wadley, industries; David Weidman, water districts; Richard Zachary,<br />
water utilities<br />
Former voting members during the 2006 – 2011 planning cycle:<br />
John Bryan, public; Larry Calvin, environmental; Dean Carrell, municipalities; Jimmy Clark, environmental;<br />
George Frost, public; Mendy Rabicoff, small business; Jim Thompson, agriculture<br />
54<br />
<strong>Chapter</strong> 2: North East <strong>Texas</strong> (D) Region s u m m a ry<br />
WAT E R FOR TEXAS 2012 STATE WATER PLAN
FIGURE D.3. RECOMMENDED WATER MANAGEMENT STRATEGY WATER SUPPLY VOLUMES FOR<br />
2010–2060 (ACRE-FEET PER YEAR).<br />
100,000<br />
80,000<br />
60,000<br />
40,000<br />
Other Surface <strong>Water</strong><br />
Groundwater<br />
Total <strong>Water</strong> Needs<br />
D<br />
20,000<br />
0<br />
2010 2020 2030 2040 2050 2060<br />
FIGURE D.4. 2060 RECOMMENDED WATER MANAGEMENT STRATEGIES–RELATIVE SHARE OF SUPPLY.<br />
Other Surface <strong>Water</strong><br />
93.1%<br />
D-4<br />
Groundwater<br />
6.9%<br />
WAT E R FOR TEXAS 2012 STATE WATER PLAN<br />
55<br />
<strong>Chapter</strong> 2: North East <strong>Texas</strong> (D) Region s u m m a ry
2 Summary of<br />
Far West <strong>Texas</strong> (E) Region<br />
The Far West <strong>Texas</strong> <strong>Regional</strong> <strong>Water</strong> Planning<br />
Area includes seven counties and lies within<br />
the Rio Grande Basin.<br />
The Far West <strong>Texas</strong> <strong>Regional</strong> <strong>Water</strong> Planning Area includes seven counties and lies within the Rio Grande Basin<br />
(Figure E.1). The largest economic sectors in the region are agriculture, agribusiness, manufacturing, tourism,<br />
wholesale and retail trade, government, and military. About 97 percent of the people in this planning area reside<br />
in El Paso County. The 2011 Far West <strong>Texas</strong> (E) <strong>Regional</strong> <strong>Water</strong> Plan can be found on the TWDB Web site at<br />
https://www.twdb.state.tx.us/wrpi/rwp/3rdRound/2011_RWP/RegionE/.<br />
PLAN HIGHLIGHTS<br />
• Additional supply needed in 2060—226,569 acre-feet per year<br />
• Recommended water management strategy volume in 2060—130,526 acre-feet per year<br />
• Total capital cost—$842 million<br />
• Conservation accounts for 40 percent of 2060 strategy volumes<br />
• Significant unmet irrigation needs<br />
• Groundwater desalination accounts for 21 percent of 2060 strategy volumes<br />
• One additional unique stream segment recommended for designation (Figure ES.8)<br />
56<br />
<strong>Chapter</strong> 2: far west <strong>Texas</strong> (E) Region s u m m a ry<br />
WAT E R FOR TEXAS 2012 STATE WATER PLAN
FIGURE E.1. FAR WEST TEXAS (E) REGIONAL WATER PLANNING AREA.<br />
El Paso<br />
Hudspeth<br />
Culberson<br />
Rio Grande River<br />
Region E<br />
Major Rivers<br />
Cities<br />
Existing Reservoir<br />
Edwards - Trinity (Plateau) Aquifer<br />
Jeff Davis<br />
Pecos River<br />
Terrell<br />
Region E<br />
Hueco - Mesilla Bolsons Aquifer<br />
Pecos Valley Aquifer<br />
Bone Spring - Victorio Peak Aquifer*<br />
Capitan Reef Complex Aquifer*<br />
Major Rivers<br />
Cities<br />
Igneous Aquifer*<br />
Marathon Aquifer*<br />
Rustler Aquifer (outcrop)*<br />
Existing Reservoir<br />
Rustler Aquifer (subsurface)*<br />
Edwards - Trinity (Plateau) Aquifer<br />
West <strong>Texas</strong> Bolsons Aquifer*<br />
Hueco - Mesilla Bolsons Aquifer<br />
* Minor aquifer (only shown where there is no major aquifer)<br />
Pecos Valley Aquifer<br />
Bone Spring - Victorio Peak Aquifer*<br />
Capitan Reef Complex Aquifer*<br />
Igneous Aquifer*<br />
Marathon Aquifer*<br />
Rustler Aquifer (outcrop)*<br />
Rustler Aquifer (subsurface)*<br />
West <strong>Texas</strong> Bolsons Aquifer*<br />
* Minor aquifer (only shown where there is no major aquifer)<br />
Presidio<br />
Brewster<br />
WAT E R FOR TEXAS 2012 STATE WATER PLAN<br />
57<br />
<strong>Chapter</strong> 2: far west <strong>Texas</strong> (E) Region s u m m a ry
POPULATION AND WATER DEMANDS<br />
Less than 4 percent of the state’s total population resided in the Far West <strong>Texas</strong> Region in 2010. By 2060, the<br />
regional population is projected to increase 79 percent (Table E.1). <strong>Regional</strong> water demands, however, will<br />
increase less dramatically. By 2060, the total water demands for the region are projected to increase 8 percent<br />
(Table E.1). Agricultural irrigation water use makes up the largest share of these demands in all decades even<br />
though it is projected to decrease 10 percent over the planning period (Table E.1). Municipal water demand is<br />
projected to increase 60 percent by 2060 (Table E.1, Figure E.2).<br />
EXISTING WATER SUPPLIES<br />
The total water supply for 2010 is estimated to be 514,593 acre-feet (Table E.1, Figure E.2). Other than some<br />
irrigation use and El Paso municipal use, the region relies on groundwater for most of its water supply.<br />
Approximately 75 percent of the region’s existing water supply consists of groundwater from two major aquifers<br />
(Edwards-Trinity [Plateau] outcrop and the Hueco-Mesilla Bolsons) and six minor aquifers. The principal surface<br />
water sources are the Rio Grande and the Pecos River, although both are limited, by river system operations and<br />
water quality, respectively. Although no reservoirs are located in the planning area, a reservoir system in New<br />
Mexico, administered by the U.S. Bureau of Reclamation, regulates the Rio Grande and, thus, a portion of the<br />
area’s water supplies. Direct reuse provides another 6,000 acre-feet. Because of treaty and compact agreements,<br />
as well as groundwater management district regulations, the total surface and groundwater supply is projected<br />
to remain relatively constant throughout the planning period.<br />
NEEDS<br />
In 2010, total water needs during drought of record conditions for the region were projected to be an estimated<br />
209,591 acre-feet, all in irrigation (Table E.1, Figure E.2). By 2060, water needs are projected to increase to 226,569<br />
acre-feet, with irrigation making up the largest share of the needs (75 percent). Municipal needs are projected<br />
to constitute 14 percent of the total 2060 needs (Table E.1). Manufacturing, steam-electric power generation, and<br />
county-other categories are also projected to face needs.<br />
RECOMMENDED WATER MANAGEMENT STRATEGIES AND COST<br />
The Far West <strong>Texas</strong> Planning Group recommended a variety of water management strategies, including municipal<br />
conservation, direct reuse of reclaimed water, increases from the Rio Grande managed conjunctively with local<br />
groundwater, and imports of additional desalinated groundwater from more remote parts of the planning area.<br />
In all, the strategies would provide 130,526 acre-feet of additional water supply by the year 2060 (Figures E.3<br />
and E.4) at a total capital cost of $842.1 million (Appendix A). The Far West <strong>Texas</strong> Region recommended an<br />
integrated water management strategy to meet needs in El Paso, which represents combinations of various<br />
sources. Because there were no economically feasible strategies identified, three counties have unmet irrigation<br />
needs during drought of record conditions ranging from 209,591 acre-feet in 2010 to 161,775 acre-feet by 2060.<br />
58<br />
<strong>Chapter</strong> 2: far west <strong>Texas</strong> (E) Region s u m m a ry<br />
WAT E R FOR TEXAS 2012 STATE WATER PLAN
TABLE E.1. POPULATION, WATER SUPPLY, DEMAND, AND NEEDS 2010–2060<br />
Projected Population<br />
2010 2020 2030 2040 2050 2060<br />
863,190 1,032,970 1,175,743 1,298,436 1,420,877 1,542,824<br />
Existing Supplies (acre-feet per year)<br />
Surface water 85,912 85,912 85,912 85,912 85,912 85,912<br />
Groundwater 384,650 384,650 384,650 384,650 384,650 384,650<br />
Reuse 44,031 44,031 44,031 44,031 44,031 44,031<br />
Total <strong>Water</strong> Supplies 514,593 514,593 514,593 514,593 514,593 514,593<br />
Demands (acre-feet per year)<br />
Municipal 122,105 140,829 156,086 168,970 181,995 194,972<br />
County-other 7,371 10,479 12,968 14,894 16,877 19,167<br />
Manufacturing 9,187 10,000 10,698 11,373 11,947 12,861<br />
Mining 2,397 2,417 2,424 2,432 2,439 2,451<br />
Irrigation 499,092 489,579 482,538 469,084 460,402 451,882<br />
Steam-electric 3,131 6,937 8,111 9,541 11,284 13,410<br />
Livestock 4,843 4,843 4,843 4,843 4,843 4,843<br />
Total <strong>Water</strong> Demands 648,126 665,084 677,668 681,137 689,787 699,586<br />
Needs (acre-feet per year)<br />
Municipal 0 3,867 7,675 10,875 19,239 31,584<br />
County-other 0 3,114 5,625 7,589 9,584 11,876<br />
Manufacturing 0 813 1,511 2,186 2,760 3,674<br />
Irrigation 209,591 201,491 195,833 183,734 176,377 169,156<br />
Steam-electric 0 3,806 4,980 6,410 8,153 10,279<br />
Total <strong>Water</strong> Needs 209,591 213,091 215,624 210,794 216,113 226,569<br />
E<br />
FIGURE E.2. 2060 FAR WEST TEXAS EXISTING SUPPLIES, PROJECTED DEMANDS, AND IDENTIFIED<br />
WATER NEEDS BY WATER USE CATEGORY (ACRE-FEET PER YEAR).<br />
500,000<br />
450,000<br />
400,000<br />
350,000<br />
300,000<br />
250,000<br />
Existing <strong>Water</strong> Supplies<br />
Projected <strong>Water</strong> Demands<br />
Identified <strong>Water</strong> Needs<br />
E-2<br />
200,000<br />
150,000<br />
100,000<br />
50,000<br />
0<br />
MUNICIPAL MANUFACTURING MINING IRRIGATION STEAM-ELECTRIC LIVESTOCK<br />
WAT E R FOR TEXAS 2012 STATE WATER PLAN<br />
59<br />
<strong>Chapter</strong> 2: far west <strong>Texas</strong> (E) Region s u m m a ry
CONSERVATION RECOMMENDATIONS<br />
Conservation strategies for municipal and irrigation water users represent 40 percent of the total volume of<br />
water associated with all recommended water management strategies in 2060. Municipal conservation strategies<br />
recommended for the City of El Paso have a goal of 140 gallons per capita per day of water use. Total water<br />
conservation savings in the plan, including savings from efficient plumbing fixtures as well as improved irrigation<br />
scheduling, are projected to be 52,275 acre-feet by 2060.<br />
SELECT MAJOR WATER MANAGEMENT STRATEGIES<br />
• Importation of groundwater from Dell Valley is expected to produce up to 20,000 acre-feet per year in the<br />
year 2060 with a capital cost of $214 million.<br />
• Importation of groundwater from Diablo Farms is projected to produce 10,000 acre-feet per year of water<br />
starting in 2040 with a capital cost of $246 million.<br />
• Irrigation District surface water system delivery improvements are anticipated to produce 25,000 acre-feet<br />
per year of water starting in 2020 with a capital cost of $148 million.<br />
• Conjunctive use with additional surface water is projected to produce 20,000 acre-feet per year of water with<br />
a capital cost of $140 million.<br />
REGION-SPECIFIC STUDIES<br />
The Far West <strong>Texas</strong> <strong>Regional</strong> <strong>Water</strong> Planning Group developed four region-specific studies during the initial<br />
phase of the third planning cycle. The final reports documenting the findings can be found on the TWDB Web<br />
site at https://www.twdb.state.tx.us/wrpi/rwp/rwp_study.asp#e.<br />
• <strong>Water</strong> Conservation Conference for Far West <strong>Texas</strong> <strong>Water</strong> Plan Region E<br />
• Evaluation of Irrigation Efficiency Strategies for Far West <strong>Texas</strong>: Feasibility, <strong>Water</strong> Savings, and Cost<br />
Considerations<br />
• Conceptual Evaluation of Surface <strong>Water</strong> Storage in El Paso County<br />
• Groundwater Data Acquisition in Far West <strong>Texas</strong><br />
FAR WEST TEXAS PLANNING GROUP MEMBERS AND INTERESTS REPRESENTED<br />
Voting members during adoption of the 2011 <strong>Regional</strong> <strong>Water</strong> Plan:<br />
Tom Beard (Chair), agriculture; Janet Adams, groundwater districts; Ann Allen, industries; Ed Archuleta,<br />
municipalities; Randy Barker, groundwater districts; Jeff Bennett, environmental; Rebecca L. Brewster,<br />
municipalities; Sterry Butcher, public; Michael Davidson, travel/tourism; David Etzold, building/real estate; Sylvia<br />
Borunda Firth, municipalities; Willie Gandara, counties; Dave Hall, public; Mike Livingston, small business;<br />
Albert Miller, water utilities; Jim Ed Miller, water districts; Kenn Norris, counties; Juana Padilla, legislative<br />
representative; Jesus “Chuy” Reyes, water districts; Rick Tate, agriculture; Teresa Todd, legislative representative;<br />
Teodora Trujillo, public; Paige Waggoner, economic development; Carlos Zuazua, electric generating utilities<br />
Former voting members during the 2006 – 2011 planning cycle:<br />
Jesse Acosta, counties; Loretta Akers, other; Jerry Agan, counties; Cedric Banks, Fort Bliss; Elza Cushing, public;<br />
Howard Goldberg, industries; Luis Ito, electric generating utilities; Carl Lieb, environmental; E. Anthony<br />
Martinez, legislative representative; Ralph Meriwether, small business; Brad Newton, counties; Adrian Ocegueda,<br />
municipalities; Al Riera, Fort Bliss; Charles Stegall, counties; Jim Voorhies, electric generating utilities<br />
60<br />
<strong>Chapter</strong> 2: far west <strong>Texas</strong> (E) Region s u m m a ry<br />
WAT E R FOR TEXAS 2012 STATE WATER PLAN
FIGURE E.3. RECOMMENDED WATER MANAGEMENT STRATEGY WATER SUPPLY VOLUMES FOR<br />
2010–2060 (ACRE-FEET PER YEAR).<br />
250,000<br />
200,000<br />
150,000<br />
100,000<br />
50,000<br />
Aquifer Storage and Recovery<br />
Conjunctive Use<br />
Surface <strong>Water</strong> Desalination<br />
Groundwater Desalination<br />
Reuse<br />
Groundwater<br />
Irrigation Conservation<br />
Municipal Conservation<br />
Total <strong>Water</strong> Needs<br />
E3<br />
0<br />
2010 2020 2030 2040 2050 2060<br />
FIGURE E.4. 2060 RECOMMENDED WATER MANAGEMENT STRATEGIES–RELATIVE SHARE OF SUPPLY.<br />
Reuse<br />
6.4%<br />
Groundwater Desalination<br />
21.2%<br />
Conjunctive Use<br />
2.8%<br />
Groundwater<br />
23.7%<br />
Aquifer Storage and Recovery<br />
3.8%<br />
E-4<br />
Surface <strong>Water</strong> Desalination<br />
2.1%<br />
Municipal Conservation<br />
16.9%<br />
Irrigation Conservation<br />
23.2%<br />
WAT E R FOR TEXAS 2012 STATE WATER PLAN<br />
61<br />
<strong>Chapter</strong> 2: far west <strong>Texas</strong> (E) Region s u m m a ry
2 Summary of<br />
Region F<br />
The Region F <strong>Regional</strong> <strong>Water</strong> Planning Area<br />
is located in the Edwards Plateau and<br />
encompasses 32 counties.<br />
The Region F <strong>Regional</strong> <strong>Water</strong> Planning Area is located in the Edwards Plateau encompassing 32 counties (Figure<br />
F.1). Intersected by the Pecos River to the south and the Colorado River to the north, most of the region is located<br />
in the upper portion of the Colorado River Basin and Pecos portion of the Rio Grande Basin; a small portion<br />
is in the Brazos Basin. The major cities in the region include Midland, Odessa, and San Angelo. The region’s<br />
economy relies heavily on healthcare and social assistance, mining, manufacturing, agriculture, and oil and gas<br />
employment sectors. The 2011 Region F <strong>Regional</strong> <strong>Water</strong> Plan can be found on the TWDB Web site at https://<br />
www.twdb.state.tx.us/wrpi/rwp/3rdRound/2011_RWP/RegionF/.<br />
PLAN HIGHLIGHTS<br />
• Additional supply needed in 2060—219,995 acre-feet per year<br />
• Recommended water management strategy volume in 2060—235,198 acre-feet per year<br />
• Total capital cost—$915 million<br />
• Conservation accounts for 35 percent of 2060 strategy volumes<br />
• Subordination of downstream senior water rights as strategy to increase reliability of significant supply<br />
volume<br />
• Unmet needs in irrigation and steam-electric power<br />
62<br />
<strong>Chapter</strong> 2: region F summary<br />
WAT E R FOR TEXAS 2012 STATE WATER PLAN
FIGURE F.1. REGION F REGIONAL WATER PLANNING AREA.<br />
Colorado River<br />
Borden<br />
Scurry<br />
Andrews<br />
Martin<br />
Howard<br />
Mitchell<br />
Pecos River<br />
Loving<br />
Winkler<br />
Ector<br />
Midland<br />
Glasscock<br />
Sterling<br />
Coke<br />
Runnels<br />
Coleman<br />
Brown<br />
Ward<br />
Crane<br />
Reeves<br />
Upton<br />
Reagan<br />
Irion<br />
Tom Green<br />
Concho<br />
McCulloch<br />
Schleicher<br />
Menard<br />
Pecos<br />
Crockett<br />
Mason<br />
Region F<br />
Major Rivers<br />
Cities<br />
Existing Reservoirs<br />
Edwards - Trinity (Plateau) Aquifer (outcrop)<br />
Region F<br />
Ogallala Aquifer<br />
Major Rivers<br />
Pecos Valley Aquifer<br />
Cities<br />
Trinity Aquifer (outcrop)<br />
Existing Reservoirs<br />
Trinity Aquifer (subsurface)<br />
Edwards - Trinity (Plateau) Aquifer (outcrop)<br />
Capitan Reef Complex Aquifer*<br />
Dockum Aquifer (outcrop)*<br />
Ogallala Aquifer<br />
Dockum Aquifer (subsurface)*<br />
Pecos Valley Aquifer<br />
Edwards -Trinity (High Plains) Aquifer*<br />
Trinity Aquifer (outcrop)<br />
* Minor aquifer (only shown where there is no major aquifer)<br />
Trinity Aquifer (subsurface)<br />
Capitan Reef Complex Aquifer*<br />
Dockum Aquifer (outcrop)*<br />
Dockum Aquifer (subsurface)*<br />
Edwards -Trinity (High Plains) Aquifer*<br />
Sutton<br />
Ellenburger - San Saba Aquifer (outcrop)*<br />
Ellenburger - San Saba Aquifer (subsurface)*<br />
Hickory Aquifer (outcrop)*<br />
Hickory Aquifer (subsurface)*<br />
Lipan Aquifer (outcrop)*<br />
Marble Falls Aquifer*<br />
Rustler Aquifer (outcrop)*<br />
Rustler Aquifer (subsurface)*<br />
Igneous Aquifer*<br />
Kimble<br />
* Minor aquifer (only shown where there is no major aquifer)<br />
WAT E R FOR TEXAS 2012 STATE WATER PLAN<br />
63<br />
<strong>Chapter</strong> 2: region F summary
POPULATION AND WATER DEMANDS<br />
Approximately 2 percent of the state’s total population lived in Region F in 2010, and between 2010 and 2060 its<br />
population is projected to increase by 17 percent (Table F.1). Despite projected population growth in the region,<br />
total water demands for the region are projected to remain relatively constant throughout the planning period.<br />
Agricultural irrigation makes up the largest share of these demands in all decades, although it is projected to<br />
decrease 5 percent by 2060 (Table F.1). Steam-electric generation demands are projected to have the greatest<br />
increase (84 percent), while municipal demands are projected to increase 11 percent (Table F.1, Figure F.2).<br />
EXISTING WATER SUPPLIES<br />
Seventy-five percent of the region’s existing water supply in 2010 is projected to consist of groundwater from<br />
four major aquifers (Ogallala, Edwards-Trinity [Plateau], Trinity, and Pecos Valley) and seven minor aquifers<br />
(Table F.1, Figure F.2). Reservoirs provide 17 percent of supply and run-of-river supplies and alternative sources,<br />
such as desalination and wastewater reuse, account for 7 percent.<br />
NEEDS<br />
Total regional needs are projected to increase 15 percent by 2060 (Table F.1). Irrigation is projected to have the<br />
largest need in all decades, but decline in magnitude to 144,276 acre-feet in 2060. By 2060, municipal needs are<br />
projected to account for 23 percent of total needs and steam-electric 9 percent (Table F.1, Figure F.2).<br />
RECOMMENDED WATER MANAGEMENT STRATEGIES AND COST<br />
Region F recommended a variety of water management strategies to meet water supply needs (Figures F.3 and<br />
F.4). In all, the strategies would provide 235,198 acre-feet of additional water supply by the year 2060 at a total<br />
capital cost of $914.6 million (Appendix A). Because economically feasible strategies could not be identified,<br />
94,108 acre-feet of irrigation needs in 15 counties and steam-electric needs of 14,935 acre-feet in three counties<br />
are unmet in 2060.<br />
CONSERVATION RECOMMENDATIONS<br />
Conservation strategies, including municipal and advanced irrigation, provide the largest volume of supply<br />
for all strategies in the region. By 2060, they account for 35 percent of the total volume associated with all<br />
recommended strategies. The bulk of conservation savings are provided by advanced irrigation strategies that<br />
represent over 72,244 acre-feet of savings, 31 percent of the total in 2060.<br />
SELECT MAJOR WATER MANAGEMENT STRATEGIES<br />
• Irrigation conservation would provide up to 72,244 acre-feet per year of water starting in 2030 with a capital<br />
cost of $69 million.<br />
• Groundwater desalination would provide up to 16,050 acre-feet per year of water in 2060 with a capital cost<br />
of $214 million.<br />
• Reuse projects would provide up to 12,490 acre-feet per year of water starting in 2040 with a capital cost of<br />
$131 million.<br />
64<br />
<strong>Chapter</strong> 2: region F summary<br />
WAT E R FOR TEXAS 2012 STATE WATER PLAN
TABLE F.1. POPULATION, WATER SUPPLY, DEMAND, AND NEEDS 2010–2060<br />
Projected Population<br />
2010 2020 2030 2040 2050 2060<br />
618,889 656,480 682,132 700,806 714,045 724,094<br />
Existing Supplies (acre-feet per year)<br />
Surface water 138,352 137,285 136,063 134,929 133,840 132,821<br />
Groundwater 483,937 480,479 481,658 478,331 478,624 478,805<br />
Reuse 19,015 19,309 19,459 19,609 19,759 19,909<br />
Total <strong>Water</strong> Supplies 641,304 637,073 637,180 632,869 632,223 631,535<br />
Demands (acre-feet per year)<br />
Municipal 122,593 127,135 129,747 131,320 133,361 135,597<br />
County-other 19,372 20,693 21,533 21,886 21,979 22,035<br />
Manufacturing 9,757 10,595 11,294 11,960 12,524 13,313<br />
Mining 31,850 33,097 33,795 34,479 35,154 35,794<br />
Irrigation 578,606 573,227 567,846 562,461 557,080 551,774<br />
Steam-electric 18,138 19,995 22,380 25,324 28,954 33,418<br />
Livestock 23,060 23,060 23,060 23,060 23,060 23,060<br />
Total <strong>Water</strong> Demands 803,376 807,802 809,655 810,490 812,112 814,991<br />
Needs (acre-feet per year)<br />
Municipal 21,537 30,464 35,442 43,088 45,923 49,060<br />
County-other 501 811 658 618 588 559<br />
Manufacturing 3,537 4,138 3,747 4,403 4,707 5,152<br />
Mining 503 660 29 143 232 375<br />
Irrigation 157,884 154,955 152,930 149,472 146,995 144,276<br />
Steam-electric 7,095 9,840 11,380 13,294 16,347 20,573<br />
Total <strong>Water</strong> Needs 191,057 200,868 204,186 211,018 214,792 219,995<br />
F<br />
FIGURE F.2. 2060 REGION F EXISTING SUPPLIES, PROJECTED DEMANDS, AND IDENTIFIED WATER<br />
NEEDS BY WATER USE CATEGORY (ACRE-FEET PER YEAR).<br />
600,000<br />
500,000<br />
400,000<br />
Existing <strong>Water</strong> Supplies<br />
Projected <strong>Water</strong> Demands<br />
Identified <strong>Water</strong> Needs<br />
300,000<br />
F-2<br />
200,000<br />
100,000<br />
0<br />
MUNICIPAL MANUFACTURING MINING IRRIGATION STEAM-ELECTRIC LIVESTOCK<br />
WAT E R FOR TEXAS 2012 STATE WATER PLAN<br />
65<br />
<strong>Chapter</strong> 2: region F summary
REGION-SPECIFIC STUDIES<br />
The <strong>Regional</strong> <strong>Water</strong> Planning Group developed six region-specific studies during the initial phase of the third<br />
planning cycle. The final reports documenting the findings can be found on the TWDB Web site at https://www.<br />
twdb.state.tx.us/wrpi/rwp/rwp_study.asp#f.<br />
• Irrigation Survey: Glasscock, Midland, Regan, Pecos, Reeves, and Tom Green Counties<br />
• Refinement of Groundwater Supplies and Identification of Potential Projects<br />
• Evaluation of Supplies in the Pecan Bayou <strong>Water</strong>shed<br />
• Municipal Conservation Survey<br />
• Region K Surface <strong>Water</strong> Availability Coordination<br />
• Study of the Economics of Rural <strong>Water</strong> Distribution and Integrated <strong>Water</strong> Supply Study<br />
REGION F PLANNING GROUP MEMBERS AND INTERESTS REPRESENTED<br />
Voting members during adoption of the 2011 <strong>Regional</strong> <strong>Water</strong> Plan:<br />
John Grant (Chair), water districts; Woody Anderson, agriculture; Stephen Brown, river authorities; Kenneth<br />
Dierschke, agriculture; Richard Gist, water utilities; Charles Hagood, small business; Scott Holland, water districts;<br />
Wendell Moody, public; Robert Moore, counties; Caroline Runge, environmental; John Shepard, municipalities;<br />
Ben Sheppard, industries; Terry Scott, agriculture; Merle Taylor, municipalities; Larry Turnbough, water districts;<br />
Tim Warren, electric generating utilities; Paul Weatherby, water districts; Will Wilde, municipalities; Len Wilson,<br />
public<br />
Former voting members during the 2006 – 2011 planning cycle:<br />
Jerry Bearden, counties; Dennis Clark, water districts; Stuart Coleman, small business; Marilyn Egan, counties;<br />
Steven Hofer, environmental; Jared Miller, municipalities; Buddy Sipes, industries; Andrew Valencia, electric<br />
generating utilities<br />
66<br />
<strong>Chapter</strong> 2: region F summary<br />
WAT E R FOR TEXAS 2012 STATE WATER PLAN
FIGURE F.3. RECOMMENDED WATER MANAGEMENT STRATEGY WATER SUPPLY VOLUMES FOR<br />
2010–2060 (ACRE-FEET PER YEAR).<br />
250,000<br />
200,000<br />
150,000<br />
100,000<br />
Brush Control<br />
Other Surface <strong>Water</strong><br />
Groundwater Desalination<br />
Reuse<br />
Groundwater<br />
Irrigation Conservation<br />
Municipal Conservation<br />
Total <strong>Water</strong> Needs<br />
F3<br />
50,000<br />
0<br />
2010 2020 2030 2040 2050 2060<br />
FIGURE F.4. 2060 RECOMMENDED WATER MANAGEMENT STRATEGIES–RELATIVE SHARE OF SUPPLY.<br />
Groundwater<br />
17.1%<br />
Reuse<br />
5.3%<br />
Other Surface <strong>Water</strong><br />
32.2%<br />
Groundwater Desalination<br />
6.8%<br />
F-4<br />
Brush Control<br />
3.6%<br />
Municipal Conservation<br />
4.3%<br />
Irrigation Conservation<br />
30.7%<br />
WAT E R FOR TEXAS 2012 STATE WATER PLAN<br />
67<br />
<strong>Chapter</strong> 2: region F summary
2 Summary of<br />
Brazos G Region<br />
The Brazos G <strong>Regional</strong> <strong>Water</strong> Planning Area<br />
includes all or parts of 37 counties.<br />
The Brazos G <strong>Regional</strong> <strong>Water</strong> Planning Area includes all or parts of 37 counties (Figure G.1). Over 90 percent of<br />
the region lies within the Brazos River Basin, with the Brazos River being the region’s primary source of water.<br />
The largest economic sectors in the region are service, manufacturing, and retail trade. Major cities in the region<br />
include Abilene, Bryan, College Station, Killeen, Round Rock, Temple, and Waco. The 2011 Brazos (G) <strong>Regional</strong><br />
<strong>Water</strong> Plan can be found on the TWDB Web site at https://www.twdb.state.tx.us/wrpi/rwp/3rdRound/2011_<br />
RWP/RegionG/.<br />
PLAN HIGHLIGHTS<br />
• Additional supply needed in 2060—390,732 acre-feet per year<br />
• Recommended water management strategy volume in 2060—587,084 acre-feet per year<br />
• Total capital cost—$3.2 billion<br />
• Conservation accounts for 7 percent of 2060 strategy volumes<br />
• Five new major reservoirs (Brushy Creek, Cedar Ridge, Millers Creek Augmentation,* Turkey Peak*,<br />
Coryell County Reservoir*); three sites indicated * also recommended for designation as unique reservoir<br />
sites (Figure ES.7)<br />
• Conjunctive use strategies account for 12 percent of 2060 strategy volumes<br />
• Brazos River Authority System Operation strategy accounts for 14 percent of strategy volumes<br />
• Unmet irrigation and mining needs in all decades; limited unmet steam-electric power and municipal needs<br />
in 2010 decade<br />
68<br />
<strong>Chapter</strong> 2: brazos G region summary<br />
WAT E R FOR TEXAS 2012 STATE WATER PLAN
FIGURE G.1. BRAZOS G REGIONAL WATER PLANNING AREA.<br />
Knox<br />
Brazos River<br />
Kent<br />
Stonewall<br />
Haskell<br />
Throckmorton<br />
Young<br />
Fisher<br />
Jones<br />
Shackelford<br />
Stephens<br />
Palo Pinto<br />
Region G<br />
Major Rivers<br />
Cities<br />
Existing Reservoirs<br />
Nolan<br />
Taylor<br />
Callahan<br />
Eastland<br />
Comanche<br />
Erath<br />
Hood<br />
Somervell<br />
Bosque<br />
Johnson<br />
Carrizo - Wilcox Aquifer (outcrop)<br />
Region G<br />
Hamilton<br />
Carrizo - Wilcox Aquifer (subsurface)<br />
Major Rivers<br />
McLennan<br />
Limestone<br />
Edwards (Balcones Fault Zone) Aquifer (outcrop)<br />
Cities<br />
Colorado River<br />
Coryell<br />
Edwards (Balcones Fault Zone) Aquifer (subsurface)<br />
Falls<br />
Existing Reservoirs<br />
Lampasas<br />
Edwards - Trinity (Plateau) Aquifer<br />
Robertson<br />
Carrizo - Wilcox Aquifer (outcrop)<br />
Bell<br />
Brazos River<br />
Gulf Coast Aquifer<br />
Seymour Aquifer Carrizo - Wilcox Aquifer (subsurface)<br />
Milam<br />
Trinity Aquifer (outcrop) Edwards (Balcones Fault Zone) Ellenburger Aquifer (outcrop) - San Saba Aquifer (outcrop)*<br />
Williamson<br />
Brazos<br />
Trinity Aquifer (subsurface) Edwards (Balcones Fault Zone) Ellenburger Aquifer (subsurface)<br />
- San Saba Aquifer (subsurface)*<br />
Grimes<br />
Blaine Aquifer (outcrop)* Edwards - Trinity (Plateau) Aquifer Marble Falls Aquifer*<br />
Burleson<br />
Blaine Aquifer (subsurface)* Gulf Coast Aquifer Queen City Aquifer (outcrop)*<br />
Woodbine Aquifer (outcrop)*<br />
Brazos River Alluvium Aquifer*<br />
Seymour Aquifer<br />
Queen City Aquifer (subsurface)*<br />
Woodbine Aquifer (subsurface)*<br />
Lee Washington<br />
Dockum Aquifer (outcrop)*<br />
Sparta Aquifer (outcrop)*<br />
Yegua - Jackson Aquifer*<br />
Trinity Aquifer (outcrop)<br />
* Minor aquifer (only shown where<br />
Dockum Aquifer (subsurface)*<br />
Sparta Aquifer (subsurface)*<br />
Trinity Aquifer (subsurface)<br />
Hickory Aquifer*<br />
there is no major aquifer)<br />
Blaine Aquifer (outcrop)*<br />
Queen City Aquifer (outcrop)*<br />
Blaine Aquifer (subsurface)*<br />
Queen City Aquifer (subsurface)*<br />
Brazos River Alluvium Aquifer*<br />
Sparta Aquifer (outcrop)*<br />
Dockum Aquifer (outcrop)*<br />
Sparta Aquifer (subsurface)*<br />
Dockum Aquifer (subsurface)*<br />
Woodbine Aquifer (outcrop)*<br />
Ellenburger - San Saba Aquifer (outcrop)*<br />
Woodbine Aquifer (subsurface)*<br />
Ellenburger - San Saba Aquifer (subsurface)*<br />
Yegua - Jackson Aquifer*<br />
Marble Falls Aquifer*<br />
Hickory Aquifer*<br />
Hill<br />
* Minor aquifer (only shown where there is no major aquifer)<br />
WAT E R FOR TEXAS 2012 STATE WATER PLAN<br />
69<br />
<strong>Chapter</strong> 2: brazos G region summary
POPULATION AND WATER DEMANDS<br />
Approximately 8 percent of the state’s 2010 population resided in the Brazos G Region. Between 2010 and 2060,<br />
the region’s population is projected to increase 76 percent (Table G.1). By 2060, the total water demands for the<br />
region are projected to increase 43 percent (Table G.1). Municipal water use makes up the largest share of these<br />
demands in all decades and is projected to increase by 75 percent (Table G.1). Manufacturing and steam-electric<br />
power generation demands are also projected to grow by 61 percent and 90 percent, respectively (Table G.1).<br />
Irrigation water demand, however, declines 10 percent by 2060 because of projected reductions in irrigated land<br />
and technological advances in irrigation techniques (Table G.1, Figure G.2).<br />
EXISTING WATER SUPPLIES<br />
The Brazos G Region has a large number of surface water and groundwater supply sources, with over threefourths<br />
of the existing water supply in the region associated with surface water (Table G.1). The principal surface<br />
water sources are the Brazos River, its tributaries, and the 40 major reservoirs throughout the region. There are<br />
six major aquifers in the region: the Seymour and Edwards-Trinity (Plateau) aquifers in the western portion of<br />
the region, the Trinity and Edwards (Balcones Fault Zone) aquifers in the central portion, and the Carrizo-Wilcox<br />
and Gulf Coast aquifers in the eastern portion. Although the surface water portion of total supply is expected to<br />
increase slightly over time due to increased return-flows, by 2060 the total water supply is projected to decline<br />
a little more than 1 percent (Table G.1, Figure G.2). This projected decline in groundwater supply is due to a<br />
greater emphasis on sustainable use of groundwater resources in the region.<br />
NEEDS<br />
Although on a region-wide basis it might appear that the Brazos G Region has enough water supply to meet<br />
demands through 2040, with only small deficits in 2050 and 2060, the total water supply volume is not accessible<br />
to all water users throughout the region (Table G.1). Consequently, in the event of drought, Region G would be<br />
projected to have a total water supply need of 131,489 acre-feet in 2010 (Table G.1). Irrigation accounts for nearly<br />
half of those needs at 59,571 acre-feet. By 2060, overall water needs are expected to increase to 390,732 acre-feet,<br />
with almost half of this need associated with municipal users (Table G.1, Figure G.2).<br />
RECOMMENDED WATER MANAGEMENT STRATEGIES AND COST<br />
The Brazos G Planning Group recommended a variety of water management strategies that would provide more<br />
water than is required to meet future needs (Figures G.3 and G.4). In all, the strategies would provide 587,084<br />
acre-feet of additional water supply by the year 2060 at a total capital cost of $3.2 billion (Appendix A). Some<br />
of this water could be made available to other regions with needs. Because there were no economically feasible<br />
strategies identified to meet their needs, six counties in the region have unmet irrigation needs (ranging from<br />
49,973 acre-feet in 2010 to 33,932 acre-feet by 2060). Some mining needs go unmet in each decade (ranging from<br />
1,800 acre-feet in 2010 to 2,567 acre-feet in 2060) due to a lack of feasible strategies. Some municipal (Abilene,<br />
Round Rock, and Cedar Park) needs (totaling 2,196 acre-feet) and some steam-electric needs (36,086 acre-feet)<br />
would be unmet in case of drought in 2010 because infrastructure is not yet in place to access the supply.<br />
70<br />
<strong>Chapter</strong> 2: brazos G region summary<br />
WAT E R FOR TEXAS 2012 STATE WATER PLAN
TABLE G.1. POPULATION, WATER SUPPLY, DEMAND, AND NEEDS 2010–2060<br />
Projected Population<br />
2010 2020 2030 2040 2050 2060<br />
1,957,767 2,278,243 2,576,783 2,873,382 3,164,776 3,448,879<br />
Existing Supplies (acre-feet per year)<br />
Surface water 790,543 787,031 791,011 792,331 792,252 792,258<br />
Groundwater 355,337 355,256 355,151 344,052 336,931 336,798<br />
Reuse 17,344 17,344 17,344 17,344 17,344 17,344<br />
Total <strong>Water</strong> Supplies 1,163,224 1,159,631 1,163,506 1,153,727 1,146,527 1,146,400<br />
Demands (acre-feet per year)<br />
Municipal 328,006 382,974 430,635 477,748 524,700 572,602<br />
County-other 33,413 34,488 35,471 37,403 40,327 42,881<br />
Manufacturing 19,787 23,201 25,077 26,962 30,191 31,942<br />
Mining 36,664 37,591 38,037 27,251 20,744 21,243<br />
Irrigation 232,541 227,697 222,691 217,859 213,055 208,386<br />
Steam-electric 168,193 221,696 254,803 271,271 300,859 319,884<br />
Livestock 51,576 51,576 51,576 51,576 51,576 51,576<br />
Total <strong>Water</strong> Demands 870,180 979,223 1,058,290 1,110,070 1,181,452 1,248,514<br />
Needs (acre-feet per year)<br />
Municipal 20,549 53,971 76,295 109,962 147,780 188,632<br />
County-other 395 361 299 997 2,753 3,835<br />
Manufacturing 2,762 3,441 4,108 4,783 5,393 6,054<br />
Mining 9,670 10,544 10,963 11,301 11,704 12,158<br />
Irrigation 59,571 56,961 54,422 51,942 49,527 47,181<br />
Steam-electric 38,542 71,483 82,891 93,599 117,616 132,872<br />
Total <strong>Water</strong> Needs 131,489 196,761 228,978 272,584 334,773 390,732<br />
G<br />
FIGURE G.2. 2060 BRAZOS (G) EXISTING SUPPLIES, PROJECTED DEMANDS, AND IDENTIFIED WATER<br />
NEEDS BY WATER USE CATEGORY (ACRE-FEET PER YEAR).<br />
700,000<br />
600,000<br />
500,000<br />
400,000<br />
300,000<br />
Existing <strong>Water</strong> Supplies<br />
Projected <strong>Water</strong> Demands<br />
Identified <strong>Water</strong> Needs<br />
G-2<br />
200,000<br />
100,000<br />
0<br />
MUNICIPAL MANUFACTURING MINING IRRIGATION STEAM-ELECTRIC LIVESTOCK<br />
WAT E R FOR TEXAS 2012 STATE WATER PLAN<br />
71<br />
<strong>Chapter</strong> 2: brazos G region summary
CONSERVATION RECOMMENDATIONS<br />
Conservation strategies represent 7 percent of the total volume of water associated with all recommended<br />
strategies in 2060. <strong>Water</strong> conservation was recommended for every municipal water user group that had both a<br />
need and water use greater than 140 gallons per capita per day.<br />
SELECT MAJOR WATER MANAGEMENT STRATEGIES<br />
• Groundwater/Surface <strong>Water</strong> Conjunctive Use (Lake Granger Augmentation) will provide up to 70,246 acrefeet<br />
per year of water starting in the year 2010 with a capital cost of $644 million.<br />
• Brazos River Authority Systems Operations Permit will provide up to 84,899 acre-feet year of water in 2060<br />
with a capital cost of $204 million.<br />
• (Lake) Belton to Stillhouse (Lake) Pipeline will provide 30,000 acre-feet per year of water starting in 2020<br />
with a capital cost of $36 million.<br />
• Millers Creek Augmentation (new dam) will provide 17,582 acre-feet per year of water starting in 2010 with<br />
a capital cost of $47 million.<br />
• Cedar Ridge Reservoir will provide 23,380 acre-feet per year of water starting in 2020 with a capital cost of<br />
$285 million.<br />
REGION-SPECIFIC STUDIES<br />
The <strong>Regional</strong> <strong>Water</strong> Planning Group developed five region-specific studies during the initial phase of the third<br />
planning cycle. The final reports documenting the findings can be found on the TWDB Web site at https://www.<br />
twdb.state.tx.us/wrpi/rwp/rwp_study.asp#g.<br />
• Updated Drought of Record and <strong>Water</strong> Quality Implications for Reservoirs Upstream of Possum Kingdom<br />
Reservoir<br />
• Groundwater Availability Model of the Edwards-Trinity (Plateau) and Dockum Aquifer in Western Nolan<br />
and Eastern Mitchell Counties, <strong>Texas</strong><br />
• <strong>Regional</strong>ization Strategies to Assist Small <strong>Water</strong> Systems in Meeting New Safe Drinking <strong>Water</strong> Act<br />
Requirements<br />
• Brazos G Activities in Support of Region C’s <strong>Water</strong> Supply Study for Ellis, Johnson, Southern Dallas, and<br />
Southern Tarrant Counties (Four County Study)<br />
• Updated <strong>Water</strong> Management Strategies for <strong>Water</strong> User Groups in McLennan County<br />
BRAZOS G PLANNING GROUP MEMBERS AND INTERESTS REPRESENTED<br />
Voting members during adoption of the 2011 <strong>Regional</strong> <strong>Water</strong> Plan:<br />
Dale Spurgin (Chair), agriculture; Tom Clark, municipalities; Alva Cox, municipalities; Scott Diermann, electric<br />
generating utilities; Phil Ford, river authorities; Scott Mack, public; Mike McGuire, water districts; Tommy<br />
O’Brien, municipalities; Gail Peek, small business; Sheril Smith, environmental; Wiley Stem, III, municipalities;<br />
Mike Sutherland, counties; Randy Waclawczyk, industries; Kathleen J. Webster, water districts; Wayne Wilson,<br />
agriculture<br />
Former voting members during the 2006 – 2011 planning cycle:<br />
Jon Burrows, counties; Stephen Stark, environmental; Scott Mack, public; Horace Grace, small business; Terry<br />
Kelley, water districts; Kent Watson, water utilities<br />
72<br />
<strong>Chapter</strong> 2: brazos G region summary<br />
WAT E R FOR TEXAS 2012 STATE WATER PLAN
FIGURE G.3. RECOMMENDED WATER MANAGEMENT STRATEGY WATER SUPPLY VOLUMES FOR<br />
2010–2060 (ACRE-FEET PER YEAR).<br />
600,000<br />
500,000<br />
400,000<br />
Aquifer Storage and Recovery<br />
Conjunctive Use<br />
Other Surface <strong>Water</strong><br />
New Major Reservoir<br />
300,000<br />
200,000<br />
100,000<br />
Reuse<br />
Groundwater<br />
Other Conservation<br />
Irrigation Conservation<br />
Municipal Conservation<br />
Total <strong>Water</strong> Needs<br />
G<br />
0<br />
2010 2020 2030 2040 2050 2060<br />
FIGURE G.4. 2060 RECOMMENDED WATER MANAGEMENT STRATEGIES–RELATIVE SHARE OF SUPPLY.<br />
Groundwater<br />
3.8% Reuse<br />
14.3%<br />
Other Surface <strong>Water</strong><br />
52.6%<br />
Conjunctive Use<br />
12.0%<br />
G-4 Aquifer Storage and Recovery<br />
1.1%<br />
Municipal Conservation<br />
3.6%<br />
Irrigation Conservation<br />
1.2%<br />
Other Conservation<br />
2.3%<br />
New Major Reservoir<br />
9.2%<br />
WAT E R FOR TEXAS 2012 STATE WATER PLAN<br />
73<br />
<strong>Chapter</strong> 2: brazos G region summary
2 Summary of<br />
Region H<br />
The Region H <strong>Regional</strong> <strong>Water</strong> Planning Area<br />
is composed of all or parts of 15 counties and<br />
includes portions of the Trinity, San Jacinto,<br />
Brazos, Neches, and Colorado river basins.<br />
The Region H <strong>Regional</strong> <strong>Water</strong> Planning Area is composed of all or parts of 15 counties and includes portions<br />
of the Trinity, San Jacinto, Brazos, Neches, and Colorado river basins (Figure H.1). The Houston metropolitan<br />
area is located within this region. The largest economic sector in Region H is the petrochemical industry, which<br />
accounts for two-thirds of the petrochemical production in the United States. Other major economic sectors in<br />
the region include medical services, tourism, government, agriculture, fisheries, and transportation, with the<br />
Port of Houston being the nation’s second largest port. The 2011 Region H <strong>Regional</strong> <strong>Water</strong> Plan can be found on<br />
the TWDB Web site at https://www.twdb.state.tx.us/wrpi/rwp/3rdRound/2011_RWP/RegionH/.<br />
PLAN HIGHLIGHTS<br />
• Additional supply needed in 2060—1,236,335 acre-feet per year<br />
• Recommended water management strategy volume in 2060—1,501,180 acre-feet per year<br />
• Total capital cost—$12 billion<br />
• Conservation accounts for 12 percent of 2060 strategy volumes<br />
• Five new major reservoirs (Allens Creek, Dow Off-Channel, Gulf Coast <strong>Water</strong> Authority Off-Channel,<br />
Brazoria Off-Channel, Fort Bend Off-Channel)<br />
• Reuse accounts for 19 percent of 2060 strategy volumes<br />
74<br />
<strong>Chapter</strong> 2: region H summary<br />
WAT E R FOR TEXAS 2012 STATE WATER PLAN
FIGURE H.1. REGION H REGIONAL WATER PLANNING AREA.<br />
Leon<br />
Madison<br />
Trinity<br />
Polk<br />
Walker<br />
San Jacinto River<br />
San Jacinto<br />
Montgomery<br />
Trinity River<br />
Region H<br />
Liberty<br />
Major Rivers<br />
Cities<br />
Existing Reservoirs<br />
Carrizo - Wilcox Aquifer (outcrop)<br />
Austin<br />
Waller<br />
Harris<br />
Chambers<br />
Carrizo - Wilcox Aquifer (subsurface)<br />
Fort Bend<br />
Gulf Coast Aquifer<br />
Queen City Aquifer (outcrop)*<br />
Queen City<br />
Region<br />
Aquifer<br />
H<br />
(subsurface)* Brazos River<br />
Major Rivers<br />
Sparta Aquifer (outcrop)*<br />
Cities<br />
Sparta Aquifer (subsurface)*<br />
Existing Reservoirs<br />
Yegua - Jackson Aquifer*<br />
Brazos River Carrizo Alluvium - Wilcox Aquifer* Aquifer (outcrop)<br />
* Minor aquifer (only<br />
Carrizo<br />
shown<br />
- Wilcox<br />
where<br />
Aquifer<br />
there<br />
(subsurface)<br />
is no major aquifer)<br />
Gulf Coast Aquifer<br />
Queen City Aquifer (outcrop)*<br />
Queen City Aquifer (subsurface)*<br />
Sparta Aquifer (outcrop)*<br />
Sparta Aquifer (subsurface)*<br />
Yegua - Jackson Aquifer*<br />
Brazos River Alluvium Aquifer*<br />
* Minor aquifer (only shown where there is no major aquifer)<br />
Brazoria<br />
Galveston<br />
WAT E R FOR TEXAS 2012 STATE WATER PLAN<br />
75<br />
<strong>Chapter</strong> 2: region H summary
POPULATION AND WATER DEMANDS<br />
Approximately 24 percent of the state’s population was projected to reside in the region in 2010. By 2060, Region<br />
H is projected to grow 89 percent to 11.3 million. Total demand for the region is projected to increase 48 percent<br />
by 2060 (Table H.1). The largest consumers of water in the region are municipal entities, and municipal demand<br />
is expected to grow 61 percent by 2060 (Table H.1). Manufacturing also constitutes a large share of the region’s<br />
demand and is projected to grow 31 percent over the planning period (Table H.1, Figure H.2).<br />
EXISTING WATER SUPPLIES<br />
In 2010, the total water supply was projected to be 2,621,660 acre-feet, decreasing by approximately 0.6 percent<br />
by 2060 (Table H.1). The region’s reliance on groundwater from the Gulf Coast Aquifer will be reduced primarily<br />
because of subsidence district regulations. The decline in groundwater supply will be offset by the increased<br />
use of surface water to meet future needs. In 2010, surface water was projected to provide 1,843,815 acre-feet of<br />
supplies and groundwater 777,845 acre-feet (Table H.1). By 2060, surface water is projected to provide 2,021,690<br />
acre-feet, groundwater 569,361 acre-feet, and reuse 14,866 acre-feet of supplies (Table H.1, Figure H.2). The<br />
largest supply of available surface water in the region comes from the Lake Livingston/Wallisville System in the<br />
Trinity River Basin and run-of-river water rights in the Trinity and Brazos river basins.<br />
NEEDS<br />
In 2010, Region H was projected to have a need of 290,890 acre-feet, with municipalities accounting for<br />
approximately 19 percent of the total and irrigated agriculture accounting for 52 percent (Table H.1). By 2060,<br />
water supply needs are projected to total 1,236,335 acre-feet. Municipal users will account for 61 percent of that<br />
need and irrigated agriculture will account for 12 percent. Total manufacturing needs are projected to be 26<br />
percent of total needs in 2010 and 21 percent of total needs by 2060 (Table H.1, Figure H.2).<br />
RECOMMENDED WATER MANAGEMENT STRATEGIES AND COST<br />
The Region H Planning Group’s recommended water management strategies would provide 1,501,180 acre-feet<br />
of additional water supply to meet all projected needs by the year 2060 (Figures H.3 and H.4) at a total capital<br />
cost of $12 billion (Appendix A). Contracts and conveyance of existing supplies provide the largest share of<br />
strategy supply in the region, followed by reuse projects and new supplies from five new major reservoirs in the<br />
lower Brazos basin. Recommended strategies also include new groundwater supplies, conservation programs,<br />
and seawater desalination at a facility in Freeport (Figures H.3 and H.4).<br />
76<br />
<strong>Chapter</strong> 2: region H summary<br />
WAT E R FOR TEXAS 2012 STATE WATER PLAN
TABLE H.1. POPULATION, WATER SUPPLY, DEMAND, AND NEEDS 2010–2060<br />
Projected Population<br />
2010 2020 2030 2040 2050 2060<br />
6,020,078 6,995,442 7,986,480 8,998,002 10,132,237 11,346,082<br />
Existing Supplies (acre-feet per year)<br />
Surface water 1,843,815 1,899,087 1,932,954 1,971,925 2,013,605 2,021,690<br />
Groundwater 777,845 641,359 591,590 586,814 578,644 569,361<br />
Reuse 0 0 438 14,799 14,840 14,866<br />
Total <strong>Water</strong> Supplies 2,621,660 2,540,446 2,524,982 2,573,538 2,607,089 2,605,917<br />
Demands (acre-feet per year)<br />
Municipal 968,949 1,117,677 1,236,037 1,341,483 1,444,026 1,558,706<br />
County-other 73,915 75,235 102,549 144,360 211,236 286,111<br />
Manufacturing 722,873 783,835 836,597 886,668 927,860 950,102<br />
Mining 57,043 60,782 63,053 65,285 67,501 69,457<br />
Irrigation 450,175 438,257 433,686 430,930 430,930 430,930<br />
Steam-electric 91,231 112,334 131,332 154,491 182,720 217,132<br />
Livestock 12,228 12,228 12,228 12,228 12,228 12,228<br />
Total <strong>Water</strong> Demands 2,376,414 2,600,348 2,815,482 3,035,445 3,276,501 3,524,666<br />
Needs (acre-feet per year)<br />
Municipal 42,081 206,131 317,539 367,712 428,499 534,252<br />
County-other 13,070 21,975 42,697 85,430 150,770 224,682<br />
Manufacturing 75,164 131,531 168,597 202,219 231,118 255,604<br />
Mining 5,992 10,595 13,850 16,278 18,736 20,984<br />
Irrigation 151,366 141,232 137,995 137,113 140,733 144,802<br />
Steam-electric 3,203 12,609 18,058 24,726 34,976 55,972<br />
Livestock 14 64 40 40 40 39<br />
Total <strong>Water</strong> Needs 290,890 524,137 698,776 833,518 1,004,872 1,236,335<br />
H<br />
FIGURE H.2. 2060 REGION H EXISTING SUPPLIES, PROJECTED DEMANDS, AND IDENTIFIED WATER<br />
NEEDS BY WATER USE CATEGORY (ACRE-FEET PER YEAR).<br />
2,000,000<br />
1,800,000<br />
1,600,000<br />
1,400,000<br />
1,200,000<br />
Existing <strong>Water</strong> Supplies<br />
Projected <strong>Water</strong> Demands<br />
Identified <strong>Water</strong> Needs<br />
1,000,000<br />
800,000<br />
H-2<br />
600,000<br />
400,000<br />
200,000<br />
0<br />
MUNICIPAL MANUFACTURING MINING IRRIGATION STEAM-ELECTRIC LIVESTOCK<br />
WAT E R FOR TEXAS 2012 STATE WATER PLAN<br />
77<br />
<strong>Chapter</strong> 2: region H summary
CONSERVATION RECOMMENDATIONS<br />
The planning group considered conservation strategies for water user groups with needs. Recommended<br />
municipal, irrigation, and industrial water conservation strategies provide savings of 183,933 acre-feet per year.<br />
Municipal conservation accounts for up to 105,494 acre-feet of savings; irrigation conservation is recommended<br />
to save up to 77,881 acre-feet; and industrial conservation will save 588 acre-feet per year by 2060.<br />
SELECT MAJOR WATER MANAGEMENT STRATEGIES<br />
• Luce Bayou Transfer of Trinity River Supplies would convey up to 270,742 acre-feet per year of water in the<br />
year 2060 with a capital cost of $253.9 million.<br />
• Indirect Reuse by the City of Houston would provide up to 128,801 acre-feet per year of water in 2060 with<br />
a capital cost of $721.8 million.<br />
• Allens Creek Reservoir would provide up to 99,650 acre-feet per year of water in 2060 with a capital cost of<br />
$222.8 million.<br />
• Four off-channel reservoirs in Brazoria and Fort Bend Counties would collectively provide up to 131,243<br />
acre-feet per year of water in 2060 with a total capital cost of $698.3 million.<br />
REGION-SPECIFIC STUDIES<br />
The <strong>Regional</strong> <strong>Water</strong> Planning Group developed three region-specific studies during the initial phase of the third<br />
planning cycle. The final reports documenting the findings can be found on the TWDB Web site at https://www.<br />
twdb.state.tx.us/wrpi/rwp/rwp_study.asp#h.<br />
• Interruptible Supply Study<br />
• Environmental Flows Study<br />
• Drought Management Study<br />
REGION H PLANNING GROUP MEMBERS AND INTERESTS REPRESENTED<br />
Voting members during adoption of the 2011 <strong>Regional</strong> <strong>Water</strong> Plan:<br />
Mark Evans (Chair), counties; Roosevelt Alexander, public; John R. Bartos, environmental; John Blount, counties;<br />
Robert Bruner, agriculture; Jun Chang, municipalities; Reed Eichelberger, P.E., river authorities; Robert Hebert,<br />
small business; Art Henson, counties; John Hofmann, river authorities; John Howard, small business; Robert<br />
Istre, municipalities; Gena Leathers, industries; Glynna Leiper, industries; Ted Long, electric generating utilities;<br />
Marvin Marcell, water districts; James Morrison, water utilities; Ron J. Neighbors, water districts; Jimmie<br />
Schindewolf, water districts; William Teer, P.E., water utilities; Steve Tyler, small business; Danny Vance, river<br />
authorities; C. Harold Wallace, water utilities; George “Pudge” Wilcox, agriculture<br />
Former voting members during the 2006 – 2011 planning cycle:<br />
Jim Adams, river authorities; John Baker, river authorities; Jason Fluharty, electric generating utilities; Mary<br />
Alice Gonzalez, small business; Jack Harris, counties; David Jenkins, agriculture; Carolyn Johnson, industries;<br />
James Murray, industries; Jeff Taylor, municipalities; Mike Uhl, industries<br />
78<br />
<strong>Chapter</strong> 2: region H summary<br />
WAT E R FOR TEXAS 2012 STATE WATER PLAN
FIGURE H.3. RECOMMENDED WATER MANAGEMENT STRATEGY WATER SUPPLY VOLUMES FOR<br />
2010–2060 (ACRE-FEET PER YEAR).<br />
1,600,000<br />
1,400,000<br />
1,200,000<br />
1,000,000<br />
800,000<br />
600,000<br />
400,000<br />
Seawater Desalination<br />
Aquifer Storage and Recovery<br />
Other Surface <strong>Water</strong><br />
New Major Reservoir<br />
Reuse<br />
Groundwater<br />
Other Conservation<br />
Irrigation Conservation<br />
Municipal Conservation<br />
Total <strong>Water</strong> Needs<br />
H<br />
200,000<br />
0<br />
2010 2020 2030 2040 2050 2060<br />
FIGURE H.4. 2060 RECOMMENDED WATER MANAGEMENT STRATEGIES–RELATIVE SHARE OF SUPPLY.<br />
Groundwater<br />
11.3%<br />
Reuse<br />
18.8%<br />
Aquifer Storage and Recovery<br />
0.3%<br />
Seawater Desalination<br />
2.2%<br />
Other Surface <strong>Water</strong><br />
38.7%<br />
Municipal Conservation<br />
7.0%<br />
H-4<br />
Irrigation Conservation<br />
5.2%<br />
Other Conservation<br />
2 Summary of<br />
East <strong>Texas</strong> (I) Region<br />
The East <strong>Texas</strong> <strong>Regional</strong> <strong>Water</strong> Planning Area<br />
is composed of all or parts of 20 counties.<br />
The East <strong>Texas</strong> <strong>Regional</strong> <strong>Water</strong> Planning Area is composed of all or parts of 20 counties (Figure I.1). The<br />
largest cities include Beaumont, Tyler, Port Arthur, Nacogdoches, and Lufkin. The major economic sectors are<br />
petrochemical, timber, and agriculture. The principal surface water sources are the Sabine and Neches Rivers<br />
and their tributaries. The 2011 East <strong>Texas</strong> (I) <strong>Regional</strong> <strong>Water</strong> Plan can be found on the TWDB Web site at https://<br />
www.twdb.state.tx.us/wrpi/rwp/3rdRound/2011_RWP/RegionI/.<br />
PLAN HIGHLIGHTS<br />
• Additional supply needed in 2060—182,145 acre-feet per year<br />
• Recommended water management strategy volume in 2060—638,076 acre-feet per year<br />
• Total capital cost—$885 million<br />
• Conservation accounts for 7 percent of 2060 strategy volumes<br />
• Two new major reservoirs (Lake Columbia, Fastrill Replacement Project)<br />
• Limited unmet steam-electric power and mining needs<br />
80<br />
<strong>Chapter</strong> 2: east texas (I) region summary<br />
WAT E R FOR TEXAS 2012 STATE WATER PLAN
FIGURE I.1. EAST TEXAS (I) REGIONAL WATER PLANNING AREA.<br />
Henderson<br />
Smith<br />
Rusk<br />
Panola<br />
Anderson<br />
Cherokee<br />
Shelby<br />
Sabine River<br />
Nacogdoches<br />
San Augustine<br />
Trinity River<br />
Houston<br />
Angelina<br />
Sabine<br />
Region I<br />
Trinity<br />
Major Rivers<br />
Cities<br />
Polk<br />
Region I<br />
Existing Reservoirs<br />
Major Rivers<br />
Carrizo - Wilcox Aquifer (outcrop)<br />
Cities<br />
Carrizo - Wilcox Aquifer (subsurface)<br />
Existing Reservoirs<br />
Gulf Coast Aquifer<br />
Carrizo - Wilcox Aquifer (outcrop)<br />
Queen City Aquifer (outcrop)*<br />
Carrizo - Wilcox Aquifer (subsurface)<br />
Queen City Aquifer (subsurface)*<br />
Gulf Coast Aquifer<br />
Sparta Aquifer (outcrop)*<br />
Queen City Aquifer (outcrop)*<br />
Sparta Aquifer (subsurface)*<br />
Queen City Aquifer (subsurface)*<br />
Yegua - Jackson Aquifer<br />
Sparta Aquifer (outcrop)*<br />
* Minor aquifer (only shown where there is no major aquifer)<br />
Sparta Aquifer (subsurface)*<br />
Yegua - Jackson Aquifer<br />
Tyler<br />
Newton<br />
Jasper<br />
Hardin<br />
Neches River<br />
Orange<br />
Jefferson<br />
* Minor aquifer (only shown where there is no major aquifer)<br />
WAT E R FOR TEXAS 2012 STATE WATER PLAN<br />
81<br />
<strong>Chapter</strong> 2: east texas (I) region summary
POPULATION AND WATER DEMANDS<br />
Approximately 4 percent of the state’s population resided in the East <strong>Texas</strong> Region in 2010. By 2060, the region’s<br />
population is projected to grow 36 percent to 1,482,448 (Table I.1). <strong>Water</strong> demands in the region are projected<br />
to more than double by 2060 (Table I.1). The greatest increase is in manufacturing water demand, which is<br />
projected to grow 198 percent by 2060 (Table I.1). Over the planning horizon, steam-electric power generation<br />
water demand is projected to increase 246 percent and municipal water demand is expected to grow 23 percent<br />
(Table I.1, Figure I.2).<br />
EXISTING WATER SUPPLIES<br />
The existing water supply in the East <strong>Texas</strong> Region is projected to increase over the planning horizon (Table<br />
I.1). Surface water supplies, which account for 74 percent of the total existing water supply in 2010, increase by<br />
537,258 acre-feet, primarily due to additional surface water for manufacturing being made available through<br />
existing contracts. Groundwater from the Gulf Coast, Carrizo-Wilcox, and other aquifers remains relatively<br />
constant (Table I.1, Figure I.2).<br />
NEEDS<br />
Although the region as a whole appears to have enough supply to meet demands through 2040, the total water<br />
supply is not readily available to all water users. Between 2010 and 2060, the region’s water needs will increase<br />
from 28,856 acre-feet to 182,145 acre-feet (Table I.1). The largest needs are projected for the steam-electric power<br />
generation industry with 85,212 acre-feet of needs by 2060, about half of the total needs for the region. The next<br />
largest volume of needs in 2060 is for the manufacturing sector, 49,588 acre-feet, or approximately 27 percent of<br />
total needs (Table I.1, Figure I.2).<br />
RECOMMENDED WATER MANAGEMENT STRATEGIES AND COST<br />
<strong>Water</strong> management strategies recommended in the East <strong>Texas</strong> <strong>Regional</strong> <strong>Water</strong> Plan result in 638,076 acre-feet of<br />
additional water supply to meet most projected needs by the year 2060 (Figures I.3 and I.4) at a total capital cost<br />
of $884.8 million (Appendix A). Because no feasible water management strategies could be identified, a portion<br />
of steam-electric needs in 2010 and mining needs in all decades in Hardin County, totaling 10,770 acre-feet by<br />
2060, were not met.<br />
CONSERVATION RECOMMENDATIONS<br />
<strong>Water</strong> conservation was evaluated for every municipal water user group with a need and water use greater<br />
than 140 gallons per capita per day. Municipal conservation accounts for 1,701 acre-feet of savings by 2060, and<br />
most municipal needs will be partially met through conservation. <strong>Water</strong> conservation in the East <strong>Texas</strong> <strong>Regional</strong><br />
<strong>Water</strong> Planning Area is driven largely by economics, and is not always the most cost-effective strategy for a<br />
water user group with a need where plentiful supplies are available.<br />
82<br />
<strong>Chapter</strong> 2: east texas (I) region summary<br />
WAT E R FOR TEXAS 2012 STATE WATER PLAN
TABLE I.1. POPULATION, WATER SUPPLY, DEMAND, AND NEEDS 2010–2060<br />
Projected Population<br />
2010 2020 2030 2040 2050 2060<br />
1,090,382 1,166,057 1,232,138 1,294,976 1,377,760 1,482,448<br />
Existing Supplies (acre-feet per year)<br />
Surface water 661,511 941,613 1,123,982 1,151,585 1,172,399 1,198,769<br />
Groundwater 220,676 220,883 220,855 220,805 220,753 220,689<br />
Reuse 18,077 15,220 15,233 15,246 15,257 15,271<br />
Total <strong>Water</strong> Supplies 900,264 1,177,716 1,360,070 1,387,636 1,408,409 1,434,729<br />
Demands (acre-feet per year)<br />
Municipal 153,520 159,266 164,327 169,332 178,627 191,273<br />
County-other 36,039 37,562 38,434 38,861 40,078 42,349<br />
Manufacturing 299,992 591,904 784,140 821,841 857,902 893,476<br />
Mining 21,662 37,297 17,331 18,385 19,432 20,314<br />
Irrigation 151,100 151,417 151,771 152,153 152,575 153,040<br />
Steam-electric 44,985 80,989 94,515 111,006 131,108 155,611<br />
Livestock 23,613 25,114 26,899 29,020 31,546 34,533<br />
Total <strong>Water</strong> Demands 730,911 1,083,549 1,277,417 1,340,598 1,411,268 1,490,596<br />
Needs (acre-feet per year)<br />
Municipal 3,340 5,548 7,042 9,049 12,214 16,408<br />
County-other 1,072 1,803 2,272 2,584 3,152 4,101<br />
Manufacturing 3,392 16,014 24,580 33,256 40,999 49,588<br />
Mining 14,812 29,744 9,395 10,075 10,748 11,276<br />
Irrigation 1,675 1,805 2,156 2,536 2,955 3,416<br />
Steam-electric 3,588 25,922 33,615 43,053 62,778 85,212<br />
Livestock 977 2,196 4,093 6,347 9,020 12,144<br />
Total <strong>Water</strong> Needs 28,856 83,032 83,153 106,900 141,866 182,145<br />
I<br />
FIGURE I.2. 2060 EAST TEXAS (I) EXISTING SUPPLIES, PROJECTED DEMANDS, AND IDENTIFIED<br />
WATER NEEDS BY WATER USE CATEGORY (ACRE-FEET PER YEAR).<br />
1,000,000<br />
900,000<br />
800,000<br />
700,000<br />
600,000<br />
Existing <strong>Water</strong> Supplies<br />
Projected <strong>Water</strong> Demands<br />
Identified <strong>Water</strong> Needs<br />
500,000<br />
I-2<br />
400,000<br />
300,000<br />
200,000<br />
100,000<br />
0<br />
MUNICIPAL MANUFACTURING MINING IRRIGATION STEAM-ELECTRIC LIVESTOCK<br />
WAT E R FOR TEXAS 2012 STATE WATER PLAN<br />
83<br />
<strong>Chapter</strong> 2: east texas (I) region summary
SELECT MAJOR WATER MANAGEMENT STRATEGIES<br />
• Lake Columbia will provide 75,700 acre-feet per year of water starting in the year 2020 with a capital cost of<br />
$232 million<br />
• New wells in the Carrizo Wilcox Aquifer will provide up to 21,403 acre-feet per year of water in 2060 with a<br />
capital cost of $40 million.<br />
• Lake Palestine Infrastructure (diversion facilities and pipelines) will provide 16,815 acre-feet per year of<br />
water starting in 2030 with a capital cost of $79 million.<br />
• Lake Kurth <strong>Regional</strong> System will provide up to 18,400 acre-feet per year of water starting in 2010, with a<br />
capital cost of $56 million.<br />
REGION-SPECIFIC STUDIES<br />
The <strong>Regional</strong> <strong>Water</strong> Planning Group developed five region-specific studies during the initial phase of the third<br />
planning cycle. The final reports documenting the findings can be found on the TWDB Web site at https://www.<br />
twdb.state.tx.us/wrpi/rwp/rwp_study.asp#i.<br />
• Inter-<strong>Regional</strong> Coordination on the Toledo Bend Project<br />
• <strong>Regional</strong> Solutions for Small <strong>Water</strong> Suppliers<br />
• Study of Municipal <strong>Water</strong> Uses to Improve <strong>Water</strong> Conservation Strategies and Projections<br />
• Lake Murvaul Study<br />
• Liquefied Natural Gas and Refinery Expansions Jefferson County<br />
EAST TEXAS PLANNING GROUP MEMBERS AND INTERESTS REPRESENTED<br />
Voting members during adoption of the 2011 <strong>Regional</strong> <strong>Water</strong> Plan:<br />
Kelley Holcomb (Chair), water utilities; David Alders, agriculture; Jeff Branick, counties; David Brock,<br />
municipalities; George P. Campbell, other; Jerry Clark, river authorities; Josh David, other; Chris Davis, counties;<br />
Scott Hall, river authorities; Michael Harbordt, industries; William Heugel, public; Joe Holcomb, small business;<br />
Bill Kimbrough, other; Glenda Kindle, public; Duke Lyons, municipalities; Dale Peddy, electric generating<br />
utilities; Hermon E. Reed, Jr., agriculture; Monty Shank, river authorities; Darla Smith, industries; Worth<br />
Whitehead, water districts; J. Leon Young, environmental; Mark Dunn, small business<br />
Former voting members during the 2006 – 2011 planning cycle:<br />
Ernest Mosby, small business; Mel Swoboda, industries; John Windham, small business<br />
84<br />
<strong>Chapter</strong> 2: east texas (I) region summary<br />
WAT E R FOR TEXAS 2012 STATE WATER PLAN
FIGURE I.3. RECOMMENDED WATER MANAGEMENT STRATEGY WATER SUPPLY VOLUMES FOR<br />
2010–2060 (ACRE-FEET PER YEAR).<br />
700,000<br />
600,000<br />
500,000<br />
400,000<br />
300,000<br />
200,000<br />
Other Surface <strong>Water</strong><br />
New Major Reservoir<br />
Reuse<br />
Groundwater<br />
Irrigation Conservation<br />
Municipal Conservation<br />
Total <strong>Water</strong> Needs<br />
I3<br />
100,000<br />
0<br />
2010 2020 2030 2040 2050 2060<br />
FIGURE I.4. 2060 RECOMMENDED WATER MANAGEMENT STRATEGIES–RELATIVE SHARE OF SUPPLY.<br />
Groundwater<br />
4.6%<br />
Reuse<br />
0.5%<br />
Municipal Conservation<br />
0.3%<br />
I-4 Other Surface <strong>Water</strong><br />
73.0%<br />
Irrigation Conservation<br />
6.3%<br />
New Major Reservoir<br />
15.4%<br />
WAT E R FOR TEXAS 2012 STATE WATER PLAN<br />
85<br />
<strong>Chapter</strong> 2: east texas (I) region summary
2 Summary of<br />
Plateau (J) Region<br />
Located on the southern edge of the<br />
Edwards Plateau, the Plateau <strong>Regional</strong><br />
<strong>Water</strong> Planning Area covers six counties.<br />
Located on the southern edge of the Edwards Plateau, the Plateau <strong>Regional</strong> <strong>Water</strong> Planning Area covers six<br />
counties (Figure J.1). The region includes portions of the Colorado, Guadalupe, Nueces, Rio Grande, and San<br />
Antonio river basins. Land use in the western portion of the planning area is primarily range land, while the<br />
eastern portion is a mix of forest land, range land, and agricultural areas. The economy of this region is based<br />
primarily on tourism, hunting, ranching, and government (primarily Laughlin Air Force Base in Del Rio). Major<br />
cities in the region include Kerrville and Del Rio. The 2011 Plateau (J) <strong>Regional</strong> <strong>Water</strong> Plan can be found on the<br />
TWDB Web site at https://www.twdb.state.tx.us/wrpi/rwp/3rdRound/2011_RWP/RegionJ/.<br />
PLAN HIGHLIGHTS<br />
• Additional supply needed in 2060—2,389 acre-feet per year<br />
• Recommended water management strategy volume in 2060—23,010 acre-feet per year<br />
• Total capital cost—$55 million<br />
• Conservation accounts for 3 percent of 2060 strategy volumes<br />
• Brush control strategy supply not available during drought of record conditions<br />
• Aquifer Storage and Recovery accounts for 21 percent of 2060 strategy volumes<br />
86<br />
<strong>Chapter</strong> 2: plateau (j) region summary<br />
WAT E R FOR TEXAS 2012 STATE WATER PLAN
FIGURE J.1. PLATEAU (J) REGIONAL WATER PLANNING AREA.<br />
Guadalupe River<br />
Kerr<br />
Val Verde<br />
Edwards<br />
Real<br />
Bandera<br />
Rio Grande River<br />
Nueces River<br />
Medina River<br />
Region J<br />
Kinney<br />
Major Rivers<br />
Cities<br />
Existing Reservoirs<br />
Edwards (Balcones Fault Zone) Aquifer (outcrop)<br />
Edwards (Balcones Fault Zone) Aquifer (subsurface)<br />
Edwards - Trinity (Plateau) Aquifer (outcrop)<br />
Region J<br />
Major Rivers<br />
Cities<br />
Existing Reservoirs<br />
Edwards - Trinity (Plateau) Aquifer (subsurface)<br />
Trinity Aquifer<br />
Ellenburger - San Saba Aquifer*<br />
Hickory Aquifer*<br />
* Minor aquifer (only shown where there is no major aquifer)<br />
Edwards (Balcones Fault Zone) Aquifer (outcrop)<br />
Edwards (Balcones Fault Zone) Aquifer (subsurface)<br />
Edwards - Trinity (Plateau) Aquifer (outcrop)<br />
Edwards - Trinity (Plateau) Aquifer (subsurface)<br />
Trinity Aquifer<br />
Ellenburger - San Saba Aquifer*<br />
Hickory Aquifer*<br />
* Minor aquifer (only shown where there is no major aquifer)<br />
WAT E R FOR TEXAS 2012 STATE WATER PLAN<br />
87<br />
<strong>Chapter</strong> 2: plateau (j) region summary
POPULATION AND WATER DEMANDS<br />
Less than 1 percent of the state’s population resided in the Plateau Region in 2010. By 2060, the region’s<br />
population is projected to increase 52 percent (Table J.1). The greatest area of population growth is projected to<br />
occur in Bandera County, with an anticipated 129 percent increase in population by 2060, which will primarily<br />
be associated with areas around San Antonio. Total water demands, however, will increase by only 13 percent<br />
by 2060 (Table J.1). The greatest increase is in county-other demand (68 percent), followed by municipal water<br />
demand, increasing over the planning horizon by 21 percent (Table J.1, Figure J.2).<br />
EXISTING WATER SUPPLIES<br />
Over 80 percent of the region’s existing water supply is obtained from groundwater. Throughout the planning<br />
period, the Plateau Planning Group estimates that regional groundwater and surface water supplies will remain<br />
constant at 85,439 acre-feet and 19,269 acre-feet, respectively (Table J.1, Figure J.2). There are three aquifers in<br />
the region: the Edwards-Trinity (Plateau) Aquifer, underlying much of the region; the Trinity Aquifer in the<br />
southeastern portions of Kerr and Bandera counties; and the Edwards (Balcones Fault Zone) Aquifer in southern<br />
Kinney County. The principal sources of surface water in the region are San Felipe Springs, Las Moras Creek, the<br />
Frio River, the Upper Guadalupe River, Cienagas Creek, and the Nueces River.<br />
NEEDS<br />
Although the region as a whole appears to have enough water supply to meet demands during drought of<br />
record conditions, the total existing water supply is not accessible to all water users. The cities of Kerrville and<br />
Camp Wood are projected to have needs in all decades, up to 2,389 acre-feet by 2060 (Table J.1, Figure J.2).<br />
RECOMMENDED WATER MANAGEMENT STRATEGIES AND COST<br />
<strong>Water</strong> management strategies recommended by the Plateau Planning Group include municipal conservation,<br />
groundwater development, brush control, and aquifer storage and recovery. These recommended strategies<br />
result in 13,713 acre-feet of water in 2010 and 23,010 acre-feet of additional water supply available by the year<br />
2060 to meet all needs (Figures J.3 and J.4) at a total capital cost of $54.8 million (Appendix A).<br />
CONSERVATION RECOMMENDATIONS<br />
Conservation strategies represent 3 percent of the total volume of water associated with all recommended<br />
strategies. Municipal water conservation was recommended for municipal water user groups with identified<br />
needs, which is anticipated to result in water savings of 579 acre-feet in the 2010 decade and 681 acre-feet by<br />
2060.<br />
88<br />
<strong>Chapter</strong> 2: plateau (j) region summary<br />
WAT E R FOR TEXAS 2012 STATE WATER PLAN
TABLE J.1. POPULATION, WATER SUPPLY, DEMAND, AND NEEDS 2010–2060<br />
Projected Population<br />
2010 2020 2030 2040 2050 2060<br />
135,723 158,645 178,342 190,551 198,594 205,910<br />
Existing Supplies (acre-feet per year)<br />
Surface water 19,269 19,269 19,269 19,269 19,269 19,269<br />
Groundwater 85,439 85,439 85,439 85,439 85,439 85,439<br />
Total <strong>Water</strong> Supplies 104,708 104,708 104,708 104,708 104,708 104,708<br />
Demands (acre-feet per year)<br />
Municipal 20,695 22,068 23,101 23,795 24,563 25,106<br />
County-other 8,625 10,515 12,170 13,178 13,836 14,526<br />
Manufacturing 30 33 36 39 41 44<br />
Mining 403 394 389 385 381 378<br />
Irrigation 19,423 18,645 17,897 17,183 16,495 15,837<br />
Livestock 2,752 2,752 2,752 2,752 2,752 2,752<br />
Total <strong>Water</strong> Demands 51,928 54,407 56,345 57,332 58,068 58,643<br />
Needs (acre-feet per year)<br />
Municipal 1,494 1,878 2,044 2,057 2,275 2,389<br />
Total <strong>Water</strong> Needs 1,494 1,878 2,044 2,057 2,275 2,389<br />
J<br />
FIGURE J.2. 2060 PLATEAU (J) EXISTING SUPPLIES, PROJECTED DEMANDS, AND IDENTIFIED<br />
WATER NEEDS BY WATER USE CATEGORY (ACRE-FEET PER YEAR).<br />
60,000<br />
50,000<br />
40,000<br />
Existing <strong>Water</strong> Supplies<br />
Projected <strong>Water</strong> Demands<br />
Identified <strong>Water</strong> Needs<br />
30,000<br />
J-2<br />
20,000<br />
10,000<br />
0<br />
MUNICIPAL MANUFACTURING MINING IRRIGATION LIVESTOCK<br />
WAT E R FOR TEXAS 2012 STATE WATER PLAN<br />
89<br />
<strong>Chapter</strong> 2: plateau (j) region summary
SELECT MAJOR WATER MANAGEMENT STRATEGIES<br />
• Surface water acquisition, treatment, and aquifer storage and recovery is projected to produce up to 2,624<br />
acre-feet per year of water in the year 2060 with a capital cost of $37 million.<br />
• Additional groundwater wells are expected to produce 222 acre-feet per year of water starting in 2010 with<br />
a capital cost of $240,350.<br />
REGION-SPECIFIC STUDIES<br />
The Plateau <strong>Water</strong> Planning Group developed three region-specific studies during the initial phase of the third<br />
planning cycle. The final reports documenting the findings can be found on the TWDB Web site at https://www.<br />
twdb.state.tx.us/wrpi/rwp/rwp_study.asp#j.<br />
• Groundwater Data Acquisition in Edwards, Kinney, and Val Verde Counties, <strong>Texas</strong><br />
• Aquifer Storage and Recovery Feasibility in Bandera County<br />
• <strong>Water</strong> Rights Analysis and Aquifer Storage and Recovery Feasibility in Kerr County<br />
PLATEAU PLANNING GROUP MEMBERS AND INTERESTS REPRESENTED<br />
Voting members during adoption of the 2011 <strong>Regional</strong> <strong>Water</strong> Plan:<br />
Jonathan Letz (Chair), small business; Stuart Barron, municipalities; Ray Buck, river authorities; Perry Bushong,<br />
water districts; Zack Davis, agriculture; Otila Gonzalez, municipalities; Howard Jackson, municipalities; David<br />
Jeffery, water districts; Mitch Lomas, municipalities; Kent Lowery, water districts; Ronnie Pace, industries;<br />
Thomas M. Qualia, public; Tully Shahan, environmental; Jerry Simpton, other; Homer T. Stevens, Jr., travel/<br />
tourism; Lee Sweeten, counties; Charlie Wiedenfeld, water utilities; Gene Williams, water districts; William<br />
Feathergail Wilson, other<br />
Former voting members during the 2006 – 2011 planning cycle:<br />
Alejandro A. Garcia, municipalities; Lon Langley, water districts; Carl Meek, municipalities; W.B. Sansom,<br />
counties; Cecil Smith, water districts; Gene Smith, municipalities; Diana Ward, water districts<br />
90<br />
<strong>Chapter</strong> 2: plateau (j) region summary<br />
WAT E R FOR TEXAS 2012 STATE WATER PLAN
FIGURE J.3. RECOMMENDED WATER MANAGEMENT STRATEGY WATER SUPPLY VOLUMES FOR<br />
2010–2060 (ACRE-FEET PER YEAR).<br />
25,000<br />
20,000<br />
Brush Control<br />
15,000<br />
10,000<br />
Aquifer Storage and Recovery<br />
Other Surface <strong>Water</strong><br />
Groundwater<br />
Municipal Conservation<br />
Total <strong>Water</strong> Needs<br />
J3<br />
5,000<br />
0<br />
2010 2020 2030 2040 2050 2060<br />
FIGURE J.4. 2060 RECOMMENDED WATER MANAGEMENT STRATEGIES–RELATIVE SHARE OF SUPPLY.<br />
Brush Control<br />
45.6%<br />
Municipal Conservation<br />
3.0%<br />
J-4<br />
Other Surface <strong>Water</strong><br />
28.6%<br />
Aquifer Storage and Recovery<br />
21.1%<br />
WAT E R FOR TEXAS 2012 STATE WATER PLAN<br />
Groundwater<br />
1.7%<br />
91<br />
<strong>Chapter</strong> 2: plateau (j) region summary
2 Summary of<br />
Lower Colorado (K) Region<br />
The Lower Colorado <strong>Regional</strong> <strong>Water</strong><br />
Planning Area is composed of all or parts<br />
of 14 counties, portions of 6 river and<br />
coastal basins, and Matagorda Bay.<br />
The Lower Colorado <strong>Regional</strong> <strong>Water</strong> Planning Area is composed of all or parts of 14 counties, portions of 6 river<br />
and coastal basins, and Matagorda Bay (Figure K.1). Most of the region is located in the Colorado River Basin.<br />
Major cities in the region include Austin, Bay City, Pflugerville, and Fredericksburg. The largest economic sectors<br />
in the region include agriculture, government, service, manufacturing, and retail trade. The manufacturing<br />
sector is primarily concentrated in the technology and semiconductor industry in the Austin area. Oil, gas,<br />
petrochemical processing and mineral production are found primarily in Wharton and Matagorda counties<br />
near the coast. The 2011 Lower Colorado (K) <strong>Regional</strong> <strong>Water</strong> Plan can be found on the TWDB Web site at https://<br />
www.twdb.state.tx.us/wrpi/rwp/3rdRound/2011_RWP/RegionK/.<br />
PLAN HIGHLIGHTS<br />
• Additional supply needed in 2060—367,671 acre-feet per year<br />
• Recommended water management strategy volume in 2060—646,167 acre-feet per year<br />
• Total capital cost—$907 million<br />
• Conservation accounts for 37 percent of 2060 strategy volumes<br />
• One new major reservoir (Lower Colorado River Authority/San Antonio <strong>Water</strong> System Project Off-Channel)<br />
• Reuse accounts for 21 percent of 2060 strategy volumes<br />
92<br />
<strong>Chapter</strong> 2: lower colorado (k) region summary<br />
WAT E R FOR TEXAS 2012 STATE WATER PLAN
FIGURE K.1. LOWER COLORADO (K) REGIONAL WATER PLANNING AREA.<br />
Mills<br />
San Saba<br />
Colorado River<br />
Llano<br />
Burnet<br />
Williamson<br />
Gillespie<br />
Blanco<br />
Travis<br />
Region K<br />
Major Rivers<br />
Hays<br />
Bastrop<br />
Colorado River<br />
Cities<br />
Existing Reservoirs<br />
Fayette<br />
Carrizo - Wilcox Aquifer (outcrop)<br />
Colorado<br />
Carrizo - Wilcox Aquifer (subsurface)<br />
Region K<br />
Edwards (Balcones Fault Zone) Aquifer (outcrop)<br />
Major Rivers<br />
Edwards (Balcones Fault Zone) Aquifer (subsurface)<br />
Cities<br />
Edwards - Trinity (Plateau) Aquifer (outcrop)<br />
Marble Falls Aquifer*<br />
Existing Reservoirs<br />
Gulf Coast Aquifer<br />
Queen City Aquifer (outcrop)*<br />
Carrizo - Wilcox Aquifer (outcrop)<br />
Trinity Aquifer (outcrop)<br />
Queen City Aquifer (subsurface)*<br />
Carrizo - Wilcox Aquifer (subsurface)<br />
Trinity Aquifer (subsurface)<br />
Sparta Aquifer (outcrop)*<br />
Edwards (Balcones Fault Zone) Aquifer (outcrop)<br />
Ellenburger - San Saba Aquifer (outcrop)*<br />
Sparta Aquifer (subsurface)*<br />
Edwards (Balcones Fault Zone) Aquifer (subsurface)<br />
Ellenburger - San Saba Aquifer (subsurface)*<br />
Yegua - Jackson Aquifer*<br />
Edwards - Trinity (Plateau) Aquifer (outcrop)<br />
Hickory Aquifer (outcrop)*<br />
* Minor aquifer (only shown where<br />
Gulf Coast Aquifer<br />
Hickory Aquifer (subsurface)*<br />
there is no major aquifer)<br />
Trinity Aquifer (outcrop)<br />
Marble Falls Aquifer*<br />
Trinity Aquifer (subsurface)<br />
Ellenburger - San Saba Aquifer (outcrop)*<br />
Ellenburger - San Saba Aquifer (subsurface)*<br />
Hickory Aquifer (outcrop)*<br />
Hickory Aquifer (subsurface)*<br />
Queen City Aquifer (outcrop)*<br />
Queen City Aquifer (subsurface)*<br />
Sparta Aquifer (outcrop)*<br />
Sparta Aquifer (subsurface)*<br />
Yegua - Jackson Aquifer*<br />
Wharton<br />
Matagorda<br />
* Minor aquifer (only shown where there is no major aquifer)<br />
WAT E R FOR TEXAS 2012 STATE WATER PLAN<br />
93<br />
<strong>Chapter</strong> 2: lower colorado (k) region summary
POPULATION AND WATER DEMANDS<br />
In 2010, nearly 6 percent of the state’s total population resided in the Lower Colorado Region, and between<br />
2010 and 2060 its population is projected to increase by 100 percent to 2,831,937. <strong>Water</strong> demands, however,<br />
are projected to increase less significantly. By 2060, the region’s total water demand is projected to increase<br />
by 27 percent (Table K.1, and Figure K.1). Agricultural irrigation water use accounts for the largest share of<br />
demands through 2050, but by 2060, municipal demand in all forms (including county-other) is expected to<br />
surpass irrigation (Table K.1; Figure K.1). Demands for manufacturing and steam-electric generation are also<br />
projected to increase substantially.<br />
EXISTING WATER SUPPLIES<br />
The region has a large number of surface water and groundwater sources available. In 2010, surface water was<br />
projected to provide about 77 percent of supplies and groundwater about 23 percent. The principal surface<br />
water supply sources are the Colorado River and its tributaries, including the Highland Lakes system. There are<br />
nine reservoirs in the Lower Colorado region that provide water supply. In determining water supply from the<br />
Colorado River, the planning group assumed that its major senior water rights would not exercise a priority call<br />
on water rights in Region F and would otherwise honor agreements with certain Region F water right holders.<br />
Except where formal agreements exist to support these assumptions, these planning assumptions used to<br />
determine existing supplies from the Colorado River have no legal effect. There are 11 major and minor aquifers<br />
that supply groundwater to users in the region. The five major aquifers providing groundwater supplies are the<br />
Edwards-Trinity (Plateau) and Trinity in the western portion of the region, the Edwards (Balcones Fault Zone)<br />
and Carrizo-Wilcox in the central portion, and the Gulf Coast in the eastern portion. The total supply to the<br />
planning area is estimated to be 1,162,884 acre-feet in 2010, increasing less than 1 percent to 1,169,071 acre-feet in<br />
2060, because of an expected increase in small, local water supplies (Table K.1, Figure K.2).<br />
NEEDS<br />
<strong>Water</strong> user groups in the Lower Colorado Region were anticipated to need 255,709 acre-feet of additional water<br />
in 2010 and 367,671 acre-feet by 2060 under drought conditions (Table K.1, Figure K.2). All six water use sectors<br />
show needs for additional water by 2060. In 2010, the agricultural irrigation sector would have the largest needs<br />
in the event of drought (92 percent of total). However, by 2060, municipal needs are expected to increase, largely<br />
due to population growth over the planning period, and irrigation needs are expected to decline. These sectors<br />
would each represent approximately 37 percent of the total needs.<br />
RECOMMENDED WATER MANAGEMENT STRATEGIES AND COST<br />
<strong>Water</strong> management strategies included in the Lower Colorado regional water plan would provide 646,167 acrefeet<br />
of additional water supply by the year 2060 (Figures K.3 and K.4) at a total capital cost of $907.2 million<br />
for the region’s portion of the project (Appendix A). The primary recommended water management strategy is<br />
the Lower Colorado River Authority/San Antonio <strong>Water</strong> System project that consists of off-channel reservoirs,<br />
agricultural water conservation, additional groundwater development, and new and/or amended surface water<br />
rights. The costs associated with this project would be paid for by San Antonio and are included in the 2011 South<br />
Central <strong>Texas</strong> <strong>Regional</strong> <strong>Water</strong> Plan. If this project is not implemented jointly by the participants, a number of the<br />
individual components are recommended as alternate water management strategies to meet Lower Colorado<br />
Region needs. There are no unmet needs in the plan.<br />
94<br />
<strong>Chapter</strong> 2: lower colorado (k) region summary<br />
WAT E R FOR TEXAS 2012 STATE WATER PLAN
TABLE K.1. POPULATION, WATER SUPPLY, DEMAND, AND NEEDS 2010–2060<br />
Projected Population<br />
2010 2020 2030 2040 2050 2060<br />
1,412,834 1,714,282 2,008,142 2,295,627 2,580,533 2,831,937<br />
Existing Supplies (acre-feet per year)<br />
Surface water 892,327 892,689 894,886 897,359 900,286 900,477<br />
Groundwater 270,557 270,268 269,887 268,936 268,527 268,594<br />
Total <strong>Water</strong> Supplies 1,162,884 1,162,957 1,164,773 1,166,295 1,168,813 1,169,071<br />
Demands (acre-feet per year)<br />
Municipal 239,013 288,152 336,733 382,613 428,105 467,075<br />
County-other 29,630 33,820 36,697 40,438 44,673 49,273<br />
Manufacturing 38,162 44,916 56,233 69,264 77,374 85,698<br />
Mining 30,620 31,252 31,613 26,964 27,304 27,598<br />
Irrigation 589,705 567,272 545,634 524,809 504,695 468,763<br />
Steam-electric 146,167 201,353 210,713 258,126 263,715 270,732<br />
Livestock 13,395 13,395 13,395 13,395 13,395 13,395<br />
Total <strong>Water</strong> Demands 1,086,692 1,180,160 1,231,018 1,315,609 1,359,261 1,382,534<br />
Needs (acre-feet per year)<br />
Municipal 6,671 17,867 25,289 36,420 76,771 120,999<br />
County-other 223 1,725 4,347 8,128 11,610 14,892<br />
Manufacturing 146 298 452 605 741 934<br />
Mining 13,550 13,146 12,366 6,972 5,574 5,794<br />
Irrigation 234,738 217,011 198,717 181,070 164,084 135,822<br />
Steam-electric 193 53,005 53,175 76,430 81,930 89,042<br />
Livestock 188 188 188 188 188 188<br />
Total <strong>Water</strong> Needs 255,709 303,240 294,534 309,813 340,898 367,671<br />
K<br />
FIGURE K.2. 2060 LOWER COLORADO (K) EXISTING SUPPLIES, PROJECTED DEMANDS, AND<br />
IDENTIFIED WATER NEEDS BY WATER USE CATEGORY (ACRE-FEET PER YEAR).<br />
600,000<br />
500,000<br />
400,000<br />
Existing <strong>Water</strong> Supplies<br />
Projected <strong>Water</strong> Demands<br />
Identified <strong>Water</strong> Needs<br />
300,000<br />
200,000<br />
K-2<br />
100,000<br />
0<br />
MUNICIPAL MANUFACTURING MINING IRRIGATION STEAM-ELECTRIC LIVESTOCK<br />
WAT E R FOR TEXAS 2012 STATE WATER PLAN<br />
95<br />
<strong>Chapter</strong> 2: lower colorado (k) region summary
CONSERVATION RECOMMENDATIONS<br />
Conservation strategies represent up to 37 percent of the total amount of water resulting from all recommended<br />
water management strategies. <strong>Water</strong> conservation was included as a strategy for every municipal water user<br />
group with a need and water use greater than 140 gallons per capita per day. A demand reduction of 1 percent per<br />
year was assumed until the water user reached 140 gallons per capita per day. Conservation was recommended<br />
beginning in 2010 regardless of the decade when needs first occur to have significant effects on demand by the<br />
time the needs were realized. In addition to municipal conservation, the plan recommends significant irrigation<br />
conservation programs and projects.<br />
SELECT MAJOR WATER MANAGEMENT STRATEGIES<br />
• Off-channel reservoir project (Lower Colorado River Authority/San Antonio <strong>Water</strong> System) would provide<br />
47,000 acre-feet per year of water in the year 2060 at no cost to the region if it is paid for by project sponsors<br />
located in Region L (see Region L summary for cost assumptions).<br />
• Wastewater return flows would provide up to 78,956 acre-feet per year of water in 2060 with no assumed<br />
capital cost since no additional infrastructure is needed.<br />
• Municipal conservation and enhanced municipal/industrial conservation would provide up to 76,594 acrefeet<br />
per year of water in 2060 with no assumed capital cost, while irrigation conservation would provide up<br />
to 124,150 acre-feet per year of water in 2060 at a capital cost of approximately $3.8 million.<br />
• Reuse of treated wastewater would provide up to 58,783 acre-feet per year of water in 2060 with a capital<br />
cost in excess of $620 million.<br />
REGION-SPECIFIC STUDIES<br />
The <strong>Regional</strong> <strong>Water</strong> Planning Group developed three region-specific studies during the initial phase of the third<br />
planning cycle. The final reports documenting the findings can be found on the TWDB Web site at https://www.<br />
twdb.state.tx.us/wrpi/rwp/rwp_study.asp#k.<br />
• Surface <strong>Water</strong> Availability Modeling Study<br />
• Environmental Impacts of <strong>Water</strong> Management Strategies Study<br />
• Evaluation of High Growth Areas Study<br />
LOWER COLORADO PLANNING GROUP MEMBERS AND INTERESTS REPRESENTED<br />
Voting members during adoption of the 2011 <strong>Regional</strong> <strong>Water</strong> Plan:<br />
John E. Burke (Chair), water utilities; Jim Barho, environmental; Sandra Dannhardt, electric generating utilities;<br />
Finley deGraffenried, municipalities; Ronald G. Fieseler, water districts; Ronald Gertson, small business; Karen<br />
Haschke, public; Barbara Johnson, industries; James Kowis, river authorities; Teresa Lutes, municipalities; Bill<br />
Neve, counties; W.R. (Bob) Pickens, other; Doug Powell, recreation; W.A. (Billy) Roeder, counties; Rob Ruggiero,<br />
small business; Haskell Simon, agriculture; James Sultemeier, counties; Byron Theodosis, counties; Paul Tybor,<br />
water districts; David Van Dresar, water districts; Roy Varley, other; Jennifer Walker, environmental<br />
Former voting members during the 2006 – 2011 planning cycle:<br />
David Deeds, municipalities; Rick Gangluff, electric generating utilities; Mark Jordan, river authorities; Chris<br />
King, counties; Julia Marsden, public; Laura Marbury, public; Bill Miller, agriculture; Harold Streicher, small<br />
business; Del <strong>Water</strong>s, recreation<br />
96<br />
<strong>Chapter</strong> 2: lower colorado (k) region summary<br />
WAT E R FOR TEXAS 2012 STATE WATER PLAN
FIGURE K.3. RECOMMENDED WATER MANAGEMENT STRATEGY WATER SUPPLY VOLUMES FOR<br />
2010–2060 (ACRE-FEET PER YEAR).<br />
700,000<br />
600,000<br />
500,000<br />
400,000<br />
300,000<br />
200,000<br />
Aquifer Storage and Recovery<br />
Conjunctive Use<br />
Other Surface <strong>Water</strong><br />
New Major Reservoir<br />
Reuse<br />
Groundwater<br />
Drought Management<br />
Irrigation Conservation<br />
Municipal Conservation<br />
Total <strong>Water</strong> Needs<br />
K3<br />
100,000<br />
0<br />
2010 2020 2030 2040 2050 2060<br />
FIGURE K.4. 2060 RECOMMENDED WATER MANAGEMENT STRATEGIES–RELATIVE SHARE OF SUPPLY.<br />
Groundwater<br />
5.8%<br />
Reuse<br />
21.3%<br />
K-4<br />
Other Surface <strong>Water</strong><br />
16.8%<br />
New Major Reservoir<br />
7.3%<br />
Conjunctive Use<br />
9.6%<br />
Aquifer Storage and Recovery<br />
1.5%<br />
Drought Management<br />
0.3%<br />
Municipal Conservation<br />
11.9%<br />
Irrigation Conservation<br />
25.5%<br />
WAT E R FOR TEXAS 2012 STATE WATER PLAN<br />
97<br />
<strong>Chapter</strong> 2: lower colorado (k) region summary
2 Summary of<br />
South Central <strong>Texas</strong> (L) Region<br />
The South Central <strong>Texas</strong> <strong>Regional</strong> <strong>Water</strong><br />
Planning Area includes all or parts of<br />
21 counties, portions of nine river and<br />
coastal basins, the Guadalupe Estuary,<br />
and San Antonio Bay.<br />
The South Central <strong>Texas</strong> <strong>Regional</strong> <strong>Water</strong> Planning Area includes all or parts of 21 counties, portions of nine river<br />
and coastal basins, the Guadalupe Estuary, and San Antonio Bay (Figure L.1). The largest cities in the region<br />
are San Antonio, Victoria, San Marcos, and New Braunfels. The region’s largest economic sectors are tourism,<br />
military, medical, service, manufacturing, and retail trade. The region contains the two largest springs in <strong>Texas</strong>:<br />
Comal and San Marcos. <strong>Water</strong> planning in the region is particularly complex because of the intricate relationships<br />
between the region’s surface and groundwater resources. The 2011 South Central <strong>Texas</strong> (L) <strong>Regional</strong> <strong>Water</strong> Plan<br />
can be found on the TWDB Web site at https://www.twdb.state.tx.us/wrpi/rwp/3rdRound/2011_RWP/RegionL/.<br />
PLAN HIGHLIGHTS<br />
• Additional supply needed in 2060—436,751 acre-feet per year<br />
• Recommended water management strategy volume in 2060—765,738 acre-feet per year<br />
• Total capital cost—$7.6 billion<br />
• Conservation accounts for 11 percent of 2060 strategy volumes<br />
• Five new, major off-channel reservoirs (Guadalupe-Blanco River Authority: Mid-Basin, Exelon, and Lower<br />
Basin New Appropriation Projects; Lower Colorado River Authority/San Antonio <strong>Water</strong> System Project Off-<br />
Channel; Lavaca Off-Channel)<br />
• Significant Carrizo-Wilcox Aquifer development<br />
• Five unique stream segments recommended for designation (Figure ES.7)<br />
• Limited unmet irrigation needs<br />
98<br />
<strong>Chapter</strong> 2: south central texas (l) region summary<br />
WAT E R FOR TEXAS 2012 STATE WATER PLAN
FIGURE L.1. SOUTH CENTRAL TEXAS (L) REGIONAL WATER PLANNING AREA.<br />
Guadalupe River<br />
Hays<br />
Gulf Coast Aquifer<br />
Trinity Aquifer (outcrop)<br />
Trinity Aquifer (subsurface)<br />
Kendall<br />
Comal<br />
Caldwell<br />
Queen City Aquifer (outcrop)*<br />
Queen City Aquifer (subsurface)*<br />
Sparta Aquifer (outcrop)*<br />
Guadalupe<br />
Sparta Aquifer (subsurface)*<br />
Yegua - Jackson Aquifer*<br />
Bexar<br />
Ellenburger - San Saba Aquifer*<br />
Uvalde<br />
Medina<br />
Wilson<br />
Gonzales<br />
Hickory Aquifer*<br />
* Minor aquifer (only shown where<br />
there is no major aquifer)<br />
De Witt<br />
Zavala<br />
Frio<br />
Atascosa<br />
Karnes<br />
Victoria<br />
Goliad<br />
Dimmit<br />
La Salle<br />
Region L<br />
Major Rivers<br />
San Antonio River<br />
Refugio<br />
Calhoun<br />
Cities<br />
Existing Reservoirs<br />
Carrizo - Wilcox Aquifer (outcrop)<br />
Nueces River<br />
Carrizo - Wilcox Aquifer (subsurface)<br />
Edwards (Balcones Fault Zone) Aquifer (outcrop)<br />
Region L<br />
Major Rivers<br />
Cities<br />
Existing Reservoirs<br />
Carrizo - Wilcox Aquifer (outcrop)<br />
Carrizo - Wilcox Aquifer (subsurface)<br />
Edwards (Balcones Fault Zone) Aquifer (outcrop)<br />
Edwards (Balcones Fault Zone) Aquifer (subsurface)<br />
Edwards - Trinity (Plateau) Aquifer<br />
Gulf Coast Aquifer<br />
Edwards (Balcones Fault Zone) Aquifer (subsurface)<br />
Edwards - Trinity (Plateau) Aquifer<br />
Trinity Aquifer (outcrop)<br />
Trinity Aquifer (subsurface)<br />
Queen City Aquifer (outcrop)*<br />
Queen City Aquifer (subsurface)*<br />
Sparta Aquifer (outcrop)*<br />
Sparta Aquifer (subsurface)*<br />
Yegua - Jackson Aquifer*<br />
Ellenburger - San Saba Aquifer*<br />
Hickory Aquifer*<br />
* Minor aquifer (only shown where there is no major aquifer)<br />
WAT E R FOR TEXAS 2012 STATE WATER PLAN<br />
99<br />
<strong>Chapter</strong> 2: south central texas (l) region summary
POPULATION AND WATER DEMANDS<br />
Approximately 10 percent of the state’s total population resided in Region L in the year 2010, and between 2010<br />
and 2060 its population is projected to increase by 75 percent (Table L.1). By 2060, the total water demands for the<br />
region are projected to increase 32 percent (Table L.1). Starting in 2020, municipal water use makes up the largest<br />
share of these demands in all decades and is projected to experience the greatest increase over the planning<br />
period; a 62 percent increase (Table L.1, Figure L.2). Agricultural irrigation water demand will remain significant<br />
but is projected to decline 20 percent over the planning period.<br />
EXISTING WATER SUPPLIES<br />
The Edwards Aquifer is projected to provide approximately half of the region’s existing groundwater supply in<br />
2010, with the Carrizo-Wilcox Aquifer providing approximately 40 percent of the groundwater supplies. There<br />
are five major aquifers supplying water to the region, including the Edwards (Balcones Fault Zone), Carrizo-<br />
Wilcox, Trinity, Gulf Coast, and Edwards-Trinity (Plateau). The two minor aquifers supplying water are the<br />
Sparta and Queen City aquifers. The region includes portions of six river basins and three coastal basins. The<br />
principal surface water sources in the region are the Guadalupe, San Antonio, Lavaca, and Nueces rivers. The<br />
region’s existing water supply is expected to decline slightly between 2010 and 2060 as groundwater use is<br />
reduced in certain areas (Table L.1, Figure L.2).<br />
NEEDS<br />
Because total water supplies are not accessible by all water users throughout the region, in the event of drought,<br />
the South Central <strong>Texas</strong> Region faces water supply needs of up to 174,235 acre-feet as early as 2010 (Table<br />
L.1, Figure L.2). In 2010 these water supply needs consist primarily of municipal (55 percent) and irrigated<br />
agricultural needs (39 percent). By the year 2060, the water needs are significantly larger and are dominated to<br />
an even greater extent (68 percent) by municipal water users.<br />
RECOMMENDED WATER MANAGEMENT STRATEGIES AND COST<br />
The South Central <strong>Texas</strong> Planning Group recommended a variety of water management strategies to meet water<br />
supply needs (Figures L.3 and L.4). Implementing all the water management strategies recommended in the<br />
Region L plan would result in 765,738 acre-feet of additional water supplies in 2060 at a total capital cost of<br />
$7.6 billion (Appendix A). Because there were no economically feasible strategies identified to meet the needs,<br />
Atascosa and Zavala Counties have limited projected unmet irrigation needs.<br />
CONSERVATION RECOMMENDATIONS<br />
Conservation strategies account for 11 percent of the total amount of water that would be provided by the<br />
region’s recommended water management strategies. <strong>Water</strong> conservation was recommended in general for all<br />
municipal and non-municipal water user groups. In instances where the municipal water conservation goals<br />
could be achieved through anticipated use of low-flow plumbing fixtures, additional conservation measures<br />
were not recommended.<br />
100<br />
<strong>Chapter</strong> 2: south central texas (l) region summary<br />
WAT E R FOR TEXAS 2012 STATE WATER PLAN
TABLE L.1. POPULATION, WATER SUPPLY, DEMAND, AND NEEDS 2010–2060<br />
Projected Population<br />
2010 2020 2030 2040 2050 2060<br />
2,460,599 2,892,933 3,292,970 3,644,661 3,984,258 4,297,786<br />
Existing Supplies (acre-feet per year)<br />
Surface water 301,491 301,475 299,956 295,938 295,922 295,913<br />
Groundwater 717,263 716,541 712,319 711,521 710,539 709,975<br />
Reuse 16,049 16,049 16,049 16,049 16,049 16,049<br />
Total <strong>Water</strong> Supplies 1,034,803 1,034,065 1,028,324 1,023,508 1,022,510 1,021,937<br />
Demands (acre-feet per year)<br />
Municipal 369,694 422,007 471,529 512,671 555,281 597,619<br />
County-other 26,302 29,104 31,846 34,465 37,062 39,616<br />
Manufacturing 119,310 132,836 144,801 156,692 167,182 179,715<br />
Mining 14,524 15,704 16,454 17,212 17,977 18,644<br />
Irrigation 379,026 361,187 344,777 329,395 315,143 301,679<br />
Steam-electric 46,560 104,781 110,537 116,068 121,601 128,340<br />
Livestock 25,954 25,954 25,954 25,954 25,954 25,954<br />
Total <strong>Water</strong> Demands 981,370 1,091,573 1,145,898 1,192,457 1,240,200 1,291,567<br />
Needs (acre-feet per year)<br />
Municipal 94,650 134,541 173,989 212,815 249,735 288,618<br />
County-other 2,003 3,073 4,228 5,430 7,042 8,768<br />
Manufacturing 6,539 13,888 20,946 27,911 34,068 43,072<br />
Mining 521 726 1,771 1,992 2,293 2,493<br />
Irrigation 68,465 62,376 56,519 50,894 45,502 41,782<br />
Steam-electric 2,054 50,962 50,991 51,021 51,657 52,018<br />
Livestock 3 1 0 0 0 0<br />
Total <strong>Water</strong> Needs 174,235 265,567 308,444 350,063 390,297 436,751<br />
L<br />
FIGURE L.2. 2060 SOUTH CENTRAL TEXAS (L) EXISTING SUPPLIES, PROJECTED DEMANDS, AND<br />
IDENTIFIED WATER NEEDS BY WATER USE CATEGORY (ACRE-FEET PER YEAR).<br />
700,000<br />
600,000<br />
500,000<br />
400,000<br />
300,000<br />
Existing <strong>Water</strong> Supplies<br />
Projected <strong>Water</strong> Demands<br />
Identified <strong>Water</strong> Needs<br />
L-2<br />
200,000<br />
100,000<br />
0<br />
MUNICIPAL MANUFACTURING MINING IRRIGATION STEAM-ELECTRIC LIVESTOCK<br />
WAT E R FOR TEXAS 2012 STATE WATER PLAN<br />
101<br />
<strong>Chapter</strong> 2: south central texas (l) region summary
SELECT MAJOR WATER MANAGEMENT STRATEGIES<br />
• Three Brackish Groundwater Desalination (Wilcox Aquifer) projects would provide a total of up to 42,220<br />
acre-feet per year of water in the year 2060 with a capital cost of $378 million.<br />
• Hays/Caldwell Public Utility Agency Project would provide up to 33,314 acre-feet per year of groundwater<br />
(Carrizo Aquifer) in 2060 with a capital cost of $308 million.<br />
• Guadalupe-Blanco River Authority Mid-Basin Project would provide 25,000 acre-feet per year of Guadalupe<br />
run-of-river supplies stored in an off-channel reservoir starting in 2020 with a capital cost of $547 million.<br />
• Off-channel reservoir project (Lower Colorado River Authority/San Antonio <strong>Water</strong> System) would provide<br />
90,000 acre-feet per year of water starting in 2030 with a capital cost of $2 billion.<br />
• Recycled <strong>Water</strong> Programs would provide up to 41,737 acre-feet per year of water in 2060 with a capital cost<br />
of $465 million.<br />
• Seawater Desalination Project would provide 84,012 acre-feet per year of water in 2060 with a capital cost of<br />
$1.3 billion.<br />
REGION-SPECIFIC STUDIES<br />
The <strong>Regional</strong> <strong>Water</strong> Planning Group developed five region-specific studies during the initial phase of the third<br />
planning cycle. The final reports documenting the findings can be found on the TWDB Web site at https://www.<br />
twdb.state.tx.us/wrpi/rwp/rwp_study.asp#l.<br />
• Lower Guadalupe <strong>Water</strong> Supply Project for Guadalupe-Blanco River Authority Needs<br />
• Brackish Groundwater Supply Evaluation<br />
• Enhanced <strong>Water</strong> Conservation, Drought Management, and Land Stewardship<br />
• Environmental Studies<br />
• Environmental Evaluations of <strong>Water</strong> Management Strategies<br />
SOUTH CENTRAL TEXAS PLANNING GROUP MEMBERS AND INTERESTS REPRESENTED<br />
Voting members during adoption of the 2011 <strong>Regional</strong> <strong>Water</strong> Plan:<br />
Con Mims (Chair), river authorities; Jason Ammerman, industries; Tim Andruss, water districts; Donna Balin,<br />
environmental; Evelyn Bonavita, public; Darrell Brownlow, Ph.D., small business; Velma Danielson, water<br />
districts; Garrett Engelking, water districts; Mike Fields, electric generating utilities; Bill Jones, agriculture; John<br />
Kight, counties; David Langford, agriculture; Mike Mahoney, water districts; Gary Middleton, municipalities;<br />
Jay Millikin, counties; Ron Naumann, water utilities; Illiana Pena, environmental; Robert Puente, municipalities;<br />
Steve Ramsey, water utilities; Suzanne B. Scott, river authorities; Milton Stolte, agriculture<br />
Former voting members during the 2006 – 2011 planning cycle:<br />
Doug Miller, small business; David Chardavoynne, municipalities; Gil Olivares, water districts<br />
102<br />
<strong>Chapter</strong> 2: south central texas (l) region summary<br />
WAT E R FOR TEXAS 2012 STATE WATER PLAN
FIGURE L.3. RECOMMENDED WATER MANAGEMENT STRATEGY WATER SUPPLY VOLUMES FOR<br />
2010–2060 (ACRE-FEET PER YEAR).<br />
800,000<br />
700,000<br />
600,000<br />
500,000<br />
400,000<br />
300,000<br />
200,000<br />
100,000<br />
Seawater Desalination<br />
Aquifer Storage and Recovery<br />
Other Surface <strong>Water</strong><br />
New Major Reservoir<br />
Groundwater Desalination<br />
Reuse<br />
Groundwater<br />
Drought Management<br />
Other Conservation<br />
Irrigation Conservation<br />
Municipal Conservation<br />
Total <strong>Water</strong> Needs<br />
L3<br />
0<br />
2010 2020 2030 2040 2050 2060<br />
FIGURE L.4. 2060 RECOMMENDED WATER MANAGEMENT STRATEGIES–RELATIVE SHARE OF SUPPLY.<br />
Reuse<br />
6.1%<br />
Groundwater Desalination<br />
5.5%<br />
Aquifer Storage and Recovery<br />
6.6%<br />
L-4<br />
Groundwater<br />
30.7%<br />
Seawater Desalination<br />
11.0%<br />
Municipal Conservation<br />
9.5%<br />
Other Surface <strong>Water</strong><br />
5.2%<br />
Irrigation Conservation<br />
0.9%<br />
Other Conservation<br />
0.3%<br />
New Major Reservoir<br />
24.2%<br />
WAT E R FOR TEXAS 2012 STATE WATER PLAN<br />
103<br />
<strong>Chapter</strong> 2: south central texas (l) region summary
2 Summary of<br />
Rio Grande (M) Region<br />
The Rio Grande <strong>Regional</strong> <strong>Water</strong> Planning<br />
Area includes eight counties, with over<br />
60 percent of the region lying within the<br />
Rio Grande Basin.<br />
The Rio Grande <strong>Regional</strong> <strong>Water</strong> Planning Area includes eight counties, with over 60 percent of the region<br />
lying within the Rio Grande Basin (Figure M.1). Its major cities include Brownsville, McAllen, and Laredo.<br />
The international reservoirs of the Rio Grande are the region’s primary source of water. Portions of two major<br />
aquifers, the Gulf Coast and the Carrizo-Wilcox, lie under a large portion of the Rio Grande Region. The largest<br />
economic sectors in the region are agriculture, trade, services, manufacturing, and hydrocarbon production. The<br />
2011 Rio Grande (M) <strong>Regional</strong> <strong>Water</strong> Plan can be found on the TWDB Web site at https://www.twdb.state.tx.us/<br />
wrpi/rwp/3rdRound/2011_RWP/RegionM/.<br />
PLAN HIGHLIGHTS<br />
• Additional supply needed in 2060—609,906 acre-feet per year<br />
• Recommended water management strategy volume in 2060—673,846 acre-feet per year<br />
• Total capital cost—$2.2 billion<br />
• Conservation accounts for 43 percent of 2060 strategy volumes<br />
• Two new major reservoirs (Brownsville Weir, Laredo Low <strong>Water</strong> Weir)<br />
• Significant unmet irrigation needs<br />
104<br />
<strong>Chapter</strong> 2: rio grande (M) region summary<br />
WAT E R FOR TEXAS 2012 STATE WATER PLAN
FIGURE M.1. RIO GRANDE (M) REGIONAL WATER PLANNING AREA.<br />
Maverick<br />
Region M<br />
Major Rivers<br />
Rio Grande River<br />
Cities<br />
Existing Reservoirs<br />
Webb<br />
Carrizo - Wilcox Aquifer (outcrop)<br />
Carrizo - Wilcox Aquifer (subsurface)<br />
Gulf Coast Aquifer<br />
Yegua - Jackson Aquifer*<br />
* Minor aquifer (only shown where there is no major aquifer)<br />
Zapata<br />
Jim Hogg<br />
Starr<br />
Region M<br />
Major Rivers<br />
Cities<br />
Existing Reservoirs<br />
Carrizo - Wilcox Aquifer (outcrop)<br />
Carrizo - Wilcox Aquifer (subsurface)<br />
Gulf Coast Aquifer<br />
Yegua - Jackson Aquifer*<br />
* Minor aquifer (only shown where there is no major aquifer)<br />
Hidalgo<br />
Willacy<br />
Cameron<br />
WAT E R FOR TEXAS 2012 STATE WATER PLAN<br />
105<br />
<strong>Chapter</strong> 2: rio grande (M) region summary
POPULATION AND WATER DEMANDS<br />
Approximately 6 percent of the state’s total population resided in the Rio Grande Region in the year 2010, and<br />
between 2010 and 2060 the regional population is projected to increase 142 percent (Table M.1). By 2060, the<br />
total water demands for the region are projected to increase 13 percent (Table M.1). Agricultural irrigation water<br />
demand makes up the largest share of these demands in all decades and is projected to decrease 16 percent over<br />
the planning period due largely to urbanization (Table M.1, Figure M.2). Municipal water demand, however, is<br />
projected to increase 124 percent and county-other demand 126 percent by 2060.<br />
EXISTING WATER SUPPLIES<br />
Surface water provides over 90 percent of the region’s water supply. The principal surface water source is the<br />
Rio Grande, its tributaries, and two major international reservoirs, one of which is located upstream above<br />
the planning area’s northern boundary. The United States’ share of the firm yield of these reservoirs is over 1<br />
million acre-feet; however, sedimentation will reduce that yield by 3 percent (about 31,000 acre-feet of existing<br />
supply) over the planning period. About 87 percent of the United States’ surface water rights in the international<br />
reservoirs go to the lower two counties in the planning area, Cameron and Hidalgo. There are two major<br />
aquifers in the region: the Carrizo-Wilcox and Gulf Coast. A large portion of the groundwater found in Region<br />
M’s portion of the Gulf Coast Aquifer is brackish. By 2060, the total surface water and groundwater supply is<br />
projected to decline 2 percent (Table M.1, Figure M.2).<br />
NEEDS<br />
The region’s surface water supplies from the Rio Grande depend on an operating system that guarantees<br />
municipal and industrial users’ supplies over other categories (particularly agriculture). Thus, the total water<br />
supply volume is not accessible to all water users throughout the region, resulting in significant water needs<br />
occurring during drought across the region. In the event of drought conditions, total water needs of 435,922<br />
acre-feet could have occurred across the region as early as 2010, and by 2060 these water needs are projected to<br />
increase to 609,906 acre-feet. The majority of the Rio Grande Region water needs are associated with irrigation<br />
and municipal uses. Irrigation accounted for 93 percent of the Rio Grande Region’s total water needs in 2010 and<br />
is projected to decrease to 42 percent by 2060. During the same time period, municipal water needs increase from<br />
6 percent to 54 percent of the region’s total water needs. (Table M.1, Figure M.2).<br />
RECOMMENDED WATER MANAGEMENT STRATEGIES AND COST<br />
The Rio Grande Planning Group recommended a variety of water management strategies to meet future needs<br />
including municipal and irrigation conservation, reuse, groundwater development, desalination, and surface<br />
water reallocation (Figures M.3 and M.4). The total needs for Region M are projected to decrease between 2010<br />
and 2030 due to the rate of irrigation demand decrease being larger than the rate of municipal demand increase.<br />
However, after the year 2030 the rate of change for increasing municipal demand surpasses that of the decreasing<br />
irrigation demand resulting in the steady increase of total needs through the year 2060. Implementation of the<br />
recommended strategies will meet all regional needs (including all the needs associated with municipalities)<br />
for water users identified in the plan except for a significant portion of the region’s irrigation needs, for which<br />
no economically feasible strategies were identified. This is estimated to be up to 394,896 acre-feet of unmet<br />
irrigation needs in 2010. In all, the recommended strategies would provide over 673,846 acre-feet of additional<br />
water supply by the year 2060 at a total capital cost of $2.2 billion (Appendix A).<br />
106<br />
<strong>Chapter</strong> 2: rio grande (M) region summary<br />
WAT E R FOR TEXAS 2012 STATE WATER PLAN
TABLE M.1. POPULATION, WATER SUPPLY, DEMAND, AND NEEDS 2010–2060<br />
Projected Population<br />
2010 2020 2030 2040 2050 2060<br />
1,628,278 2,030,994 2,470,814 2,936,748 3,433,188 3,935,223<br />
Existing Supplies (acre-feet per year)<br />
Surface water 1,008,597 1,002,180 996,295 990,244 983,767 977,867<br />
Groundwater 81,302 84,650 86,965 87,534 87,438 87,292<br />
Reuse 24,677 24,677 24,677 24,677 24,677 24,677<br />
Total <strong>Water</strong> Supplies 1,114,576 1,111,507 1,107,937 1,102,455 1,095,882 1,089,836<br />
Demands (acre-feet per year)<br />
Municipal 259,524 314,153 374,224 438,453 508,331 581,043<br />
County-other 28,799 35,257 42,172 49,405 57,144 64,963<br />
Manufacturing 7,509 8,274 8,966 9,654 10,256 11,059<br />
Mining 4,186 4,341 4,433 4,523 4,612 4,692<br />
Irrigation 1,163,634 1,082,232 981,748 981,748 981,748 981,748<br />
Steam-electric 13,463 16,864 19,716 23,192 27,430 32,598<br />
Livestock 5,817 5,817 5,817 5,817 5,817 5,817<br />
Total <strong>Water</strong> Demands 1,482,932 1,466,938 1,437,076 1,512,792 1,595,338 1,681,920<br />
Needs (acre-feet per year)<br />
Municipal 20,889 53,849 98,933 154,514 221,595 292,700<br />
County-other 5,590 10,428 16,786 23,491 30,698 37,925<br />
Manufacturing 1,921 2,355 2,748 3,137 3,729 4,524<br />
Irrigation 407,522 333,246 239,408 245,896 252,386 258,375<br />
Steam-electric 0 1,980 4,374 7,291 11,214 16,382<br />
Total <strong>Water</strong> Needs 435,922 401,858 362,249 434,329 519,622 609,906<br />
M<br />
FIGURE M.2. 2060 RIO GRANDE (M) EXISTING SUPPLIES, PROJECTED DEMANDS, AND IDENTIFIED<br />
WATER NEEDS BY WATER USE CATEGORY (ACRE-FEET PER YEAR).<br />
1,200,000<br />
1,000,000<br />
800,000<br />
Existing <strong>Water</strong> Supplies<br />
Projected <strong>Water</strong> Demands<br />
Identified <strong>Water</strong> Needs<br />
600,000<br />
M-2<br />
400,000<br />
200,000<br />
0<br />
MUNICIPAL MANUFACTURING MINING IRRIGATION STEAM-ELECTRIC LIVESTOCK<br />
WAT E R FOR TEXAS 2012 STATE WATER PLAN<br />
107<br />
<strong>Chapter</strong> 2: rio grande (M) region summary
CONSERVATION RECOMMENDATIONS<br />
Conservation strategies for municipal and irrigation water users account for approximately 43 percent of the<br />
water associated with the region’s recommended strategies. Irrigation conservation strategies account for the<br />
majority of these savings, through Best Management Practices including water district conveyance system<br />
improvements and on-farm conservation practices. Municipal water conservation was recommended for almost<br />
all municipal water user groups with a need. Conservation was also recommended for several communities that<br />
do not anticipate a municipal water need during the planning horizon.<br />
SELECT MAJOR WATER MANAGEMENT STRATEGIES<br />
• Acquisition of water rights through purchase is projected to provide up to 151,237 acre-feet per year of water<br />
in the year 2060 with a capital cost of $631 million.<br />
• Brackish Groundwater Desalination is expected to provide up to 92,212 acre-feet per year of water in 2060<br />
with a capital cost of $267 million.<br />
• Brownsville Weir and Reservoir is projected to provide up to 23,643 acre-feet per year of surface water in<br />
2060 at a capital cost of $98 million.<br />
• Seawater Desalination is projected to provide up to 7,902 acre-feet per year of water in 2060 at a capital cost<br />
of $186 million.<br />
• Irrigation Conveyance System Conservation is expected to provide up to 139,217 acre-feet per year of water<br />
in 2060 at a capital cost of $132 million.<br />
REGION-SPECIFIC STUDIES<br />
The Rio Grande <strong>Regional</strong> <strong>Water</strong> Planning Group developed three region-specific studies during the initial phase<br />
of the third planning cycle. The final reports documenting the findings can be found on the TWDB Web site at<br />
https://www.twdb.state.tx.us/wrpi/rwp/rwp_study.asp#m.<br />
• Evaluation of Alternate <strong>Water</strong> Supply Management Strategies Regarding the Use and Classification of<br />
Existing <strong>Water</strong> Rights on the Lower and Middle Rio Grande<br />
• Classify Irrigation Districts as <strong>Water</strong> User Groups<br />
• Analyze Results of Demonstration Projects<br />
RIO GRANDE PLANNING GROUP MEMBERS AND INTERESTS REPRESENTED<br />
Voting members during adoption of the 2011 <strong>Regional</strong> <strong>Water</strong> Plan:<br />
Glenn Jarvis (Chair), other; Jorge Barrera, municipalities; John Bruciak, municipalities; Mary Lou Campbell,<br />
public; James (Jim) Darling, river authorities; Ella de la Rosa, electric generating utilities; Robert E. Fulbright,<br />
agriculture; Carlos Garza, small business; Dennis Goldsberry, water utilities; Joe Guerra, electric generating<br />
utilities; Sonny Hinojosa, water districts; Sonia Lambert, water districts; Donald K. McGhee, small business/<br />
industries; Sonia Najera, environmental; Ray Prewett, agriculture; Tomas Rodriguez, Jr., municipalities; Gary<br />
Whittington, industries/other; John Wood, counties<br />
Former voting members during the 2006 – 2011 planning cycle:<br />
Jose Aranda, counties; Charles (Chuck) Browning, water utilities; Karen Chapman, environmental; Kathleen<br />
Garrett, electric generating utilities; Robert Gonzales, municipalities; James R. Matz, other; Adrian Montemayor,<br />
municipalities; Xavier Villarreal, small business<br />
108<br />
<strong>Chapter</strong> 2: rio grande (M) region summary<br />
WAT E R FOR TEXAS 2012 STATE WATER PLAN
FIGURE M.3. RECOMMENDED WATER MANAGEMENT STRATEGY WATER SUPPLY VOLUMES FOR<br />
2010–2060 (ACRE-FEET PER YEAR).<br />
800,000<br />
700,000<br />
600,000<br />
500,000<br />
400,000<br />
300,000<br />
200,000<br />
Seawater Desalination<br />
Other Surface <strong>Water</strong><br />
New Major Reservoir<br />
Groundwater Desalination<br />
Reuse<br />
Groundwater<br />
Irrigation Conservation<br />
Municipal Conservation<br />
Total <strong>Water</strong> Needs<br />
M3<br />
100,000<br />
0<br />
2010 2020 2030 2040 2050 2060<br />
FIGURE M.4. 2060 RECOMMENDED WATER MANAGEMENT STRATEGIES–RELATIVE SHARE OF SUPPLY.<br />
Groundwater<br />
3.6%<br />
Reuse<br />
9.7%<br />
Groundwater Desalination<br />
13.7%<br />
M-4<br />
Other Surface <strong>Water</strong><br />
25.8%<br />
Seawater Desalination<br />
1.2%<br />
Municipal Conservation<br />
4.9%<br />
Irrigation Conservation<br />
37.7%<br />
New Major Reservoir<br />
3.5%<br />
WAT E R FOR TEXAS 2012 STATE WATER PLAN<br />
109<br />
<strong>Chapter</strong> 2: rio grande (M) region summary
2 Summary of<br />
Coastal Bend (N) Region<br />
The Coastal Bend <strong>Regional</strong> <strong>Water</strong> Planning<br />
Area includes 11 counties, portions of the<br />
Nueces River Basin, and its adjoining coastal<br />
basins, including the Nueces Estuary.<br />
The Coastal Bend <strong>Regional</strong> <strong>Water</strong> Planning Area includes 11 counties, portions of the Nueces River Basin, and<br />
its adjoining coastal basins, including the Nueces Estuary (Figure N.1). The region’s largest economic sectors<br />
are service industries, retail trade, government, construction, manufacturing, and the petrochemical industry.<br />
Corpus Christi is the region’s largest metropolitan area. The 2011 Coastal Bend (N) <strong>Regional</strong> <strong>Water</strong> Plan can be<br />
found on the TWDB Web site at https://www.twdb.state.tx.us/wrpi/rwp/3rdRound/2011_RWP/RegionN/.<br />
PLAN HIGHLIGHTS<br />
• Additional supply needed in 2060—75,744 acre-feet per year<br />
• Recommended water management strategy volume in 2060—156,326 acre-feet per year<br />
• Total capital cost—$656 million<br />
• Conservation accounts for 5 percent of 2060 strategy volumes<br />
• Two new major reservoirs (Lavaca Off-Channel, Nueces Off-Channel)<br />
• Limited unmet mining needs<br />
110<br />
<strong>Chapter</strong> 2: coastal bend (n) region summary<br />
WAT E R FOR TEXAS 2012 STATE WATER PLAN
FIGURE N.1. COASTAL BEND (N) REGIONAL WATER PLANNING AREA.<br />
Bee<br />
Nueces River<br />
McMullen<br />
Live Oak<br />
Aransas<br />
San Patricio<br />
Duval<br />
Jim Wells<br />
Nueces<br />
Kleberg<br />
Region N<br />
Major Rivers<br />
Cities<br />
Brooks<br />
Existing Reservoirs<br />
Kenedy<br />
Carrizo - Wilcox Aquifer (subsurface)<br />
Gulf Coast Aquifer<br />
Yegua - Jackson Aquifer*<br />
* Minor aquifer (only shown where<br />
there is no major aquifer)<br />
Region N<br />
Major Rivers<br />
Cities<br />
Existing Reservoirs<br />
Carrizo - Wilcox Aquifer (subsurface)<br />
Gulf Coast Aquifer<br />
Yegua - Jackson Aquifer*<br />
* Minor aquifer (only shown where there is no major aquifer)<br />
WAT E R FOR TEXAS 2012 STATE WATER PLAN<br />
111<br />
<strong>Chapter</strong> 2: coastal bend (n) region summary
POPULATION AND WATER DEMANDS<br />
Approximately 3 percent of the state’s total 2010 population resided in the Coastal Bend Region, and between<br />
2010 and 2060 population is projected to increase by 44 percent to 885,665 (Table N.1). Ninety-three percent<br />
of this population growth is projected to occur in Nueces and San Patricio counties. By 2060, the total water<br />
demands for the region are projected to increase by 40 percent (Table N.1, Figure N.2). Municipal water use<br />
makes up the largest share of these demands in all decades and is projected to increase about 40 percent over<br />
the planning period. Rural municipal demand projections, represented by county-other, reflect a slight decrease<br />
as municipalities are anticipated to annex some of these rural areas. Manufacturing demands are also expected<br />
to grow significantly, increasing 38 percent. Though not the largest volumetric increase in the region, steamelectric<br />
demands are projected to increase 278 percent. Projected steam-electric demand increases are attributed<br />
to increased generating capacity in Nueces County.<br />
EXISTING WATER SUPPLIES<br />
Over three-fourths of the region’s existing water supply is associated with surface water resources (Table N.1,<br />
Figure N.2). The majority of those supplies are provided by Nueces River Basin streamflows together with<br />
reservoirs in the Nueces River Basin and interbasin transfers from the Lavaca Region. The region relies on<br />
significant amounts of surface water transferred from the Lavaca River Basin. The two major (Gulf Coast and<br />
Carrizo-Wilcox) and two minor (Queen City and Sparta) aquifers provide groundwater to numerous areas<br />
within the region. As the primary groundwater source, the Gulf Coast Aquifer underlies at least a portion of<br />
every county in the region. Existing surface water supply is projected to increase as a result of future increases in<br />
existing water supply contracts from the Lake Corpus Christi-Choke Canyon Reservoir System.<br />
NEEDS<br />
The Coastal Bend Region faces water supply needs as early as 2010 in the event of drought (Table N.1, Figure<br />
N.2). Mining use accounts for approximately half of the 2010 needs (about 1,800 acre-feet). By the year 2060, the<br />
needs are dominated by manufacturing needs.<br />
RECOMMENDED WATER MANAGEMENT STRATEGIES AND COST<br />
The Coastal Bend <strong>Regional</strong> <strong>Water</strong> Planning Group recommended a variety of water management strategies<br />
to meet future needs including two proposed off-channel reservoirs, groundwater development, interbasin<br />
transfers of surface water from the Colorado River Basin, and conservation. Implementing all recommended<br />
strategies in the Coastal Bend plan would result in 156,326 acre-feet of additional water supplies in 2060 (Figures<br />
N.3 and N.4) at a total capital cost of $656.1 million (Appendix A). Implementation of these strategies would<br />
meet all projected water needs in the region except for 3,876 acre-feet of mining needs in 2060 that would be<br />
unmet because no feasible strategies were identified.<br />
112<br />
<strong>Chapter</strong> 2: coastal bend (n) region summary<br />
WAT E R FOR TEXAS 2012 STATE WATER PLAN
TABLE N.1. POPULATION, WATER SUPPLY, DEMAND, AND NEEDS 2010–2060<br />
Projected Population<br />
2010 2020 2030 2040 2050 2060<br />
617,143 693,940 758,427 810,650 853,964 885,665<br />
Existing Supplies (acre-feet per year)<br />
Surface water 186,866 191,078 195,658 197,472 197,994 198,814<br />
Groundwater 57,580 58,951 58,442 58,522 58,237 57,624<br />
Total <strong>Water</strong> Supplies 244,446 250,029 254,100 255,994 256,231 256,438<br />
Demands (acre-feet per year)<br />
Municipal 100,231 111,366 120,543 128,115 134,959 140,636<br />
County-other 11,264 11,495 11,520 11,310 11,077 10,838<br />
Manufacturing 63,820 69,255 73,861 78,371 82,283 88,122<br />
Mining 15,150 16,524 16,640 17,490 18,347 19,114<br />
Irrigation 25,884 26,152 26,671 27,433 28,450 29,726<br />
Steam-electric 7,316 14,312 16,733 19,683 23,280 27,664<br />
Livestock 8,838 8,838 8,838 8,838 8,838 8,838<br />
Total <strong>Water</strong> Demands 232,503 257,942 274,806 291,240 307,234 324,938<br />
Needs (acre-feet per year)<br />
Municipal 138 256 366 464 550 627<br />
County-other 428 301 387 363 1,890 1,768<br />
Manufacturing 409 7,980 15,859 25,181 34,686 46,905<br />
Mining 1,802 2,996 4,471 6,166 6,897 7,584<br />
Irrigation 627 569 1,264 2,316 3,784 5,677<br />
Steam-electric 0 1,982 4,755 7,459 10,187 13,183<br />
Total <strong>Water</strong> Needs 3,404 14,084 27,102 41,949 57,994 75,744<br />
N<br />
FIGURE N.2. 2060 COASTAL BEND (N) EXISTING SUPPLIES, PROJECTED DEMANDS, AND IDENTIFIED<br />
WATER NEEDS BY WATER USE CATEGORY (ACRE-FEET PER YEAR).<br />
180,000<br />
160,000<br />
140,000<br />
120,000<br />
100,000<br />
Existing <strong>Water</strong> Supplies<br />
Projected <strong>Water</strong> Demands<br />
Identified <strong>Water</strong> Needs<br />
N-2<br />
80,000<br />
60,000<br />
40,000<br />
20,000<br />
0<br />
MUNICIPAL MANUFACTURING MINING IRRIGATION STEAM-ELECTRIC LIVESTOCK<br />
WAT E R FOR TEXAS 2012 STATE WATER PLAN<br />
113<br />
<strong>Chapter</strong> 2: coastal bend (n) region summary
CONSERVATION RECOMMENDATIONS<br />
Conservation strategies represent approximately 5 percent of the total amount of water that would be provided<br />
by all recommended water management strategies in 2060. Conservation strategies were recommended for<br />
municipal, irrigation, manufacturing, and mining water users. The Coastal Bend Region recommended that<br />
water user groups with and without shortages that exceed 165 gallons per capita per day should reduce<br />
consumption by 15 percent by 2060.<br />
SELECT MAJOR WATER MANAGEMENT STRATEGIES<br />
• O.N. Stevens <strong>Water</strong> Treatment Plant Improvements would provide up to 42,329 acre-feet per year of surface<br />
water starting in 2010 with a capital cost of $31 million.<br />
• Garwood Pipeline would provide 35,000 acre-feet per year of surface water starting in 2020 with a capital<br />
cost of $113 million.<br />
• Off–Channel Reservoir near Lake Corpus Christi would provide 30,340 acre-feet per year of water starting<br />
in the year 2030 with a capital cost of $301 million<br />
• Construction of Lavaca River Off-Channel Diversion and Off-Channel Reservoir Project would provide<br />
16,242 acre-feet per year of water to Region N in 2060 with a capital cost of $139 million for Region N’s<br />
portion of total project costs.<br />
REGION-SPECIFIC STUDIES<br />
The <strong>Regional</strong> <strong>Water</strong> Planning Group developed five region-specific studies during the initial phase of the third<br />
planning cycle. The final reports documenting the findings can be found on the TWDB Web-site at https://www.<br />
twdb.state.tx.us/wrpi/rwp/rwp_study.asp#n.<br />
• Evaluation of Additional Potential <strong>Regional</strong> <strong>Water</strong> Supplies for Delivery through the Mary Rhodes Pipeline,<br />
Including Gulf Coast Groundwater and Garwood Project<br />
• Optimization and Implementation Studies for Off-Channel Reservoir<br />
• Implementation Analyses for Pipeline from Choke Canyon Reservoir to Lake Corpus Christi, Including<br />
Channel Loss Study Downstream of Choke Canyon Reservoir<br />
• <strong>Water</strong> Quality Modeling of <strong>Regional</strong> <strong>Water</strong> Supply System to Enhance <strong>Water</strong> Quality and Improve Industrial<br />
<strong>Water</strong> Conservation<br />
• Region-Specific <strong>Water</strong> Conservation Best Management Practices<br />
COASTAL BEND PLANNING GROUP MEMBERS AND INTERESTS REPRESENTED<br />
Voting members during adoption of the 2011 <strong>Regional</strong> <strong>Water</strong> Plan:<br />
Carola Serrato (Co-Chair) water utilities; Scott Bledsoe, III (Co-Chair), water districts; Tom Ballou, industries;<br />
Chuck Burns, agriculture; Teresa Carrillo, environmental; Billy Dick, municipalities; Lavoyger Durham, counties;<br />
Gary Eddins, electric generating utilities; Pancho Hubert, small business; Pearson Knolle, small business; Robert<br />
Kunkel, industries; Bernard Paulson, other; Thomas Reding, Jr., river authorities; Charles Ring, agriculture;<br />
Mark Scott, municipalities; Kimberly Stockseth, public ; Bill Stockton, counties<br />
Former voting members during the 2006 – 2011 planning cycle:<br />
Bill Beck, electric generating utilities; Patrick Hubert, small business; Josephine Miller, counties; Bobby Nedbalek,<br />
agriculture<br />
114<br />
<strong>Chapter</strong> 2: coastal bend (n) region summary<br />
WAT E R FOR TEXAS 2012 STATE WATER PLAN
FIGURE N.3. RECOMMENDED WATER MANAGEMENT STRATEGY WATER SUPPLY VOLUMES FOR<br />
2010–2060 (ACRE-FEET PER YEAR).<br />
180,000<br />
160,000<br />
140,000<br />
120,000<br />
100,000<br />
80,000<br />
60,000<br />
40,000<br />
Other Surface <strong>Water</strong><br />
New Major Reservoir<br />
Reuse<br />
Groundwater<br />
Other Conservation<br />
Irrigation Conservation<br />
Municipal Conservation<br />
Total <strong>Water</strong> Needs<br />
N3<br />
20,000<br />
0<br />
2010 2020 2030 2040 2050 2060<br />
FIGURE N.4. 2060 RECOMMENDED WATER MANAGEMENT STRATEGIES–RELATIVE SHARE OF SUPPLY.<br />
Groundwater<br />
20.2%<br />
N-4<br />
Other Surface <strong>Water</strong><br />
45.3%<br />
Reuse<br />
0.2%<br />
Municipal Conservation<br />
1.5%<br />
Irrigation Conservation<br />
0.2%<br />
Other Conservation<br />
2.8%<br />
New Major Reservoir<br />
29.8%<br />
WAT E R FOR TEXAS 2012 STATE WATER PLAN<br />
115<br />
<strong>Chapter</strong> 2: coastal bend (n) region summary
2 Summary of<br />
Llano Estacado (O) Region<br />
The Llano Estacado <strong>Regional</strong> <strong>Water</strong> Planning<br />
Area encompasses 21 counties in the<br />
southern High Plains of <strong>Texas</strong>.<br />
The Llano Estacado <strong>Regional</strong> <strong>Water</strong> Planning Area encompasses 21 counties in the southern High Plains of <strong>Texas</strong><br />
(Figure O.1). The region lies within the upstream parts of four major river basins (Canadian, Red, Brazos, and<br />
Colorado). Groundwater from the Ogallala Aquifer is the region’s primary source of water and is used at a rate<br />
that exceeds recharge. The largest economic sectors in the region are livestock and crop operations, producing<br />
about 60 percent of the state’s total cotton crop. Major cities in the region include Lubbock, Plainview, Levelland,<br />
Lamesa, Hereford, and Brownfield. The 2011 Region O <strong>Regional</strong> <strong>Water</strong> Plan can be found on the TWDB Web site<br />
at https://www.twdb.state.tx.us/wrpi/rwp/3rdRound/2011_RWP/RegionO/.<br />
PLAN HIGHLIGHTS<br />
• Additional supply needed in 2060—2,366,036 acre-feet per year<br />
• Recommended water management strategy volume in 2060—395,957 acre-feet per year<br />
• Total capital cost—$1.1 billion<br />
• Conservation accounts for 74 percent of 2060 strategy volumes<br />
• Two new major reservoirs (Jim Bertram Lake 07, Post)<br />
• Significant unmet irrigation and livestock needs<br />
116<br />
<strong>Chapter</strong> 2: llano estacado (0) region summary<br />
WAT E R FOR TEXAS 2012 STATE WATER PLAN
FIGURE O.1. LLANO ESTACADO (O) REGIONAL WATER PLANNING AREA.<br />
Deaf Smith<br />
Prairie Dog Town Fork<br />
of the Red River<br />
Parmer<br />
Castro<br />
Swisher<br />
Briscoe<br />
Bailey<br />
Lamb<br />
Hale<br />
Floyd<br />
Motley<br />
Cochran<br />
Hockley<br />
Lubbock<br />
Crosby<br />
Dickens<br />
Region O<br />
Yoakum<br />
Terry<br />
Lynn<br />
Garza<br />
Major Rivers<br />
Cities<br />
Existing Reservoirs<br />
Ogallala Aquifer<br />
Seymour Aquifer<br />
Gaines<br />
Dawson<br />
Colorado River<br />
Blaine Aquifer*<br />
Dockum Aquifer*<br />
Edwards - Trinity (High Plains) Aquifer*<br />
Region O<br />
Major Rivers<br />
Cities<br />
Existing Reservoirs<br />
* Minor aquifer (only shown where there is no major aquifer)<br />
Ogallala Aquifer<br />
Seymour Aquifer<br />
Blaine Aquifer*<br />
Dockum Aquifer*<br />
Edwards - Trinity (High Plains) Aquifer*<br />
* Minor aquifer (only shown where there is no major aquifer)<br />
WAT E R FOR TEXAS 2012 STATE WATER PLAN<br />
117<br />
<strong>Chapter</strong> 2: llano estacado (0) region summary
POPULATION AND WATER DEMANDS<br />
Approximately 2 percent of the state’s total population resided in the Llano Estacado Region in 2010, and by the<br />
year 2060 is projected to increase 12 percent (Table O.1). The region’s water demands, however, will decrease. By<br />
2060, the total water demands for the region are projected to decrease 15 percent because of declining irrigation<br />
water demands (Table O.1). Irrigation demand is projected to decline 17 percent by 2060 due to declining well<br />
yields and increased irrigation efficiencies. Municipal water use, however, increases 7 percent by 2060 (Table<br />
O.1, Figure O.2).<br />
EXISTING WATER SUPPLIES<br />
The Llano Estacado Planning Region depends primarily upon groundwater from the Ogallala Aquifer, with 97<br />
percent of the region’s supply in 2010 coming from this source. Approximately 94 percent of the water obtained<br />
from the aquifer is used for irrigation purposes. Other aquifers in the region (Seymour, Dockum, and Edwards-<br />
Trinity [High Plains]) constitute less than 1 percent of the supply. Surface water is supplied by White River<br />
Lake and Lake Meredith. Of these reservoirs, Lake Meredith, operated by the Canadian River Municipal <strong>Water</strong><br />
Authority in the Panhandle Region, is the largest contributor. By 2060, the total surface water and groundwater<br />
supply is projected to decline 56 percent (Table O.1, Figure O.2). This projected decline in water supply is due to<br />
the managed depletion of the Ogallala Aquifer.<br />
NEEDS<br />
During times of drought, increased demands require pumping that exceeds the capacity of the Ogallala Aquifer,<br />
resulting in water needs occurring across the region as early as 2010. The needs for the Llano Estacado Region<br />
are projected to increase 86 percent by 2060 (Table O.1, Figure O.2). The plan identifies needs for irrigation of<br />
1,264,707 acre-feet in 2010 and 2,318,004 acre-feet in 2060. Municipal needs also increase significantly, to 30,458<br />
acre-feet in 2060.<br />
RECOMMENDED WATER MANAGEMENT STRATEGIES AND COST<br />
The Llano Estacado Planning Group recommended a variety of water management strategies, providing<br />
395,957 acre-feet of additional water supply by the year 2060 (Figures O.3 and O.4) at a total capital cost of $1.1<br />
billion (Appendix A). The primary recommended water management strategy for the region is irrigation water<br />
conservation, which generates 72 percent of the volume of water from strategies in 2060, based on approximately<br />
786,000 acres of irrigated crop land that did not have efficient irrigation systems. Unmet irrigation needs<br />
(2,043,247 acre-feet) remain in 21 counties in the region in 2060, because there were no economically feasible<br />
strategies identified to meet their needs.<br />
118<br />
<strong>Chapter</strong> 2: llano estacado (0) region summary<br />
WAT E R FOR TEXAS 2012 STATE WATER PLAN
TABLE O.1. POPULATION, WATER SUPPLY, DEMAND, AND NEEDS 2010–2060<br />
Projected Population<br />
2010 2020 2030 2040 2050 2060<br />
492,627 521,930 540,908 552,188 553,691 551,758<br />
Existing Supplies (acre-feet per year)<br />
Surface water 28,261 33,707 33,590 33,490 32,096 32,042<br />
Groundwater 3,076,297 2,454,665 1,966,463 1,577,083 1,412,889 1,337,017<br />
Reuse 51,514 35,071 35,822 36,737 37,853 39,213<br />
Total <strong>Water</strong> Supplies 3,156,072 2,523,443 2,035,875 1,647,310 1,482,838 1,408,272<br />
Demands (acre-feet per year)<br />
Municipal 87,488 91,053 92,823 93,459 93,458 93,935<br />
County-other 11,949 12,420 12,652 12,583 12,399 12,005<br />
Manufacturing 15,698 16,669 17,460 18,216 18,865 19,919<br />
Mining 16,324 10,280 6,359 2,852 728 258<br />
Irrigation 4,186,018 4,024,942 3,882,780 3,740,678 3,604,568 3,474,163<br />
Steam-electric 25,645 25,821 30,188 35,511 42,000 49,910<br />
Livestock 51,296 57,740 61,372 65,277 69,466 73,965<br />
Total <strong>Water</strong> Demands 4,394,418 4,238,925 4,103,634 3,968,576 3,841,484 3,724,155<br />
Needs (acre-feet per year)<br />
Municipal 10,349 14,247 20,116 23,771 28,489 30,458<br />
Irrigation 1,264,707 1,735,399 2,084,569 2,331,719 2,361,813 2,318,004<br />
Livestock 1 763 3,191 9,506 14,708 17,574<br />
Total <strong>Water</strong> Needs 1,275,057 1,750,409 2,107,876 2,364,996 2,405,010 2,366,036<br />
O<br />
FIGURE O.2. 2060 LLANO ESTACADO (O) EXISTING SUPPLIES, PROJECTED DEMANDS, AND<br />
IDENTIFIED WATER NEEDS BY WATER USE CATEGORY (ACRE-FEET PER YEAR).<br />
4,000,000<br />
3,500,000<br />
3,000,000<br />
2,500,000<br />
Existing <strong>Water</strong> Supplies<br />
Projected <strong>Water</strong> Demands<br />
Identified <strong>Water</strong> Needs<br />
2,000,000<br />
O-2<br />
1,500,000<br />
1,000,000<br />
500,000<br />
0<br />
MUNICIPAL MANUFACTURING MINING IRRIGATION STEAM-ELECTRIC LIVESTOCK<br />
WAT E R FOR TEXAS 2012 STATE WATER PLAN<br />
119<br />
<strong>Chapter</strong> 2: llano estacado (0) region summary
CONSERVATION RECOMMENDATIONS<br />
Conservation strategies represent 74 percent of the total volume of water associated with all recommended<br />
water management strategies in 2060. <strong>Water</strong> conservation was recommended for every municipal water user<br />
group that had both a need and a water use greater than 172 gallons per capita per day (the regional average).<br />
SELECT MAJOR WATER MANAGEMENT STRATEGIES<br />
• Irrigation <strong>Water</strong> Conservation would provide up to 479,466 acre-feet per year of water in 2010 with a capital<br />
cost of $346 million.<br />
• Lake Alan Henry Pipeline for the City of Lubbock would provide 21,880 acre-feet per year of water starting<br />
in 2010 with a capital cost of $294 million.<br />
• Post Reservoir would provide 25,720 acre-feet per year of water starting in 2030 with a capital cost of $110<br />
million.<br />
REGION-SPECIFIC STUDIES<br />
The Llano Estacado <strong>Regional</strong> <strong>Water</strong> Planning Group developed three region-specific studies during the initial<br />
phase of the third planning cycle. The final reports documenting the findings can be found on the TWDB Web<br />
site at https://www.twdb.state.tx.us/wrpi/rwp/rwp_study.asp#o.<br />
• Estimates of Population and <strong>Water</strong> Demands for New Ethanol and Expanding Dairies<br />
• Evaluation of <strong>Water</strong> Supplies and Desalination Costs of Dockum Aquifer <strong>Water</strong><br />
• Video Conferencing Facilities Available for Coordination between Region A and O<br />
LLANO ESTACADO PLANNING GROUP MEMBERS AND INTERESTS REPRESENTED<br />
Voting members during adoption of the 2011 <strong>Regional</strong> <strong>Water</strong> Plan:<br />
Harold P. “Bo” Brown, (Chair), agriculture; Melanie Barnes, public; Delaine Baucum, agriculture; Alan Bayer,<br />
counties; Bruce Blalack, municipalities; Jim Conkwright, water districts; Delmon Ellison, Jr., agriculture; Harvey<br />
Everheart, water districts; Bill Harbin, electric generating utilities; Doug Hutcheson, water utilities ; Bob<br />
Josserand, municipalities; Mark Kirkpatrick, agriculture; Richard Leonard, agriculture; Michael McClendon,<br />
river authorities; Don McElroy, small business; E.W. (Gene) Montgomery, industries; Ken Rainwater, public;<br />
Kent Satterwhite, river authorities; Aubrey Spear, municipalities; Jim Steiert, environmental; John Taylor,<br />
municipalities<br />
Former voting members during the 2006 – 2011 planning cycle:<br />
Tom Adams, municipalities; Jim Barron, counties; Don Ethridge, agriculture; Wayne Collins, municipalities;<br />
Terry Lopas, river authorities; Jared Miller, municipalities<br />
120<br />
<strong>Chapter</strong> 2: llano estacado (0) region summary<br />
WAT E R FOR TEXAS 2012 STATE WATER PLAN
FIGURE O.3. RECOMMENDED WATER MANAGEMENT STRATEGY WATER SUPPLY VOLUMES FOR<br />
2010–2060 (ACRE-FEET PER YEAR).<br />
2,500,000<br />
2,000,000<br />
1,500,000<br />
1,000,000<br />
Other Surface <strong>Water</strong><br />
New Major Reservoir<br />
Groundwater Desalination<br />
Reuse<br />
Groundwater<br />
Irrigation Conservation<br />
Municipal Conservation<br />
Total <strong>Water</strong> Needs<br />
O<br />
500,000<br />
0<br />
2010 2020 2030 2040 2050 2060<br />
FIGURE O.4. 2060 RECOMMENDED WATER MANAGEMENT STRATEGIES–RELATIVE SHARE OF SUPPLY.<br />
New Major Reservoir<br />
11.0%<br />
Other Surface <strong>Water</strong><br />
6.5%<br />
Irrigation Conservation<br />
71.5%<br />
Groundwater<br />
7.0%<br />
Reuse<br />
0.6%<br />
O-4<br />
Groundwater Desalination<br />
0.8%<br />
Municipal Conservation<br />
2.6%<br />
WAT E R FOR TEXAS 2012 STATE WATER PLAN<br />
121<br />
<strong>Chapter</strong> 2: llano estacado (0) region summary
2 Summary of<br />
Lavaca (P) Region<br />
The Lavaca <strong>Regional</strong> <strong>Water</strong> Planning Area is<br />
composed of Jackson and Lavaca counties<br />
and Precinct Three of Wharton County,<br />
including the entire City of El Campo.<br />
The Lavaca <strong>Regional</strong> <strong>Water</strong> Planning Area is composed of Jackson and Lavaca counties and Precinct Three of<br />
Wharton County, including the entire City of El Campo (Figure P.1). Other cities in the region include Edna,<br />
Yoakum, and Hallettsville. Most of the region lies in the Lavaca River Basin, with the Lavaca and Navidad Rivers<br />
being its primary source of surface water. Groundwater from the Gulf Coast Aquifer supplies most of the water<br />
for the planning area. The largest economic sector in the region is agribusiness, while manufacturing, oil and<br />
gas production, and mineral production also contribute to the region’s economy. The 2011 Lavaca (P) <strong>Regional</strong><br />
<strong>Water</strong> Plan can be found on the TWDB Web site at https://www.twdb.state.tx.us/wrpi/rwp/3rdRound/2011_<br />
RWP/RegionP/.<br />
PLAN HIGHLIGHTS<br />
• Additional supply needed in 2060—67,739 acre-feet per year<br />
• Recommended water management strategy volume in 2060—67,739 acre-feet per year<br />
• Total capital cost—none<br />
122<br />
<strong>Chapter</strong> 2: lavaca (p) region summary<br />
WAT E R FOR TEXAS 2012 STATE WATER PLAN
FIGURE P.1. LAVACA REGIONAL WATER PLANNING AREA.<br />
Lavaca River<br />
Lavaca<br />
Wharton<br />
Jackson<br />
Region P<br />
Major Rivers<br />
Region P<br />
Cities<br />
Major Rivers Existing Reservoirs<br />
Cities Gulf Coast Aquifer<br />
Existing Reservoirs<br />
Gulf Coast Aquifer<br />
WAT E R FOR TEXAS 2012 STATE WATER PLAN<br />
123<br />
<strong>Chapter</strong> 2: lavaca (p) region summary
POPULATION AND WATER DEMANDS<br />
In 2010, less than 1 percent of the state’s total population resided in the Lavaca Region, and between 2010 and<br />
2060, population is projected to increase by less than 1 percent (Table P.1). The region’s total water demand is<br />
projected to increase by less than 1 percent, and agricultural irrigation demand will remain constant (Table P.1).<br />
By the year 2060, municipal demand is expected to increase by 5 percent and manufacturing demand is expected<br />
to increase by 31 percent, while county-other demands are expected to decrease by 24 percent (Table P.1, Figure<br />
P.2).<br />
EXISTING WATER SUPPLIES<br />
The region relies on the Gulf Coast Aquifer for groundwater supply, which is 99 percent of the total water supply<br />
in 2010. The principal surface water supply is Lake Texana, the only reservoir in the region. The total surface<br />
water and groundwater supply is projected to remain constant from 2010 to 2060 at 164,148 acre-feet (Table P.1,<br />
Figure P.2).<br />
NEEDS<br />
Irrigation is the only water use sector in the Lavaca Region anticipated to need additional water over the planning<br />
horizon (Table P.1, Figure P.2.). In each decade, 67,739 acre-feet of additional water is expected to be needed,<br />
when surface water supplies become unavailable due to drought conditions.<br />
RECOMMENDED WATER MANAGEMENT STRATEGIES AND COST<br />
The Lavaca Planning Group analyzed various strategies to meet needs, but the only one determined to be<br />
economically feasible was temporarily overdrafting the Gulf Coast Aquifer to provide additional irrigation water<br />
during drought. This strategy produces 67,739 acre-feet of water which is sufficient to meet the region’s needs<br />
(Figures P.3 and P.4). There is no capital cost associated with this strategy because all necessary infrastructure is<br />
assumed to already be in place (Appendix A).<br />
CONSERVATION RECOMMENDATIONS<br />
<strong>Water</strong> conservation was not recommended as a strategy because it was not the most cost-effective method to<br />
meet irrigation needs, which are the only needs in the region. Since there were no municipal needs, no municipal<br />
conservation was recommended. However, the planning group did recommend that all municipal water user<br />
groups implement water conservation measures. The Lavaca Planning Group also recommended continued<br />
agricultural water conservation practices as one of its policy recommendations. The region supports state and<br />
federal programs that provide financial and technical assistance to agricultural producers and result in increased<br />
irrigation efficiency and overall water conservation.<br />
124<br />
<strong>Chapter</strong> 2: lavaca (p) region summary<br />
WAT E R FOR TEXAS 2012 STATE WATER PLAN
TABLE P.1. POPULATION, WATER SUPPLY, DEMAND, AND NEEDS 2010–2060<br />
Projected Population<br />
2010 2020 2030 2040 2050 2060<br />
49,491 51,419 52,138 51,940 51,044 49,663<br />
Existing Supplies (acre-feet per year)<br />
Surface water 1,832 1,832 1,832 1,832 1,832 1,832<br />
Groundwater 162,316 162,316 162,316 162,316 162,316 162,316<br />
Total <strong>Water</strong> Supplies 164,148 164,148 164,148 164,148 164,148 164,148<br />
Demands (acre-feet per year)<br />
Municipal 4,841 4,927 4,975 4,996 5,032 5,092<br />
County-other 2,374 2,378 2,283 2,119 1,957 1,800<br />
Manufacturing 1,089 1,162 1,223 1,281 1,331 1,425<br />
Mining 164 172 177 182 188 192<br />
Irrigation 217,846 217,846 217,846 217,846 217,846 217,846<br />
Livestock 3,499 3,499 3,499 3,499 3,499 3,499<br />
Total <strong>Water</strong> Demands 229,813 229,984 230,003 229,923 229,853 229,854<br />
Needs (acre-feet per year)<br />
Irrigation 67,739 67,739 67,739 67,739 67,739 67,739<br />
Total <strong>Water</strong> Needs 67,739 67,739 67,739 67,739 67,739 67,739<br />
P<br />
FIGURE P.2. 2060 LAVACA (P) EXISTING SUPPLIES, PROJECTED DEMANDS, AND IDENTIFIED WATER<br />
NEEDS BY WATER USE CATEGORY (ACRE-FEET PER YEAR).<br />
250,000<br />
200,000<br />
150,000<br />
Existing <strong>Water</strong> Supplies<br />
Projected <strong>Water</strong> Demands<br />
Identified <strong>Water</strong> Needs<br />
P-2<br />
100,000<br />
50,000<br />
0<br />
MUNICIPAL MANUFACTURING MINING IRRIGATION LIVESTOCK<br />
WAT E R FOR TEXAS 2012 STATE WATER PLAN<br />
125<br />
<strong>Chapter</strong> 2: lavaca (p) region summary
SELECT MAJOR WATER MANAGEMENT STRATEGIES<br />
• Conjunctive Use of Groundwater (temporary overdraft) will provide 67,739 acre-feet of water starting in the<br />
year 2010 with no capital cost determined since it was assumed that all infrastructure was already in place.<br />
REGION-SPECIFIC STUDY<br />
The Lavaca <strong>Regional</strong> <strong>Water</strong> Planning Group developed a region-specific study during the initial phase of the<br />
third planning cycle. The final report documenting the findings can be found on the TWDB Web site at https://<br />
www.twdb.state.tx.us/wrpi/rwp/rwp_study.asp#p.<br />
• Agricultural <strong>Water</strong> Demands Analysis<br />
LAVACA PLANNING GROUP MEMBERS AND INTERESTS REPRESENTED<br />
Voting members during adoption of the 2011 <strong>Regional</strong> <strong>Water</strong> Plan:<br />
Harrison Stafford, II (Chair), counties; Calvin Bonzer, small business; Tommy Brandenberger, industries;<br />
Patrick Brzozowski, river authorities; John Butschek, municipalities; Gerald Clark, agriculture; Roy Griffin,<br />
electric generating utilities; Lester Little, agriculture; Jack Maloney, municipalities; Phillip Miller, counties;<br />
Richard Otis, industries; Edward Pustka, public; L.G. Raun, agriculture; Dean Schmidt, agriculture; Robert<br />
Shoemate, environmental; Michael Skalicky, water districts; David Wagner, counties; Larry Waits, agriculture;<br />
Ed Weinheimer, small business<br />
Former voting members during the 2006 – 2011 planning cycle:<br />
Pat Hertz, water utilities; Judge Ronald Leck, counties; Paul Morkovsky, industries; Wayne Popp, water districts;<br />
Dean Schmidt, agriculture; Bob Weiss, public<br />
126<br />
<strong>Chapter</strong> 2: lavaca (p) region summary<br />
WAT E R FOR TEXAS 2012 STATE WATER PLAN
FIGURE P.3. RECOMMENDED WATER MANAGEMENT STRATEGY WATER SUPPLY VOLUMES FOR<br />
2010–2060 (ACRE-FEET PER YEAR).<br />
80,000<br />
70,000<br />
60,000<br />
50,000<br />
40,000<br />
30,000<br />
Groundwater<br />
Total <strong>Water</strong> Needs<br />
P3<br />
20,000<br />
10,000<br />
0<br />
2010 2020 2030 2040 2050 2060<br />
FIGURE P.4. 2060 RECOMMENDED WATER MANAGEMENT STRATEGIES–RELATIVE SHARE OF SUPPLY.<br />
P-4 Groundwater<br />
100%<br />
WAT E R FOR TEXAS 2012 STATE WATER PLAN<br />
127<br />
<strong>Chapter</strong> 2: lavaca (p) region summary


