Report 374 Aquifers of the Upper Coastal Plains of Texas
Report 374 Aquifers of the Upper Coastal Plains of Texas
Report 374 Aquifers of the Upper Coastal Plains of Texas

You also want an ePaper? Increase the reach of your titles
YUMPU automatically turns print PDFs into web optimized ePapers that Google loves.
aquifers <strong>of</strong> <strong>the</strong><br />
upper coastal<br />
plains<br />
<strong>of</strong> texas<br />
<strong>Report</strong> <strong>374</strong><br />
edited by<br />
William R. Hutchison<br />
Sarah C. Davidson<br />
Brenner J. Brown<br />
Robert E. Mace<br />
<strong>Texas</strong> Water Development Board<br />
P.O. Box 13231, Capitol Station<br />
Austin, <strong>Texas</strong> 78711-3231<br />
October 2009
<strong>Texas</strong> Water Development Board<br />
<strong>Report</strong> <strong>374</strong><br />
<strong>Aquifers</strong> <strong>of</strong> <strong>the</strong> <strong>Upper</strong> <strong>Coastal</strong><br />
<strong>Plains</strong> <strong>of</strong> <strong>Texas</strong><br />
edited by<br />
William R. Hutchison<br />
Sarah C. Davidson<br />
Brenner J. Brown<br />
Robert E. Mace<br />
October 2009
This page is intentionally blank.
<strong>Texas</strong> Water Development Board<br />
James E. Herring<br />
Chairman, Amarillo<br />
Jack Hunt<br />
Vice Chairman, Houston<br />
Joe M. Crutcher<br />
Member, Palestine<br />
Thomas Weir Labatt III<br />
Member, San Antonio<br />
Lewis H. McMahan<br />
Member, Dallas<br />
Edward G. Vaughan<br />
Member, Boerne<br />
J. Kevin Ward<br />
Executive Administrator<br />
The <strong>Texas</strong> Water Development Board freely grants permission to copy and distribute its materials. The agency<br />
would appreciate acknowledgment.<br />
Published and distributed by <strong>the</strong><br />
<strong>Texas</strong> Water Development Board<br />
P.O. Box 13231, Capitol Station<br />
Austin, <strong>Texas</strong> 78711-3231<br />
October 2009<br />
(Printed on recycled paper)
This page is intentionally blank.
Table <strong>of</strong> ConTenTs<br />
1. <strong>Aquifers</strong> <strong>of</strong> <strong>the</strong> <strong>Upper</strong> <strong>Coastal</strong> <strong>Plains</strong> .............................................................................................1<br />
Sarah C. Davidson, Brenner J. Brown, and Robert E. Mace<br />
2. Geology <strong>of</strong> <strong>the</strong> Carrizo-Wilcox Aquifer ..................................................................................... 17<br />
Peter G. George<br />
3. Hydrogeology <strong>of</strong> <strong>the</strong> Carrizo-Wilcox Aquifer ........................................................................... 35<br />
Neil E. Deeds, Dennis Fryar, Alan Dutton, and Jean-Philippe Nicot<br />
4. Ecology <strong>of</strong> <strong>the</strong> Carrizo-Wilcox Aquifer ...................................................................................... 61<br />
Chad W. Norris and Daniel R. Opdyke<br />
5. Hydrogeology <strong>of</strong> <strong>the</strong> Queen City and Sparta <strong>Aquifers</strong> with an Emphasis on<br />
Regional Mechanisms <strong>of</strong> Discharge ............................................................................................. 87<br />
Van Kelley, Dennis Fryar, and Neil E. Deeds<br />
6. Geology, Structure, and Depositional History <strong>of</strong> <strong>the</strong> Yegua-Jackson <strong>Aquifers</strong> ................ 117<br />
Paul Knox, Neil E. Deeds, Scott Hamlin, and Van Kelley<br />
7. Hydrogeologic Framework and Geospatial Data Compilation <strong>of</strong> <strong>the</strong><br />
Brazos River Alluvium Aquifer, Bosque County to Fort Bend County, <strong>Texas</strong> .................. 147<br />
Sachin D. Shah, Natalie A. Houston, and Christopher L. Braun<br />
8. Low-Flow Gain-Loss Study <strong>of</strong> <strong>the</strong> Colorado River in Bastrop County, <strong>Texas</strong> .................. 161<br />
Ge<strong>of</strong>frey P. Saunders<br />
9. Evaluation <strong>of</strong> <strong>the</strong> Brackish Groundwater Resources <strong>of</strong> <strong>the</strong> Wilcox Aquifer<br />
in <strong>the</strong> San Antonio, <strong>Texas</strong>, Area ................................................................................................. 167<br />
Charles W. Kreitler and Kevin H. Morrison<br />
10. SAWS: Twin Oaks Aquifer Storage and Recovery Project.................................................... 179<br />
Roberto Macias<br />
11. Groundwater Recharge in <strong>the</strong> Carrizo-Wilcox Aquifer ........................................................ 185<br />
Robert C. Reedy, Jean-Philippe Nicot, Bridget R. Scanlon, Neil E. Deeds,<br />
Van Kelley, and Robert E. Mace<br />
<strong>Texas</strong> Water Development Board <strong>Report</strong> <strong>374</strong><br />
v
vi <strong>Texas</strong> Water Development Board <strong>Report</strong> <strong>374</strong><br />
This page is intentionally blank.
Chapter 1<br />
<strong>Aquifers</strong> <strong>of</strong> <strong>the</strong> <strong>Upper</strong> <strong>Coastal</strong> <strong>Plains</strong><br />
Sarah C. Davidson 1 , Brenner J. Brown 1 , and Robert E. Mace, Ph. D., P.G. 1<br />
The <strong>Upper</strong> <strong>Coastal</strong> <strong>Plains</strong> region <strong>of</strong><br />
<strong>Texas</strong> is located directly to <strong>the</strong> north<br />
and west <strong>of</strong> <strong>the</strong> Gulf Coast region <strong>of</strong> <strong>the</strong><br />
state (Figure 1-1). The region stretches<br />
nor<strong>the</strong>ast from <strong>Texas</strong>’ border with<br />
Mexico, extending into Arkansas and<br />
Louisiana. The Carrizo-Wilcox Aquifer,<br />
one <strong>of</strong> <strong>the</strong> state’s major aquifers, is<br />
<strong>the</strong> principal aquifer and <strong>the</strong> primary<br />
source <strong>of</strong> groundwater throughout <strong>the</strong><br />
region. In addition, <strong>the</strong> Queen City,<br />
Sparta, Yegua-Jackson, and Brazos<br />
River Alluvium aquifers are important<br />
sources <strong>of</strong> groundwater for this region.<br />
Uses <strong>of</strong> groundwater vary throughout<br />
<strong>the</strong> region, with irrigation in <strong>the</strong> fertile<br />
Winter Garden area being <strong>the</strong> primary<br />
use in <strong>the</strong> sou<strong>the</strong>rn portion. Municipal<br />
use dominates in <strong>the</strong> high-growth<br />
central portion, which includes parts<br />
<strong>of</strong> <strong>the</strong> San Antonio, Austin, and College<br />
Station metropolitan areas. The nor<strong>the</strong>ast<br />
portion <strong>of</strong> <strong>the</strong> area has plentiful<br />
surface water, and <strong>the</strong> major concern<br />
for groundwater is water marketing.<br />
This range <strong>of</strong> water uses and availability<br />
within <strong>the</strong> <strong>Upper</strong> <strong>Coastal</strong> <strong>Plains</strong> led<br />
<strong>the</strong> <strong>Texas</strong> Water Development Board<br />
(TWDB) to split <strong>the</strong> region into separate<br />
groundwater management areas<br />
to facilitate joint planning in areas with<br />
common concerns.<br />
1.1<br />
Study area description<br />
For our purposes, <strong>the</strong> <strong>Upper</strong> <strong>Coastal</strong><br />
<strong>Plains</strong> region consists <strong>of</strong> <strong>the</strong> 79 counties<br />
that overlie <strong>the</strong> Carrizo-Wilcox, Yegua-<br />
Jackson, Sparta, Queen City, and Brazos<br />
River Alluvium aquifers. These counties<br />
are Anderson, Angelina, Atascosa, Austin,<br />
Bastrop, Bee, Bexar, Bosque, Bowie,<br />
Brazos, Burleson, Caldwell, Camp, Cass,<br />
Cherokee, DeWitt, Dimmit, Duval, Falls,<br />
Fayette, Fort Bend, Franklin, Freestone,<br />
Frio, Gonzales, Gregg, Grimes, Guadalupe,<br />
Harrison, Henderson, Hill, Hopkins,<br />
Houston, Jasper, Jim Hogg, Karnes,<br />
La Salle, Lavaca, Lee, Leon, Limestone,<br />
Live Oak, Madison, Marion, Maverick,<br />
McLennan, McMullen, Medina,<br />
Milam, Morris, Nacogdoches, Navarro,<br />
Newton, Panola, Polk, Rains, Red River,<br />
Robertson, Rusk, Sabine, San Augustine,<br />
Shelby, Smith, Starr, Titus, Trinity, Tyler,<br />
Upshur, Uvalde, Van Zandt, Walker,<br />
Waller, Washington, Webb, Williamson,<br />
Wilson, Wood, Zapata, and Zavala.<br />
The population in this area more<br />
than doubled between 1950 and 2000,<br />
increasing from 2.3 million residents to<br />
4.9 million (U.S. Census Bureau, 1952,<br />
2003). During this time, 14 <strong>of</strong> <strong>the</strong>se<br />
counties decreased in population, with<br />
Falls County showing <strong>the</strong> greatest loss, a<br />
decrease <strong>of</strong> 8,148 residents. Bexar County<br />
experienced <strong>the</strong> greatest population<br />
increase, with <strong>the</strong> addition <strong>of</strong> 892,471<br />
people, and Fort Bend County in <strong>the</strong><br />
Houston area increased over 11 times its<br />
1950 population, from 31,056 to 323,396.<br />
Between 1980 and 2004, groundwater<br />
use in <strong>the</strong> area was relatively stable, at<br />
approximately 1.2 million acre-feet per<br />
year (TWDB, 2009). In 2004, groundwater<br />
made up just over half <strong>of</strong> all water<br />
used in <strong>the</strong> region (Table 1-1). Total<br />
water used in 2004 was primarily for<br />
municipal supplies (41 percent), irrigation<br />
(26 percent), and manufacturing (16<br />
percent). Between 2000 and 2060, <strong>the</strong><br />
population <strong>of</strong> this area is expected to<br />
more than double again, reaching more<br />
than 10.5 million. Projections <strong>of</strong> water<br />
demand indicate that demand for water<br />
in <strong>the</strong> area will rise from 2.7 million acre-<br />
1 <strong>Texas</strong> Water Development Board<br />
<strong>Texas</strong> Water Development Board <strong>Report</strong> <strong>374</strong> 1
McMullen<br />
Red<br />
River<br />
Bowie<br />
San Antonio<br />
Austin<br />
Bosque<br />
Waco<br />
Williamson<br />
Caldwell<br />
Hill<br />
McLennan<br />
Bastrop<br />
Falls<br />
Milam<br />
College<br />
Station<br />
Burleson<br />
Lee<br />
Fayette<br />
Navarro<br />
Limestone<br />
Robertson<br />
Austin<br />
Henderson<br />
Anderson<br />
Freestone<br />
Brazos<br />
Leon<br />
Washington<br />
Madison<br />
Grimes<br />
Waller<br />
Franklin<br />
Hopkins<br />
Titus<br />
Cass<br />
Camp<br />
Rains<br />
Wood Upshur<br />
Marion<br />
Van<br />
Zandt Smith<br />
Harrison<br />
Houston<br />
Walker<br />
Tyler<br />
Cherokee<br />
Trinity<br />
Houston<br />
Morris<br />
Gregg<br />
Rusk<br />
Nacogdoches<br />
Angelina<br />
Polk<br />
Panola<br />
Shelby<br />
San<br />
Augustine<br />
Tyler<br />
Louisiana<br />
Jasper<br />
Sabine<br />
Newton<br />
Maverick<br />
Guadalupe<br />
Bexar<br />
Lavaca<br />
Uvalde Medina<br />
Wilson<br />
Dewitt<br />
Zavala Frio Atascosa Karnes<br />
Winter Garden area<br />
Gonzales<br />
Fort Bend<br />
Live Oak<br />
Dimmit<br />
LaSalle<br />
Bee<br />
Mexico<br />
Webb<br />
Laredo<br />
Duval<br />
N<br />
Zapata<br />
Jim<br />
Hogg<br />
Starr<br />
0 50 100 miles<br />
Figure 1-1. Location <strong>of</strong> <strong>the</strong> <strong>Upper</strong> Gulf Coast region, showing counties and areas <strong>of</strong> significant water use.<br />
2 <strong>Texas</strong> Water Development Board <strong>Report</strong> <strong>374</strong>
Table 1-1. Population and groundwater use for counties in <strong>the</strong> <strong>Upper</strong> Gulf Coast region for selected years.<br />
County<br />
Population<br />
Groundwater use<br />
1950 1980 1990 2000 1980 1990 2000 2004<br />
Percent<br />
groundwater<br />
in 2004*<br />
Anderson 31,875 38,381 48,024 55,109 6,066 6,557 7,879 6,427 50<br />
Angelina 36,032 64,172 69,884 80,130 33,152 26,886 26,457 18,860 79<br />
Atascosa 20,046 25,055 30,533 38,628 79,089 59,738 47,909 37,694 96<br />
Austin 14,663 17,726 19,832 23,590 12,948 12,999 13,004 11,156 88<br />
Bastrop 19,622 24,726 38,263 57,733 5,399 7,178 10,343 9,854 70<br />
Bee 18,174 26,030 25,135 32,359 6,190 5,065 5,257 6,201 60<br />
Bexar 500,460 988,971 1,185,395 1,392,931 252,748 269,505 269,433 261,420 91<br />
Bosque 11,836 13,401 15,125 17,204 3,100 3,813 4,290 5,400 70<br />
Bowie 61,966 75,301 81,665 89,306 4,434 5,029 2,231 5,533 24<br />
Brazos 38,390 93,588 121,862 152,415 24,751 36,239 37,020 42,590 97<br />
Burleson 13,000 12,313 13,625 16,470 8,099 8,975 17,918 23,358 77<br />
Caldwell 19,350 23,637 26,392 32,194 2,982 4,371 3,994 3,632 60<br />
Camp 8,740 9,275 9,904 11,549 1,928 1,853 1,500 1,718 60<br />
Cass 26,732 29,430 29,982 30,438 4,987 4,593 3,206 2,440 2<br />
Cherokee 38,694 38,127 41,049 46,659 6,369 6,526 7,333 5,380 68<br />
DeWitt 22,973 18,903 18,840 20,013 3,511 4,170 3,527 3,019 56<br />
Dimmit 10,654 11,367 10,433 10,248 23,263 9,592 8,286 5,627 78<br />
Duval 15,643 12,517 12,918 13,120 5,812 7,842 11,476 10,184 93<br />
Falls 26,724 17,946 17,712 18,576 4,216 5,889 2,732 3,386 37<br />
Fayette 24,176 18,832 20,095 21,804 4,061 3,719 4,519 3,356 16<br />
Fort Bend 31,056 130,962 225,421 354,452 74,113 91,373 102,899 76,107 50<br />
Franklin 6,257 6,893 7,802 9,458 1,216 1,583 1,838 833 20<br />
Freestone 15,696 14,830 15,818 17,867 2,409 2,500 3,289 2,645 30<br />
Frio 10,357 13,785 13,472 16,252 78,959 85,073 120,128 86,950 99<br />
Gonzales 21,164 16,949 17,205 18,628 4,226 4,660 5,932 5,111 42<br />
Gregg 61,258 99,495 104,948 111,379 4,294 2,475 3,435 2,933 13<br />
Grimes 15,135 13,580 18,828 23,552 2,662 3,750 4,675 4,749 49<br />
Guadalupe 25,392 46,708 64,873 89,023 4,626 6,566 6,562 12,115 43<br />
Harrison 47,745 52,265 57,483 62,110 3,924 3,202 3,438 3,133 8<br />
Henderson 23,405 42,606 58,543 73,277 4,246 5,042 5,980 5,870 42<br />
Hill 31,282 25,024 27,146 32,321 3,767 2,519 2,121 3,077 44<br />
Hopkins 23,490 25,247 28,833 31,960 2,639 3,835 4,126 3,191 28<br />
Houston 22,825 22,299 21,375 23,185 2,393 2,784 3,804 2,378 31<br />
Jasper 20,049 30,781 31,102 35,604 51,471 49,486 52,250 38,187 72<br />
Jim Hogg 5,389 5,168 5,109 5,281 1,065 828 1,749 1,364 73<br />
Karnes 17,139 13,593 12,455 15,446 3,233 4,610 3,900 2,460 65<br />
La Salle 7,485 5,514 5,254 5,866 11,938 7,529 5,698 5,489 91<br />
Lavaca 22,159 19,004 18,690 19,210 30,749 19,337 9,154 9,060 77<br />
Lee 10,144 10,952 12,854 15,657 2,856 3,719 4,477 4,622 80<br />
Leon 12,024 9,594 12,665 15,335 2,437 3,571 4,849 4,385 64<br />
Limestone 25,251 20,224 20,946 22,051 1,556 3,768 3,856 4,352 14<br />
Sources: U.S. Census Bureau, 1952, 2003; TWDB, 2009<br />
*Percent <strong>of</strong> total water use in 2004 that was groundwater.<br />
<strong>Texas</strong> Water Development Board <strong>Report</strong> <strong>374</strong> 3
Table 1-1 (continued).<br />
County<br />
Population Groundwater use Percent<br />
groundwater<br />
in<br />
1950 1980 1990 2000 1980 1990 2000 2004 2004*<br />
Live Oak 9,054 9,606 9,556 12,309 4,526 5,997 8,519 7,161 79<br />
Madison 7,996 10,649 10,931 12,940 2,199 2,672 3,180 2,611 79<br />
Marion 10,172 10,360 9,984 10,941 963 903 1,508 939 32<br />
Maverick 12,292 31,398 36,378 47,297 3,296 6,074 341 478 1<br />
McLennan 130,194 170,755 189,123 213,517 13,017 12,588 15,677 17,744 28<br />
McMullen 1,187 789 817 851 624 396 1,340 706 62<br />
Medina 17,013 23,164 27,312 39,304 79,266 83,509 50,906 40,763 70<br />
Milam 23,585 22,732 22,946 24,238 4,376 18,382 36,228 33,033 65<br />
Morris 9,433 14,629 13,200 13,048 1,406 7,490 1,139 863 1<br />
Nacogdoches 30,326 46,786 54,753 59,203 7,411 8,370 7,769 8,528 72<br />
Navarro 39,916 35,323 39,926 45,124 327 391 438 396 3<br />
Newton 10,832 13,254 13,569 15,072 2,850 3,486 2,494 2,366 82<br />
Panola 19,250 20,724 22,035 22,756 2,817 4,046 4,597 3,992 46<br />
Polk 16,194 24,407 30,687 41,133 4,306 4,434 4,626 4,969 68<br />
Rains 4,266 4,839 6,715 9,139 419 547 602 558 27<br />
Red River 21,851 16,101 14,317 14,314 2,324 1,763 2,011 1,825 22<br />
Robertson 19,908 14,653 15,511 16,000 20,613 21,364 22,452 27,074 72<br />
Rusk 42,348 41,382 43,735 47,372 7,584 8,419 7,988 6,622 39<br />
Sabine 8,568 8,702 9,586 10,469 1,061 1,030 1,019 1,075 36<br />
San<br />
Augustine<br />
8,837 8,785 7,999 8,946 864 651 914 830 30<br />
Shelby 23,479 23,084 22,034 25,224 2,780 2,447 3,400 2,428 28<br />
Smith 74,701 128,366 151,309 174,706 13,273 14,235 19,675 18,149 42<br />
Starr 13,948 27,266 40,518 53,597 677 1,515 1,481 949 6<br />
Titus 17,302 21,442 24,009 28,118 1,335 1,570 3,071 2,546 8<br />
Trinity 10,040 9,450 11,445 13,779 1,461 1,201 1,370 1,000 43<br />
Tyler 11,292 16,223 16,646 20,871 2,383 2,193 2,918 3,473 96<br />
Upshur 20,822 28,595 31,370 35,291 3,924 4,679 4,955 4,083 79<br />
Uvalde 16,015 22,441 23,340 25,926 81,196 144,522 66,083 71,246 99<br />
Van Zandt 22,593 31,426 37,944 48,140 6,322 5,303 5,014 5,141 50<br />
Walker 20,163 41,789 50,917 61,758 9,867 5,499 5,386 4,157 28<br />
Waller 11,961 19,798 23,389 32,663 30,692 32,645 27,526 29,551 97<br />
Washington 20,542 21,998 26,154 30,373 1,848 2,469 3,760 3,083 41<br />
Webb 56,141 99,258 133,239 193,117 857 1,158 1,460 1,770 4<br />
Williamson 38,853 76,521 139,551 249,967 13,214 16,842 17,820 20,108 34<br />
Wilson 14,672 16,756 22,650 32,408 9,663 15,898 21,611 18,608 90<br />
Wood 21,308 24,697 29,380 36,752 7,087 7,644 4,982 6,357 64<br />
Zapata 4,405 6,628 9,279 12,182 242 80 47 48 1<br />
Zavala 11,201 11,666 12,162 11,600 85,386 80,138 39,172 54,153 92<br />
Total 2,269,062 3,343,593 4,003,896 4,910,835 1,222,320 1,333,289 1,247,953 1,157,633 56<br />
Sources: U.S. Census Bureau, 1952, 2003; TWDB, 2009<br />
*Percent <strong>of</strong> total water use in 2004 that was groundwater.<br />
4 <strong>Texas</strong> Water Development Board <strong>Report</strong> <strong>374</strong>
24<br />
28<br />
20<br />
36<br />
36<br />
Figure 1-2. Average precipitation (in inches) in<br />
<strong>the</strong> <strong>Upper</strong> Gulf Coast region from 1971 to 2000<br />
(data from SCAS, 2004).<br />
76<br />
82<br />
32<br />
80<br />
36<br />
Figure 1-3. Average maximum daily temperature<br />
(in degrees Fahrenheit) in <strong>the</strong> <strong>Upper</strong> Gulf Coast<br />
region from 1971 to 2000 (data from SCAS,<br />
2004).<br />
feet in 2010 to 3.9 million acre-feet in<br />
2060, an increase <strong>of</strong> about 45 percent<br />
(TWDB, 2007).<br />
The <strong>Upper</strong> <strong>Coastal</strong> <strong>Plains</strong> is bounded<br />
to <strong>the</strong> west by <strong>the</strong> Balcones Escarpment<br />
and <strong>the</strong> Edwards and Trinity formations<br />
and to <strong>the</strong> east by <strong>the</strong> coastal plains and<br />
<strong>the</strong> Gulf Coast Aquifer. The climate in<br />
76<br />
40<br />
44<br />
74<br />
44<br />
48<br />
48<br />
N<br />
56<br />
60<br />
52<br />
0 50 100 miles<br />
78<br />
N<br />
0 50 100 miles<br />
<strong>the</strong> region ranges from subtropical and<br />
humid in <strong>the</strong> nor<strong>the</strong>ast to more arid subtropical<br />
steppe in <strong>the</strong> southwest (Larkin<br />
and Bomar, 1983). Average annual rainfall<br />
ranges from less than 20 inches in<br />
<strong>the</strong> southwest to over 60 inches in <strong>the</strong><br />
nor<strong>the</strong>ast, and <strong>the</strong> average maximum<br />
daily temperature ranges from about<br />
73°F in <strong>the</strong> nor<strong>the</strong>ast to over 82°F in <strong>the</strong><br />
southwest (Figures 1-2 and 1-3; SCAS,<br />
2004). Of <strong>the</strong> 16 major rivers <strong>of</strong> <strong>the</strong><br />
state recognized by <strong>the</strong> TWDB, 14 flow<br />
over at least part <strong>of</strong> <strong>the</strong> Carrizo-Wilcox<br />
Aquifer (Figure 1-4). These rivers flow<br />
generally to <strong>the</strong> sou<strong>the</strong>ast, toward <strong>the</strong><br />
Gulf <strong>of</strong> Mexico and perpendicular to <strong>the</strong><br />
geologic formations that make up most<br />
<strong>of</strong> <strong>the</strong> aquifers in <strong>the</strong> region.<br />
1.2<br />
<strong>Aquifers</strong> <strong>of</strong> <strong>the</strong> <strong>Upper</strong><br />
<strong>Coastal</strong> <strong>Plains</strong><br />
The <strong>Upper</strong> <strong>Coastal</strong> <strong>Plains</strong> region<br />
includes <strong>the</strong> Carrizo-Wilcox, Queen<br />
City, Sparta, Yegua-Jackson, and Brazos<br />
River Alluvium aquifers (Figure 1-5). In<br />
addition to defining <strong>the</strong> boundaries <strong>of</strong><br />
<strong>the</strong>se aquifers, TWDB has designated<br />
<strong>the</strong>m as major or minor aquifers based<br />
on overall area covered or amount <strong>of</strong><br />
water held. The Carrizo-Wilcox is <strong>the</strong><br />
only major aquifer in <strong>the</strong> area; <strong>the</strong> o<strong>the</strong>rs<br />
are classified as minor aquifers. In<br />
addition to <strong>the</strong>se aquifers, <strong>the</strong>re are<br />
o<strong>the</strong>r water-bearing geologic formations<br />
that produce water on <strong>the</strong> local<br />
level.<br />
With <strong>the</strong> exception <strong>of</strong> <strong>the</strong> Brazos<br />
River Alluvium Aquifer, <strong>the</strong>se aquifers<br />
run subparallel to <strong>the</strong> Gulf <strong>of</strong> Mexico<br />
about 100–200 miles inland from <strong>the</strong><br />
coast and are composed <strong>of</strong> aquifer formations<br />
that tend to thicken and dip<br />
to <strong>the</strong> south and sou<strong>the</strong>ast, forming a<br />
layered wedge <strong>of</strong> sediments. All <strong>of</strong> <strong>the</strong><br />
aquifers are composed mostly <strong>of</strong> sediments<br />
originally deposited in and along<br />
rivers and deltas. The Brazos River Alluvium<br />
Aquifer and <strong>the</strong> outcrop areas <strong>of</strong><br />
<strong>the</strong> o<strong>the</strong>r aquifers are generally unconfined,<br />
and downdip parts <strong>of</strong> aquifers that<br />
<strong>Texas</strong> Water Development Board <strong>Report</strong> <strong>374</strong> 5
Colorado<br />
Sulphur<br />
Red<br />
Red<br />
Sabine<br />
Cypress<br />
Trinity Trinity<br />
Neches Neches<br />
Brazos Brazos<br />
San Jacinto<br />
Guadalupe<br />
Lavaca Lavaca<br />
Medina<br />
San San Antonio Antonio<br />
Nueces Nueces<br />
River basin boundaries<br />
N<br />
Rio Rio Grande Grande<br />
0 50 100 miles<br />
Figure 1-4. Location <strong>of</strong> major rivers and river basin boundaries in <strong>the</strong> <strong>Upper</strong> Gulf Coast region.<br />
underlie younger formations are generally<br />
confined. Regional water flow in <strong>the</strong><br />
aquifers is to <strong>the</strong> south and sou<strong>the</strong>ast.<br />
The amount <strong>of</strong> water withdrawn from<br />
<strong>the</strong>se aquifers annually since 1980 has<br />
varied, ranging from 390,000 acre-feet in<br />
1987 to 607,000 acre-feet in 2002 (Figure<br />
1-6; TWDB, 2009). The Carrizo-Wilcox<br />
is by far <strong>the</strong> largest source <strong>of</strong> groundwater<br />
in <strong>the</strong> region, accounting for about<br />
90 percent <strong>of</strong> <strong>the</strong>se withdrawals. The<br />
water is used primarily for irrigation and<br />
municipal supplies.<br />
Groundwater studies have focused<br />
primarily on <strong>the</strong> Carrizo-Wilcox Aquifer,<br />
but each <strong>of</strong> <strong>the</strong> minor aquifers has been<br />
6 <strong>Texas</strong> Water Development Board <strong>Report</strong> <strong>374</strong>
Brazos River Alluvium (outcrop)<br />
Yegua-Jackson (subcrop)<br />
Sparta (outcrop)<br />
Sparta (subcrop)<br />
Queen City (outcrop)<br />
Queen City (subcrop)<br />
Carrizo-Wilcox (outcrop)<br />
Carrizo-Wilcox (subcrop)<br />
Outcrop indicates <strong>the</strong> part <strong>of</strong> an aquifer<br />
that lies at <strong>the</strong> land surface.<br />
Subcrop indicates <strong>the</strong> part <strong>of</strong> an aquifer<br />
that lies or dips below o<strong>the</strong>r formations.<br />
N<br />
0 50 100 miles<br />
Figure 1-5. Location <strong>of</strong> major and minor aquifers recognized by TWDB and discussed in this report.<br />
studied as well. Below are brief descriptions<br />
<strong>of</strong> <strong>the</strong> aquifers <strong>of</strong> <strong>the</strong> <strong>Upper</strong> <strong>Coastal</strong><br />
<strong>Plains</strong>; more thorough information will<br />
be found throughout this report.<br />
1.3<br />
Carrizo-Wilcox Aquifer<br />
The Carrizo-Wilcox Aquifer extends<br />
across <strong>Texas</strong>, stretching from Mexico<br />
across <strong>the</strong> Rio Grande and nor<strong>the</strong>ast<br />
into Arkansas and Louisiana. This aquifer<br />
lies beneath all or parts <strong>of</strong> Anderson,<br />
Angelina, Atascosa, Bastrop, Bee, Bexar,<br />
Bowie, Brazos, Burleson, Caldwell,<br />
Camp, Cass, Cherokee, DeWitt, Dimmit,<br />
Duval, Falls, Fayette, Franklin, Freestone,<br />
Frio, Gonzales, Gregg, Grimes,<br />
Guadalupe, Harrison, Henderson,<br />
Hopkins, Houston, Jim Hogg, Karnes,<br />
La Salle, Lavaca, Lee, Leon, Limestone,<br />
<strong>Texas</strong> Water Development Board <strong>Report</strong> <strong>374</strong> 7
700<br />
Thousands <strong>of</strong> acre-feet<br />
600<br />
500<br />
400<br />
300<br />
200<br />
522<br />
548<br />
466<br />
421<br />
390<br />
497<br />
545<br />
519 512<br />
483 495<br />
542 556 558 467<br />
547<br />
499<br />
544<br />
513<br />
607<br />
505 Steam electric<br />
Mining<br />
Livestock<br />
Manufacturing<br />
Municipal<br />
100<br />
Irrigation<br />
0<br />
1980<br />
1984<br />
1985<br />
1986<br />
1987<br />
1988<br />
1989<br />
1990<br />
1991<br />
1992<br />
1993<br />
1994<br />
1995<br />
1996<br />
1997<br />
1998<br />
1999<br />
2000<br />
2001<br />
2002<br />
2003<br />
Figure 1-6. Estimated annual groundwater withdrawals from <strong>the</strong> Brazos River Alluvium, Carrizo-Wilcox,<br />
Queen City, and Sparta aquifers by type <strong>of</strong> use. Estimates are not available for <strong>the</strong> years 1981–1983 or for<br />
<strong>the</strong> Yegua-Jackson Aquifer.<br />
Live Oak, Madison, Marion, Maverick,<br />
McClennan, McMullen, Medina,<br />
Milam, Morris, Nacogdoches, Navarro,<br />
Panola, Rains, Red River, Robertson,<br />
Rusk, Sabine, San Augustine, Shelby,<br />
Smith, Starr, Titus, Trinity, Upshur,<br />
Uvalde, Van Zandt, Walker, Webb, Williamson,<br />
Wilson, Wood, Zapata, and<br />
Zavala counties.<br />
The aquifer is made up <strong>of</strong> <strong>the</strong> Wilcox<br />
Group and Carrizo Formation, which<br />
are sedimentary deposits primarily <strong>of</strong><br />
sand, along with interbedded layers <strong>of</strong><br />
gravel, silt, clay, shale, and lignite that<br />
were deposited during <strong>the</strong> upper Paleocene-lower<br />
Eocene. It is separated from<br />
<strong>the</strong> overlying Queen City Aquifer by <strong>the</strong><br />
relatively impermeable Reklaw Formation.<br />
The aquifer has a maximum thickness<br />
<strong>of</strong> more than 3,000 feet, and <strong>the</strong><br />
thickness <strong>of</strong> sands saturated with fresh<br />
water averages about 700 feet. Water<br />
from <strong>the</strong> aquifer is commonly hard but<br />
fresh in and near outcrop areas, containing<br />
less than 500 milligrams per liter <strong>of</strong><br />
total dissolved solids. Higher concentrations<br />
<strong>of</strong> total dissolved solids, rarely<br />
exceeding 3,000 milligrams per liter,<br />
are more common at depth and in <strong>the</strong><br />
central and southwestern parts <strong>of</strong> <strong>the</strong><br />
aquifer. Localized areas <strong>of</strong> high iron content<br />
are found throughout <strong>the</strong> aquifer,<br />
particularly in <strong>the</strong> nor<strong>the</strong>ast (Rogers,<br />
1967; William F. Guyton and Associates,<br />
1972; Klemt and o<strong>the</strong>rs, 1976; Preston and<br />
Moore, 1991; Thorkildsen and Price, 1991;<br />
Beynon, 1992; Ashworth and Hopkins,<br />
1995; TWDB, 2007; Boghici, 2009).<br />
The Carrizo-Wilcox Aquifer is one<br />
<strong>of</strong> <strong>the</strong> most productive aquifers in<br />
<strong>Texas</strong>. Groundwater production from<br />
<strong>the</strong> Carrizo-Wilcox is predominately for<br />
irrigation and municipal water supplies.<br />
Irrigation pumping from <strong>the</strong> aquifer is<br />
greatest in <strong>the</strong> Winter Garden region<br />
in South <strong>Texas</strong>, and <strong>the</strong> largest areas <strong>of</strong><br />
municipal use are in <strong>the</strong> Bryan-College<br />
Station, Lufkin-Nacogdoches, and Tyler<br />
areas. In addition, a significant volume<br />
<strong>of</strong> groundwater in <strong>the</strong> central part <strong>of</strong><br />
<strong>the</strong> aquifer has been extracted as part <strong>of</strong><br />
lignite mining operations. Withdrawals<br />
from <strong>the</strong> aquifer totaled 450,000 acrefeet<br />
per year in 2003, <strong>of</strong> which 43 percent<br />
was used for irrigation and 35 percent<br />
was used for municipal supplies (TWDB,<br />
2009). Since groundwater withdrawals<br />
from <strong>the</strong> aquifer began, water levels<br />
have declined at least 50 feet in much<br />
<strong>of</strong> <strong>the</strong> aquifer and hundreds <strong>of</strong> feet near<br />
8 <strong>Texas</strong> Water Development Board <strong>Report</strong> <strong>374</strong>
major municipal users and in <strong>the</strong> Winter<br />
Garden area. Groundwater pumpage<br />
from <strong>the</strong> aquifer is expected to increase<br />
between 2010 and 2060, largely to meet<br />
municipal demand for San Antonio, o<strong>the</strong>r<br />
cities along <strong>the</strong> Interstate 35 corridor, and<br />
Bryan-College Station (TWDB, 2007).<br />
The Carrizo-Wilcox Aquifer is discussed<br />
in more detail throughout this report.<br />
1.4<br />
Queen City and Sparta<br />
aquifers<br />
The Queen City and Sparta aquifers are<br />
widespread minor aquifers stretching<br />
across <strong>the</strong> <strong>Texas</strong> <strong>Upper</strong> <strong>Coastal</strong> Plain<br />
from Louisiana into South <strong>Texas</strong>, including<br />
all or parts <strong>of</strong> Anderson, Angelina,<br />
Atascosa, Bastrop, Brazos, Burleson,<br />
Caldwell, Camp, Cass, Cherokee, Fayette,<br />
Freestone, Frio, Gonzales, Gregg,<br />
Grimes, Harrison, Henderson, Houston,<br />
Karnes, La Salle, Lee, Leon, Madison,<br />
Marion, McMullen, Milam, Morris,<br />
Nacogdoches, Robertson, Rusk, Sabine,<br />
San Augustine, Smith, Trinity, Upshur,<br />
Van Zandt, Walker, Wilson, and Wood<br />
counties.<br />
The Queen City and Sparta aquifers<br />
consist <strong>of</strong> water held in formations <strong>of</strong> <strong>the</strong><br />
same names, both part <strong>of</strong> <strong>the</strong> Eoceneaged<br />
Claiborne Group. Although <strong>the</strong><br />
Queen City overlies a large portion <strong>of</strong><br />
<strong>the</strong> Sparta, <strong>the</strong>y are separated by <strong>the</strong> lowpermeability<br />
Weches Formation, which<br />
restricts flow between <strong>the</strong> aquifers (Preston<br />
and Moore, 1991). Chapter 5 <strong>of</strong> this<br />
report provides more information about<br />
<strong>the</strong>se aquifers.<br />
The Queen City Formation is composed<br />
<strong>of</strong> sand, sandstone, shale, and clay,<br />
with lignite found locally. The aquifer<br />
thickness is less than 500 feet in most<br />
places but reaches almost 700 feet in<br />
parts <strong>of</strong> nor<strong>the</strong>ast <strong>Texas</strong>. Water in <strong>the</strong><br />
aquifer is fresh to slightly saline, with<br />
quality decreasing to <strong>the</strong> southwest and<br />
in deeper parts <strong>of</strong> <strong>the</strong> aquifer. The average<br />
concentration <strong>of</strong> total dissolved solids<br />
increases from about 300 milligrams<br />
per liter in outcrop areas to about 750<br />
milligrams per liter in downdip parts<br />
<strong>of</strong> <strong>the</strong> aquifer (Rogers, 1967; William F.<br />
Guyton and Associates, 1972; Klemt and<br />
o<strong>the</strong>rs, 1976; Preston and Moore, 1991;<br />
Ashworth and Hopkins, 1995; TWDB,<br />
2007).<br />
In 2003, an estimated 16,000 acre-feet<br />
<strong>of</strong> water was withdrawn from <strong>the</strong> Queen<br />
City Aquifer, mostly for municipal and<br />
livestock use (TWDB, 2009). Between<br />
1990 and 2000, water levels in monitored<br />
wells showed a median decline <strong>of</strong> 1.5 feet<br />
(Boghici, 2008). Use <strong>of</strong> <strong>the</strong> aquifer is<br />
expected to remain fairly constant from<br />
2010 through 2060 (TWDB, 2007).<br />
The Sparta Formation consists <strong>of</strong><br />
sand and interbedded clays, with small<br />
amounts <strong>of</strong> lignite in some locations.<br />
The sediment thickness increases to<br />
<strong>the</strong> nor<strong>the</strong>ast, reaching more than 700<br />
feet. The average saturated thickness <strong>of</strong><br />
<strong>the</strong> aquifer is about 120 feet. Water is<br />
generally fresh in and near <strong>the</strong> outcrop<br />
area, containing about 300 milligrams<br />
per liter <strong>of</strong> total dissolved solids, and<br />
becomes increasingly saline with depth,<br />
containing an average <strong>of</strong> 800 milligrams<br />
per liter <strong>of</strong> total dissolved solids. High<br />
concentrations <strong>of</strong> iron occur throughout<br />
<strong>the</strong> aquifer (Rogers, 1967; William<br />
F. Guyton and Associates, 1972; Klemt<br />
and o<strong>the</strong>rs, 1976; Ashworth and Hopkins,<br />
1995; TWDB, 2007).<br />
The approximately 10,000 acre-feet<br />
<strong>of</strong> water withdrawn from <strong>the</strong> Sparta<br />
Aquifer in 2003 was used primarily<br />
for municipal and manufacturing uses<br />
(TWDB, 2009). Water level measurements<br />
indicate a median decline <strong>of</strong> 1.4<br />
feet in water levels in <strong>the</strong> aquifer from<br />
1990 to 2000 (Boghici, 2008). Total<br />
withdrawals from <strong>the</strong> aquifer are likely<br />
to remain approximately <strong>the</strong> same from<br />
2010 through 2060 (TWDB, 2007).<br />
1.5<br />
Yegua-Jackson Aquifer<br />
The Yegua-Jackson Aquifer is a minor<br />
aquifer that runs in a narrow band<br />
between <strong>the</strong> Gulf Coast Aquifer and<br />
<strong>the</strong> outcrop areas <strong>of</strong> <strong>the</strong> Carrizo-Wilcox<br />
<strong>Texas</strong> Water Development Board <strong>Report</strong> <strong>374</strong> 9
Aquifer. It is located in all or parts <strong>of</strong><br />
Angelina, Atascosa, Bastrop, Brazos,<br />
Burleson, Duval, Fayette, Frio, Gonzales,<br />
Grimes, Houston, Jasper, Jim Hogg,<br />
Karnes, LaSalle, Lavaca, Lee, Leon,<br />
Live Oak, Madison, McMullen, Nacogdoches,<br />
Newton, Polk, Sabine, San<br />
Augustine, Starr, Trinity, Tyler, Walker,<br />
Washington, Webb, Wilson, and Zapata<br />
counties.<br />
The Yegua-Jackson includes <strong>the</strong><br />
Eocene-aged Yegua Formation <strong>of</strong> <strong>the</strong><br />
Claiborne Group and <strong>the</strong> overlying<br />
Eocene-Oligocene-aged Jackson Group.<br />
These units are composed <strong>of</strong> interbedded<br />
sand, silt, and clay, with smaller amounts<br />
<strong>of</strong> lignite, limestone, tuff, shells, and gypsum.<br />
Although <strong>the</strong> combined thickness <strong>of</strong><br />
<strong>the</strong>se formations can reach thousands <strong>of</strong><br />
feet, <strong>the</strong> average thickness <strong>of</strong> sediments<br />
saturated with fresh water, found only<br />
in shallower parts <strong>of</strong> <strong>the</strong> formations, is<br />
less than 200 feet in most places. Water<br />
quality in <strong>the</strong> aquifer is highly variable,<br />
becoming more saline with depth and<br />
changing as a result <strong>of</strong> differences in<br />
sediment composition (Rogers, 1967;<br />
Thorkildsen and Price, 1991; Preston,<br />
2006; TWDB, 2007; Knox and o<strong>the</strong>rs,<br />
2009).<br />
Because <strong>the</strong> Yegua-Jackson Aquifer<br />
was not recognized as a minor aquifer<br />
until 2002 (TWDB, 2002), historical<br />
pumping estimates have grouped use<br />
from <strong>the</strong> aquifer with “o<strong>the</strong>r” aquifers.<br />
However, draft analysis <strong>of</strong> historical<br />
pumping made for <strong>the</strong> development<br />
<strong>of</strong> <strong>the</strong> TWDB groundwater availability<br />
model for <strong>the</strong> aquifer estimate that<br />
approximately 15,000 acre-feet <strong>of</strong> water<br />
was withdrawn from <strong>the</strong> aquifer in 1997,<br />
more than half <strong>of</strong> which was for rural<br />
domestic use. Monitored water levels<br />
indicated a median water level rise in<br />
<strong>the</strong> aquifer <strong>of</strong> 0.6 foot from 1990 to 2000<br />
(Boghici, 2008). Withdrawals from <strong>the</strong><br />
aquifer are projected to increase between<br />
2010 and 2060, mostly to provide supplies<br />
for municipal use and manufacturing<br />
(TWDB, 2007). See Chapter 6 for<br />
fur<strong>the</strong>r description <strong>of</strong> this aquifer.<br />
1.6<br />
Brazos River Alluvium<br />
Aquifer<br />
The Brazos River Alluvium Aquifer, a<br />
minor aquifer, is located in parts <strong>of</strong><br />
Austin, Bosque, Brazos, Burleson, Falls,<br />
Fort Bend, Grimes, Hill, McLennan,<br />
Milam, Robertson, Waller, and Washington<br />
counties.<br />
The aquifer is composed <strong>of</strong> alluvial<br />
terrace and floodplain deposits along <strong>the</strong><br />
Brazos River, which flows through eastcentral<br />
<strong>Texas</strong> into <strong>the</strong> Gulf <strong>of</strong> Mexico.<br />
The sediments include sand, gravel, silt,<br />
and clay that reach up to around 75 feet<br />
in thickness in terrace deposits and up to<br />
100 feet in thickness in floodplain deposits.<br />
The average thickness <strong>of</strong> <strong>the</strong> floodplain<br />
deposits is about 45 feet, with <strong>the</strong><br />
thickness increasing toward <strong>the</strong> coast.<br />
Water quality varies but typically is hard<br />
and contains less than 1,000 milligrams<br />
per liter <strong>of</strong> total dissolved solids (Cronin<br />
and Wilson, 1967), although total dissolved<br />
solids occasionally reach about<br />
3,000 milligrams per liter (TWDB, 2007).<br />
The Brazos River Alluvium Aquifer is<br />
hydraulically connected to <strong>the</strong> Brazos<br />
River as well as to underlying bedrock<br />
aquifers, including <strong>the</strong> Yegua-Jackson.<br />
The primary use <strong>of</strong> water pumped<br />
from <strong>the</strong> aquifer is for irrigation.<br />
Between 1980 and 2003, withdrawals<br />
from <strong>the</strong> aquifer typically ranged from<br />
20,000 acre-feet to 40,000 acre-feet<br />
(TWDB, 2007). In 2003, over 99 percent<br />
<strong>of</strong> <strong>the</strong> estimated 33,000 acre-feet<br />
<strong>of</strong> water withdrawn from <strong>the</strong> aquifer<br />
was used for irrigation (TWDB, 2009).<br />
Water levels monitored between 1990<br />
and 2000 showed a median water level<br />
increase <strong>of</strong> 0.4 foot (Boghici, 2008). Fur<strong>the</strong>r<br />
development <strong>of</strong> <strong>the</strong> aquifer has not<br />
been planned, and use <strong>of</strong> <strong>the</strong> aquifer is<br />
expected to decrease between 2010 and<br />
2060 (TWDB, 2007). More information<br />
about this aquifer is available in Chapter<br />
7 <strong>of</strong> this report.<br />
10 <strong>Texas</strong> Water Development Board <strong>Report</strong> <strong>374</strong>
1.7<br />
Groundwater management<br />
in <strong>the</strong> <strong>Upper</strong> <strong>Coastal</strong> <strong>Plains</strong><br />
The future use <strong>of</strong> <strong>the</strong>se aquifers will be<br />
managed by local groundwater conservation<br />
districts, <strong>the</strong> preferred method<br />
<strong>of</strong> groundwater management in <strong>Texas</strong>.<br />
The specifics <strong>of</strong> groundwater management<br />
in <strong>the</strong> region are based primarily<br />
on state legislation that authorizes local<br />
groundwater conservation districts to<br />
establish policies for managing <strong>the</strong>ir<br />
groundwater resources and to coordinate<br />
<strong>the</strong>se policies within regional<br />
groundwater management areas. Policies<br />
developed by groundwater conservation<br />
districts will be used in coming<br />
years by regional water planning groups<br />
in developing management strategies to<br />
meet future water demands.<br />
1.8<br />
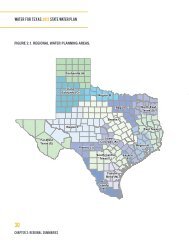
Regional water planning<br />
Comprehensive water legislation passed<br />
in 1997 called for regional water planning<br />
groups representing a wide range <strong>of</strong><br />
interests to develop 50-year water plans<br />
within 16 defined regional water planning<br />
areas. Parts <strong>of</strong> 10 <strong>of</strong> <strong>the</strong>se regional<br />
water planning areas are located within<br />
<strong>the</strong> study area (Figure 1-7). Each regional<br />
water planning group must create a<br />
water plan every five years that defines<br />
current and projected water supplies<br />
and demands, identifies specific water<br />
needs—demands that could not be<br />
met under drought conditions—and<br />
develops water management strategies<br />
to meet <strong>the</strong>se needs. TWDB <strong>the</strong>n uses<br />
<strong>the</strong>se regional plans to develop a state<br />
water plan. The most recent state water<br />
plan was released in 2007 (TWDB,<br />
2007). Future water projects and permits<br />
must be consistent with <strong>the</strong> state<br />
water plan to qualify for financial assistance<br />
from TWDB and water rights<br />
permits from <strong>the</strong> <strong>Texas</strong> Commission on<br />
Environmental Quality.<br />
Using only existing permits, contracts,<br />
and infrastructure in <strong>the</strong> study area,<br />
unmet needs in a drought <strong>of</strong> record are<br />
expected to reach 1.2 million acre-feet<br />
by 2060 (TWDB, 2007). To meet <strong>the</strong>se<br />
needs, regional water planners recommended<br />
implementing a wide range <strong>of</strong><br />
management strategies, many <strong>of</strong> which<br />
include fur<strong>the</strong>r development <strong>of</strong> <strong>the</strong> aquifers<br />
discussed in this report. Strategies<br />
that involve <strong>the</strong>se aquifers include new<br />
wells and well fields, expanded use <strong>of</strong><br />
existing wells, brackish water desalination,<br />
conjunctive management with<br />
surface water supplies, water transfers,<br />
and temporary overdrafting <strong>of</strong> aquifers<br />
(withdrawing more than <strong>the</strong> amount<br />
considered available by water managers,<br />
based on management philosophy<br />
and knowledge <strong>of</strong> <strong>the</strong> aquifer). O<strong>the</strong>r<br />
types <strong>of</strong> strategies involve surface water<br />
resources, water reuse, and water conservation.<br />
Financing those strategies that<br />
involve significant costs will provide a<br />
challenge to implementing <strong>the</strong>se strategies.<br />
Chapters 9 and 10 <strong>of</strong> this report<br />
address specific groundwater development<br />
projects that address future needs<br />
in <strong>the</strong> region.<br />
1.9<br />
Groundwater conservation<br />
districts<br />
In 1949, <strong>Texas</strong> House Bill 162, authorizing<br />
<strong>the</strong> creation <strong>of</strong> underground water<br />
conservation districts, was passed by<br />
<strong>the</strong> <strong>Texas</strong> Legislature and signed into<br />
law. Over <strong>the</strong> past two decades, <strong>the</strong> legislature<br />
has passed fur<strong>the</strong>r legislation<br />
empowering groundwater conservation<br />
districts to manage <strong>the</strong> groundwater<br />
within <strong>the</strong>ir borders and to coordinate<br />
management within regional groundwater<br />
management areas. Groundwater<br />
conservation districts develop management<br />
plans and rules to implement<br />
<strong>the</strong>se management plans. They have <strong>the</strong><br />
ability to modify and replace <strong>the</strong> “rule <strong>of</strong><br />
capture” via <strong>the</strong> management plan and<br />
rules. Areas in <strong>the</strong> state that have no<br />
groundwater conservation district still<br />
exist under <strong>the</strong> “rule <strong>of</strong> capture.” However,<br />
over 90 percent <strong>of</strong> all groundwater<br />
used in <strong>the</strong> state is withdrawn from an<br />
<strong>Texas</strong> Water Development Board <strong>Report</strong> <strong>374</strong> 11
North East <strong>Texas</strong><br />
(D)<br />
Region C<br />
Brazos G<br />
(G)<br />
East <strong>Texas</strong><br />
(I)<br />
Lower<br />
Colorado<br />
(K)<br />
Region H<br />
South Central <strong>Texas</strong><br />
(L)<br />
Lavaca<br />
(P)<br />
Rio Grande<br />
(M)<br />
<strong>Coastal</strong> Bend<br />
(N)<br />
N<br />
0 50 100 miles<br />
Figure 1-7. Location <strong>of</strong> regional water planning areas in <strong>the</strong> <strong>Upper</strong> Gulf Coast region.<br />
area within a groundwater conservation<br />
district.<br />
The <strong>Upper</strong> <strong>Coastal</strong> <strong>Plains</strong> region is<br />
currently home to 30 confirmed groundwater<br />
conservation districts and all or<br />
parts <strong>of</strong> 10 groundwater management<br />
areas (Figure 1-8). Over 60 percent <strong>of</strong><br />
<strong>the</strong> area is within a groundwater conservation<br />
district, including many <strong>of</strong> <strong>the</strong><br />
region’s population and pumping centers.<br />
The groundwater conservation districts<br />
include <strong>the</strong> following:<br />
• Anderson County Underground<br />
Water Conservation District<br />
• Barton Springs/Edwards Aquifer<br />
Conservation District<br />
• Bee Groundwater Conservation<br />
District<br />
12 <strong>Texas</strong> Water Development Board <strong>Report</strong> <strong>374</strong>
1. Anderson County UWCD<br />
2. Barton Springs/Edwards Aquifer CD<br />
3. Bee GCD<br />
4. Bluebonnet GCD<br />
5. Brazos Valley GCD<br />
6. Edwards Aquifer Authority<br />
7. Evergreen UWCD<br />
8. Fayette County GCD<br />
9. Fort Bend Subsidence District<br />
10. Gonzales County UWCD<br />
11. Guadalupe County GCD<br />
12. Live Oak UWCD<br />
13. Lost Pines GCD<br />
14. Lower Trinity GCD<br />
15. McMullen GCD<br />
16. Duval County GCD<br />
9<br />
7<br />
28 27 10<br />
28 29 16 17<br />
6<br />
2<br />
11<br />
23<br />
10<br />
13<br />
8<br />
24<br />
8<br />
12<br />
5<br />
18<br />
4<br />
19<br />
1<br />
9<br />
11<br />
25<br />
14<br />
14<br />
22<br />
20<br />
26<br />
30<br />
13<br />
15<br />
7<br />
16<br />
16<br />
12<br />
3<br />
21<br />
15<br />
2<br />
17. Medina County GCD<br />
18. Mid-East <strong>Texas</strong> GCD<br />
19. Neches & Trinity Valleys GCD<br />
20. Panola County GCD<br />
21. Pecan Valley GCD<br />
22. Pineywoods GCD<br />
23. Plum Creek CD<br />
24. Post Oak Savannah GCD<br />
25. Rusk County GCD<br />
26. Sou<strong>the</strong>ast <strong>Texas</strong> GCD<br />
27. Starr County GCD<br />
28. Trinity Glen Rose GCD N<br />
29. Uvalde County UWCD<br />
30. Wintergarden GCD<br />
Groundwater management<br />
area<br />
27<br />
0 50 100 miles<br />
Figure 1-8. Location <strong>of</strong> groundwater conservation districts and groundwater management areas in <strong>the</strong><br />
<strong>Upper</strong> Gulf Coast region. GCD = groundwater conservation district; UWCD = Underground water<br />
conservation district<br />
• Bluebonnet Groundwater<br />
Conservation District<br />
• Brazos Valley Groundwater<br />
Conservation District<br />
• Duval County Groundwater<br />
Conservation District<br />
• Edwards Aquifer Authority<br />
• Evergreen Underground Water<br />
Conservation District<br />
• Fayette County Groundwater<br />
Conservation District<br />
• Fort Bend Subsidence District<br />
• Gonzales County Underground<br />
Water Conservation District<br />
• Guadalupe County Groundwater<br />
Conservation District<br />
• Live Oak Underground Water<br />
Conservation District<br />
<strong>Texas</strong> Water Development Board <strong>Report</strong> <strong>374</strong> 13
• Lost Pines Groundwater<br />
Conservation District<br />
• Lower Trinity Groundwater<br />
Conservation District<br />
• McMullen Groundwater<br />
Conservation District<br />
• Medina County Groundwater<br />
Conservation District<br />
• Mid-East <strong>Texas</strong> Groundwater<br />
Conservation District<br />
• Neches and Trinity Valleys<br />
Groundwater Conservation District<br />
• Panola County Groundwater<br />
Conservation District<br />
• Pecan Valley Groundwater<br />
Conservation District<br />
• Pineywoods Groundwater<br />
Conservation District<br />
• Plum Creek Conservation District<br />
• Post Oak Savannah Groundwater<br />
Conservation District<br />
• Rusk County Groundwater<br />
Conservation District<br />
• Sou<strong>the</strong>ast <strong>Texas</strong> Groundwater<br />
Conservation District<br />
• Starr County Groundwater<br />
Conservation District<br />
• Trinity Glen Rose Groundwater<br />
Conservation District<br />
• Uvalde County Underground Water<br />
Conservation District<br />
• Wintergarden Groundwater<br />
Conservation District.<br />
In 2005, <strong>Texas</strong> House Bill 1763 significantly<br />
changed <strong>the</strong> role <strong>of</strong> groundwater<br />
conservation districts in water management<br />
and <strong>the</strong> water planning process.<br />
Overall, <strong>the</strong> bill prescribes a process for<br />
managing groundwater regionally and<br />
gives districts more influence over <strong>the</strong><br />
water planning process. It requires all<br />
districts within <strong>the</strong> same groundwater<br />
management area to collectively decide<br />
on a desired future condition, such<br />
as a maximum allowable water level<br />
drawdown, for each aquifer in <strong>the</strong> area.<br />
TWDB <strong>the</strong>n uses groundwater availability<br />
models or o<strong>the</strong>r available information<br />
to estimate <strong>the</strong> volume <strong>of</strong> water that can<br />
be withdrawn from an aquifer annually<br />
while meeting this chosen condition.<br />
After <strong>the</strong>se amounts, known as managed<br />
available groundwater, are defined, <strong>the</strong>y<br />
will be used in future regional and state<br />
water plans as <strong>the</strong> maximum amount <strong>of</strong><br />
water from an aquifer that can be used<br />
to meet water demands. Therefore, even<br />
in areas without districts, regional management<br />
philosophies will affect groundwater<br />
development by limiting eligibility<br />
for state funding to projects that will not<br />
conflict with <strong>the</strong> desired future conditions<br />
<strong>of</strong> districts in <strong>the</strong> groundwater<br />
management area (Mace and o<strong>the</strong>rs,<br />
2006).<br />
1.10<br />
Groundwater availability<br />
modeling<br />
Groundwater availability models are<br />
tools that groundwater managers can<br />
use to predict how future changes in<br />
groundwater pumping and/or drought<br />
conditions might affect regional water<br />
levels and groundwater flow in aquifers.<br />
They are three-dimensional, numerical<br />
computer models that use available<br />
information about aquifers (such as<br />
measurements <strong>of</strong> water levels in wells,<br />
spring discharge, and <strong>the</strong> composition,<br />
structure, and permeability <strong>of</strong> <strong>the</strong><br />
geologic formations that make up <strong>the</strong><br />
aquifer) to simulate groundwater flow<br />
through <strong>the</strong>m. Development <strong>of</strong> <strong>the</strong>se<br />
models began in 1999 and continues<br />
today. In <strong>the</strong> future, <strong>the</strong>re will be models<br />
for all <strong>of</strong> <strong>the</strong> major and minor aquifers<br />
in <strong>the</strong> state, and <strong>the</strong>se models will<br />
be updated as future studies and monitoring<br />
provide more information about<br />
<strong>the</strong> aquifers.<br />
Several groundwater availability<br />
models have been completed for <strong>the</strong><br />
aquifers discussed in this report. Due<br />
to its size and <strong>the</strong> variation in its hydrogeologic<br />
characteristics, three models<br />
have been created for <strong>the</strong> Carrizo-Wilcox<br />
(Deeds and o<strong>the</strong>rs, 2003; Dutton and<br />
o<strong>the</strong>rs, 2003; Fryar and o<strong>the</strong>rs, 2003).<br />
Because <strong>the</strong> Carrizo-Wilcox, Queen City,<br />
and Sparta aquifers are hydraulically<br />
14 <strong>Texas</strong> Water Development Board <strong>Report</strong> <strong>374</strong>
connected, <strong>the</strong> models <strong>of</strong> <strong>the</strong> Queen City<br />
and Sparta aquifers were added to <strong>the</strong><br />
Carrizo-Wilcox Aquifer models (Kelley<br />
and o<strong>the</strong>rs, 2004). Models for <strong>the</strong> Brazos<br />
River Alluvium and Yegua-Jackson aquifers<br />
are currently under development.<br />
1.11<br />
Summary<br />
The population <strong>of</strong> <strong>the</strong> <strong>Upper</strong> Gulf Coast<br />
<strong>of</strong> <strong>Texas</strong> has more than doubled since<br />
1950, and future population growth will<br />
increase <strong>the</strong> demand for water. In 2004,<br />
more than half <strong>of</strong> <strong>the</strong> water use in this<br />
region came from groundwater. The<br />
Carrizo-Wilcox Aquifer is <strong>the</strong> primary<br />
source <strong>of</strong> groundwater in <strong>the</strong> region and<br />
one <strong>of</strong> <strong>the</strong> most productive aquifers in<br />
<strong>the</strong> state. The Carrizo-Wilcox, Queen<br />
City, Sparta, Yegua-Jackson, and Brazos<br />
River Alluvium aquifers are all sedimentary<br />
aquifers that provide significant<br />
sources <strong>of</strong> water to <strong>the</strong> region and<br />
are described in fur<strong>the</strong>r detail throughout<br />
this report. Water users, groundwater<br />
managers, and water planners<br />
will depend on sufficient and accurate<br />
knowledge <strong>of</strong> groundwater resources in<br />
<strong>the</strong> region to ensure that future water<br />
needs are met.<br />
1.12<br />
References<br />
Ashworth, J.B., and Hopkins, J., 1995, Major and minor aquifers <strong>of</strong> <strong>Texas</strong>: <strong>Texas</strong><br />
Water Development Board <strong>Report</strong> 345 [variously paged], www.twdb.state.tx.us/<br />
publications/publications.asp.<br />
Beynon, B.E., 1992, Ground-water quality monitoring results in <strong>the</strong> Winter Garden area,<br />
1990: <strong>Texas</strong> Water Development Board <strong>Report</strong> 335, 56 p.<br />
Boghici, R., 2008, Changes in water levels in <strong>Texas</strong>, 1990–2000: <strong>Texas</strong> Water Development<br />
Board <strong>Report</strong> 371, 34 p.<br />
Boghici, R., 2009, Water quality in <strong>the</strong> Carrizo-Wilcox Aquifer, 1990–2006: <strong>Texas</strong> Water<br />
Development Board <strong>Report</strong> 372, 33 p.<br />
Cronin, J.G., and Wilson, C.A., Ground water in <strong>the</strong> flood-plain alluvium <strong>of</strong> <strong>the</strong> Brazos<br />
River, Whitney Dam to vicinity <strong>of</strong> Richmond, <strong>Texas</strong>: <strong>Texas</strong> Water Development<br />
Board <strong>Report</strong> 41, 78 p.<br />
Deeds, N., Kelley, V., Fryar, D., Jones, T., Whallon, A.J., and Dean, K.E., 2003, Groundwater<br />
availability model for <strong>the</strong> sou<strong>the</strong>rn Carrizo-Wilcox Aquifer: Prepared for <strong>the</strong><br />
<strong>Texas</strong> Water Development Board [variously paged], www.twdb.state.tx.us/gam.<br />
Dutton, A.R., Harden, B., Nicot, J.-P., and O’Rourke, D., 2003, Groundwater availability<br />
for <strong>the</strong> central part <strong>of</strong> <strong>the</strong> Carrizo-Wilcox Aquifer in <strong>Texas</strong>: Prepared for <strong>the</strong> <strong>Texas</strong><br />
Water Development Board, 295 p., www.twdb.state.tx.us/gam.<br />
Fryar, D., Senger, R., Deeds, N., Pickens, J., Jones, T., Whallon, A.J., and Dean, K.E.,<br />
2003, Groundwater availability model for <strong>the</strong> nor<strong>the</strong>rn Carrizo-Wilcox Aquifer:<br />
Prepared for <strong>the</strong> <strong>Texas</strong> Water Development Board [variously paged], www.twdb.<br />
state.tx.us/gam.<br />
Kelley, V.A., Deeds, N.E., Fryar, D.G., Nicot, J.-P., Jones, T.L., Dutton, A.R., Bruehl, G.,<br />
Unger-Holtz, T., and Machin, J. L., 2004, Groundwater availability models for <strong>the</strong><br />
Queen City and Sparta aquifers: Prepared for <strong>the</strong> <strong>Texas</strong> Water Development Board<br />
[variously paged], www.twdb.state.tx.us/gam.<br />
<strong>Texas</strong> Water Development Board <strong>Report</strong> <strong>374</strong> 15
Klemt, W.B., Duffin, G.L., and Elder, G.R., 1976, Ground-water resources <strong>of</strong> <strong>the</strong> Carrizo<br />
Aquifer in <strong>the</strong> Winter Garden area <strong>of</strong> <strong>Texas</strong>—Volume 1: <strong>Texas</strong> Water Development<br />
Board <strong>Report</strong> 210, 30 p.<br />
Knox, P., Deeds, N., Hamlin, S., and Kelley, V., 2009, Geology, structure, and depositional<br />
history <strong>of</strong> <strong>the</strong> Yegua-Jackson aquifers, this volume.<br />
Larkin, T.J., and Bomar, G.W., 1983, Climatic atlas <strong>of</strong> <strong>Texas</strong>: <strong>Texas</strong> Water Development<br />
Board Limited Publication 192, 151 p.<br />
Mace, R.E., Petrossian, R., Bradley, R., and Mullican, W.F., III, 2006, A streetcar named<br />
desired future conditions—The new groundwater availability for <strong>Texas</strong>: State Bar <strong>of</strong><br />
<strong>Texas</strong>, 7 th Annual <strong>the</strong> Changing Face <strong>of</strong> Water Rights in <strong>Texas</strong>, Chapter 3.1, 23 p.<br />
Preston, R.D., 2006, The Yegua-Jackson Aquifer in Mace, R.E, and o<strong>the</strong>rs, eds., <strong>Aquifers</strong><br />
<strong>of</strong> <strong>the</strong> Gulf Coast <strong>of</strong> <strong>Texas</strong>: <strong>Texas</strong> Water Development Board <strong>Report</strong> 365, p. 51–59.<br />
Preston, R.D., and Moore, S.W., 1991, Evaluation <strong>of</strong> ground water resources in <strong>the</strong> vicinity<br />
<strong>of</strong> <strong>the</strong> cities <strong>of</strong> Henderson, Jacksonville, Kilgore, Lufkin, Nacogdoches, Rusk, and<br />
Tyler in East <strong>Texas</strong>: <strong>Texas</strong> Water Development Board <strong>Report</strong> 327, 51 p.<br />
Rogers, L.T., 1967, Availability and quality <strong>of</strong> ground water in Fayette County, <strong>Texas</strong>:<br />
<strong>Texas</strong> Water Development Board <strong>Report</strong> 56, 117 p.<br />
SCAS (Spatial Climate Analysis Service), 2004, Near-real-time monthly high-resolution<br />
precipitation climate data set for <strong>the</strong> conterminous United States (2.5-arc minute<br />
1971–2000 mean monthly precipitation grids for <strong>the</strong> conterminous United States):<br />
Corvallis, OR, Spatial Climate Analysis Service, Oregon State University, Arc grid<br />
file, www.ocs.oregonstate.edu/prism, accessed March 2006.<br />
Thorkildsen, D., and Price, R.D., 1991, Ground-water resources <strong>of</strong> <strong>the</strong> Carrizo-Wilcox<br />
Aquifer in <strong>the</strong> Central <strong>Texas</strong> Region: <strong>Texas</strong> Water Development Board <strong>Report</strong> 332,<br />
46 p.<br />
TWDB (<strong>Texas</strong> Water Development Board), 2002, Water for <strong>Texas</strong>, Volume 1: <strong>Texas</strong><br />
Water Development Board State Water Plan, 156 p.<br />
TWDB (<strong>Texas</strong> Water Development Board), 2007, Water for <strong>Texas</strong>, Volume 3: <strong>Texas</strong><br />
Water Development Board State Water Plan Database, www.twdb.state.tx.us/wrpi.<br />
TWDB (<strong>Texas</strong> Water Development Board), 2009, Water use survey: Historical water<br />
use summary information database, www.twdb.state.tx.us/wrpi.<br />
U.S. Census Bureau, 1952, Census <strong>of</strong> population—1950—Volume I: U.S. Department <strong>of</strong><br />
Commerce, Washington, DC, www.census.gov.<br />
U.S. Census Bureau, 2003, 2000 Census <strong>of</strong> population and housing, population and<br />
housing unit counts, PHC-3-45, <strong>Texas</strong>: U.S. Department <strong>of</strong> Commerce, Washington,<br />
DC, www.census.gov.<br />
William F. Guyton & Associates, 1972, Ground-water conditions in Anderson, Cherokee,<br />
Freestone, and Henderson counties, <strong>Texas</strong>: <strong>Texas</strong> Water Development Board<br />
<strong>Report</strong> 150, 193 p.<br />
16 <strong>Texas</strong> Water Development Board <strong>Report</strong> <strong>374</strong>
Chapter 2<br />
Geology <strong>of</strong> <strong>the</strong> Carrizo-Wilcox Aquifer<br />
Peter G. George, Ph.D., P.G. 1<br />
The Carrizo Wilcox Aquifer consists<br />
<strong>of</strong> rocks <strong>of</strong> <strong>the</strong> Wilcox Group that<br />
extend from Mexico, across <strong>Texas</strong>, into<br />
Louisiana, Arkansas, Mississippi, Alabama,<br />
Tennessee, and Kentucky (Figures<br />
2-1, 2-2, 2-3, and 2-4). In <strong>Texas</strong>, <strong>the</strong><br />
aquifer occurs in 66 counties over 11,186<br />
square miles <strong>of</strong> outcrop and 25,409<br />
square miles in <strong>the</strong> subsurface (TWDB,<br />
2007). Based on its size and <strong>the</strong> large<br />
amount <strong>of</strong> water it supplies to <strong>the</strong> state,<br />
it is considered a major aquifer. Wilcox<br />
Group rocks are also important as<br />
a major oil and gas producer. This latter<br />
aspect is fortuitous in that Wilcox<br />
Group rocks have been <strong>the</strong> subject <strong>of</strong><br />
numerous geologic studies, and this<br />
information is transferable to studies<br />
involving groundwater.<br />
2.1<br />
Previous work<br />
The amount <strong>of</strong> information on <strong>the</strong> Wilcox<br />
Group is extensive, so this study will<br />
focus on work from inland areas where<br />
useable groundwater can be found, as<br />
well as o<strong>the</strong>r regional studies for context.<br />
Local onshore studies include<br />
Plummer (1933); Fischer and McGowen<br />
(1967); Edwards (1981); Bebout and o<strong>the</strong>rs<br />
(1982); Galloway (1968); Halbouty<br />
and Halbouty (1982); Fiduk and Hamilton<br />
(1995); Xue and Galloway (1995); and<br />
Fiduk and o<strong>the</strong>rs (2004). More regional<br />
studies on lower Tertiary stratigraphy<br />
include Galloway (1989a, 1989b); Worrall<br />
and Snelson (1989); Culotta and o<strong>the</strong>rs<br />
(1992); Galloway and o<strong>the</strong>rs (2000);<br />
Galloway (2005); Zarra (2007); and<br />
McDonnell and o<strong>the</strong>rs (2008). Regional<br />
studies on <strong>the</strong> structural history <strong>of</strong> <strong>the</strong><br />
Gulf <strong>of</strong> Mexico include Buffler (1991);<br />
Salvador (1991); Bradshaw and Watkins<br />
(1994); Diegel and o<strong>the</strong>rs (1995); Peel<br />
and o<strong>the</strong>rs (1995); Watkins and o<strong>the</strong>rs<br />
(1996); Huh and o<strong>the</strong>rs (1996); Jackson<br />
and o<strong>the</strong>rs (2003); and Rowan and o<strong>the</strong>rs<br />
(2005).<br />
2.2<br />
Physiography and climate<br />
The Carrizo-Wilcox Aquifer is located<br />
within <strong>the</strong> Interior <strong>Coastal</strong> <strong>Plains</strong> subprovince<br />
<strong>of</strong> <strong>the</strong> Gulf <strong>Coastal</strong> <strong>Plains</strong><br />
physiographic province (Wermund,<br />
1996). The Interior <strong>Coastal</strong> <strong>Plains</strong> are<br />
characterized by alternating sequences<br />
<strong>of</strong> unconsolidated sands and clays. The<br />
sands tend to be more resistant to erosion<br />
than <strong>the</strong> clay-rich soils, <strong>the</strong>reby<br />
producing numerous sand ridges paralleling<br />
<strong>the</strong> coast.<br />
The Interior <strong>Coastal</strong> <strong>Plains</strong> subprovince<br />
has low topographic relief with<br />
ground surface elevations decreasing<br />
from about 800 feet to 100 feet toward<br />
<strong>the</strong> Gulf <strong>of</strong> Mexico.<br />
Northwest- to sou<strong>the</strong>ast-flowing rivers,<br />
such as <strong>the</strong> Colorado and Brazos, cut<br />
across <strong>the</strong> Wilcox Group and younger<br />
rocks through broad terraced valleys.<br />
Pine and hardwood forests predominate<br />
over <strong>the</strong> nor<strong>the</strong>astern part <strong>of</strong> <strong>the</strong><br />
aquifer, within a dense network <strong>of</strong> perennial<br />
streams. Toward <strong>the</strong> southwest, <strong>the</strong><br />
number <strong>of</strong> trees decreases as <strong>the</strong>y are<br />
replaced by chaparral brush and grasses<br />
(Wermund, 1996).<br />
The aquifer is subject to three climatic<br />
zones: <strong>the</strong> Subtropical Humid division<br />
in <strong>the</strong> north, <strong>the</strong> Subtropical Subhumid<br />
division in <strong>the</strong> south, and <strong>the</strong> Subtropical<br />
Steppe division near <strong>the</strong> border with<br />
Mexico (Larkin and Bomar, 1983). Precipitation<br />
decreases east to west across<br />
<strong>the</strong> area <strong>of</strong> interest, from about 55 inches<br />
1 <strong>Texas</strong> Water Development Board<br />
<strong>Texas</strong> Water Development Board <strong>Report</strong> <strong>374</strong> 17
S<br />
!<br />
S<br />
S<br />
!<br />
S<br />
!SS<br />
!<br />
S<br />
S<br />
S<br />
SS<br />
S<br />
S<br />
S<br />
!<br />
S<br />
!<br />
!<br />
!<br />
S<br />
!<br />
!!S<br />
!<br />
!S<br />
!<br />
S<br />
S<br />
!<br />
S<br />
S<br />
S<br />
S<br />
! !<br />
S<br />
!<br />
S<br />
!<br />
S<br />
!<br />
S<br />
!<br />
S<br />
S<br />
S<br />
!<br />
S<br />
!<br />
S<br />
!<br />
S<br />
S<br />
S<br />
!<br />
S<br />
!<br />
S<br />
S<br />
S<br />
S<br />
!<br />
!!<br />
S<br />
S<br />
S<br />
S S<br />
S<br />
!<br />
S<br />
!<br />
S<br />
S<br />
S<br />
S<br />
!<br />
S<br />
!<br />
S<br />
S<br />
!<br />
S<br />
!<br />
S<br />
S<br />
S<br />
!<br />
!<br />
! !<br />
S<br />
!<br />
!<br />
! !<br />
! !<br />
!<br />
!<br />
! ! !<br />
! !<br />
!<br />
S<br />
!<br />
!<br />
!!<br />
!<br />
S<br />
!<br />
!<br />
!S<br />
S<br />
!<br />
Emi<br />
!<br />
!<br />
S<br />
S<br />
S<br />
!<br />
!<br />
SS<br />
!<br />
S<br />
!<br />
S<br />
S<br />
!<br />
S S<br />
S<br />
SS<br />
! !<br />
SS<br />
S<br />
S<br />
S<br />
S<br />
S<br />
S<br />
S<br />
S<br />
!!<br />
S<br />
Er<br />
S S<br />
!<br />
S<br />
!<br />
S<br />
S<br />
S<br />
S<br />
S S S<br />
S<br />
S<br />
!<br />
!<br />
S<br />
S<br />
S<br />
S<br />
S<br />
S<br />
S<br />
S S<br />
S<br />
S<br />
S<br />
S<br />
S<br />
Ewi<br />
S S<br />
S<br />
SS<br />
S<br />
S<br />
S<br />
S<br />
S<br />
S<br />
S<br />
SS<br />
S<br />
S<br />
S S S<br />
S<br />
S S<br />
S<br />
S<br />
S<br />
S<br />
S<br />
S<br />
SS<br />
S<br />
Ewi<br />
S<br />
S<br />
S<br />
S<br />
S<br />
!<br />
S<br />
S<br />
!!SSS ! S<br />
!!S<br />
!<br />
S<br />
S<br />
!S<br />
!<br />
!<br />
S<br />
S<br />
S<br />
S<br />
S<br />
S<br />
S<br />
S<br />
S<br />
!<br />
!<br />
S<br />
!<br />
!<br />
!<br />
!<br />
! !<br />
S<br />
S<br />
S<br />
!<br />
!<br />
S<br />
S !S S<br />
S!S<br />
S<br />
S<br />
!<br />
!<br />
!<br />
S<br />
S<br />
S<br />
S<br />
!<br />
SS<br />
S<br />
!<br />
!<br />
!<br />
S<br />
SS<br />
S<br />
S<br />
!<br />
!<br />
!! !<br />
S S<br />
!<br />
!<br />
!S<br />
S<br />
S<br />
S<br />
S !S<br />
SS<br />
S<br />
SS<br />
S<br />
S<br />
S<br />
S<br />
S<br />
S<br />
!<br />
!<br />
SS<br />
S<br />
S<br />
S<br />
SS<br />
!<br />
!<br />
S<br />
!<br />
S<br />
!S<br />
S<br />
!<br />
S<br />
S<br />
!!SS<br />
Eh<br />
S<br />
S<br />
!<br />
!<br />
S<br />
S<br />
S<br />
S<br />
!!<br />
!!<br />
!<br />
!<br />
!<br />
S<br />
S<br />
Ecb<br />
S<br />
S<br />
S<br />
S<br />
Esb<br />
S<br />
S<br />
S<br />
S<br />
S<br />
SS<br />
S<br />
SSSSS<br />
SS<br />
Er<br />
S<br />
S<br />
SS<br />
S<br />
SS<br />
S<br />
!<br />
SS<br />
S<br />
S<br />
S<br />
S<br />
S<br />
S<br />
S<br />
S<br />
S<br />
SS<br />
S<br />
SS<br />
S<br />
S<br />
S<br />
!<br />
S<br />
S<br />
S S<br />
!<br />
!<br />
S<br />
S<br />
S<br />
S S<br />
S<br />
S!<br />
!<br />
SS<br />
S<br />
S<br />
S<br />
S<br />
S<br />
S<br />
SSSS<br />
S<br />
S<br />
S<br />
S<br />
!<br />
SS<br />
S<br />
!S S<br />
!<br />
!<br />
S<br />
S<br />
S<br />
SS<br />
! !<br />
S<br />
!!<br />
S<br />
S<br />
S<br />
S<br />
!<br />
S<br />
Er<br />
S<br />
S<br />
!<br />
S<br />
S<br />
!<br />
S<br />
!<br />
S<br />
S<br />
S<br />
S<br />
S<br />
S<br />
S<br />
S<br />
S<br />
!<br />
S<br />
S<br />
S !<br />
S SS<br />
S<br />
SS<br />
SS!<br />
S<br />
S<br />
!<br />
S<br />
S<br />
!<br />
!<br />
S<br />
S<br />
S<br />
!<br />
S<br />
S<br />
Ec<br />
S<br />
S S<br />
S<br />
S<br />
S<br />
SS<br />
S<br />
S<br />
S<br />
SS<br />
S S<br />
S<br />
S<br />
!<br />
S<br />
! !<br />
! !<br />
S<br />
S<br />
S<br />
! !<br />
! ! !<br />
!!!<br />
!<br />
S<br />
S<br />
! !<br />
Ec<br />
S<br />
S<br />
S<br />
S<br />
S S<br />
SS<br />
40<br />
Miles<br />
Fault type<br />
F<br />
Anticline<br />
! ! ! ! ! !<br />
Concealed normal<br />
Inferred normal<br />
S<br />
I<br />
P<br />
Normal<br />
Overturned anticline<br />
Overturned syncline<br />
F<br />
$<br />
Syncline<br />
Transverse (from-to)<br />
Transverse (to-from)<br />
Unspecified<br />
&<br />
+ + Thrust<br />
Ewi: Wilcox Group undivided<br />
Ec: Carrizo Sand<br />
Ecb: Calvert Bluff Formation<br />
Eh: Hooper Formation<br />
Emi: Midway Group<br />
Er: Recklaw Formation<br />
Esb: Simsboro Formation<br />
Figure 2-1. Partial geology <strong>of</strong> <strong>the</strong> nor<strong>the</strong>astern part <strong>of</strong> <strong>the</strong> Carrizo-Wilcox Aquifer (outline shown in red),<br />
created using <strong>the</strong> 1:250,000 Digital Geological Atlas <strong>of</strong> <strong>Texas</strong> (USGS and TWDB, 2006).<br />
18 <strong>Texas</strong> Water Development Board <strong>Report</strong> <strong>374</strong>
SSS<br />
S<br />
S<br />
S<br />
S<br />
S<br />
S<br />
S<br />
S<br />
SS<br />
S<br />
S<br />
S<br />
S<br />
S<br />
S<br />
S<br />
S<br />
S<br />
SS<br />
S<br />
S<br />
SS<br />
S<br />
S<br />
S<br />
SS<br />
S<br />
S<br />
S<br />
S<br />
S<br />
S<br />
S<br />
S<br />
S<br />
S<br />
S S<br />
S<br />
S<br />
S<br />
S<br />
SS<br />
S<br />
SS<br />
S<br />
S<br />
S<br />
SS<br />
S<br />
S<br />
S<br />
S<br />
S<br />
S<br />
S<br />
S<br />
S<br />
S<br />
S<br />
SS<br />
S SS<br />
S<br />
S<br />
S<br />
S<br />
S S<br />
S<br />
!<br />
S<br />
!S<br />
!S<br />
S<br />
S<br />
S<br />
S<br />
S<br />
S<br />
S<br />
S<br />
S<br />
S<br />
S<br />
S<br />
SS<br />
S S<br />
! !<br />
S<br />
S<br />
S<br />
SS<br />
S<br />
S<br />
S<br />
S<br />
S<br />
S<br />
S<br />
S<br />
SS<br />
S<br />
S<br />
S<br />
S<br />
S<br />
SS<br />
S<br />
S<br />
S<br />
S<br />
SS<br />
S<br />
S<br />
S<br />
S S<br />
S<br />
SS<br />
S<br />
SS<br />
S<br />
S<br />
S<br />
S<br />
S<br />
S<br />
S<br />
S<br />
S<br />
S<br />
S<br />
S<br />
S<br />
S<br />
S<br />
S<br />
S<br />
S<br />
S<br />
S<br />
S<br />
S<br />
S<br />
S<br />
SS<br />
S S<br />
S<br />
SS<br />
SS<br />
S<br />
S<br />
S<br />
SS<br />
S<br />
S<br />
SS<br />
S<br />
S<br />
S<br />
S<br />
S<br />
SS<br />
SS<br />
S<br />
S<br />
S<br />
S<br />
S<br />
S<br />
SS<br />
SS<br />
S<br />
SS<br />
S<br />
S<br />
SSS<br />
S<br />
S<br />
S<br />
S<br />
S<br />
S<br />
S<br />
S<br />
S<br />
S<br />
S<br />
S<br />
S<br />
S<br />
S<br />
S<br />
S<br />
S<br />
S<br />
S<br />
S S<br />
SS<br />
S<br />
S<br />
S<br />
S<br />
S<br />
S<br />
S<br />
S<br />
S<br />
S<br />
S<br />
S<br />
S<br />
SS<br />
S<br />
S<br />
SS<br />
S<br />
S<br />
S<br />
S<br />
S<br />
S<br />
S<br />
S<br />
S<br />
S<br />
S<br />
S<br />
S<br />
S<br />
S<br />
S<br />
S<br />
S<br />
S<br />
S<br />
S<br />
S<br />
S<br />
S<br />
S<br />
S<br />
SS<br />
S<br />
S<br />
S<br />
S<br />
S<br />
S<br />
SS<br />
S<br />
SS<br />
S<br />
S<br />
S<br />
S<br />
S<br />
S<br />
S<br />
S<br />
SS<br />
S<br />
S<br />
S<br />
S<br />
S<br />
S<br />
SS<br />
S<br />
S<br />
S<br />
S<br />
S<br />
S<br />
S<br />
S<br />
SSSS<br />
SS<br />
S<br />
S<br />
S<br />
S<br />
S<br />
S S<br />
S<br />
S S<br />
SS<br />
S<br />
S<br />
S<br />
SS<br />
S<br />
S<br />
S<br />
S<br />
S<br />
S<br />
S<br />
S<br />
S<br />
S<br />
S<br />
S S<br />
SSS<br />
S<br />
S<br />
S<br />
SS<br />
S<br />
S<br />
S<br />
SS<br />
S<br />
S<br />
S<br />
S<br />
SSS<br />
S<br />
S<br />
S<br />
S<br />
S<br />
S<br />
S<br />
S<br />
S<br />
S<br />
S<br />
S<br />
S<br />
S<br />
S<br />
S<br />
SS<br />
S<br />
S<br />
SS<br />
S<br />
S<br />
SS<br />
SSS<br />
SS<br />
SS<br />
S<br />
S<br />
SS<br />
S<br />
SS<br />
S<br />
S<br />
S<br />
S<br />
S<br />
S<br />
S<br />
S<br />
S<br />
S<br />
S<br />
S<br />
S<br />
S<br />
S<br />
S<br />
S<br />
S<br />
S<br />
S<br />
S<br />
S<br />
SS S<br />
S<br />
S<br />
S<br />
S<br />
S<br />
S<br />
S<br />
S<br />
S<br />
S<br />
S S<br />
SS<br />
S<br />
S<br />
S<br />
S<br />
S<br />
S<br />
S<br />
S<br />
S<br />
S<br />
S<br />
S<br />
S<br />
S<br />
S<br />
S<br />
S<br />
S<br />
S<br />
S<br />
S<br />
S<br />
SSSS<br />
S<br />
S<br />
S<br />
S<br />
S S<br />
S<br />
S<br />
S<br />
S<br />
S<br />
S<br />
S<br />
S<br />
S<br />
S<br />
S<br />
S<br />
S<br />
S<br />
S<br />
SSSS<br />
S<br />
S<br />
S<br />
S<br />
S<br />
S<br />
S S<br />
S SS<br />
S<br />
S<br />
S<br />
S<br />
S<br />
SS<br />
S<br />
SSS<br />
S<br />
SS<br />
S<br />
S<br />
S<br />
SS<br />
SS<br />
S<br />
SS<br />
SS<br />
S<br />
S<br />
S<br />
S<br />
S<br />
S<br />
S<br />
S<br />
S<br />
S<br />
S<br />
S<br />
SS<br />
S<br />
S<br />
S<br />
S<br />
S<br />
S<br />
S<br />
S<br />
S<br />
S<br />
SS<br />
S<br />
S<br />
S<br />
S<br />
S<br />
S<br />
S<br />
S<br />
S<br />
S<br />
S<br />
S<br />
S<br />
S<br />
S<br />
S<br />
S<br />
S<br />
S<br />
S<br />
S<br />
S<br />
S<br />
SSS<br />
S<br />
S<br />
S<br />
S<br />
S<br />
SS<br />
SS<br />
S<br />
SSS<br />
S<br />
S<br />
S<br />
SS<br />
S<br />
SS<br />
S<br />
S<br />
S<br />
S<br />
S<br />
SS<br />
S<br />
S<br />
S<br />
SS<br />
S<br />
S<br />
S<br />
S<br />
SS<br />
S<br />
S<br />
S<br />
S<br />
S<br />
S<br />
S<br />
S<br />
S<br />
S<br />
S<br />
S<br />
++<br />
+ +<br />
S<br />
S<br />
S<br />
S<br />
S<br />
S<br />
S<br />
S<br />
S<br />
S<br />
S<br />
S<br />
S<br />
S<br />
S<br />
S<br />
S<br />
SS<br />
S<br />
S<br />
S<br />
S<br />
S<br />
S<br />
S<br />
S<br />
SS<br />
S<br />
SS<br />
S<br />
S<br />
SS<br />
S<br />
SS<br />
S<br />
S<br />
SSS<br />
S<br />
S<br />
S<br />
S<br />
S<br />
S<br />
S<br />
S<br />
S<br />
S<br />
S<br />
S<br />
S<br />
S<br />
+<br />
+<br />
S<br />
S<br />
S S<br />
S<br />
SS<br />
S<br />
S<br />
S<br />
S<br />
S<br />
S S<br />
SS<br />
S<br />
SS<br />
S<br />
S<br />
S S<br />
S<br />
S<br />
S<br />
S<br />
S<br />
+<br />
S<br />
S<br />
S<br />
S<br />
S<br />
S<br />
S<br />
SS<br />
S<br />
S<br />
S<br />
S<br />
S<br />
S<br />
S<br />
S<br />
S<br />
S<br />
S<br />
S<br />
S<br />
S<br />
S<br />
S<br />
SS<br />
SS<br />
SS<br />
S<br />
SS<br />
S<br />
S<br />
S<br />
S<br />
S<br />
SSSS<br />
SSS<br />
S<br />
S<br />
S SS<br />
S<br />
S<br />
!<br />
S<br />
S<br />
!<br />
S<br />
!<br />
SS<br />
S<br />
S<br />
S<br />
SS<br />
S<br />
SS<br />
S<br />
SS<br />
S<br />
!<br />
SS<br />
S SS S<br />
S<br />
SS<br />
S S<br />
S<br />
S S<br />
SS<br />
S<br />
S<br />
SS<br />
S<br />
SS<br />
S<br />
S<br />
S<br />
! !<br />
S<br />
S<br />
SS<br />
S<br />
S<br />
!S<br />
S<br />
Eh<br />
!! ! !!<br />
!!<br />
S<br />
S<br />
S<br />
S<br />
S<br />
S<br />
S<br />
Esb<br />
S<br />
! ! !<br />
S<br />
S<br />
S<br />
S<br />
S<br />
S<br />
Emi<br />
S<br />
Ecb<br />
S<br />
S<br />
S<br />
S<br />
SS<br />
SS<br />
SSS<br />
SS<br />
S!!<br />
S<br />
S<br />
S<br />
S<br />
S<br />
S<br />
SS<br />
S<br />
S<br />
S<br />
S<br />
S<br />
S<br />
S<br />
S<br />
S<br />
SSS<br />
S<br />
!S<br />
S<br />
S<br />
! !<br />
S<br />
S<br />
S<br />
!<br />
! !<br />
S S<br />
S<br />
S<br />
S<br />
S<br />
S<br />
!<br />
S<br />
!!<br />
!!<br />
S<br />
S<br />
S<br />
S<br />
S<br />
S<br />
S<br />
S<br />
S<br />
S<br />
SS<br />
S<br />
S<br />
S<br />
SS<br />
SS<br />
S<br />
S<br />
S<br />
S<br />
S<br />
S S<br />
S<br />
S<br />
SSS S<br />
S<br />
SS<br />
S<br />
S<br />
S<br />
S<br />
S<br />
SS S<br />
S<br />
S<br />
S<br />
SS<br />
S<br />
SS<br />
SS<br />
S<br />
S S<br />
S SS<br />
S S SS SS<br />
SSSSS<br />
S<br />
SS<br />
S<br />
S<br />
S<br />
SSS<br />
S<br />
SSS<br />
S<br />
S<br />
S<br />
S<br />
S<br />
S<br />
S<br />
S SS<br />
S<br />
SS<br />
S<br />
S<br />
S<br />
S<br />
Ewi<br />
S<br />
S<br />
S S<br />
S<br />
SS<br />
S S<br />
S<br />
S<br />
SS<br />
S<br />
S<br />
S<br />
SSS<br />
S S<br />
SS<br />
S<br />
S S<br />
S<br />
SS<br />
S<br />
S<br />
SS<br />
S<br />
S<br />
S<br />
S<br />
S<br />
S<br />
S<br />
S<br />
SS<br />
S<br />
S<br />
S<br />
S<br />
S<br />
SS<br />
S<br />
S<br />
S<br />
S<br />
S<br />
S<br />
SS<br />
S<br />
SS<br />
S S<br />
S<br />
S<br />
SS<br />
S<br />
S<br />
S<br />
S<br />
S<br />
S<br />
SSS<br />
S<br />
S<br />
S<br />
S<br />
S<br />
S<br />
S<br />
S<br />
S<br />
S<br />
S<br />
S<br />
S<br />
S<br />
S<br />
SSSS<br />
S<br />
SS<br />
S<br />
SS<br />
S<br />
S<br />
S<br />
S<br />
S<br />
S<br />
S<br />
S<br />
S<br />
S<br />
S<br />
S<br />
S S<br />
S<br />
S<br />
S<br />
S<br />
S<br />
S<br />
S<br />
S<br />
S<br />
S<br />
S<br />
S<br />
S<br />
SS<br />
SSS<br />
S<br />
S<br />
SS<br />
S<br />
S<br />
S<br />
S<br />
S<br />
S<br />
SS<br />
SS<br />
S<br />
S<br />
SS<br />
S<br />
S<br />
S<br />
SS<br />
SSS<br />
S<br />
S<br />
S<br />
S<br />
+<br />
S<br />
S<br />
S<br />
S<br />
S<br />
S<br />
S<br />
SS<br />
S<br />
S<br />
S<br />
S<br />
S<br />
S<br />
S<br />
S<br />
S<br />
S<br />
S<br />
S<br />
S S<br />
SS<br />
S<br />
S<br />
S<br />
S<br />
S<br />
S<br />
S<br />
S<br />
S<br />
S<br />
S<br />
SSSS<br />
Emi<br />
S<br />
SS<br />
S<br />
S<br />
S S<br />
S<br />
SS<br />
S<br />
SS<br />
S<br />
SS<br />
S<br />
S<br />
S<br />
S<br />
S<br />
S<br />
S<br />
S S<br />
S<br />
S<br />
S<br />
S S<br />
SS<br />
S<br />
S<br />
S<br />
S S<br />
SS<br />
S<br />
S<br />
S<br />
S<br />
S<br />
S<br />
S<br />
S<br />
S<br />
S<br />
S<br />
S<br />
S<br />
S<br />
S<br />
S<br />
SS<br />
SS<br />
S<br />
S<br />
S<br />
S S<br />
S<br />
S<br />
S<br />
Ec<br />
S<br />
S<br />
S<br />
S<br />
S<br />
S<br />
S<br />
S<br />
SS<br />
S<br />
S<br />
S<br />
S<br />
S<br />
S<br />
S<br />
SS<br />
S<br />
S<br />
S<br />
S<br />
S<br />
S<br />
S<br />
S<br />
S<br />
S<br />
S<br />
S<br />
SS<br />
S<br />
S<br />
S<br />
S<br />
S<br />
S<br />
S<br />
S<br />
S<br />
Ewi<br />
S<br />
S<br />
S<br />
S<br />
S<br />
S<br />
S<br />
SSS<br />
S SS<br />
Er<br />
S<br />
S<br />
S<br />
SS<br />
S<br />
S<br />
S<br />
+<br />
S<br />
S<br />
S<br />
S<br />
S<br />
S<br />
S<br />
S<br />
S S<br />
S<br />
Er<br />
S<br />
S S<br />
S<br />
S<br />
SS S<br />
S<br />
S<br />
S<br />
SSS<br />
S<br />
S<br />
S<br />
S<br />
S<br />
S<br />
S<br />
S<br />
Ec<br />
S<br />
S<br />
S<br />
S S<br />
S<br />
S<br />
S<br />
S<br />
S<br />
S S<br />
S<br />
S<br />
S<br />
SS<br />
S<br />
S<br />
S<br />
S<br />
S<br />
S<br />
S S<br />
S S<br />
S<br />
S<br />
S<br />
S<br />
S<br />
S<br />
S<br />
S<br />
S<br />
S<br />
S<br />
S<br />
S<br />
S<br />
S<br />
S<br />
S<br />
S<br />
S<br />
S<br />
SS<br />
S<br />
S<br />
S SS<br />
S<br />
S<br />
SSS<br />
SSS<br />
S<br />
S<br />
S<br />
SS<br />
S<br />
S<br />
S<br />
60<br />
Miles<br />
Fault type<br />
F<br />
Anticline<br />
! ! ! ! ! !<br />
Concealed normal<br />
Inferred normal<br />
S<br />
I<br />
P<br />
Normal<br />
Overturned anticline<br />
Overturned syncline<br />
F<br />
$<br />
Syncline<br />
Transverse (from-to)<br />
Transverse (to-from)<br />
Unspecified<br />
&<br />
+ + Thrust<br />
Ewi: Wilcox Group undivided<br />
Ec: Carrizo Sand<br />
Ecb: Calvert Bluff Formation<br />
Eh: Hooper Formation<br />
Emi: Midway Group<br />
Er: Recklaw Formation<br />
Esb: Simsboro Formation<br />
Figure 2-2. Partial geology <strong>of</strong> <strong>the</strong> southwestern part <strong>of</strong> <strong>the</strong> Carrizo-Wilcox Aquifer (outline shown in red),<br />
created using <strong>the</strong> 1:250,000 Digital Geological Atlas <strong>of</strong> <strong>Texas</strong> (USGS and TWDB, 2006).<br />
<strong>Texas</strong> Water Development Board <strong>Report</strong> <strong>374</strong> 19
Figure 2-3. Generalized stratigraphic columns for <strong>the</strong> Carrizo-Wilcox Aquifer in <strong>Texas</strong> (from Fryar and<br />
o<strong>the</strong>rs, 2003; after Ayers and Lewis, 1985; Hamlin, 1988; and Kaiser and o<strong>the</strong>rs, 1978).<br />
Fm=formation<br />
A<br />
A’<br />
0<br />
Elevation (feet) Elevation (feet)<br />
-1,000<br />
-2,000<br />
-3,000<br />
-4,000<br />
B<br />
0<br />
-2,000<br />
-4,000<br />
-6,000<br />
-8,000<br />
20<br />
20<br />
Miles<br />
Miles<br />
B’<br />
Younger sediments<br />
Sparta Sand<br />
Weches Formation<br />
Queen City Sand<br />
Reklaw Formation<br />
Carrizo Sand<br />
Wilcox Group<br />
Carrizo-Wilcox Aquifer<br />
B<br />
B'<br />
A<br />
A'<br />
Figure 2-4. Structural cross section <strong>of</strong> <strong>the</strong> Carrizo-Wilcox Aquifer and overlying strata (modified from Kelley and o<strong>the</strong>rs, 2004).<br />
20 <strong>Texas</strong> Water Development Board <strong>Report</strong> <strong>374</strong>
per year to about 20 inches per year<br />
along <strong>the</strong> Rio Grande (TWDB, 2007).<br />
The annual average lake evaporation rate<br />
increases to <strong>the</strong> southwest from about<br />
45 inches per year to 85 inches per year<br />
(Larkin and Bomar, 1983).<br />
2.3<br />
Geology<br />
The rocks that compose <strong>the</strong> Carrizo-<br />
Wilcox Aquifer represent <strong>the</strong> first major<br />
Cenozoic influx <strong>of</strong> clastic sediment into<br />
<strong>the</strong> west and central Gulf <strong>of</strong> Mexico<br />
Basin (Galloway and o<strong>the</strong>rs, 2000). Late<br />
Paleocene and early Eocene tectonics,<br />
changes in eustatic sea level, and <strong>the</strong><br />
nature <strong>of</strong> <strong>the</strong> underlying depositional<br />
surface influenced <strong>the</strong> deposition <strong>of</strong><br />
sediment.<br />
2.4<br />
Regional struCTure<br />
The regional setting <strong>of</strong> <strong>the</strong> Carrizo-<br />
Wilcox Aquifer includes a variety <strong>of</strong><br />
structural features produced along <strong>the</strong><br />
nor<strong>the</strong>rn margin <strong>of</strong> <strong>the</strong> Gulf <strong>of</strong> Mexico<br />
since <strong>the</strong> break up <strong>of</strong> <strong>the</strong> Paleozoic<br />
supercontinent Pangaea and <strong>the</strong> opening<br />
<strong>of</strong> <strong>the</strong> North Atlantic Ocean in Late<br />
Triassic time (Byerly, 1991; Ewing, 1991;<br />
Figure 2-5).<br />
2.4.1<br />
Balcones Fault Zone<br />
The Balcones Fault Zone borders part<br />
<strong>of</strong> <strong>the</strong> aquifer to <strong>the</strong> north (Figure 2-5).<br />
This fault zone formed along <strong>the</strong> nor<strong>the</strong>rn<br />
margin <strong>of</strong> <strong>the</strong> Gulf <strong>of</strong> Mexico Basin<br />
and constitutes a divide between Cretaceous<br />
strata to <strong>the</strong> north and Tertiary<br />
sediments to <strong>the</strong> south. The zone<br />
overlies major crustal-scale faults <strong>of</strong> <strong>the</strong><br />
Ouachita orogenic belt, which formed<br />
earlier in <strong>the</strong> late Paleozoic. It is characterized<br />
by down-to-basement normal<br />
faults with cumulative displacements <strong>of</strong><br />
up to 1,600 feet (Ewing, 1991). To <strong>the</strong><br />
sou<strong>the</strong>ast is <strong>the</strong> Luling Fault Zone with<br />
mostly up-to-basin normal faults, and<br />
toge<strong>the</strong>r <strong>the</strong>se two fault zones form<br />
a large graben system about 30 miles<br />
wide. The timing <strong>of</strong> faulting is not well<br />
constrained, but <strong>the</strong>re is some evidence<br />
<strong>of</strong> Late Cretaceous and Miocene<br />
movement.<br />
2.4.2<br />
Karnes/Milano/Mexia and Talco<br />
fault zones<br />
The Karnes/Milano/Mexia and Talco<br />
fault zones are part <strong>of</strong> a larger graben<br />
system linked by zones <strong>of</strong> en echelon<br />
left-stepping, down-to-basin normal<br />
faults extending from Central <strong>Texas</strong><br />
to <strong>the</strong> Arkansas border (Jackson 1982;<br />
Ewing, 1991). There is evidence for Cretaceous<br />
to Eocene movement along <strong>the</strong><br />
Karnes Fault Zone and Jurassic to Paleocene<br />
faulting in <strong>the</strong> East <strong>Texas</strong> Basin<br />
area (Rose, 1972; Jackson, 1982). Faulting<br />
in <strong>the</strong> East <strong>Texas</strong> Basin is associated<br />
with movement <strong>of</strong> Jurassic Louann Salt<br />
at depth (Jackson, 1982).<br />
2.4.3<br />
Elkhart Graben<br />
The Elkhart Graben is located along<br />
<strong>the</strong> western end <strong>of</strong> <strong>the</strong> Elkhart-Mount<br />
Enterprise Fault Zone. It consists <strong>of</strong> parallel,<br />
normal faults with multiple <strong>of</strong>fsets<br />
defining a graben about 25 miles long<br />
(Jackson, 1982). Jackson (1982) considers<br />
<strong>the</strong> graben to have been formed by<br />
crustal stretching and <strong>the</strong> collapse <strong>of</strong><br />
salt-related anticlines. Most displacement<br />
along graben faults took place<br />
during <strong>the</strong> Early Cretaceous, although<br />
Eocene rocks were affected by faulting<br />
as well.<br />
2.4.4<br />
Mount Enterprise Fault Zone<br />
The Mount Enterprise Fault Zone is<br />
located to <strong>the</strong> nor<strong>the</strong>ast <strong>of</strong> <strong>the</strong> Elkhart<br />
Graben. This fault zone is a regular<br />
array <strong>of</strong> parallel and en echelon normal<br />
faults that are largely downthrown to<br />
<strong>the</strong> north in a series <strong>of</strong> multiple <strong>of</strong>fsets<br />
(Jackson, 1982). Unlike o<strong>the</strong>r faults in<br />
<strong>the</strong> East <strong>Texas</strong> Embayment, <strong>the</strong> Mount<br />
Enterprise Fault Zone is not obviously<br />
connected to salt-related structures or<br />
<strong>Texas</strong> Water Development Board <strong>Report</strong> <strong>374</strong> 21
Balcones Fault Zone<br />
San Marcos<br />
Arch<br />
Karnes/Milano/Mexia Fault Zone<br />
Wilcox Fault Zone<br />
Talco Fault Zone<br />
Elkhart<br />
Graben<br />
HOU STON<br />
EMBA YMENT<br />
Mount Enterprise<br />
EAST TEXAS BASIN<br />
Fault Zone<br />
Sabine<br />
Uplift<br />
Sabine Arch<br />
Syncline showing<br />
dip direction<br />
Anticline showing<br />
dip direction<br />
RIO GRANDE<br />
EMBAYMENT<br />
0 40 80<br />
Carrizo-Wilcox, outcrop<br />
Carrizo-Wilcox, subsurface<br />
Growth fault trend<br />
Faults<br />
Miles<br />
Salt domes<br />
Figure 2-5. Map <strong>of</strong> major faults and structural features for <strong>the</strong> <strong>Texas</strong> <strong>Coastal</strong> Plain and East <strong>Texas</strong> Embayment in relation to<br />
<strong>the</strong> Carrizo-Wilcox Aquifer (modified from Kelley and o<strong>the</strong>rs, 2004; Galloway and o<strong>the</strong>rs, 2000; Ewing, 1990; Galloway 1982).<br />
o<strong>the</strong>r basinal features. Also, even though<br />
<strong>the</strong> fault zone extends to <strong>the</strong> Sabine<br />
Uplift, it shows no geometric relationship<br />
to <strong>the</strong> structure. The fault zone<br />
was active in Early Cretaceous time, and<br />
some faulting was syndepositional with<br />
respect to <strong>the</strong> Wilcox Group.<br />
2.4.5<br />
Wilcox Fault Zone<br />
The Wilcox Fault Zone parallels <strong>the</strong><br />
<strong>Texas</strong> coastline south <strong>of</strong> <strong>the</strong> Carrizo-<br />
Wilcox Aquifer. The fault zone consists<br />
<strong>of</strong> closely spaced growth faults<br />
with a deep-listric character (Bruce,<br />
1973; Ewing, 1991). Growth faults form<br />
in sedimentary rocks as deposition is<br />
occurring, where throw increases with<br />
depth and strata on <strong>the</strong> downthrown<br />
side are thicker than correlative strata<br />
on <strong>the</strong> upthrown side. Deep-listric<br />
growth faults are those that flatten into<br />
a deep, diffuse detachment level (probably<br />
in ductile shale), where vertical<br />
subsidence is greater than horizontal<br />
displacement (Ewing, 1988). In some<br />
cases, stratigraphic sections expand<br />
as much as three to five times across<br />
22 <strong>Texas</strong> Water Development Board <strong>Report</strong> <strong>374</strong>
growth faults (Ewing, 1991). In South<br />
<strong>Texas</strong>, <strong>the</strong> Rosita Delta System thickens<br />
from about 600 feet to more than 3,000<br />
feet across <strong>the</strong> fault zone. There, growth<br />
faults were activated by progradation<br />
<strong>of</strong> deltas over unstable prodelta-slope<br />
muds at <strong>the</strong> contemporary shelf margin<br />
(Edwards, 1981).<br />
In <strong>the</strong> Houston Embayment, growth<br />
faults have been overprinted with salt<br />
diapir-related basins and uplifts (Ewing,<br />
1983). In South <strong>Texas</strong>, a greater thickness<br />
<strong>of</strong> mobile, overpressured shale results in<br />
a complex structural style characterized<br />
by shale ridges and large anti<strong>the</strong>tic faults<br />
(Ewing, 1986).<br />
2.4.6<br />
Sabine Uplift<br />
The Sabine Uplift is a structural feature<br />
located between <strong>the</strong> East <strong>Texas</strong> and<br />
North Louisiana basins, and its present<br />
form is expressed in <strong>the</strong> outcrop<br />
patterns <strong>of</strong> Wilcox Group rocks (Figure<br />
2-5). It has experienced several periods<br />
<strong>of</strong> uplift, but <strong>the</strong> causes <strong>of</strong> uplift are still<br />
unclear (Murray, 1945; Halbouty and<br />
Halbouty, 1982; Jackson and Laubach,<br />
1988; Ewing, 1991). Uplift occurred in<br />
<strong>the</strong> mid-Cretaceous; Late Cretaceous<br />
(post-Woodbine, pre-Austin Chalk<br />
time); and in <strong>the</strong> Eocene. Halbouty and<br />
Halbouty (1982) estimated about 3,325<br />
feet <strong>of</strong> uplift from Late Cretaceous to<br />
<strong>the</strong> present. During <strong>the</strong> deposition <strong>of</strong><br />
Wilcox Group sediments, <strong>the</strong> Sabine<br />
Uplift region is thought to have been<br />
slowly rising (Moody, 1931).<br />
2.4.7<br />
San Marcos Arch<br />
The San Marcos Arch is not considered<br />
an uplift in <strong>the</strong> traditional sense but<br />
more <strong>of</strong> a stable passive area where subsidence<br />
was less than within flanking<br />
“embayment” areas (Ewing, 1991). The<br />
arch appears to be an extension <strong>of</strong> <strong>the</strong><br />
Llano Uplift to <strong>the</strong> northwest (Young,<br />
1972). The stratigraphic influence <strong>of</strong><br />
<strong>the</strong> San Marcos Arch can be detected<br />
in strata ranging in age from Jurassic<br />
to Miocene, extending from <strong>the</strong> Llano<br />
Uplift to <strong>the</strong> present shoreline (Halbouty,<br />
1966).<br />
2.4.8<br />
East <strong>Texas</strong> Basin<br />
The East <strong>Texas</strong> Basin accumulated a<br />
thick layer <strong>of</strong> salt during <strong>the</strong> Jurassic<br />
that later, during deposition <strong>of</strong> <strong>the</strong> Wilcox<br />
Group, strongly influenced sedimentation<br />
(Jackson, 1982; Jackson and<br />
Seni, 1983). From Early Cretaceous to<br />
Eocene time, salt structures in <strong>the</strong> basin<br />
evolved from pillow to diapir, and postdiapir<br />
geometries. Post-diapir growth<br />
produced mounds over salt domes that<br />
locally affected topography and subsequent<br />
distribution <strong>of</strong> sand and mud<br />
in fluvial deposits (Seni and Jackson,<br />
1983).<br />
2.4.9<br />
Rio Grande and Houston embayments<br />
Paleogene regional uplift and tectonism<br />
within <strong>the</strong> continental interior <strong>of</strong> western<br />
North America (Laramide Orogeny)<br />
provided <strong>the</strong> terrigenous clastic sediment<br />
deposited into <strong>the</strong> Gulf <strong>of</strong> Mexico<br />
Basin by way <strong>of</strong> <strong>the</strong> Rio Grande and<br />
Houston embayments. These embayments<br />
were areas <strong>of</strong> differential subsidence<br />
and sediment loading where thick<br />
sections <strong>of</strong> Wilcox Group sediment<br />
accumulated (Xue and Galloway, 1995;<br />
Xue, 1997).<br />
The Houston Embayment lies north<br />
<strong>of</strong> <strong>the</strong> San Marcos Arch in a structural<br />
setting similar to that <strong>of</strong> <strong>the</strong> Rio Grande<br />
Embayment. It is a sou<strong>the</strong>rn extension<br />
<strong>of</strong> <strong>the</strong> East <strong>Texas</strong> Basin and, as such, is<br />
characterized by salt diapirism and associated<br />
faulting and large salt withdrawal<br />
sub-basins (Jackson, 1982; Bebout and<br />
o<strong>the</strong>rs 1978).<br />
To <strong>the</strong> south across <strong>the</strong> San Marcos<br />
Platform and into <strong>the</strong> Rio Grande Embayment,<br />
underlying Jurassic salt is thin or<br />
absent, and long linear belts <strong>of</strong> growth<br />
faults and associated shale ridges, massifs,<br />
and diapirs dominate <strong>the</strong> structural<br />
style (Bruce, 1973). In <strong>the</strong> Rio Grande<br />
<strong>Texas</strong> Water Development Board <strong>Report</strong> <strong>374</strong> 23
Lower Wilcox<br />
paleogeography<br />
Lower Wilcox<br />
paleogeography<br />
Houston<br />
Delta<br />
Holly Springs<br />
Delta<br />
Holly Springs<br />
Delta<br />
Shelf Margin<br />
Houston<br />
Delta<br />
Shelf Margin<br />
Laramide<br />
Uplift<br />
Laramide<br />
Uplift<br />
<strong>Upper</strong> Wilcox<br />
paleogeography<br />
<strong>Upper</strong> Wilcox<br />
paleogeography<br />
Mississippi<br />
Embayment<br />
Mississippi<br />
Embayment<br />
Carrizo Fluvial<br />
Complex<br />
Rosita Delta<br />
Carrizo Fluvial<br />
Complex<br />
Rosita Delta<br />
Shelf Margin<br />
Shelf Margin<br />
Laramide<br />
Laramide<br />
Uplift<br />
Uplift<br />
Fluvial<br />
Bed-load-dominated fluvial fluvial<br />
fluvial<br />
Mixed-load-dominated fluvial<br />
Fluvial-dominated delta<br />
Fluvial-dominated delta<br />
Wave-dominated delta<br />
Wave-dominated delta<br />
Shore zone<br />
Shore zone<br />
Sandy shelf system<br />
Muddy Sandy shelf shelf system system<br />
Muddy shelf system<br />
Progradational sandy delta-fed sandy delta-fed apron apronBasin floorBasin floor<br />
Progradational Progradational shelf-fed shelf-fed apron apron Sand-rich fan, Sand-rich sandy fan, sandy fan<br />
Carbonate shelf<br />
Principal fluvial input axis<br />
Carbonate shelf<br />
Principal fluvial input axis<br />
Carbonate ramp<br />
Secondary fluvial input axis<br />
Carbonate ramp<br />
Secondary fluvial input axis<br />
Submarine canyon fill<br />
Depocenter<br />
Submarine canyon fill<br />
Depocenter<br />
Starved basin<br />
Depoaxis<br />
Starved basin<br />
Depoaxis<br />
Sandy basin-floor apron<br />
Shelf margin at maximum progradation<br />
Sandy Sandy basin-floor basin-floor apron apron<br />
Shelf margin at maximum progradation<br />
Sandy basin-floor apron<br />
Figure 2-6. Paleogeographic maps during <strong>the</strong> times <strong>of</strong> Lower and <strong>Upper</strong> Wilcox deposition (modified from McDonnell and<br />
o<strong>the</strong>rs, 2008).<br />
24 <strong>Texas</strong> Water Development Board <strong>Report</strong> <strong>374</strong>
Embayment, large but more discontinuous<br />
belts <strong>of</strong> growth faults and deep-seated<br />
shale ridges and massifs occur. South <strong>of</strong><br />
<strong>the</strong> embayment in Mexico are northwestto<br />
sou<strong>the</strong>ast-trending Laramide folds in<br />
Cretaceous rocks, such as <strong>the</strong> Peyotes-<br />
Picachos and Tamaulipas arches. Jurassic<br />
and Cretaceous sedimentation in <strong>the</strong> Rio<br />
Grande Embayment was nearly continuous,<br />
and later Tertiary deposition was<br />
influenced by <strong>the</strong> growth faulting and<br />
shale diapirism (Ewing, 1991).<br />
2.5<br />
Regional stratigraphy<br />
One method <strong>of</strong> describing <strong>the</strong> stratigraphic<br />
evolution <strong>of</strong> <strong>the</strong> Cenozoic Gulf<br />
<strong>of</strong> Mexico is through a series <strong>of</strong> paleogeographic<br />
maps. Two such maps, for<br />
<strong>the</strong> <strong>Upper</strong> and Lower Wilcox, are presented<br />
here (Salvador, 1991; Galloway<br />
and o<strong>the</strong>rs, 2000; Figure 2-6).<br />
2.5.1<br />
Cretaceous<br />
In Early and middle Cretaceous time,<br />
<strong>the</strong> Gulf <strong>of</strong> Mexico was characterized<br />
by carbonate shelves in <strong>the</strong> north<br />
and northwest and steep carbonate<br />
platforms in present-day Florida and<br />
Yucatan (Worrall and Snelson, 1989).<br />
Sedimentation was restricted to <strong>the</strong><br />
basin margin where reefs developed,<br />
such as along <strong>the</strong> Sligo and Stuart City<br />
reef trends. Abyssal sediments accumulated<br />
in <strong>the</strong> deep Gulf <strong>of</strong> Mexico. The<br />
Sabine Uplift was a very broad, lowrelief,<br />
<strong>of</strong>ten submerged structure during<br />
this period.<br />
In <strong>the</strong> mid-Cenomanian, <strong>the</strong> tectonic<br />
stability that existed in <strong>the</strong> Gulf <strong>of</strong><br />
Mexico Basin came to an end (Salvador,<br />
1991). At this time, <strong>the</strong>re was a pr<strong>of</strong>ound<br />
change in <strong>the</strong> depositional setting over<br />
most <strong>of</strong> <strong>the</strong> basin. The change is represented<br />
by a regional unconformity that<br />
formed along <strong>the</strong> north flank <strong>of</strong> <strong>the</strong> basin<br />
to Florida and Yucatan. Also, <strong>the</strong> upper<br />
Albian to lower Cenomanian section on<br />
<strong>the</strong> western flank <strong>of</strong> <strong>the</strong> Sabine Uplift<br />
is truncated beneath <strong>the</strong> unconformity.<br />
This major episode <strong>of</strong> erosion ended<br />
most <strong>of</strong> <strong>the</strong> widespread carbonate deposition<br />
that characterized <strong>the</strong> Early and<br />
middle Cretaceous along <strong>the</strong> nor<strong>the</strong>rn<br />
Gulf <strong>of</strong> Mexico Basin.<br />
In <strong>the</strong> Late Cretaceous, following<br />
development <strong>of</strong> <strong>the</strong> regional unconformity,<br />
<strong>the</strong> basin accumulated chalk, marl,<br />
and shale over large areas. This sediment<br />
constitutes <strong>the</strong> majority <strong>of</strong> <strong>the</strong> Gulfian<br />
stratigraphy <strong>of</strong> <strong>the</strong> Gulf Coast.<br />
2.5.2<br />
Cenozoic<br />
In Paleocene and Eocene time, as a<br />
result <strong>of</strong> increased plate motions, an<br />
immense volume <strong>of</strong> terrigenous clastic<br />
sediments eroded from uplifted areas <strong>of</strong><br />
western North America during <strong>the</strong> Laramide<br />
Orogeny (Coney, 1972; Engebretson<br />
and o<strong>the</strong>rs, 1985). A large amount<br />
<strong>of</strong> this sediment entered <strong>the</strong> Gulf <strong>of</strong><br />
Mexico Basin, particularly along <strong>the</strong><br />
nor<strong>the</strong>rn and northwestern margins,<br />
causing rapid basinward migration <strong>of</strong><br />
shoreline deposition across <strong>the</strong> shelves<br />
to positions far beyond <strong>the</strong> Cretaceous<br />
shelf margin (Galloway; 1989b; Galloway<br />
and o<strong>the</strong>rs, 1991). The nor<strong>the</strong>rn<br />
and northwestern Cenozoic basin margin<br />
prograded some 150 to 180 miles to<br />
<strong>the</strong> south and sou<strong>the</strong>ast (Galloway and<br />
o<strong>the</strong>rs, 2000). The amount <strong>of</strong> progradation<br />
varied with respect to geographic<br />
location. The Rio Grande, Houston,<br />
and Mississippi embayments were three<br />
such locations, or depocenters, where<br />
major deltaic systems developed and<br />
supplied sand-rich sediment to <strong>the</strong> subsiding<br />
Gulf <strong>of</strong> Mexico Basin (Fisher and<br />
McGowen, 1967; Edwards, 1981; Galloway<br />
and o<strong>the</strong>rs, 1982). In areas between<br />
depocenters, progradation <strong>of</strong> <strong>the</strong> Gulf<br />
Coast continental margin was slower<br />
since sedimentation occurred by longshore<br />
transport and deposition <strong>of</strong> suspended<br />
sediment.<br />
An <strong>of</strong>flapping depositional style<br />
developed along <strong>the</strong> basin margin as<br />
sediments began to accumulate over<br />
<strong>the</strong> continental slope and into deeper<br />
<strong>Texas</strong> Water Development Board <strong>Report</strong> <strong>374</strong> 25
parts <strong>of</strong> <strong>the</strong> basin. The center <strong>of</strong> <strong>the</strong> Gulf<br />
<strong>of</strong> Mexico Basin subsided as a result <strong>of</strong><br />
sedimentary loading, ra<strong>the</strong>r than from<br />
<strong>the</strong>rmal cooling <strong>of</strong> <strong>the</strong> oceanic crust<br />
(Galloway and o<strong>the</strong>rs, 1991). Margin<br />
outbuilding was locally and briefly interrupted<br />
by hypersubsidence due to salt<br />
withdrawal and mass wasting.<br />
Deposition, by way <strong>of</strong> <strong>the</strong> Cenozoic<br />
depocenters, produced successions <strong>of</strong><br />
sandy wedges <strong>of</strong> coastal plain and marginal<br />
marine deposits that thicken and<br />
grade basinward into marine shelf and<br />
slope mud rocks (Galloway, 1989b). These<br />
sand-rich wedges are stratigraphically<br />
separated by updip tongues <strong>of</strong> marine<br />
shale deposited as a result <strong>of</strong> repeated<br />
transgression and marine flooding <strong>of</strong> <strong>the</strong><br />
continental margin. These marine-shale<br />
bounded units provide <strong>the</strong> framework for<br />
systematic depositional analysis <strong>of</strong> <strong>the</strong><br />
Cenozoic section (Galloway, 1989b).<br />
2.5.3<br />
Deposition <strong>of</strong> Lower Wilcox Formation<br />
The large influx <strong>of</strong> clastic material<br />
associated with <strong>the</strong> Wilcox Group is<br />
generally attributed to two pulses <strong>of</strong><br />
Paleogene tectonism, each <strong>of</strong> which produced<br />
a depositional cycle lasting from<br />
one maximum flooding event to <strong>the</strong><br />
next (Chapin and Ca<strong>the</strong>r, 1981; Winker,<br />
1982; Galloway and o<strong>the</strong>rs, 1991; Xue,<br />
1997). The first major pulse <strong>of</strong> Laramide<br />
uplift occurred in <strong>the</strong> sou<strong>the</strong>rn Rockies<br />
at about 60 mega-annum (Ma) and<br />
is represented by late Paleocene (Lower<br />
Wilcox) strata.<br />
The Lower Wilcox sediments were<br />
deposited between about 60 to 56.5 Ma<br />
(Xue, 1997). They overlie <strong>the</strong> Midway<br />
Group, which, in large part, is marine<br />
but at its upper part is thought to be<br />
prodelta marine facies <strong>of</strong> <strong>the</strong> lowermost<br />
Wilcox fluvial and deltaic facies (Bebout<br />
and o<strong>the</strong>rs, 1982). Wilcox delta systems<br />
developed in Louisiana, Mississippi, and<br />
east <strong>of</strong> <strong>the</strong> Guadalupe River in <strong>Texas</strong> (Figure<br />
2-6; Galloway and o<strong>the</strong>rs, 1991). The<br />
major focus <strong>of</strong> deltaic sedimentation in<br />
<strong>Texas</strong> was located in <strong>the</strong> Rockdale Delta<br />
System, which is approximately equivalent<br />
in <strong>the</strong> literature to <strong>the</strong> Houston<br />
Delta or Houston Embayment (Fisher<br />
and McGowen, 1967; Xue, 1997). The<br />
Rockdale Delta System was nearly <strong>the</strong><br />
same both in aerial extent and depositional<br />
style as <strong>the</strong> present-day Mississippi<br />
Delta, covering about 40,000 square<br />
miles (Figure 2-7; Fisher and McGowen,<br />
1967; Galloway and o<strong>the</strong>rs, 1991). It was<br />
characterized by extensive growth faulting<br />
and mobilized underlying salt and<br />
associated shale deposits, with major salt<br />
withdrawal basins constituting preferred<br />
and persistent depocenters. The system<br />
as a whole was about 2,500 feet thick on<br />
<strong>the</strong> older Cretaceous carbonate platform<br />
landward <strong>of</strong> zones <strong>of</strong> growth faulting and<br />
as much as 10,000 feet thick basinward.<br />
Where developed above <strong>the</strong> Cretaceous<br />
platform, delta-front and prodelta facies<br />
are relatively thin, and <strong>the</strong> bulk <strong>of</strong> <strong>the</strong><br />
sediments consist <strong>of</strong> aggradational deltaplain<br />
facies. Downdip <strong>of</strong> <strong>the</strong> underlying<br />
Cretaceous shelf margin, progradational<br />
delta front and prodelta facies are stacked<br />
and generally associated with growth<br />
faults, and are thick and predominant<br />
as well (Fisher and McGowen, 1967; Galloway<br />
and o<strong>the</strong>rs, 1991).<br />
The Lower Wilcox delta systems consist<br />
<strong>of</strong> three constructional facies including<br />
delta plain, delta front, and prodelta.<br />
A fourth thin, but regionally extensive,<br />
destructional facies developed through<br />
local fluvial abandonment.<br />
Lower Wilcox delta-plain facies<br />
sediments were deposited immediately<br />
downdip and basinward <strong>of</strong> feeding fluvial<br />
systems. These rocks are equivalent to<br />
some strata contained in <strong>the</strong> lower part<br />
<strong>of</strong> <strong>the</strong> Carrizo-Wilcox Aquifer. They are<br />
a complex <strong>of</strong> elongated, relatively straight<br />
but commonly thick, distributary channel<br />
deposits. The sands are generally<br />
uniform in texture, have sharp erosional<br />
lower boundaries, and have sharp upper<br />
boundaries due to stream abandonment<br />
(Fisher and McGowen, 1967; Galloway<br />
and o<strong>the</strong>rs, 1991). The channel sands<br />
are associated laterally with levee silt<br />
26 <strong>Texas</strong> Water Development Board <strong>Report</strong> <strong>374</strong>
deposits, local and thin interdistributary<br />
sand splays, extensive interdistributary<br />
or overbank muds, and numerous lignite<br />
seams.<br />
The delta-front facies consist <strong>of</strong> channel<br />
mouth bar sands, frontally splayed<br />
sands, and varying amounts <strong>of</strong> wavereworked<br />
sands. These are <strong>the</strong> progradational<br />
sand deposits <strong>of</strong> <strong>the</strong> Lower<br />
Wilcox Delta System. Above <strong>the</strong> Cretaceous<br />
platform, this facies is relatively<br />
thin where it underlies <strong>the</strong> thick aggradational<br />
delta-plain facies. Downdip <strong>the</strong><br />
facies is stacked and thick, and basinward<br />
it grades into <strong>the</strong> shale facies <strong>of</strong> <strong>the</strong><br />
prodelta. It is involved in growth faulting,<br />
as is <strong>the</strong> prodelta facies. Individual<br />
sequences <strong>of</strong> <strong>the</strong> delta-front facies display<br />
upward coarsening and increasing<br />
frequency <strong>of</strong> sands. They are separated<br />
from o<strong>the</strong>r sequences by thin, commonly<br />
glauconitic, delta-destructional beds<br />
(Fisher and McGowen, 1967; Galloway<br />
and o<strong>the</strong>rs, 1991).<br />
The distribution <strong>of</strong> <strong>the</strong> sandy deltafront<br />
sands delimits <strong>the</strong> extent <strong>of</strong> prograded<br />
delta lobes (Fisher and McGowen, 1967;<br />
Galloway and o<strong>the</strong>rs, 1991). The Lower<br />
Wilcox delta systems, like <strong>the</strong> Holocene<br />
Mississippi Delta System, have two basic<br />
deltaic lobe geometries: a relatively narrow,<br />
elongated type and a more arcuate or<br />
lobate type. The different geometries are<br />
thought to be <strong>the</strong> result <strong>of</strong> varying degrees<br />
<strong>of</strong> marine reworking and coalescing <strong>of</strong><br />
sand bodies by wave action.<br />
The prodelta facies is <strong>the</strong> most basinward<br />
and thickest depositional facies.<br />
Figure 2-7. Comparison <strong>of</strong> facies <strong>of</strong> <strong>the</strong> Paleocene Lower Wilcox <strong>of</strong> <strong>Texas</strong> with <strong>the</strong> Holocene Mississippi Delta System<br />
(modified from Galloway and o<strong>the</strong>rs, 1991; based on Fisher and McGowen, 1967, and Coleman and Gagliano, 1964).<br />
MSL= mean sea level<br />
<strong>Texas</strong> Water Development Board <strong>Report</strong> <strong>374</strong> 27
Although not important in terms <strong>of</strong><br />
water resources, it is significant in terms<br />
<strong>of</strong> growth faulting and structures associated<br />
with salt mobilization. The Lower<br />
Wilcox prodelta facies is mainly dark,<br />
organic shale. It grades basinward into<br />
deeper-water sediments <strong>of</strong> <strong>the</strong> continental<br />
slope.<br />
Excessive loading <strong>of</strong> unstable prodelta<br />
muds triggered <strong>the</strong> extensive growth<br />
faulting associated with Lower Wilcox<br />
strata. Loading fur<strong>the</strong>r served to extensively<br />
mobilize underlying salt and associated<br />
shale, commonly in <strong>the</strong> form <strong>of</strong><br />
diapirs.<br />
2.5.4<br />
Deposition <strong>of</strong> Middle Wilcox strata<br />
Middle Wilcox rocks are defined by<br />
maximum flooding surfaces associated<br />
with <strong>the</strong> Yoakum Shale (Central <strong>Texas</strong>)<br />
at <strong>the</strong>ir top and <strong>the</strong> Big Shale (Louisiana)<br />
at <strong>the</strong>ir base. These shales have<br />
been dated at 56.5 Ma and 54.3–55.0 Ma,<br />
respectively (Xue and Galloway, 1995).<br />
Two genetic stratigraphic sequences<br />
were deposited between <strong>the</strong>se <strong>the</strong>ses<br />
ages, representing only 1.5 to 2.2 million<br />
years. A genetic stratigraphic sequence<br />
is defined by Galloway (1989a) as being<br />
bounded by stratigraphic surfaces and<br />
correlative condensed marker beds that<br />
record <strong>the</strong> relative clastic-sediment<br />
starvation <strong>of</strong> <strong>the</strong> shelf and slope during<br />
transgression and <strong>the</strong> ensuing period <strong>of</strong><br />
maximum marine flooding. The Middle<br />
Wilcox sequence boundaries are located<br />
at regionally continuous, low-resistivity<br />
marker beds within thin marineshale<br />
beds. They lie stratigraphically<br />
between upward-fining, transgressive,<br />
and upward-coarsening, progradational<br />
facies successions. The boundaries are<br />
maximum flooding surfaces and correlative<br />
condensed sections in <strong>the</strong> platform<br />
environment. Basinward, across<br />
<strong>the</strong> growth-faulted shelf margin, <strong>the</strong><br />
sequence boundaries lie within thick<br />
marine-shale wedges <strong>of</strong> <strong>the</strong> expanded<br />
downthrown sections (Xue and Galloway,<br />
1995).<br />
Isopach and net-sandstone distribution<br />
patterns <strong>of</strong> <strong>the</strong> Middle Wilcox<br />
sequences show no major sediment<br />
supply shift along strike during Middle<br />
Wilcox deposition (Xue and Galloway,<br />
1995). Downward shifting <strong>of</strong> deposition<br />
beyond <strong>the</strong> shelf margins took place during<br />
slumping, which occurred when sea<br />
level fell or when <strong>the</strong>re was rapid differential<br />
subsidence within growth-fault<br />
zones.<br />
The older <strong>of</strong> <strong>the</strong> two sequences contains<br />
an updip fluvial belt, <strong>the</strong> Calvert<br />
Delta System, <strong>the</strong> Fayette Strand-Plain<br />
System, <strong>the</strong> San Marcos Barrier Lagoon<br />
System, <strong>the</strong> La Salle Delta System, and<br />
downdip muddy shelf-slope systems. The<br />
younger sequence is similar, including<br />
an updip fluvial belt, <strong>the</strong> Calvert Delta<br />
System, and <strong>the</strong> La Salle Delta System.<br />
However, its facies tracts prograded far<strong>the</strong>r<br />
seaward, and <strong>the</strong> new Wilson Delta<br />
System localized in <strong>the</strong> San Marcos area<br />
replaced an interdeltaic barrier lagoon<br />
system in <strong>the</strong> underlying sequence.<br />
2.5.5<br />
Deposition <strong>of</strong> <strong>Upper</strong> Wilcox/<br />
Carrizo strata<br />
The primary locus <strong>of</strong> Wilcox Group<br />
deposition shifted to <strong>the</strong> southwest<br />
across <strong>the</strong> San Marcos Arch to <strong>the</strong> Rio<br />
Grande Embayment in early Eocene<br />
time (Edwards, 1981; Miller, 1989; Xue,<br />
1997). There, an influx <strong>of</strong> <strong>Upper</strong> Wilcox<br />
Group sediments coincided with<br />
a period <strong>of</strong> north-south-directed constructional<br />
Laramide compression and<br />
uplift <strong>of</strong> <strong>the</strong> sou<strong>the</strong>rn Rocky Mountains<br />
at about 55 Ma (Chapin and Ca<strong>the</strong>r,<br />
1981; Winker, 1982, Galloway and o<strong>the</strong>rs,<br />
1991; Xue, 1997).<br />
Following <strong>the</strong> Yoakum transgression<br />
associated with Middle Wilcox strata,<br />
<strong>the</strong>re was renewed progradation into<br />
<strong>the</strong> basin (Edwards, 1981; Miller, 1989;<br />
Xue, 1997). The deltaic systems in <strong>the</strong> Rio<br />
Grande Embayment rapidly prograded to<br />
<strong>the</strong> shelf margin, as represented by <strong>the</strong><br />
Rosita Delta System <strong>of</strong> Edwards (1981).<br />
The Rosita Delta System includes at least<br />
28 <strong>Texas</strong> Water Development Board <strong>Report</strong> <strong>374</strong>
three delta complexes, each <strong>of</strong> which<br />
can be traced up to tens <strong>of</strong> miles along<br />
strike and up to approximately 15 miles<br />
downdip. Basinward, across <strong>the</strong> growthfault<br />
zone, each delta complex thickens<br />
from about 600 feet to more than 3,000<br />
feet. The growth faults were activated<br />
by progradation <strong>of</strong> deltas over unstable<br />
prodelta-slope muds at <strong>the</strong> contemporary<br />
shelf margin.<br />
Each <strong>of</strong> <strong>the</strong> delta complexes <strong>of</strong> <strong>the</strong><br />
Rosita Delta System consists <strong>of</strong> multiple<br />
lobes, some <strong>of</strong> which can be traced<br />
across deep zones where thicknesses<br />
increase by as much as tenfold, owing<br />
to progradation over active growth faults<br />
(Edwards, 1981). Characteristic coarsening-upward<br />
progradational units include<br />
prodelta shales, delta-front sandstones,<br />
distributary channel and channel mouth<br />
bar sandstones, and interdistributary<br />
shales and sandstones. Appreciable variability<br />
in sandstone distribution in <strong>the</strong><br />
deltas may reflect changing importance<br />
<strong>of</strong> fluvial versus marine currents in distributing<br />
sediment along <strong>the</strong> delta front.<br />
However, all <strong>of</strong> <strong>the</strong> deltas prograded<br />
abruptly toward <strong>the</strong> shelf margin.<br />
Updip <strong>of</strong> <strong>the</strong> deltaic complexes are<br />
two sand-rich fluvial depositional systems<br />
<strong>of</strong> <strong>the</strong> Carrizo Formation (Hamlin,<br />
1988). The Carrizo Formation is part<br />
<strong>of</strong> a single, major regressive sequence,<br />
consisting <strong>of</strong> proximal high-sand fluvial<br />
systems. The Carrizo siliciclastics were<br />
deposited on a sand-rich humid coastal<br />
plain by rivers draining areas north,<br />
northwest, and west <strong>of</strong> <strong>the</strong> Rio Grande<br />
Embayment. Major fluvial channels were<br />
bed-load-dominated braided streams.<br />
These channels deposited broad belts and<br />
sheets <strong>of</strong> sand, miles wide and hundreds<br />
<strong>of</strong> feet thick (Hamlin, 1988). Deposits <strong>of</strong><br />
mixed-load, meandering streams also<br />
occur in <strong>the</strong> Carrizo, interbedded with<br />
<strong>the</strong> bed-load system. Interchannel facies<br />
associated with <strong>the</strong> mixed-load deposits<br />
include natural levees, crevasse splays,<br />
floodplains, and coastal lakes.<br />
The deltaic systems <strong>of</strong> <strong>the</strong> Houston<br />
Embayment expanded basinward and<br />
approached <strong>the</strong> shelf margin (Miller,<br />
1989). Deposition within <strong>the</strong> growthfault-bounded<br />
depocenter in South<br />
<strong>Texas</strong> continued, followed by aggradation<br />
<strong>of</strong> <strong>the</strong> depositional systems, which<br />
<strong>the</strong>n slowly backstepped, resulting in<br />
deposition <strong>of</strong> <strong>the</strong> retrogradational deltas<br />
in South <strong>Texas</strong> (Edwards, 1981). Finally,<br />
transgressive shelf and shore-zone systems<br />
were deposited at <strong>the</strong> top <strong>of</strong> <strong>the</strong><br />
<strong>Upper</strong> Wilcox rocks (Miller, 1989).<br />
2.6<br />
Summary with some<br />
additional observations<br />
The tectonic histories <strong>of</strong> <strong>the</strong> source<br />
areas were <strong>the</strong> main driving mechanisms<br />
for <strong>the</strong> deposition <strong>of</strong> Wilcox<br />
Group sediments (Galloway and o<strong>the</strong>rs,<br />
1991). Changes in relative plate motions<br />
produced uplifts in <strong>the</strong> sou<strong>the</strong>rn Rocky<br />
Mountains that supplied voluminous<br />
amounts <strong>of</strong> sediment to <strong>the</strong> Gulf <strong>of</strong> Mexico<br />
Basin at about 60 Ma and 55 Ma. The<br />
shift in <strong>the</strong> locus <strong>of</strong> primary sedimentation<br />
from <strong>the</strong> Houston Embayment to<br />
<strong>the</strong> Rio Grande Embayment was <strong>the</strong><br />
result <strong>of</strong> a shift in <strong>the</strong> locus <strong>of</strong> uplift in<br />
<strong>the</strong> sou<strong>the</strong>rn Rocky Mountains.<br />
Eustatic changes in sea level produced<br />
regional flooding surfaces that can<br />
be traced along <strong>the</strong> <strong>Texas</strong> coast. They<br />
are particularly useful for correlation<br />
purposes and for placing Wilcox Group<br />
rocks in a sequence stratigraphic context.<br />
Short-term fluctuations in eustatic sea<br />
level may overprint first-order genetic<br />
stratigraphic sequences, but <strong>the</strong>ir signature,<br />
if present, is obscure (Galloway,<br />
1989b).<br />
Local deformation <strong>of</strong> Jurassic salt<br />
deposits in <strong>the</strong> form <strong>of</strong> salt diapirs<br />
influenced topography and, <strong>the</strong>refore,<br />
deposition <strong>of</strong> Wilcox strata (Seni and<br />
Jackson, 1983), especially in East <strong>Texas</strong>.<br />
Local deformation in southwest <strong>Texas</strong><br />
in <strong>the</strong> Rio Grande Embayment was <strong>the</strong><br />
product <strong>of</strong> rapid deformation <strong>of</strong> sandrich<br />
sediment on shale-rich prodelta<br />
muds, producing growth faulting and<br />
shale diapirs.<br />
<strong>Texas</strong> Water Development Board <strong>Report</strong> <strong>374</strong> 29
The deltaic sediments <strong>of</strong> <strong>the</strong> Paleocene<br />
and Eocene Wilcox Group closely<br />
resemble those <strong>of</strong> <strong>the</strong> Holocene Mississippi<br />
Delta System (Galloway and o<strong>the</strong>rs,<br />
1991). This analog allows for a comparison<br />
between <strong>the</strong> two systems in terms <strong>of</strong><br />
geohydrology and is a possible area for<br />
future research.<br />
Cenozoic strata <strong>of</strong> <strong>the</strong> Gulf <strong>of</strong> Mexico<br />
Basin are possibly <strong>the</strong> most studied<br />
deposits in <strong>the</strong> world. As such, <strong>the</strong>re<br />
is a great deal <strong>of</strong> information from oil<br />
and gas studies that can be <strong>of</strong> use to <strong>the</strong><br />
water resource research occurring at<br />
more updip locations around <strong>the</strong> basin.<br />
Information on porosity and permeability<br />
from electric logs and o<strong>the</strong>r studies<br />
could help in refining groundwater<br />
availability models <strong>of</strong> <strong>the</strong> <strong>Texas</strong> Water<br />
Development Board. One such study<br />
already completed looked at <strong>the</strong> relationships<br />
between Carrizo deposition and<br />
<strong>the</strong> groundwater flow systems in South<br />
<strong>Texas</strong> (Hamlin, 1988).<br />
2.7<br />
References<br />
Ayers, W.B., Jr., and Lewis, A.H., 1985, The Wilcox Group and Carrizo Sand (Paleogene)<br />
in east-central <strong>Texas</strong>—Depositional systems and deep-basin lignite: University <strong>of</strong><br />
<strong>Texas</strong> at Austin, Bureau <strong>of</strong> Economic Geology, 19 p. + 30 pl.<br />
Bebout, D.G., Loucks, R.G., and Gregory, A.R., 1978, Frio sandstone reservoirs in <strong>the</strong><br />
deep subsurface along <strong>the</strong> <strong>Texas</strong> Gulf Coast: University <strong>of</strong> <strong>Texas</strong> at Austin, Bureau<br />
<strong>of</strong> Economic Geology <strong>Report</strong> <strong>of</strong> Investigations No. 91, 92 p.<br />
Bebout, D.G., Weise, B.R., Gregory, A.R., and Edwards, M.B., 1982, Wilcox sandstone<br />
reservoirs in <strong>the</strong> deep subsurface along <strong>the</strong> <strong>Texas</strong> Gulf Coast—Their potential for<br />
production <strong>of</strong> geopressured geo<strong>the</strong>rmal energy: University <strong>of</strong> <strong>Texas</strong> at Austin, Bureau<br />
<strong>of</strong> Economic Geology <strong>Report</strong> <strong>of</strong> Investigations No. 117, 125 p.<br />
Bradshaw, B.E., and Watkins, J.S., 1994, Growth-fault evolution in <strong>of</strong>fshore <strong>Texas</strong>: Gulf<br />
Coast Association <strong>of</strong> Geological Societies Transactions, v. 44, p. 103–110.<br />
Bruce, C.H., 1973, Pressured shale and related sediment deformation—Mechanism for<br />
development <strong>of</strong> regional contemporaneous faults: American Association <strong>of</strong> Petroleum<br />
Geologists Bulletin, v. 57, p. 878–886.<br />
Buffler, R.T., 1991, Seismic stratigraphy <strong>of</strong> <strong>the</strong> deep Gulf <strong>of</strong> Mexico Basin and adjacent<br />
margins, in Salvador, A., ed., The geology <strong>of</strong> North America—The Gulf <strong>of</strong> Mexico<br />
Basin: Boulder, Colo., Geological Society <strong>of</strong> America, v. J., p. 353–387.<br />
Byerly, G.R., 1991, Nature <strong>of</strong> igneous activity, in Salvador, A., ed., The geology <strong>of</strong> North<br />
America—The Gulf <strong>of</strong> Mexico Basin: Boulder, Colo., Geological Society <strong>of</strong> America,<br />
v. J., p. 91–108.<br />
Chapin, C.E., and Ca<strong>the</strong>r, S.M., 1981, Eocene tectonics and sedimentation in <strong>the</strong> Colorado<br />
plateau–Rocky Mountain area, in Dickinson, W.R., and Payne, W.D., eds., Relations<br />
<strong>of</strong> tectonics to ore deposits in <strong>the</strong> sou<strong>the</strong>rn Cordillera: Arizona Geological Society<br />
Digest, v. 14, p. 173–198.<br />
30 <strong>Texas</strong> Water Development Board <strong>Report</strong> <strong>374</strong>
Coleman, J.M., and Gagliano, S.M., 1964, Cyclic sedimentation in <strong>the</strong> Mississippi River<br />
deltaic plain: Gulf Coast Association <strong>of</strong> Geological Societies Transactions, v. 14, p.<br />
67–80.<br />
Coney, P.J., 1972, Cordilleran tectonics and North America plate motion: American<br />
Journal <strong>of</strong> Science, v. 272, p. 603–628.<br />
Culotta, R., Latham, T., Sydow, M., Oliver, J., Brown, L., and Kaufman, S., 1992, Deep<br />
structure <strong>of</strong> <strong>the</strong> <strong>Texas</strong> Gulf passive margin and its Ouachita–Precambrian basement—Results<br />
<strong>of</strong> <strong>the</strong> COCORP San Marcos Arch survey: American Association <strong>of</strong><br />
Petroleum Geologists Bulletin, v. 76, no. 2, p. 270–283.<br />
Diegel, F.A., Karlo, J.F., Schuster, D.C., Shoup, R.C., and Tauvers, P.R., 1995, Cenozoic<br />
structural evolution and tectono-stratigraphic framework <strong>of</strong> <strong>the</strong> nor<strong>the</strong>rn Gulf<br />
Coast continental margin, in Jackson, M.P.A., and o<strong>the</strong>rs, eds., Salt tectonics—A<br />
global perspective: American Association <strong>of</strong> Petroleum Geologists Memoir 65, p.<br />
109–151.<br />
Edwards, M.B., 1981, The <strong>Upper</strong> Wilcox Rosita Delta System <strong>of</strong> south <strong>Texas</strong>—Record<br />
<strong>of</strong> growth-faulted shelf-edge deltas: American Association <strong>of</strong> Petroleum Geologists<br />
Bulletin, v. 65, p. 54–73.<br />
Engebretson, D.C., Cox, A., and Gordon, R.G., 1985, Relative motions between oceanic<br />
and continental plates in <strong>the</strong> Pacific basin: Geological Society <strong>of</strong> America Special<br />
Paper 206, p. 59.<br />
Ewing, T.E., 1983, Growth faults and salt tectonics in <strong>the</strong> Houston diaper province—<br />
Relative timing and exploration significance: Gulf Coast Association <strong>of</strong> Geological<br />
Societies Transactions, v. 33, p. 83–90.<br />
Ewing, T.E., 1986, Structural styles <strong>of</strong> <strong>the</strong> Wilcox and Frio growth-fault trends in <strong>Texas</strong>—<br />
Constraints on geopressured reservoirs: University <strong>of</strong> <strong>Texas</strong> at Austin, Bureau <strong>of</strong><br />
Economic Geology <strong>Report</strong> <strong>of</strong> Investigations 154, 86 p.<br />
Ewing, T.E., 1988, Structural variation <strong>of</strong> “growth fault” structural styles in <strong>the</strong> <strong>Texas</strong><br />
Gulf Coast Basin: Gulf Coast Association <strong>of</strong> Geological Societies Transactions, v.<br />
38, p. 579.<br />
Ewing, T.E., 1990, Tectonic map <strong>of</strong> <strong>Texas</strong>: University <strong>of</strong> <strong>Texas</strong> at Austin, Bureau <strong>of</strong><br />
Economic Geology, scale 1:750:000.<br />
Ewing, T.E., 1991, Structural framework, in Salvador, A., ed., The geology <strong>of</strong> North<br />
America—<strong>the</strong> Gulf <strong>of</strong> Mexico Basin: Boulder, Colo., Geological Society <strong>of</strong> America,<br />
v. J, p. 31–52.<br />
Fiduk, J.C., and Hamilton, D.S., 1995, Seismic analysis <strong>of</strong> <strong>the</strong> Duval County Ranch area,<br />
south <strong>Texas</strong>—Assessment <strong>of</strong> exploration potential <strong>of</strong> <strong>the</strong> Wilcox, Queen City, and<br />
Jackson-Yegua plays: University <strong>of</strong> <strong>Texas</strong> at Austin, Bureau <strong>of</strong> Economic Geology<br />
Geological Circular 95-4, 42 p.<br />
Fiduk, J.C., Anderson, L.E., and Rowan, M.G., 2004, Extensional rafting—A new idea<br />
for structural control <strong>of</strong> shelf margin and slope facies deposition in <strong>Upper</strong> Wilcox<br />
strata <strong>of</strong> south <strong>Texas</strong>, northwestern onshore Gulf <strong>of</strong> Mexico: Gulf Coast Association<br />
<strong>of</strong> Geological Societies Transactions, v. 54, p. 185–193.<br />
Fisher, W.L., and McGowen, J.H., 1967, Depositional systems in <strong>the</strong> Wilcox Group <strong>of</strong><br />
<strong>Texas</strong> and <strong>the</strong>ir relationship to occurrence <strong>of</strong> oil and gas: Gulf Coast Association <strong>of</strong><br />
Geological Societies Transactions, v. 17, p. 105–125.<br />
<strong>Texas</strong> Water Development Board <strong>Report</strong> <strong>374</strong> 31
Fryar, D., Senger, R., Deeds, N., Pickens, J., Whallon, A., and Dean, K., 2003, Groundwater<br />
availability model for <strong>the</strong> nor<strong>the</strong>rn Carrizo-Wilcox Aquifer: Prepared for <strong>the</strong><br />
<strong>Texas</strong> Water Development Board, January 2003, 529 p.<br />
Galloway, W.E., 1968, Depositional systems <strong>of</strong> <strong>the</strong> Lower Wilcox Group, north-central<br />
Gulf Coast Basin: Gulf Coast Association <strong>of</strong> Geological Societies Transactions, v.<br />
18, p. 275–289.<br />
Galloway, W.E., 1982, Depositional architecture <strong>of</strong> Cenozoic Gulf <strong>Coastal</strong> Plain fluvial<br />
systems: University <strong>of</strong> <strong>Texas</strong> at Austin, Bureau <strong>of</strong> Economic Geology Geological<br />
Circular 82-5, 29 p.<br />
Galloway, W.E., 1989a, Genetic stratigraphic sequences in basin analysis I—Architecture<br />
and genesis <strong>of</strong> flooding-surface bounded depositional units: American Association<br />
<strong>of</strong> Petroleum Geologists Bulletin, v. 73, p. 125–142.<br />
Galloway, W.E., 1989b, Genetic stratigraphic sequences in basin analysis II—Application<br />
to northwest Gulf <strong>of</strong> Mexico Cenozoic basin: American Association <strong>of</strong> Petroleum<br />
Geologists Bulletin, v. 73, p. 143–154.<br />
Galloway, W.E., 2005, Gulf <strong>of</strong> Mexico Basin depositional record <strong>of</strong> Cenozoic North<br />
American drainage basin evolution: International Association <strong>of</strong> Sedimentologists<br />
Special Publication 35, p. 409–423.<br />
Galloway, W.E., Hobday, D.K., and Magara, K., 1982, Frio Formation <strong>of</strong> <strong>the</strong> <strong>Texas</strong> Gulf<br />
Coast basin—Depositional systems, structural framework, and hydrocarbon origin,<br />
migration, distribution, and exploration potential: University <strong>of</strong> <strong>Texas</strong> at Austin,<br />
Bureau <strong>of</strong> Economic Geology <strong>Report</strong> <strong>of</strong> Investigations 122, 78 p.<br />
Galloway, W.E., Bebout, D.G., Fisher, W.L., Cabrera-Castro, R., Lugo-Rivera, J.E., and<br />
Scott, T.M., 1991, Cenozoic, in Salvador, A., ed., The geology <strong>of</strong> North America—<br />
<strong>the</strong> Gulf <strong>of</strong> Mexico Basin: Boulder, Colo., Geological Society <strong>of</strong> America, v. J, p.<br />
245–324.<br />
Galloway, W.E., Ganey-Curry, P.E., Li, X., and Buffler, R.T., 2000, Cenozoic depositional<br />
history <strong>of</strong> <strong>the</strong> Gulf <strong>of</strong> Mexico Basin: American Association <strong>of</strong> Petroleum Geologists<br />
Bulletin, v. 84, no. 11, p. 1743–1774.<br />
Halbouty, M.T., 1966, Stratigraphic-trap possibilities in upper Jurassic rocks, San Marcos<br />
Arch, <strong>Texas</strong>: American Association <strong>of</strong> Petroleum Geologists Bulletin, v. 50, no.<br />
1, p. 3–24.<br />
Halbouty, M.T., and Halbouty, J.J., 1982, Relationships between East <strong>Texas</strong> field region<br />
and Sabine Uplift in <strong>Texas</strong>: American Association <strong>of</strong> Petroleum Geologists Bulletin,<br />
v. 66, no. 8, p. 1042–1054.<br />
Hamlin, H.S., 1988, Depositional and ground-water flow systems <strong>of</strong> <strong>the</strong> Carrizo–<strong>Upper</strong><br />
Wilcox, south <strong>Texas</strong>: University <strong>of</strong> <strong>Texas</strong> at Austin, Bureau <strong>of</strong> Economic Geology<br />
<strong>Report</strong> <strong>of</strong> Investigations 175, 61 p.<br />
Huh, S., Watkins, J.S., Kadande, R., Fiduk, R., Bryand, S., Silver, K.E., Bradshaw, B.E.,<br />
Xue, F., and Xi, J., 1996, Regional structure and tectonics <strong>of</strong> <strong>the</strong> <strong>Texas</strong> shelf, in Jones,<br />
J.O. and Freed, R.L., eds., Structural framework <strong>of</strong> <strong>the</strong> nor<strong>the</strong>rn Gulf <strong>of</strong> Mexico: Gulf<br />
Coast Association <strong>of</strong> Geological Societies Special Publication 80, p. 39–52.<br />
Jackson, M.P.A., 1982, Fault tectonics <strong>of</strong> <strong>the</strong> East <strong>Texas</strong> Basin: University <strong>of</strong> <strong>Texas</strong> at<br />
Austin, Bureau <strong>of</strong> Economic Geology Geological Circular 82-4, 31 p.<br />
32 <strong>Texas</strong> Water Development Board <strong>Report</strong> <strong>374</strong>
Jackson, M.P.A., and Seni, S.J., 1983, Fault geometry and evolution <strong>of</strong> salt structures in<br />
a marginal rift basin <strong>of</strong> <strong>the</strong> Gulf <strong>of</strong> Mexico, East <strong>Texas</strong>: Geology, v. 11, p. 131–135.<br />
Jackson, M.L.W., and Laubach, S.E., 1988, Cretaceous and Tertiary tectonics as cause<br />
<strong>of</strong> Sabine Arch, eastern <strong>Texas</strong> and northwestern Louisiana: GCAGS Transactions<br />
v. 38, p. 245–256.<br />
Jackson, M.P.A., Rowan, M.G., and Trudgill, B.D., 2003, Salt-related fault families and<br />
fault welds in <strong>the</strong> nor<strong>the</strong>rn Gulf <strong>of</strong> Mexico: University <strong>of</strong> <strong>Texas</strong> at Austin, Bureau <strong>of</strong><br />
Economic Geology <strong>Report</strong> <strong>of</strong> Investigations No. 268, 40 p.<br />
Kaiser, W.R., 1978. Depositional systems in <strong>the</strong> Wilcox Group (Eocene) <strong>of</strong> east-central<br />
<strong>Texas</strong> and <strong>the</strong> occurrence <strong>of</strong> lignite, in Kaiser, W.R., ed.,1976 Gulf Coast Lignite<br />
Conference—Geology, utilization, and environmental aspects, Proceedings: University<br />
<strong>of</strong> <strong>Texas</strong> at Austin, Bureau <strong>of</strong> Economic Geology <strong>Report</strong> <strong>of</strong> Investigations<br />
No. 90, p. 33–53.<br />
Kelley, V., Deeds, N., Fryar, D., Nicot, J.-P., Jones, T., Dutton, A.R., Bruehl, G., Unger-<br />
Holtz, T., and Machin, J., 2004, Groundwater availability models for <strong>the</strong> Queen City<br />
and Sparta <strong>Aquifers</strong>: Prepared for <strong>the</strong> <strong>Texas</strong> Water Development Board by INTERA<br />
Inc. and University <strong>of</strong> <strong>Texas</strong> at Austin, Bureau <strong>of</strong> Economic Geology, 770 p.<br />
Larkin, T.J., and Bomar, G.W., 1983, Climatic atlas <strong>of</strong> <strong>Texas</strong>: Department <strong>of</strong> Water<br />
Resources, <strong>Report</strong> LP-192, 151 p.<br />
McDonnell, A., Loucks, R.G., and Galloway, W.E., 2008, Paleocene to Eocene deepwater<br />
slope canyons, western Gulf <strong>of</strong> Mexico—fur<strong>the</strong>r insights for <strong>the</strong> provenance<br />
<strong>of</strong> deep-water <strong>of</strong>fshore Wilcox Group plays: American Association <strong>of</strong> Petroleum<br />
Geologists Bulletin, v. 92, no. 9, p. 1169–1189.<br />
Miller, S.K., 1989, Genetic stratigraphic sequence analysis <strong>of</strong> <strong>the</strong> upper Wilcox, Gulf<br />
Basin, <strong>Texas</strong>: Austin, Tex., University <strong>of</strong> <strong>Texas</strong> at Austin, Master’s <strong>the</strong>sis, 127 p.<br />
Moody, C.L., 1931, Tertiary history <strong>of</strong> region <strong>of</strong> <strong>the</strong> Sabine Uplift, Louisiana: American<br />
Association <strong>of</strong> Petroleum Geologists Bulletin v. 15, p. 531–551.<br />
Murray, G.E., Jr., and Thomas, E.P., 1945, Midway-Wilcox surface stratigraphy <strong>of</strong> Sabine<br />
Uplift, Louisiana and <strong>Texas</strong>: American Association <strong>of</strong> Petroleum Geologists Bulletin,<br />
v. 29, no. 1, p. 45–70.<br />
Peel, F.J., Travis, C.J., and Hossack, J.R., 1995, Genetic structural provinces and salt<br />
tectonics <strong>of</strong> <strong>the</strong> Cenozoic <strong>of</strong>fshore U.S. Gulf <strong>of</strong> Mexico—A preliminary analysis, in<br />
Jackson, M.P.A., and o<strong>the</strong>rs, eds., Salt tectonics—A global perspective: American<br />
Association <strong>of</strong> Petroleum Geologists Memoir 65, p. 153–175.<br />
Plummer, F.B., 1933, Cenozoic systems in <strong>Texas</strong>, in The geology <strong>of</strong> <strong>Texas</strong>, v. 1, stratigraphy:<br />
University <strong>of</strong> <strong>Texas</strong> Bulletin 3232, p. 519–818.<br />
Rose, P.R., 1972, Edwards Group, surface and subsurface, Central <strong>Texas</strong>: University <strong>of</strong><br />
<strong>Texas</strong> at Austin, Bureau <strong>of</strong> Economic Geology <strong>Report</strong> <strong>of</strong> Investigations 74, 198 p<br />
Rowan, M.G., Inman, K.F., and Fiduk, J.C., 2005, Oligocene–Miocene extension at <strong>the</strong><br />
Louann level in <strong>the</strong> nor<strong>the</strong>rn Gulf <strong>of</strong> Mexico—Kinematic models and examples: Gulf<br />
Coast Association <strong>of</strong> Geological Societies Transactions, v. 55, p. 724–732.<br />
Salvador, A., 1991, Origin and development <strong>of</strong> <strong>the</strong> Gulf <strong>of</strong> Mexico Basin, in Salvador, A.,<br />
ed., The geology <strong>of</strong> North America—<strong>the</strong> Gulf <strong>of</strong> Mexico Basin, v. J., p. 389–444.<br />
<strong>Texas</strong> Water Development Board <strong>Report</strong> <strong>374</strong> 33
Seni, S.J., and Jackson, M.P.A., 1983, Evolution <strong>of</strong> salt structures, East <strong>Texas</strong> Diapir Province,<br />
part 1—Sedimentary record <strong>of</strong> halokinesis: American Association <strong>of</strong> Petroleum<br />
Geologists Bulletin v. 67, no. 8, p. 1219–1244.<br />
TWDB (<strong>Texas</strong> Water Development Board), 2007, Water for <strong>Texas</strong>, Volume 2: <strong>Texas</strong><br />
Water Development Board, 392 p.<br />
USGS (U.S. Geological Survey) and TWDB (<strong>Texas</strong> Water Development Board), 2006,<br />
Digital Geologic Atlas <strong>of</strong> <strong>Texas</strong>: U.S. Geological Survey and <strong>Texas</strong> Water Development<br />
Board, available through <strong>the</strong> <strong>Texas</strong> Natural Resources Information System,<br />
www.tnris.state.tx.us.<br />
Watkins, J.S., Bradshaw, B.E., Huh, S., Li, R., and Zhang, J., 1996, Structure and distribution<br />
<strong>of</strong> growth faults in <strong>the</strong> nor<strong>the</strong>rn Gulf <strong>of</strong> Mexico: Gulf Coast Association <strong>of</strong><br />
Geological Societies Transactions, v. 46, p. 63–77.<br />
Wermund, E.G., 1996, Physiographic map <strong>of</strong> <strong>Texas</strong>: University <strong>of</strong> <strong>Texas</strong> at Austin, Bureau<br />
<strong>of</strong> Economic Geology, 1 pl.<br />
Winker, C.D., 1982, Cenozoic shelf margins, northwest Gulf <strong>of</strong> Mexico: Gulf Coast<br />
Association <strong>of</strong> Geological Societies Transactions, v. 32, p. 427–448.<br />
Worrall, D.M., and Snelson, S., 1989, Evolution <strong>of</strong> <strong>the</strong> nor<strong>the</strong>rn Gulf <strong>of</strong> Mexico, with<br />
emphasis on Cenozoic growth faulting and <strong>the</strong> role <strong>of</strong> salt, in Bally, A.W., and Palmer,<br />
A.R., eds., The geology <strong>of</strong> North America—An overview: Geological Society <strong>of</strong><br />
America Decade <strong>of</strong> North American Geology, v. A, p. 97–138.<br />
Xue, L., 1997, Depositional cycles and evolution <strong>of</strong> <strong>the</strong> Paleogene Wilcox strata, Gulf<br />
<strong>of</strong> Mexico Basin, <strong>Texas</strong>: American Association <strong>of</strong> Petroleum Geologists Bulletin, v.<br />
81, no. 6, p. 937–953.<br />
Xue, L., and Galloway, W.E., 1995, High-resolution depositional framework <strong>of</strong> <strong>the</strong> Paleocene<br />
middle Wilcox strata, <strong>Texas</strong> <strong>Coastal</strong> Plain: American Association <strong>of</strong> Petroleum<br />
Geologists Bulletin, v. 79, p. 205–230.<br />
Young, K., 1972, Mesozoic history, Llano region, in Barnes, V.E., and o<strong>the</strong>rs, eds., Geology<br />
<strong>of</strong> <strong>the</strong> Llano region and Austin area, field excursion: University <strong>of</strong> <strong>Texas</strong> at Austin,<br />
Bureau <strong>of</strong> Economic Geology Guidebook 13, 77 p.<br />
Zarra, L., 2007, Chronostratigraphic framework for <strong>the</strong> Wilcox Formation (upper Paleocene–lower<br />
Eocene) in <strong>the</strong> deep-water Gulf <strong>of</strong> Mexico—Biostratigraphy, sequences,<br />
and depositional systems: 27th Annual Gulf Coast Section SEPM Bob F. Perkins<br />
Research Conference, p. 81–145.<br />
34 <strong>Texas</strong> Water Development Board <strong>Report</strong> <strong>374</strong>
Chapter 3<br />
Hydrogeology <strong>of</strong> <strong>the</strong> Carrizo-Wilcox Aquifer<br />
Neil E. Deeds 1 , Dennis Fryar 1 , Alan Dutton 2 , and Jean-Philippe Nicot 3<br />
The Carrizo-Wilcox Aquifer is composed<br />
<strong>of</strong> hydraulically connected<br />
sands from <strong>the</strong> Wilcox Group and <strong>the</strong><br />
Carrizo Formation (Ashworth and<br />
Hopkins, 1995). The aquifer extends<br />
from nor<strong>the</strong>ast Mexico across <strong>Texas</strong>,<br />
from <strong>the</strong> Rio Grande in <strong>the</strong> southwest<br />
to <strong>the</strong> Sabine River in <strong>the</strong> nor<strong>the</strong>ast,<br />
and into Louisiana and Arkansas (Figure<br />
3-1 shows <strong>the</strong> extent <strong>of</strong> <strong>the</strong> aquifer<br />
in <strong>Texas</strong>). The Carrizo-Wilcox Aquifer<br />
is classified as a major aquifer in<br />
<strong>Texas</strong> (Ashworth and Hopkins, 1995),<br />
ranking third in <strong>the</strong> state for water use<br />
(450,000 acre-feet per year) in 2003,<br />
behind <strong>the</strong> Gulf Coast Aquifer and <strong>the</strong><br />
Ogallala Aquifer (TWDB, 2007). The<br />
Carrizo-Wilcox Aquifer provides water<br />
to all or parts <strong>of</strong> 60 <strong>Texas</strong> counties, with<br />
<strong>the</strong> greatest historical use being in and<br />
around <strong>the</strong> Tyler, Lufkin-Nacogdoches,<br />
and Bryan-College Station metropolitan<br />
centers and in <strong>the</strong> Winter Garden<br />
region <strong>of</strong> South <strong>Texas</strong> (Ashworth and<br />
Hopkins, 1995).<br />
Comprehensive regional hydrogeologic<br />
descriptions <strong>of</strong> <strong>the</strong> Carrizo-Wilcox<br />
Aquifer were provided in <strong>the</strong> development<br />
<strong>of</strong> <strong>the</strong> conceptual models for <strong>the</strong><br />
three groundwater availability models <strong>of</strong><br />
<strong>the</strong> aquifer commissioned by <strong>the</strong> <strong>Texas</strong><br />
Water Development Board (TWDB) in<br />
2001 (Deeds and o<strong>the</strong>rs, 2003; Dutton<br />
and o<strong>the</strong>rs, 2003; Fryar and o<strong>the</strong>rs, 2003).<br />
These studies considered <strong>the</strong> sou<strong>the</strong>rn,<br />
central, and nor<strong>the</strong>rn portions <strong>of</strong> <strong>the</strong><br />
aquifer and built on <strong>the</strong> considerable<br />
existing literature describing <strong>the</strong> geology<br />
and hydrogeology <strong>of</strong> <strong>the</strong> Carrizo-Wilcox<br />
at various locations and scales.<br />
This chapter provides a combined<br />
summary <strong>of</strong> those hydrogeologic descriptions,<br />
along with some new analyses <strong>of</strong><br />
<strong>the</strong> aquifer as a whole. Some simulated<br />
results are presented in <strong>the</strong> current work,<br />
based on <strong>the</strong> updated Carrizo-Wilcox<br />
groundwater availability models that<br />
contain <strong>the</strong> Queen City and Sparta aquifers<br />
(Kelley and o<strong>the</strong>rs, 2004).<br />
3.1 Geology<br />
The sediments that form <strong>the</strong> Carrizo-<br />
Wilcox Aquifer are part <strong>of</strong> a gulfward<br />
thickening wedge <strong>of</strong> Cenozoic sediments<br />
deposited in <strong>the</strong> Rio Grande<br />
and Houston embayments <strong>of</strong> <strong>the</strong> Gulf<br />
Coast Basin. Deposition in <strong>the</strong> Rio<br />
Grande Embayment was influenced by<br />
regional subsidence, episodes <strong>of</strong> sediment<br />
inflow from areas outside <strong>of</strong> <strong>the</strong><br />
Gulf <strong>Coastal</strong> Plain, and eustatic sea<br />
level change (Grubb, 1997). Galloway<br />
and o<strong>the</strong>rs (1994) characterized Cenozoic<br />
sequences in <strong>the</strong> Gulf Coast in <strong>the</strong><br />
following three ways: (1) Deposition <strong>of</strong><br />
Cenozoic sequences is characterized as<br />
an <strong>of</strong>flapping progression <strong>of</strong> successive,<br />
basinward thickening wedges. (2) These<br />
depositional wedges aggraded <strong>the</strong> continental<br />
platform and prograded <strong>the</strong><br />
shelf margin and continental slope from<br />
<strong>the</strong> Cretaceous shelf edge to <strong>the</strong> current<br />
<strong>Texas</strong> coastline. (3) Deposition occurred<br />
along sand-rich, continental margin<br />
deltaic depocenters within embayments<br />
and was modified by growth faults and<br />
salt dome development.<br />
Figure 3-2 shows a representative<br />
stratigraphic section for <strong>the</strong> study area.<br />
Minor changes in nomenclature and<br />
<strong>the</strong> nature <strong>of</strong> various formations occur<br />
across <strong>the</strong> state. In South <strong>Texas</strong>, <strong>the</strong> Carrizo-Wilcox<br />
Aquifer overlies <strong>the</strong> Midway<br />
1 INTERA, Incorporated<br />
2 The University <strong>of</strong> <strong>Texas</strong> at San Antonio<br />
3 Bureau <strong>of</strong> Economic Geology, Jackson School <strong>of</strong><br />
Geosciences, The University <strong>of</strong> <strong>Texas</strong> at Austin<br />
<strong>Texas</strong> Water Development Board <strong>Report</strong> <strong>374</strong> 35
0 25 50<br />
Miles<br />
Carrizo-Wilcox outcrop<br />
Carrizo-Wilcox downdip<br />
N<br />
State line<br />
Gulf <strong>of</strong> Mexico<br />
Counties<br />
Figure 3-1. Location <strong>of</strong> Carrizo-Wilcox Aquifer in <strong>Texas</strong>.<br />
Figure 1.<br />
Location <strong>of</strong> Carrizo-Wilcox Aquifer in <strong>Texas</strong>.<br />
Group, which is composed <strong>of</strong> marine<br />
clays. This portion <strong>of</strong> <strong>the</strong> aquifer consists<br />
<strong>of</strong> fluvial-deltaic sediments <strong>of</strong> <strong>the</strong> upper<br />
Paleocene and lower Eocene Wilcox<br />
Group Band Carrizo Sand. The Wilcox<br />
Group is subdivided into a lower, middle,<br />
and upper unit. The Lower Wilcox<br />
36 <strong>Texas</strong> Water Development Board <strong>Report</strong> <strong>374</strong><br />
is composed <strong>of</strong> sands and clays deposited<br />
in a barrier bar and lagoon-bay system<br />
(Fisher and McGowen, 1967). The Middle<br />
Wilcox is not generally subdivided<br />
in <strong>the</strong> south but is typically described<br />
as a lower energy depositional sequence<br />
representative <strong>of</strong> a minor transgression.<br />
30
The Carrizo Sand in <strong>the</strong> outcrop and<br />
shallow subsurface correlates with <strong>the</strong><br />
upper part <strong>of</strong> <strong>the</strong> Wilcox Group in <strong>the</strong><br />
deeper subsurface (Bebout and o<strong>the</strong>rs,<br />
1982; Hamlin, 1988). The Carrizo-<strong>Upper</strong><br />
Wilcox predominantly consists <strong>of</strong> a fluvial<br />
sand facies that grades into more<br />
deltaic and marine facies far<strong>the</strong>r downdip<br />
(Bebout and o<strong>the</strong>rs, 1982). South<br />
and west <strong>of</strong> <strong>the</strong> Frio River, <strong>the</strong> Wilcox is<br />
sometimes referred to as <strong>the</strong> Indio Formation<br />
and is composed <strong>of</strong> irregularly<br />
bedded sandstone and shale.<br />
Between <strong>the</strong> Colorado and Trinity<br />
rivers, <strong>the</strong> Wilcox Group is formally<br />
subdivided into <strong>the</strong> Hooper, <strong>the</strong> Simsboro,<br />
and <strong>the</strong> Calvert Bluff formations,<br />
corresponding to deltaic, fluvial, and<br />
fluvial-deltaic facies, respectively, which<br />
occur throughout east-central <strong>Texas</strong><br />
(Kaiser, 1974). The Hooper Formation<br />
represents <strong>the</strong> initial progradation <strong>of</strong><br />
<strong>the</strong> Wilcox Group fluvial-deltaic systems<br />
into <strong>the</strong> Houston Embayment <strong>of</strong><br />
<strong>the</strong> Gulf <strong>of</strong> Mexico Basin and consists<br />
<strong>of</strong> interbedded shale and sandstones in<br />
subequal amounts, with minor amounts<br />
<strong>of</strong> lignite. The Simsboro Formation is<br />
predominantly a sand-rich formation<br />
composed <strong>of</strong> a multistory, multilateral<br />
sand deposit (Henry and o<strong>the</strong>rs, 1980).<br />
The Calvert Bluff consists mainly <strong>of</strong> lowpermeability<br />
clays and lignite deposits<br />
(Ayers and Lewis, 1985), which function<br />
like confining layers that retard <strong>the</strong><br />
vertical movement <strong>of</strong> water within <strong>the</strong><br />
Carrizo-Wilcox Aquifer across <strong>the</strong> study<br />
area.<br />
In <strong>the</strong> Sabine Uplift area east <strong>of</strong> <strong>the</strong><br />
Trinity River, <strong>the</strong> Simsboro Formation<br />
is no longer identifiable, and <strong>the</strong> Wilcox<br />
Group is divided informally into a<br />
lower and an upper unit (Kaiser, 1990).<br />
The Lower Wilcox represents <strong>the</strong> facies<br />
equivalent <strong>of</strong> <strong>the</strong> Hooper Formation, and<br />
<strong>the</strong> <strong>Upper</strong> Wilcox includes both <strong>of</strong> <strong>the</strong><br />
Simsboro and <strong>the</strong> Calvert Bluff equivalent<br />
fluvial and fluvial-deltaic facies,<br />
respectively (Kaiser, 1990). The Carrizo<br />
Sand unconformably overlies <strong>the</strong> Wilcox<br />
Group and is separated from <strong>the</strong> Wilcox<br />
by a thin regional marine-transgressive<br />
unit, which is included as an informal<br />
member in <strong>the</strong> <strong>Upper</strong> Wilcox (Kaiser,<br />
1990). The Carrizo Sand is composed primarily<br />
<strong>of</strong> relatively homogenous fluvial<br />
Figure 3-2. Generalized stratigraphic section for <strong>the</strong> Carrizo-Wilcox aquifer in <strong>Texas</strong> (after Ayers and<br />
Lewis, 1985; Hamlin, 1988; Kaiser and o<strong>the</strong>rs, 1978).<br />
Fm= formation<br />
<strong>Texas</strong> Water Development Board <strong>Report</strong> <strong>374</strong> 37
sands and only locally in <strong>the</strong> nor<strong>the</strong>rnmost<br />
area contains a significant portion<br />
<strong>of</strong> interbedded muds. The Reklaw Formation<br />
consists <strong>of</strong> variable amounts <strong>of</strong> mud<br />
and sand and is considered <strong>the</strong> upper<br />
confining stratum <strong>of</strong> <strong>the</strong> Carrizo-Wilcox<br />
Aquifer. In <strong>the</strong> nor<strong>the</strong>astern study areas,<br />
<strong>the</strong> Reklaw clays become discontinuous,<br />
providing a more permeable connection<br />
between <strong>the</strong> Carrizo Sand and <strong>the</strong> overlying<br />
Queen City Formation. In Marion<br />
and Harrison counties, <strong>the</strong> combined<br />
Wilcox, Carrizo, Reklaw, and Queen City<br />
units are collectively referred to as <strong>the</strong><br />
Cypress Aquifer (Fogg and Kreitler, 1982).<br />
Above, <strong>the</strong> finer-grained Weches Formation<br />
separates <strong>the</strong> Queen City Sand from<br />
<strong>the</strong> overlying Sparta Sand that occurs<br />
only locally.<br />
3.2<br />
Hydrostratigraphy<br />
The Carrizo-Wilcox Aquifer consists <strong>of</strong><br />
fluvial-deltaic sediments <strong>of</strong> <strong>the</strong> upper<br />
Paleocene and lower Eocene Wilcox<br />
Group and Carrizo Sand. The aquifer<br />
is bounded below by marine deposits<br />
<strong>of</strong> <strong>the</strong> Midway Group and above by <strong>the</strong><br />
Reklaw and Bigford formations, which<br />
form a semi-confining unit between<br />
<strong>the</strong> Carrizo Sand and <strong>the</strong> Queen City<br />
Formation.<br />
In <strong>the</strong> portion <strong>of</strong> <strong>the</strong> aquifer stretching<br />
from <strong>the</strong> Rio Grande to <strong>the</strong> Colorado<br />
River, <strong>the</strong> Wilcox Group is subdivided<br />
into a Lower, Middle, and <strong>Upper</strong> Wilcox.<br />
The <strong>Upper</strong> Wilcox in <strong>the</strong> deeper<br />
subsurface is correlated to <strong>the</strong> Carrizo<br />
Formation in <strong>the</strong> outcrop (Bebout and<br />
o<strong>the</strong>rs, 1982; Hamlin, 1988). Bebout and<br />
o<strong>the</strong>rs (1982) mapped <strong>the</strong> lower contact<br />
<strong>of</strong> <strong>the</strong> <strong>Upper</strong> Wilcox based on <strong>the</strong> lower<br />
regional marker identified in geophysical<br />
logs by Fisher and McGowen (1967).<br />
Hamlin (1988) also combined <strong>the</strong> Carrizo<br />
and <strong>Upper</strong> Wilcox and mapped <strong>the</strong> base<br />
<strong>of</strong> <strong>the</strong> <strong>Upper</strong> Wilcox as a distinct facies<br />
change from a fluvial (bed-load channel<br />
system) and mixed alluvial facies in<br />
<strong>the</strong> <strong>Upper</strong> Wilcox to a predominantly<br />
marine facies (delta, prodelta) in <strong>the</strong><br />
Middle Wilcox. In comparison, Klemt<br />
and o<strong>the</strong>rs (1976) lithologically picked<br />
<strong>the</strong> base <strong>of</strong> <strong>the</strong> Carrizo Aquifer as <strong>the</strong><br />
top <strong>of</strong> <strong>the</strong> Wilcox Group by identifying<br />
<strong>the</strong> base <strong>of</strong> <strong>the</strong> major sand units <strong>of</strong> <strong>the</strong><br />
Carrizo Formation. The Carrizo Formation<br />
mapped by Klemt and o<strong>the</strong>rs (1976)<br />
correlates with <strong>the</strong> Carrizo Formation<br />
as mapped in Central <strong>Texas</strong> (Ayers and<br />
Lewis, 1985).<br />
The sou<strong>the</strong>rn portion <strong>of</strong> <strong>the</strong> Carrizo-<br />
Wilcox Aquifer is characterized by three<br />
distinct depositional systems, including<br />
a bed-load channel system, a mixed<br />
alluvial system, and a deltaic system<br />
(Hamlin, 1988). The bed-load channel<br />
system comprises <strong>the</strong> massive sand typically<br />
associated with <strong>the</strong> Carrizo Aquifer<br />
but also contains some sandy mud. The<br />
mixed alluvial system consists <strong>of</strong> interbedded<br />
sand and mud associated with<br />
channel sands and abandoned channel<br />
fill, levee and crevasse splay, floodplain,<br />
lacustrine, and delta-plain sediments.<br />
The deltaic system consists <strong>of</strong> delta-front<br />
sand, which changes to prodelta mud<br />
basinward. This change to marine facies<br />
was considered <strong>the</strong> boundary between<br />
<strong>the</strong> <strong>Upper</strong> and Middle Wilcox (Hamlin,<br />
1988). The Middle Wilcox includes<br />
several transgressive flooding events<br />
and consists <strong>of</strong> various deltaic facies<br />
that form a partial hydrologic barrier<br />
between <strong>the</strong> fluvial-deltaic sediments<br />
<strong>of</strong> <strong>the</strong> Lower Wilcox and <strong>the</strong> predominant<br />
fluvial system <strong>of</strong> <strong>the</strong> Carrizo-<strong>Upper</strong><br />
Wilcox (Galloway and o<strong>the</strong>rs, 1994). The<br />
Reklaw Formation above <strong>the</strong> Carrizo<br />
Sand corresponds to a more extensive<br />
transgressive flooding event and consists<br />
predominantly <strong>of</strong> marine mud, which<br />
grades in <strong>the</strong> southwestern part <strong>of</strong> <strong>the</strong><br />
study area to nonmarine mud and sands<br />
<strong>of</strong> <strong>the</strong> Bigford Formation.<br />
Between <strong>the</strong> Colorado and Trinity<br />
rivers, <strong>the</strong> Carrizo-Wilcox Aquifer<br />
is composed <strong>of</strong> four hydrostratigraphic<br />
units with distinct hydraulic properties:<br />
<strong>the</strong> Hooper, Simsboro, and Calvert Bluff<br />
formations <strong>of</strong> <strong>the</strong> Wilcox Group and <strong>the</strong><br />
Carrizo Sand <strong>of</strong> <strong>the</strong> Claiborne Group.<br />
38 <strong>Texas</strong> Water Development Board <strong>Report</strong> <strong>374</strong>
In general, <strong>the</strong> Simsboro and Carrizo<br />
formations contain thicker, more laterally<br />
continuous and more permeable<br />
sands and, <strong>the</strong>refore, are more important<br />
hydrostratigraphic units when determining<br />
groundwater availability. The Calvert<br />
Bluff and Hooper formations typically<br />
are made up <strong>of</strong> clay, silt, and sand mixtures,<br />
as well as lignite deposits. Because<br />
<strong>of</strong> <strong>the</strong>ir relatively low vertical permeability,<br />
<strong>the</strong> Hooper and Calvert Bluff formations<br />
act as leaky aquitards that confine<br />
fluid pressures in <strong>the</strong> Simsboro and Carrizo<br />
aquifers and restrict groundwater<br />
movement between <strong>the</strong> layers. Although<br />
<strong>the</strong> Hooper and Calvert Bluff formations<br />
contain sand units, <strong>the</strong>y are generally<br />
finer and less continuous than <strong>the</strong> sands<br />
<strong>of</strong> <strong>the</strong> Simsboro and Carrizo formations.<br />
Above <strong>the</strong> Carrizo Formation, <strong>the</strong> lowpermeability<br />
marine shale <strong>of</strong> <strong>the</strong> Reklaw<br />
Formation restricts vertical groundwater<br />
movement to <strong>the</strong> overlying Queen City<br />
Formation in <strong>the</strong> Claiborne Group.<br />
In <strong>the</strong> Sabine Uplift area east <strong>of</strong> <strong>the</strong><br />
Trinity River, <strong>the</strong> Simsboro Formation<br />
is no longer identifiable, and <strong>the</strong><br />
Wilcox Group is divided into informal<br />
lower and upper units. The Lower Wilcox<br />
represents <strong>the</strong> facies equivalent <strong>of</strong><br />
<strong>the</strong> Hooper Formation, and <strong>the</strong> <strong>Upper</strong><br />
Wilcox includes both <strong>the</strong> Simsboro and<br />
<strong>the</strong> Calvert Bluff equivalent fluvial and<br />
fluvial-deltaic facies, respectively (Kaiser,<br />
1990). Even though <strong>the</strong> structure and various<br />
sand maps in <strong>the</strong> Sabine Uplift area<br />
distinguish only <strong>the</strong> <strong>Upper</strong> and Lower<br />
Wilcox (Kaiser, 1990), a predominantly<br />
fluvial facies at <strong>the</strong> bottom and a fluvialdeltaic<br />
facies at <strong>the</strong> top can be identified<br />
within <strong>the</strong> <strong>Upper</strong> Wilcox, corresponding<br />
to <strong>the</strong> subdivision <strong>of</strong> <strong>the</strong> Wilcox Group<br />
in Central <strong>Texas</strong> as mapped by Ayers and<br />
Lewis (1985).<br />
The Carrizo Sand unconformably<br />
overlies <strong>the</strong> Wilcox Group and is separated<br />
from it by a thin regional marinetransgressive<br />
unit, which is included as<br />
an informal member in <strong>the</strong> <strong>Upper</strong> Wilcox<br />
(Kaiser, 1990). The Carrizo Sand<br />
is composed primarily <strong>of</strong> relatively<br />
homogenous fluvial sands and only<br />
locally in <strong>the</strong> nor<strong>the</strong>rnmost area contains<br />
a significant portion <strong>of</strong> interbedded<br />
muds. The Reklaw Formation consists <strong>of</strong><br />
variable amounts <strong>of</strong> mud and sand and<br />
is considered <strong>the</strong> confining strata <strong>of</strong> <strong>the</strong><br />
Carrizo-Wilcox Aquifer. However, in <strong>the</strong><br />
nor<strong>the</strong>astern part, <strong>the</strong> clay strata become<br />
more discontinuous making <strong>the</strong> Reklaw<br />
probably more pervious to vertical flow<br />
between <strong>the</strong> Carrizo and <strong>the</strong> overlying<br />
Queen City. In Marion and Harrison<br />
counties, <strong>the</strong> combined Wilcox, Carrizo,<br />
Reklaw, and Queen City units are<br />
referred to as <strong>the</strong> Cypress Aquifer (Fogg<br />
and Kreitler, 1982).<br />
3.3<br />
Structure<br />
Depositional patterns <strong>of</strong> Claiborne<br />
Group sedimentation were influenced<br />
by <strong>the</strong> tectonic evolution <strong>of</strong> <strong>the</strong> Gulf<br />
<strong>of</strong> Mexico Basin. Early Mesozoic history<br />
<strong>of</strong> <strong>the</strong> basin included rifting and<br />
<strong>the</strong> creation <strong>of</strong> numerous sub-basins.<br />
During <strong>the</strong> Jurassic, marine flooding<br />
and restricted circulation resulted in<br />
<strong>the</strong> accumulation <strong>of</strong> halite beds in <strong>the</strong>se<br />
sub-basins (Jackson, 1982). Subsidence<br />
continued as <strong>the</strong> rifted continental crust<br />
cooled. The sediment column records<br />
<strong>the</strong> effects <strong>of</strong> changes in relative rates <strong>of</strong><br />
sediment progradation, basin subsidence,<br />
and sea level change. More than<br />
50,000 feet <strong>of</strong> sediment has accumulated<br />
in <strong>the</strong> Gulf <strong>of</strong> Mexico Basin (Salvador,<br />
1991). The Rio Grande and Houston<br />
embayments, East <strong>Texas</strong> Embayment<br />
(sometimes referred to as <strong>the</strong> East <strong>Texas</strong><br />
Basin), Sabine Uplift, and San Marcos<br />
Arch are <strong>the</strong> main structural features<br />
underlying <strong>the</strong> onshore part <strong>of</strong> <strong>the</strong> Gulf<br />
<strong>of</strong> Mexico Basin (Jackson, 1982). Figure<br />
3-3 shows <strong>the</strong> major faults and structural<br />
features for <strong>the</strong> <strong>Texas</strong> <strong>Coastal</strong> Plain<br />
and East <strong>Texas</strong> Embayment. The model<br />
outline shown on <strong>the</strong> figure shows <strong>the</strong><br />
active extent <strong>of</strong> <strong>the</strong> TWDB groundwater<br />
availability models for <strong>the</strong> Carrizo-<br />
Wilcox Aquifer.<br />
<strong>Texas</strong> Water Development Board <strong>Report</strong> <strong>374</strong> 39
Talco Fault Zone<br />
EAST TEXAS EMBAYMENT<br />
Sabine<br />
Uplift<br />
Balcones Fault Zone<br />
Karnes / Milano / Mexia Fault Zone<br />
San Marcos<br />
Arch<br />
Wilcox Fault Zone<br />
Elkhart<br />
Graben<br />
HOUSTON<br />
EMBAYMENT<br />
Mount Enterprise<br />
Fault Zone<br />
Sabine Arch<br />
Syncline showing<br />
dip direction<br />
Anticline showing<br />
dip direction<br />
RIO GRANDE<br />
EMBAYMENT<br />
N<br />
0 40 80<br />
Model boundary<br />
County/Parish boundaries<br />
Growth fault trend<br />
Faults<br />
Miles<br />
Salt domes<br />
Figure 3-3. Map <strong>of</strong> major faults and structural features for <strong>the</strong> <strong>Texas</strong> <strong>Coastal</strong> Plain and East <strong>Texas</strong> Embayment.<br />
Faults modifed from Ewing (1990). Structure axes modified from Guevara and Garcia (1972), Galloway (1982),<br />
and Galloway and o<strong>the</strong>rs (2000).<br />
Figure 3.<br />
Map <strong>of</strong> major faults and structural features for <strong>the</strong> <strong>Texas</strong> <strong>Coastal</strong> Plain and East <strong>Texas</strong><br />
Embayment. Faults modifed from Ewing (1990). Structure axes modified from Guevara<br />
and Garcia (1972), Galloway (1982), and Galloway and o<strong>the</strong>rs (2000).<br />
area. Saline water predominates in this<br />
area. The growth or listric faults formed<br />
as thick packages <strong>of</strong> Wilcox sediment<br />
prograded onto <strong>the</strong> uncompacted marine<br />
clay and mud deposited in <strong>the</strong> subsiding<br />
basin beyond <strong>the</strong> Cretaceous shelf<br />
edge. Continued downward slippage<br />
on <strong>the</strong> gulfward side <strong>of</strong> <strong>the</strong> faults and<br />
sustained sediment deposition resulted<br />
in <strong>the</strong> Wilcox Group thickening across<br />
<strong>the</strong> growth fault zone (Hatcher, 1995).<br />
Petroleum exploration drilling and geophysical<br />
studies within <strong>the</strong> study area<br />
have indicated that many <strong>of</strong> <strong>the</strong>se large,<br />
30<br />
Various fault zones are associated<br />
with <strong>the</strong> basin history <strong>of</strong> crustal warping,<br />
subsidence, and sediment loading. From<br />
coastward to inland, <strong>the</strong>se include (1)<br />
<strong>the</strong> Wilcox Growth Fault Zone (labeled<br />
Wilcox Fault Zone in Figure 3-3); (2)<br />
<strong>the</strong> Karnes Mexia Fault Zone (labeled<br />
Karnes/Milano/Mexia Fault Zone in Figure<br />
3-3); (3) <strong>the</strong> Elkhart-Mount Enterprise<br />
Fault Zone (labeled Elkhart Graben<br />
and Mount Enterprise Fault Zone in Figure<br />
3-3); and (4) <strong>the</strong> Balcones Fault Zone.<br />
The Wilcox Growth Fault Zone lies at<br />
<strong>the</strong> eastern or downdip limit <strong>of</strong> <strong>the</strong> study<br />
40 <strong>Texas</strong> Water Development Board <strong>Report</strong> <strong>374</strong>
listric growth faults can <strong>of</strong>fset sediments<br />
by 3,000 feet or more. The listric fault<br />
planes are curved; <strong>the</strong> dip <strong>of</strong> <strong>the</strong> faults<br />
decreases with depth; and <strong>the</strong> faults<br />
die out in <strong>the</strong> deeply buried shale beds.<br />
Complex fault patterns evolved, with<br />
anti<strong>the</strong>tic faults forming various closed<br />
structures. The major faults <strong>of</strong> <strong>the</strong> Wilcox<br />
Growth Fault Zone extend upward<br />
into <strong>the</strong> Claiborne Group.<br />
The Karnes Trough Fault Zone,<br />
Milano Fault Zone, and Mexia Fault<br />
Zone (Jackson, 1982; Ewing, 1990) are<br />
collectively referred to as <strong>the</strong> Karnes<br />
Mexia Fault Zone in this chapter. The<br />
fault zone marks <strong>the</strong> updip limit <strong>of</strong> <strong>the</strong><br />
Jurassic Louann Salt (Jackson, 1982).<br />
Displacement along <strong>the</strong> Karnes Mexia<br />
Fault Zone occurred throughout Mesozoic<br />
deposition along <strong>the</strong> Gulf Coast and<br />
continued at least through <strong>the</strong> Eocene,<br />
resulting in noticeable syndepositional<br />
features. Numerous faults with as much<br />
as 800 feet <strong>of</strong> displacement that exhibit<br />
no syndepositional features are also present<br />
throughout <strong>the</strong> Karnes Mexia Fault<br />
Zone (Jackson, 1982). In <strong>the</strong> central part<br />
<strong>of</strong> <strong>the</strong> study area, <strong>the</strong> Karnes Mexia Fault<br />
Zone displaces sediments by more than<br />
1,000 feet in some areas, restricting <strong>the</strong><br />
hydraulic communication between outcrop<br />
and downdip sections <strong>of</strong> aquifers.<br />
The Elkhart-Mount Enterprise Fault<br />
Zone lies along <strong>the</strong> structural high<br />
between <strong>the</strong> East <strong>Texas</strong> Embayment and<br />
<strong>the</strong> Gulf <strong>of</strong> Mexico Basin. Flexure with<br />
subsidence in <strong>the</strong>se two basins formed<br />
extensional faults and associated graben<br />
structures in <strong>the</strong> Queen City and Sparta<br />
formations. The Balcones Fault Zone<br />
consists <strong>of</strong> numerous fault strands that<br />
swing from nor<strong>the</strong>asterly in <strong>the</strong> sou<strong>the</strong>rn<br />
part <strong>of</strong> <strong>the</strong> study area to nor<strong>the</strong>rly in <strong>the</strong><br />
central and nor<strong>the</strong>rn parts <strong>of</strong> <strong>the</strong> area.<br />
Although <strong>the</strong> Balcones trend follows <strong>the</strong><br />
thrust-fault trends <strong>of</strong> <strong>the</strong> late Paleozoic<br />
Ouachita Orogeny (Ewing, 1990), activity<br />
was mostly limited to <strong>the</strong> Late Cretaceous<br />
and Tertiary (Collins and Laubach,<br />
1990). Some evidence points toward<br />
movement <strong>of</strong> this system as recently<br />
as Plio-Pleistocene times (Collins and<br />
Laubach, 1990). The zone results from<br />
tilting along <strong>the</strong> perimeter <strong>of</strong> <strong>the</strong> Gulf<br />
Coast Basin, flexure, and gulfward extension<br />
(Murray, 1961; Collins and o<strong>the</strong>rs,<br />
1992). Faults in this trend are <strong>of</strong> normal<br />
displacement, dominantly dipping to <strong>the</strong><br />
sou<strong>the</strong>ast (basinward), although some<br />
northwest-dipping anti<strong>the</strong>tic faults occur<br />
(Collins and Laubach, 1990).<br />
Figure 3-4 shows two structural cross<br />
sections in <strong>the</strong> study area. Cross section<br />
A-A’ shows <strong>the</strong> Tertiary formations from<br />
<strong>the</strong> Midway Formation through <strong>the</strong><br />
Sparta Formation in East <strong>Texas</strong>. The primary<br />
structural features in <strong>the</strong> eastern<br />
part <strong>of</strong> <strong>the</strong> study area are <strong>the</strong> East <strong>Texas</strong><br />
Basin, <strong>the</strong> Sabine Uplift, and <strong>the</strong> Houston<br />
Embayment. The Carrizo Formation has<br />
a narrow outcrop in <strong>the</strong> East <strong>Texas</strong> Basin<br />
and is eroded and not present over <strong>the</strong><br />
Sabine Uplift, where <strong>the</strong> Middle Wilcox<br />
Formation is at <strong>the</strong> surface. South <strong>of</strong> <strong>the</strong><br />
Sabine Uplift, <strong>the</strong> Carrizo and Wilcox<br />
formations outcrop in a narrow band<br />
parallel to <strong>the</strong> present day coastline. The<br />
entire Tertiary section steeply dips into<br />
<strong>the</strong> Gulf Coast Basin south <strong>of</strong> <strong>the</strong> Sabine<br />
Uplift and <strong>the</strong> East <strong>Texas</strong> Basin.<br />
Westward through Central and South<br />
<strong>Texas</strong>, <strong>the</strong> Carrizo and Wilcox formations<br />
outcrop in a narrow band paralleling<br />
<strong>the</strong> present day coast and dipping<br />
strongly toward <strong>the</strong> Gulf Coast Basin.<br />
Cross section B-B’ is representative <strong>of</strong><br />
Central and South <strong>Texas</strong>, where <strong>the</strong> dip<br />
<strong>of</strong> <strong>the</strong> formations in <strong>the</strong> subsurface can<br />
reach 250 feet per mile in portions <strong>of</strong><br />
those areas.<br />
3.4<br />
Hydraulic properties<br />
Information on hydraulic properties<br />
<strong>of</strong> <strong>the</strong> Carrizo-Wilcox Aquifer is based<br />
largely on data and sources provided by<br />
Mace and o<strong>the</strong>rs (2003). They compiled<br />
and statistically analyzed transmissivity,<br />
hydraulic conductivity, and storativity<br />
data from numerous sources for <strong>the</strong><br />
entire Carrizo-Wilcox Aquifer in <strong>Texas</strong>.<br />
They also analyzed spatial distributions<br />
<strong>Texas</strong> Water Development Board <strong>Report</strong> <strong>374</strong> 41
in hydraulic properties in <strong>the</strong> Carrizo<br />
Sand and <strong>the</strong> Wilcox Group, suggesting<br />
regional trends in kriged transmissivities<br />
and hydraulic conductivities. The<br />
uneven data coverage and relatively<br />
large local-scale variability, expressed<br />
in a high nugget in <strong>the</strong> semivariograms,<br />
indicate significant uncertainty in <strong>the</strong><br />
effective hydraulic properties <strong>of</strong> <strong>the</strong><br />
aquifer systems. A relationship between<br />
hydraulic properties and sand thickness<br />
could not be established, even<br />
though more detailed local studies did<br />
indicate some correlations between<br />
different sand facies and hydraulic<br />
conductivities.<br />
The Mace and o<strong>the</strong>rs (2003) analysis<br />
depended on aquifer codes to determine<br />
whe<strong>the</strong>r wells were located in a particular<br />
formation. Although this approach works<br />
reasonably well, <strong>the</strong>re are cases where<br />
<strong>the</strong> aquifer codes are missing, <strong>the</strong> codes<br />
are overly broad (for example, Carrizo-<br />
Wilcox undifferentiated), or <strong>the</strong> codes<br />
are inconsistent with <strong>the</strong> locations <strong>of</strong> <strong>the</strong><br />
actual screens. For <strong>the</strong> current analysis,<br />
we used wells from <strong>the</strong> database that had<br />
screen location information and compared<br />
<strong>the</strong> screen locations to <strong>the</strong> model<br />
structure from <strong>the</strong> groundwater availability<br />
models. A well was considered<br />
to be screened in a particular formation<br />
if 75 percent <strong>of</strong> <strong>the</strong> screen intersected<br />
that formation. Additionally, <strong>the</strong> area<br />
comprising <strong>the</strong> footprint <strong>of</strong> <strong>the</strong> Carrizo-<br />
Wilcox Aquifer was divided into sou<strong>the</strong>rn,<br />
central, and nor<strong>the</strong>rn regions for<br />
<strong>the</strong> purpose <strong>of</strong> summary statistics. The<br />
Elevation (feet above mean level)<br />
0<br />
-1,000<br />
-2,000<br />
-3,000<br />
-4,000<br />
0<br />
A A’<br />
B<br />
100,000 200,000 300,000 400,000 500,000 600,000 700,000 800,000 900,000 1,000,000<br />
Distance (feet)<br />
B’<br />
0<br />
Elevation (feet above mean sea level)<br />
-2,000<br />
-4,000<br />
-6,000<br />
-8,000<br />
Younger sediments<br />
Sparta Sand<br />
Weches Formation<br />
Queen City Sand<br />
Reklaw Formation<br />
Carrizo Sand<br />
Wilcox Group<br />
B<br />
B'<br />
A<br />
A'<br />
0 100,000 200,000 300,000<br />
Distance (feet)<br />
Figure 3-4. Structural cross sections for <strong>the</strong> Carrizo-Wilcox Aquifer and overlying sediments (Kelley and o<strong>the</strong>rs, 2004).<br />
42 <strong>Texas</strong> Water Development Board <strong>Report</strong> <strong>374</strong><br />
Figure 4.<br />
Structural cross sections for <strong>the</strong> Carrizo-Wilcox Aquifer and overlying sediments.
N<br />
0 30 60<br />
Miles<br />
Model boundary<br />
State line<br />
Gulf <strong>of</strong> Mexico<br />
Region<br />
Nor<strong>the</strong>rn<br />
Central<br />
Sou<strong>the</strong>rn<br />
Figure 3-5. Regions used in summarizing hydraulic properties and simulated water budgets.<br />
Figure 5.<br />
Regions used in summarizing hydraulic properties and simulated water budgets.<br />
regions are non-overlapping (in contrast<br />
to <strong>the</strong> groundwater availability models,<br />
for which <strong>the</strong> overlap is necessary to buffer<br />
boundary effects) as shown in Figure<br />
3-5. The central region was approximately<br />
defined by <strong>the</strong> limits <strong>of</strong> <strong>the</strong> Simsboro<br />
Aquifer between <strong>the</strong> Colorado and<br />
Trinity rivers. Table 3-1 shows <strong>the</strong> summary<br />
statistics for hydraulic conductivity<br />
based on this analysis. In <strong>the</strong> sou<strong>the</strong>rn<br />
region, <strong>the</strong> mean hydraulic conductivity<br />
decreases with formation age, from 44.3<br />
feet per day in <strong>the</strong> Carrizo to 13.3 feet<br />
per day in <strong>the</strong> Lower Wilcox. The same<br />
<strong>Texas</strong> Water Development Board <strong>Report</strong> <strong>374</strong> 43
trend holds for <strong>the</strong> central region, where<br />
hydraulic conductivity ranges from 23.6<br />
feet per day in <strong>the</strong> Carrizo to 8.3 feet<br />
per day in <strong>the</strong> Hooper. For <strong>the</strong> nor<strong>the</strong>rn<br />
region, <strong>the</strong> mean hydraulic conductivity<br />
is identical between <strong>the</strong> Carrizo and<br />
<strong>Upper</strong> Wilcox at 12.2 feet per day and<br />
similar to <strong>the</strong> Middle Wilcox at 8.0 feet<br />
per day. This result is consistent with <strong>the</strong><br />
generally undivided nature <strong>of</strong> <strong>the</strong> upper<br />
portion <strong>of</strong> <strong>the</strong> Carrizo-Wilcox in parts<br />
<strong>of</strong> <strong>the</strong> nor<strong>the</strong>rn region.<br />
The mean hydraulic conductivity generally<br />
decreases to <strong>the</strong> nor<strong>the</strong>ast for all<br />
<strong>of</strong> <strong>the</strong> formations. The decrease is most<br />
pronounced in <strong>the</strong> Carrizo Formation,<br />
from 44.3 feet per day in <strong>the</strong> sou<strong>the</strong>rn<br />
region to 12.2 feet per day in <strong>the</strong> nor<strong>the</strong>rn<br />
region. This trend is evident in Figure 3-6,<br />
which shows <strong>the</strong> point hydraulic conductivity<br />
values for those wells located in<br />
<strong>the</strong> Carrizo Formation. Figure 3-6 also<br />
shows <strong>the</strong> high spatial variability in <strong>the</strong><br />
hydraulic conductivity estimates across<br />
<strong>the</strong> region.<br />
The mean hydraulic conductivity <strong>of</strong><br />
<strong>the</strong> Simsboro Formation is less in <strong>the</strong><br />
central region than that <strong>of</strong> <strong>the</strong> Middle<br />
Wilcox in <strong>the</strong> sou<strong>the</strong>rn region (Table 3-1).<br />
Most <strong>of</strong> <strong>the</strong> estimates for <strong>the</strong> Simsboro<br />
were from wells in <strong>the</strong> outcrop (or near<br />
outcrop) portion <strong>of</strong> <strong>the</strong> central region, as<br />
shown in Figure 3-7. Figure 3-7 appears<br />
to show a general decrease in hydraulic<br />
conductivity from south to north, even<br />
within <strong>the</strong> central region.<br />
Figure 3-8 shows <strong>the</strong> hydraulic conductivity<br />
estimates in <strong>the</strong> <strong>Upper</strong> and<br />
Middle Wilcox formations in <strong>the</strong> nor<strong>the</strong>rn<br />
region. The most productive wells<br />
appear more frequently in <strong>the</strong> outcrop<br />
areas <strong>of</strong> <strong>the</strong> Sabine Uplift. Wells in <strong>the</strong><br />
downdip portions <strong>of</strong> <strong>the</strong> aquifer generally<br />
show measurements <strong>of</strong> less than 30<br />
feet per day.<br />
For all cases, <strong>the</strong> geometric mean is<br />
considerably lower than <strong>the</strong> arithmetic<br />
mean, indicating <strong>the</strong> disproportionate<br />
influence <strong>of</strong> a few high conductivity values<br />
on <strong>the</strong> arithmetic mean. When <strong>the</strong><br />
hydraulic conductivity estimates were<br />
made for <strong>the</strong> groundwater availability<br />
models, interpolation was performed in<br />
log space, and <strong>the</strong> interpolated values<br />
were back-transformed to produce <strong>the</strong><br />
final conductivity fields. Figure 3-9 shows<br />
an example <strong>of</strong> <strong>the</strong> effective conductivity<br />
for <strong>the</strong> Carrizo Formation. Effective conductivity<br />
in this case refers to <strong>the</strong> conductivity<br />
adjusted by <strong>the</strong> sand fraction.<br />
The conductivity generally decreases<br />
with depth, due to both decreasing estimated<br />
sand conductivity and decreasing<br />
sand fraction in <strong>the</strong> formation.<br />
Table 3-1. Summary statistics for hydraulic conductivity determined using data from Mace and o<strong>the</strong>rs (2003).<br />
All values in feet per day.<br />
Metric Region Carrizo<br />
Count<br />
Mean<br />
Geometric<br />
mean<br />
<strong>Upper</strong> Wilcox/<br />
Calvert Bluff<br />
Middle Wilcox/<br />
Simsboro<br />
Lower Wilcox/<br />
Hooper<br />
Sou<strong>the</strong>rn 167 6 145 88<br />
Central 71 297 139 230<br />
Nor<strong>the</strong>rn 195 477 759 163<br />
Sou<strong>the</strong>rn 44.3 30.7 27.7 13.3<br />
Central 23.6 16.6 16.3 8.3<br />
Nor<strong>the</strong>rn 12.2 12.2 8.0 5.5<br />
Sou<strong>the</strong>rn 13.5 8.5 8.8 5.5<br />
Central 6.7 4.3 6.4 3.4<br />
Nor<strong>the</strong>rn 5.0 4.8 3.0 2.7<br />
44 <strong>Texas</strong> Water Development Board <strong>Report</strong> <strong>374</strong>
Carrizo-Wilcox outcrop<br />
Carrizo-Wilcox downdip<br />
State line<br />
Gulf <strong>of</strong> Mexico<br />
Hydraulic conductivity<br />
(feet per day)<br />
0.05–1<br />
1–3<br />
N<br />
3–10<br />
10–30<br />
30–100<br />
>100<br />
0 25 50<br />
Miles<br />
Figure 3-6. Hydraulic conductivity measurements in <strong>the</strong> Carrizo Formation.<br />
Figure 6.<br />
Hydraulic conductivity measurements in <strong>the</strong> Carrizo Formation.<br />
3.5<br />
Water levels and regional surface, and wells that were completed<br />
groundwater flow<br />
in <strong>the</strong>se zones flowed. However, widespread<br />
groundwater development has<br />
Water within <strong>the</strong> Carrizo-Wilcox Aquifer<br />
is under water table conditions in significantly decreased <strong>the</strong> confined<br />
<strong>the</strong> outcrop areas and under confined pressure, and flowing wells are generally<br />
absent, especially in <strong>the</strong> sou<strong>the</strong>rn<br />
conditions downdip <strong>of</strong> <strong>the</strong> outcrop. In<br />
many areas, confined pressures within region (Moulder, 1957).<br />
<strong>the</strong> aquifer were originally above ground<br />
<strong>Texas</strong> Water Development Board <strong>Report</strong> <strong>374</strong> 45
Carrizo-Wilcox outcrop<br />
Carrizo-Wilcox downdip<br />
State line<br />
Hydraulic conductivity<br />
(feet per day)<br />
0.05–1<br />
1–3<br />
N<br />
3–10<br />
10–30<br />
30–100<br />
>100<br />
0 7.5 15<br />
Miles<br />
Figure 3-7. Hydraulic conductivity estimates in <strong>the</strong> Simsboro Formation.<br />
Figure 7.<br />
Hydraulic conductivity estimates in <strong>the</strong> Simsboro Formation.<br />
Under non-pumping conditions,<br />
groundwater movement within <strong>the</strong><br />
Carrizo-Wilcox Aquifer is significantly<br />
influenced by <strong>the</strong> topography and <strong>the</strong><br />
structure <strong>of</strong> <strong>the</strong> units. Regionally, land<br />
surface elevation decreases along dip<br />
toward <strong>the</strong> coast. Groundwater flow in <strong>the</strong><br />
subcrop follows this regional trend, flowing<br />
generally from <strong>the</strong> higher elevations<br />
in <strong>the</strong> outcrop downdip toward <strong>the</strong> coast.<br />
Locally, topographic lows are typically<br />
found in and around stream channels,<br />
and topographic highs occur along basin<br />
divides. In <strong>the</strong> outcrop, groundwater flow<br />
typically follows this local topography,<br />
with recharge in <strong>the</strong> local topographic<br />
highs moving toward <strong>the</strong> discharge areas<br />
in <strong>the</strong> local topographic lows. Because<br />
46 <strong>Texas</strong> Water Development Board <strong>Report</strong> <strong>374</strong>
Hydraulic<br />
conductivity<br />
(feet per day)<br />
0.05–1<br />
1–3<br />
3–10<br />
10–30<br />
30–100<br />
>100<br />
N<br />
0 10 20<br />
Miles<br />
Carrizo-Wilcox outcrop<br />
Carrizo-Wilcox downdip<br />
State line<br />
Figure 3-8. Hydraulic conductivity estimates in <strong>the</strong> combined <strong>Upper</strong> and Middle Wilcox formations in <strong>the</strong> nor<strong>the</strong>rn region.<br />
Figure 8.<br />
Hydraulic conductivity estimates in <strong>the</strong> combined <strong>Upper</strong> and Middle Wilcox formations in<br />
<strong>the</strong> nor<strong>the</strong>rn region.<br />
stream channels may run along <strong>the</strong> strike <strong>the</strong> coast is evident. Because <strong>the</strong> streams<br />
direction, shallow groundwater flow in are ei<strong>the</strong>r losing or weakly gaining in<br />
<strong>the</strong> outcrop may also occur more along this region, little influence on heads<br />
strike.<br />
from streams occurs until <strong>the</strong> Guadalupe<br />
Figure 3-10 shows <strong>the</strong> simulated<br />
River in <strong>the</strong> north. In <strong>the</strong> central<br />
predevelopment head in <strong>the</strong> Carrizo and nor<strong>the</strong>rn regions, <strong>the</strong> influence <strong>of</strong><br />
Formation. In <strong>the</strong> sou<strong>the</strong>rn region, <strong>the</strong> <strong>the</strong> streams as discharge areas is much<br />
regional trend <strong>of</strong> decreasing head toward more pronounced. The confined portion<br />
<strong>Texas</strong> Water Development Board <strong>Report</strong> <strong>374</strong> 47
Major rivers<br />
Model boundary<br />
Carrizo-Wilcox outcrop<br />
Carrizo-Wilcox downdip<br />
State line<br />
Gulf <strong>of</strong> Mexico<br />
Hydraulic<br />
conductivity<br />
(feet per day)<br />
0.1–1<br />
N<br />
1–3<br />
3–10<br />
10–30<br />
30–100<br />
0 30 60<br />
Miles<br />
Figure 3-9. Effective hydraulic conductivity in <strong>the</strong> Carrizo Formation.<br />
Figure 9.<br />
<strong>of</strong> <strong>the</strong> nor<strong>the</strong>rn region again shows <strong>the</strong><br />
more regional trend <strong>of</strong> decreasing head<br />
toward <strong>the</strong> coast.<br />
Figure 3-11 shows <strong>the</strong> simulated drawdown<br />
from predevelopment to 1999 for<br />
<strong>the</strong> Carrizo and Simsboro formations for<br />
those areas where drawdown is greater<br />
Effective hydraulic conductivity in <strong>the</strong> Carrizo Formation.<br />
48 <strong>Texas</strong> Water Development Board <strong>Report</strong> <strong>374</strong><br />
than 100 feet. In <strong>the</strong> Winter Garden area<br />
in <strong>the</strong> south, drawdowns in excess <strong>of</strong> 300<br />
feet are evident in Zavala and Frio counties.<br />
Figure 3-12 shows measured water<br />
level hydrographs for selected wells in<br />
<strong>the</strong> Winter Garden area. The general<br />
trend in <strong>the</strong> hydrographs is downward,<br />
30
Model boundary<br />
State line<br />
Gulf <strong>of</strong> Mexico<br />
Hydraulic<br />
head (feet)<br />
169–200<br />
200–300<br />
300–400<br />
400–500<br />
500–600<br />
600–700<br />
700–800<br />
50-foot contour<br />
Major rivers<br />
N<br />
0 20 40<br />
Miles<br />
Figure 3-10. Simulated predevelopment head in <strong>the</strong> Carrizo Formation.<br />
Figure 10.<br />
Simulated predevelopment head in <strong>the</strong> Carrizo Formation.<br />
with some leveling <strong>of</strong>f in <strong>the</strong> last decade. <strong>of</strong> about 150 feet from 1975 to 2005. For<br />
In <strong>the</strong> central region, Figure 3-11 shows a <strong>the</strong> nor<strong>the</strong>rn region, Figure 3-11 shows<br />
drawdown <strong>of</strong> over 100 feet in <strong>the</strong> Simsboro<br />
<strong>the</strong> drawdown in <strong>the</strong> Carrizo Aquifer in<br />
Formation due to pumping in Bra-<br />
excess <strong>of</strong> 300 feet for Smith, Angelina,<br />
zos County. Figure 3-13 shows a water and Nacogdoches counties. Figure 3-13<br />
level hydrograph for Brazos County in shows water level hydrographs for <strong>the</strong>se<br />
<strong>the</strong> Simsboro, with a measured decrease three counties. In Smith County, <strong>the</strong><br />
<strong>Texas</strong> Water Development Board <strong>Report</strong> <strong>374</strong> 49
Model boundary<br />
State line<br />
Gulf <strong>of</strong> Mexico<br />
Drawdown from<br />
predevelopment<br />
(feet)<br />
300<br />
N<br />
0 20 40<br />
Miles<br />
Smith County<br />
(Carrizo Aquifer)<br />
Angelina and Nacogdoches<br />
counties (Carrizo Aquifer)<br />
Brazos County<br />
(Simsboro Aquifer)<br />
Winter Garden area<br />
(Carrizo Aquifer)<br />
Figure 3-11. Simulated drawdown from predevelopment to 1999 in <strong>the</strong> Carrizo and Simsboro formations.<br />
Figure 11.<br />
Simulated drawdown from predevelopment to 1999 in <strong>the</strong> Carrizo and Simsboro formations.<br />
hydrograph shows a consistent downward<br />
trend covering about 150 feet <strong>of</strong><br />
drawdown from 1965 to 2005. The water<br />
level hydrograph for Angelina County<br />
shows a drawdown exceeding 400 feet<br />
from 1945 to 2000, with a rebound <strong>of</strong><br />
almost 300 feet from 2000 to 2005. The<br />
water level hydrograph for Nacogdoches<br />
County shows a similar trend, with<br />
a drawdown <strong>of</strong> almost 325 feet from 1940<br />
to about 1980 and a rebound <strong>of</strong> approximately<br />
100 feet from 1985 to 2000.<br />
50 <strong>Texas</strong> Water Development Board <strong>Report</strong> <strong>374</strong>
650<br />
6961502 Zavala 124CRRZ<br />
500<br />
7714601 Frio 124CRRZ<br />
Head (feet)<br />
600<br />
550<br />
500<br />
Head (feet)<br />
450<br />
400<br />
350<br />
300<br />
250<br />
450<br />
200<br />
2005<br />
1995<br />
1985<br />
1975<br />
1965<br />
1955<br />
1945<br />
1935<br />
1925<br />
1915<br />
1905<br />
2005<br />
1995<br />
1985<br />
1975<br />
1965<br />
1955<br />
1945<br />
1935<br />
1925<br />
1915<br />
1905<br />
625<br />
7733301 Dimmit 124CRRZ<br />
350<br />
7739301 La Salle 124CRRZ<br />
600<br />
300<br />
Head (feet)<br />
575<br />
550<br />
Head (feet)<br />
250<br />
525<br />
200<br />
500<br />
150<br />
2005<br />
1995<br />
1985<br />
1975<br />
1965<br />
1955<br />
1945<br />
1935<br />
1925<br />
1915<br />
1905<br />
2005<br />
1995<br />
1985<br />
1975<br />
1965<br />
1955<br />
1945<br />
1935<br />
1925<br />
1915<br />
1905<br />
Figure 3-12. Measured water level hydrographs in Winter Garden area Carrizo wells.<br />
Figure 12.<br />
Measured water level hydrographs in Winter Garden area Carrizo wells.<br />
3.6<br />
Water quality<br />
For a broad indication <strong>of</strong> water quality<br />
in <strong>the</strong> Carrizo-Wilcox Aquifer, we queried<br />
<strong>the</strong> TWDB groundwater database<br />
for <strong>the</strong> most recent measurements <strong>of</strong><br />
total dissolved solids for wells completed<br />
in <strong>the</strong> aquifer. Figure 3-14 shows<br />
a plot <strong>of</strong> <strong>the</strong> resulting values. Note that<br />
<strong>the</strong> downdip limit <strong>of</strong> <strong>the</strong> aquifer as<br />
defined by TWDB is concurrent with<br />
<strong>the</strong> estimated milligrams per liter contour<br />
<strong>of</strong> 3,000 milligrams per liter total<br />
dissolved solids.<br />
The common definitions for fresh,<br />
slightly saline, and moderately saline<br />
water are 3,000 milligrams per liter, respectively.<br />
Figure 3-14 shows that in <strong>the</strong> sou<strong>the</strong>rn<br />
region, <strong>the</strong> freshest water typically occurs<br />
in <strong>the</strong> shallowest portions <strong>of</strong> <strong>the</strong> subcrop.<br />
In <strong>the</strong> outcrop, <strong>the</strong> water quality is more<br />
mixed, with some occurrences <strong>of</strong> slightly<br />
saline water. Moving fur<strong>the</strong>r downdip,<br />
<strong>the</strong> water quality begins to degrade in<br />
<strong>the</strong> deeper sections <strong>of</strong> <strong>the</strong> aquifer, with<br />
total dissolved solids increasing into <strong>the</strong><br />
moderately saline range. In <strong>the</strong> nor<strong>the</strong>rn<br />
region, <strong>the</strong> trends in water quality are<br />
less consistent. Overall, <strong>the</strong> majority <strong>of</strong><br />
<strong>the</strong> measurements in this region indicate<br />
high quality (
300<br />
5921209 Brazos 124SMBR<br />
350<br />
3429503 Smith 124CZWX<br />
250<br />
325<br />
Head (feet)<br />
200<br />
150<br />
Head (feet)<br />
300<br />
275<br />
250<br />
100<br />
225<br />
50<br />
200<br />
2005<br />
1995<br />
1985<br />
1975<br />
1965<br />
1955<br />
1945<br />
1935<br />
1925<br />
1915<br />
1905<br />
2005<br />
1995<br />
1985<br />
1975<br />
1965<br />
1955<br />
1945<br />
1935<br />
1925<br />
1915<br />
1905<br />
150<br />
3735702 Angelina 124CRRZ<br />
300<br />
3727301 Nacogdoches 124CRRZ<br />
Head (feet)<br />
100<br />
50<br />
0<br />
-50<br />
-100<br />
-150<br />
-200<br />
-250<br />
-300<br />
Head (feet)<br />
250<br />
200<br />
150<br />
100<br />
50<br />
0<br />
-50<br />
-350<br />
-100<br />
2005<br />
1995<br />
1985<br />
1975<br />
1965<br />
1955<br />
1945<br />
1935<br />
1925<br />
1915<br />
1905<br />
2005<br />
1995<br />
1985<br />
1975<br />
1965<br />
1955<br />
1945<br />
1935<br />
1925<br />
1915<br />
1905<br />
Figure 3-13. Measured water level hydrographs in <strong>the</strong> Carrizo and Simsboro formations.<br />
Figure 13. Measured water level hydrographs in <strong>the</strong> Carrizo and Simsboro formations.<br />
water and generally improve <strong>the</strong> quality<br />
<strong>of</strong> water in <strong>the</strong> outcrop.<br />
3.7<br />
Water budget<br />
The reports for <strong>the</strong> Carrizo-Wilcox<br />
Aquifer groundwater availability models<br />
detail <strong>the</strong> various mechanisms <strong>of</strong><br />
recharge and discharge for each <strong>of</strong> <strong>the</strong><br />
separate modeled regions (Deeds and<br />
o<strong>the</strong>rs, 2003; Dutton and o<strong>the</strong>rs, 2003;<br />
Fryar and o<strong>the</strong>rs, 2003). However, <strong>the</strong><br />
overall water budget <strong>of</strong> <strong>the</strong> aquifer,<br />
removing overlapping areas, has not<br />
been previously analyzed. In <strong>the</strong> following<br />
analysis, we used <strong>the</strong> regions<br />
shown in Figure 3-5 to define <strong>the</strong> areas<br />
for which <strong>the</strong> budget was calculated.<br />
We <strong>the</strong>n summed <strong>the</strong> results to determine<br />
total budgets. The analyses were<br />
completed for both <strong>the</strong> steady-state<br />
and transient models. We chose 1999 as<br />
<strong>the</strong> transient year for which results are<br />
presented. Table 3-2 shows <strong>the</strong> results<br />
<strong>of</strong> <strong>the</strong> water budget expressed as net<br />
inflow or outflow for each component<br />
and region. Table 3-3 shows <strong>the</strong> same<br />
results expressed as a percent <strong>of</strong> net<br />
inflow or outflow for each component<br />
and region. For <strong>the</strong> purposes <strong>of</strong> this<br />
discussion, Wilcox refers to <strong>the</strong> Wilcox<br />
Group, undivided.<br />
In predevelopment, <strong>the</strong> total inflow<br />
to <strong>the</strong> Carrizo Formation is 218,000<br />
acre-feet per year, and total inflow to<br />
<strong>the</strong> Wilcox is 563,000 acre-feet per year.<br />
In general, recharge increases from <strong>the</strong><br />
sou<strong>the</strong>rn region to <strong>the</strong> nor<strong>the</strong>rn region<br />
as precipitation increases. Nearly 100<br />
percent <strong>of</strong> <strong>the</strong> inflow to <strong>the</strong> Carrizo and<br />
52 <strong>Texas</strong> Water Development Board <strong>Report</strong> <strong>374</strong>
!! !!!<br />
! !!<br />
!<br />
! !!!<br />
! ! ! ! ! !!<br />
! !<br />
!! !! ! !<br />
! !<br />
!<br />
!!<br />
!! !<br />
!!! !<br />
!! !<br />
!! !<br />
! ! ! !<br />
! !<br />
!!<br />
!<br />
! !<br />
! ! !<br />
!<br />
!<br />
! ! ! ! !<br />
!<br />
!! ! ! !<br />
! !!! ! !<br />
! ! !<br />
! !!<br />
!!<br />
! !!!<br />
!<br />
! !!!!<br />
! !!!! ! !!!<br />
! ! ! ! !<br />
! !<br />
! !!! !<br />
!<br />
!!<br />
!!!<br />
!!!!! ! !!!!!<br />
! ! !! !!!!<br />
! !!<br />
!<br />
! ! ! !!! ! ! !<br />
! ! !! ! !<br />
! !! ! !! ! ! ! ! ! ! ! ! ! ! !<br />
! ! ! !!<br />
! !<br />
!<br />
! !<br />
!! !<br />
! ! ! ! !<br />
! !<br />
! ! !!!<br />
!! !!!! !!<br />
! ! !! !<br />
! ! ! ! ! !<br />
!!!!<br />
!<br />
! !<br />
!<br />
!<br />
! !!! !<br />
!<br />
!! ! !<br />
!<br />
! ! ! !! !! !! !<br />
!!! !<br />
! !!<br />
! ! ! ! ! !<br />
!!!<br />
! !! !! ! ! !!<br />
!<br />
! !!!<br />
! ! ! !<br />
!!!! ! !!<br />
! ! !!<br />
! ! !<br />
! ! ! !!! !! !<br />
! !<br />
!! ! ! !!<br />
! !! !<br />
!! ! !! ! !! ! !!!! !!!<br />
!!<br />
!!<br />
! ! !<br />
!<br />
! ! ! !<br />
!<br />
!<br />
! !! ! ! !<br />
!!!<br />
! !! !<br />
!! ! !!<br />
!! !!<br />
!!!<br />
!!<br />
! !! ! ! !!<br />
! !!! ! ! ! ! !!<br />
!<br />
!!<br />
! !! ! !<br />
!! !!<br />
! ! ! !! ! !!!!<br />
!!<br />
!!!!<br />
! !! ! ! ! !<br />
! !!! ! ! ! ! ! !<br />
!<br />
!<br />
!!<br />
!!! ! !! !! !! !! ! !!<br />
!!!! !<br />
!!!! !! !<br />
! !<br />
! ! ! ! !!!! ! ! ! ! !<br />
!!<br />
!!! !!<br />
!! ! ! ! ! !!!!! !<br />
!<br />
!!<br />
! !!!! !!! ! ! ! ! !<br />
!<br />
! ! !! ! ! !!<br />
!! ! ! !! !<br />
! ! ! !! !! !<br />
!! !!!!<br />
! !!<br />
!!<br />
!<br />
!! ! !! ! ! !<br />
! !!! !! !<br />
!<br />
!! !<br />
!! !<br />
!! !!<br />
!!<br />
! !<br />
!!! ! !!<br />
!<br />
! ! !!!! ! ! ! !! !! ! !!<br />
!<br />
!<br />
!! !!! ! !! !<br />
!<br />
! !<br />
!!<br />
!! !! !<br />
!! ! !<br />
! !!!!!<br />
!!<br />
!!<br />
! !! ! !<br />
!!! ! !<br />
!<br />
!!<br />
! ! ! !<br />
!<br />
! !!<br />
! !!<br />
! ! ! ! ! ! !<br />
! ! ! ! !!<br />
!<br />
! !!<br />
! ! !! ! !<br />
!!! ! ! !! !<br />
! !! ! ! ! !<br />
!! !<br />
! ! ! !! !! ! !!! ! !<br />
! ! !!<br />
! !! ! ! ! !! !<br />
!! !<br />
!<br />
!! !<br />
!! !!<br />
! !<br />
!!<br />
! !!!<br />
! !! !<br />
!<br />
! ! ! ! !! !!!!<br />
!! !<br />
! !!!<br />
!!<br />
!!! ! ! !<br />
!!!<br />
!! !<br />
!!<br />
!<br />
! ! ! ! !! !<br />
! ! !! ! ! !!! ! !!! ! ! !!<br />
!<br />
!<br />
! !!!!<br />
!<br />
! !!!!! !!<br />
!<br />
!! !<br />
!<br />
! !<br />
!!<br />
! !!<br />
!! !<br />
!!<br />
!<br />
!! !<br />
! !<br />
!! !!<br />
!<br />
!<br />
! !<br />
!! !<br />
! ! ! ! ! !!<br />
!! !! ! ! !!<br />
!<br />
! !!!!!<br />
!<br />
!<br />
! !<br />
!<br />
!<br />
!! !!! !<br />
!!! !<br />
!<br />
!! ! !<br />
! !!! ! ! ! !<br />
!<br />
! ! ! !!<br />
! ! !!! ! ! ! !<br />
! !<br />
! ! ! !!!!<br />
! !<br />
! ! ! !<br />
!! !!! ! !!<br />
! !<br />
!!!!!<br />
! !!<br />
! !!!!<br />
! !! ! !<br />
! ! ! !!! !<br />
! !! ! !! ! !!<br />
!!! !!!<br />
!<br />
!<br />
!! ! !<br />
!! !! ! ! !<br />
!!<br />
!!<br />
!!<br />
!!!<br />
! ! !!!<br />
!!!<br />
!!! ! ! ! ! ! !! !<br />
!! !! !!<br />
!!!<br />
!!! !<br />
! ! !<br />
!<br />
!<br />
! !<br />
! !<br />
!<br />
! !! ! ! !<br />
!!! !<br />
! ! ! !! !!<br />
!<br />
!!!! ! !<br />
! ! !<br />
! ! !! !!!<br />
! !! !! !<br />
! !<br />
!!! ! ! !!<br />
!<br />
! !!<br />
! !<br />
!!<br />
! !!!<br />
! ! !!!<br />
!<br />
! !! ! ! !!<br />
!<br />
!<br />
!<br />
! !<br />
!<br />
! !<br />
! !<br />
! ! !! !! ! !! ! !<br />
!!! ! !!! !<br />
! !<br />
!! ! !<br />
!! !<br />
! ! !!!<br />
!<br />
!<br />
! ! ! !<br />
!! ! !<br />
!<br />
!!<br />
!<br />
!<br />
! !<br />
! ! !<br />
!<br />
!<br />
!<br />
!<br />
! ! ! !<br />
!! ! ! !<br />
!<br />
!<br />
! ! !<br />
!! !! !<br />
!<br />
!! ! ! ! ! ! !<br />
!!<br />
! !<br />
! !!!!<br />
! !! ! !<br />
!<br />
! ! !<br />
! !!!! !<br />
!<br />
!<br />
!<br />
!<br />
!! !<br />
!<br />
!<br />
! !!<br />
!<br />
! !!<br />
! ! ! !<br />
! !<br />
!!<br />
!<br />
!<br />
! ! !!!! !! ! !<br />
!<br />
!!<br />
!!!! ! !<br />
!<br />
!!! !<br />
! !!<br />
!!<br />
!<br />
! !!! !! ! !! !<br />
!<br />
! ! ! !<br />
!<br />
! !! ! ! !!<br />
!! !! !! !<br />
!!<br />
! !!<br />
! ! !<br />
!! !!<br />
!<br />
! !<br />
!!!!<br />
! !<br />
! ! !! !<br />
!!!<br />
!! ! !! ! ! ! !<br />
Carrizo-Wilcox outcrop<br />
!! ! ! !!! !<br />
! ! ! !! !!<br />
!!! ! !<br />
!! !! !! ! ! ! ! !<br />
!! !<br />
!!! ! ! !<br />
!! !!! !<br />
!! ! ! ! ! ! ! !<br />
! !! !! ! ! !<br />
!!!<br />
! !<br />
!<br />
!<br />
!<br />
!!!<br />
!<br />
!<br />
! !! !! !<br />
Carrizo-Wilcox downdip<br />
!!! !<br />
!<br />
!!<br />
!!! !! !<br />
! !<br />
!!! !<br />
!!!! !! !<br />
! ! !!! !!<br />
!<br />
! ! !! !! ! !<br />
!<br />
!!<br />
!!<br />
! ! !<br />
!<br />
! !!!! ! !!!<br />
!!! ! !!!<br />
!!<br />
!<br />
!! !!!<br />
! !<br />
!! ! !! !<br />
! ! !!! !!!<br />
! !! ! ! ! ! ! !! ! !!!!!!!!<br />
!! !<br />
!!! !<br />
! !! ! !!! !! ! !<br />
!!<br />
! !!!!!!! !! !<br />
! !<br />
!<br />
!! !! ! ! !<br />
State line<br />
! !<br />
!!<br />
!! ! ! ! ! !<br />
!! ! !!!! !! ! !<br />
! !!! !! ! !! !! ! ! !!! ! ! !<br />
!<br />
!!! ! !<br />
! !!<br />
!<br />
!<br />
! !!! !! ! !<br />
!<br />
! ! ! ! !<br />
! ! !! ! !!! ! ! ! !! ! !<br />
!!! ! !! ! !! ! ! ! !! !! !<br />
!<br />
! ! !!<br />
! !!<br />
! ! !<br />
!!!<br />
!!!<br />
!<br />
!<br />
! !<br />
! !! !!! ! !!! !!! ! !!<br />
! !<br />
!! !! ! ! !! ! !! ! !<br />
!!<br />
! !! !<br />
!!<br />
!<br />
! !! !!<br />
!!! !<br />
!<br />
! ! ! ! !<br />
! ! !!!<br />
! !! ! !<br />
!! !!! ! ! !! !! !<br />
! !!<br />
!<br />
!! !<br />
! ! ! !!! !! !!<br />
!! ! ! !<br />
!!!!<br />
! !! ! !<br />
!<br />
! !<br />
! !<br />
!!! ! ! !!! !<br />
!<br />
! ! ! ! !<br />
Gulf <strong>of</strong> Mexico<br />
! !<br />
!<br />
! !<br />
!!!<br />
! ! !! ! !<br />
!!<br />
!<br />
!<br />
!<br />
! ! !<br />
!!!!!<br />
! !! ! !<br />
! ! ! !<br />
! ! !<br />
!<br />
!!!!<br />
!!!!<br />
! ! !! ! !<br />
!!<br />
! !<br />
! ! !!<br />
! !!<br />
!<br />
!<br />
!<br />
! !!<br />
!!! ! !! ! !! !! ! !<br />
! ! !!!<br />
!!!<br />
!! ! !!!<br />
! ! ! ! !!<br />
!! ! !<br />
!<br />
! !!! ! !!!! ! ! Total dissolved solids N<br />
! ! ! ! !<br />
!<br />
!<br />
! !<br />
!<br />
! ! ! !!<br />
! !<br />
!! (milligrams per liter)<br />
! !<br />
!!<br />
!<br />
! ! !!<br />
!<br />
!! ! ! ! ! !<br />
!! !<br />
!<br />
!<br />
! !<br />
!<br />
!<br />
!! ! !! !! ! ! !<br />
10–500<br />
!<br />
!<br />
! ! !<br />
!<br />
!<br />
500–1,000<br />
!<br />
0 25 50<br />
!<br />
!<br />
!<br />
!<br />
!<br />
!<br />
!<br />
1,001–3,000<br />
3,001–25,206<br />
Miles<br />
Figure 3-14. Measurements <strong>of</strong> total dissolved solids in <strong>the</strong> Carrizo-Wilcox Aquifer.<br />
Figure 14.<br />
Measurements <strong>of</strong> total dissolved solids in <strong>the</strong> Carrizo-Wilcox Aquifer.<br />
99 percent <strong>of</strong> <strong>the</strong> inflow to <strong>the</strong> Wilcox<br />
comes from recharge from precipitation.<br />
Outflow from <strong>the</strong> Carrizo occurs mainly<br />
through shallow discharge to streams<br />
and groundwater evapotranspiration,<br />
and deep discharge to cross-formational<br />
flow through <strong>the</strong> top <strong>of</strong> <strong>the</strong> formation.<br />
Top flow in <strong>the</strong> Carrizo represents flow<br />
to or from <strong>the</strong> Reklaw Formation, and<br />
bottom flow represents flow to or from<br />
<strong>the</strong> Wilcox. The fraction <strong>of</strong> discharge<br />
that is from groundwater evapotranspiration<br />
increases from <strong>the</strong> south to<br />
<strong>the</strong> north, as water tables are generally<br />
nearer to <strong>the</strong> surface in <strong>the</strong> nor<strong>the</strong>rn<br />
region. For <strong>the</strong> sou<strong>the</strong>rn region, over 50<br />
<strong>Texas</strong> Water Development Board <strong>Report</strong> <strong>374</strong> 53
Table 3-2. Simulated water budget for <strong>the</strong> Carrizo and combined Wilcox formations for predevelopment and year 1999. All values in acre-feet per year.<br />
Region Aquifer Period Recharge Streams ET Drains<br />
Sou<strong>the</strong>rn<br />
Central<br />
Nor<strong>the</strong>rn<br />
Total<br />
Carrizo<br />
Wilcox<br />
Carrizo<br />
Wilcox<br />
Carrizo<br />
Wilcox<br />
Carrizo<br />
Wilcox<br />
Top<br />
flow<br />
Bottom<br />
flow Reservoirs Pumping Storage Net in Net out<br />
Pred 62,000 -32,000 -2,000 0 -39,000 8,000 n/a n/a n/a 70,000 -73,000<br />
1999 38,000 -9,000 0 0 57,000 -5,000 0 -222,000 143,000 238,000 -236,000<br />
Pred 43,000 -30,000 -4,000 -1,000 -8,000 0 n/a n/a n/a 43,000 -43,000<br />
1999 26,000 -10,000 -1,000 0 5,000 0 2,000 -57,000 35,000 67,000 -68,000<br />
Pred 40,000 -19,000 -14,000 -1,000 -10,000 4,000 n/a n/a n/a 44,000 -44,000<br />
1999 46,000 -23,000 -12,000 -1,000 -6,000 0 0 -10,000 9,000 55,000 -53,000<br />
Pred 117,000 -82,000 -29,000 -2,000 -4,000 0 n/a n/a n/a 117,000 -117,000<br />
1999 136,000 -99,000 -19,000 -4,000 0 0 3,000 -38,000 26,000 166,000 -160,000<br />
Pred 116,000 -45,000 -57,000 -3,000 2,000 -15,000 n/a n/a n/a 118,000 -120,000<br />
1999 56,000 -32,000 -18,000 0 44,000 -30,000 0 -69,000 43,000 143,000 -150,000<br />
Pred 399,000 -219,000 -183,000 -14,000 15,000 0 n/a n/a n/a 414,000 -417,000<br />
1999 256,000 -162,000 -52,000 -13,000 30,000 0 13,000 -77,000 -5,000 299,000 -309,000<br />
Pred 218,000 -97,000 -72,000 -4,000 -47,000 -3,000 0 0 0 218,000 -223,000<br />
1999 141,000 -65,000 -30,000 -2,000 95,000 -36,000 0 -301,000 195,000 430,000 -433,000<br />
Pred 560,000 -332,000 -217,000 -17,000 3,000 0 0 0 0 563,000 -565,000<br />
1999 417,000 -271,000 -71,000 -17,000 36,000 0 18,000 -172,000 56,000 527,000 -532,000<br />
Note: Positive numbers indicate inflows; negative numbers indicate outflows.<br />
Pred = predevelopment; ET = evapotranspiration<br />
54 <strong>Texas</strong> Water Development Board <strong>Report</strong> <strong>374</strong>
Table 3-3. Simulated water budget as a percent <strong>of</strong> net inflow or outflow for predevelopment and year 1999.<br />
Region Aquifer Period Recharge Streams ET Drains Top flow Bottom flow Reservoirs Pumping Storage<br />
Carrizo<br />
Sou<strong>the</strong>rn<br />
Wilcox<br />
Carrizo<br />
Central<br />
Wilcox<br />
Carrizo<br />
Nor<strong>the</strong>rn<br />
Wilcox<br />
Carrizo<br />
Total<br />
Wilcox<br />
Pred 89 -44 -3 0 -53 11 0 0 0<br />
1999 16 -4 0 0 24 -2 0 -94 60<br />
Pred 100 -70 -9 -2 -18 0 0 0 0<br />
1999 38 -14 -1 0 7 0 2 -85 52<br />
Pred 92 -45 -31 -1 -23 8 0 0 0<br />
1999 84 -45 -22 -3 -11 -1 0 -19 16<br />
Pred 100 -70 -25 -2 -3 0 0 0 0<br />
1999 82 -62 -12 -3 0 0 2 -24 16<br />
Pred 98 -38 -47 -2 2 -12 0 0 0<br />
1999 39 -21 -12 0 31 -20 0 -46 30<br />
Pred 96 -53 -44 -3 4 0 0 0 0<br />
1999 85 -53 -17 -4 10 0 4 -25 -2<br />
Pred 100 -44 -32 -2 -21 -1 0 0 0<br />
1999 33 -15 -7 0 22 -8 0 -69 45<br />
Pred 99 -59 -38 -3 1 0 0 0 0<br />
1999 79 -51 -13 -3 7 0 3 -32 11<br />
Note: Positive numbers indicate inflows; negative numbers indicate outflows.<br />
Pred = predevelopment; ET = evapotranspiration<br />
<strong>Texas</strong> Water Development Board <strong>Report</strong> <strong>374</strong> 55
percent <strong>of</strong> <strong>the</strong> discharge from <strong>the</strong> Carrizo<br />
occurs vertically through <strong>the</strong> top <strong>of</strong><br />
<strong>the</strong> formation due to upward gradients<br />
in predevelopment.<br />
The impact <strong>of</strong> groundwater development<br />
dramatically changes <strong>the</strong> budget in<br />
1999 compared to predevelopment. In<br />
total, pumping accounts for 69 percent<br />
<strong>of</strong> outflow from <strong>the</strong> Carrizo Formation<br />
and 32 percent <strong>of</strong> <strong>the</strong> outflow from <strong>the</strong><br />
Wilcox Group. With <strong>the</strong> addition <strong>of</strong><br />
pumping, water removed from storage<br />
in <strong>the</strong> Carrizo accounts for 45 percent<br />
<strong>of</strong> <strong>the</strong> inflow to <strong>the</strong> Carrizo, but only<br />
11 percent <strong>of</strong> <strong>the</strong> inflow to <strong>the</strong> Wilcox.<br />
Note that water removed from storage<br />
is considered an inflow component, and<br />
thus has a positive value in Table 3-2.<br />
Overall, capture occurs from streams,<br />
groundwater evapotranspiration, and<br />
cross-formational flow.<br />
The effect <strong>of</strong> pumping in <strong>the</strong> sou<strong>the</strong>rn<br />
region is most pronounced, with 94<br />
percent <strong>of</strong> outflow in <strong>the</strong> Carrizo from<br />
pumping, <strong>of</strong> which 60 percent comes<br />
from storage. Much <strong>of</strong> <strong>the</strong> remainder<br />
<strong>of</strong> <strong>the</strong> inflow to <strong>the</strong> Carrizo (24 percent)<br />
flows from <strong>the</strong> top <strong>of</strong> <strong>the</strong> aquifer.<br />
Note <strong>the</strong> reversal from predevelopment,<br />
where about half <strong>of</strong> <strong>the</strong> outflow occurred<br />
through cross-formational flow. This<br />
reversal in cross-formational flow represents<br />
capture, where a discharge mechanism<br />
becomes a recharge mechanism<br />
under <strong>the</strong> influence <strong>of</strong> pumping.<br />
In <strong>the</strong> central region, pumping makes<br />
up a much smaller percent <strong>of</strong> net outflow,<br />
with 19 percent and 24 percent from <strong>the</strong><br />
Carrizo and Wilcox, respectively. Most<br />
<strong>of</strong> this outflow is balanced by a decrease<br />
in storage, with very little capture from<br />
streams, groundwater evapotranspiration,<br />
or cross-formational flow.<br />
Because <strong>the</strong> flow system is shallower<br />
and recharge is greater in <strong>the</strong> nor<strong>the</strong>rn<br />
region, storage does not contribute as<br />
significantly to <strong>the</strong> water budget, especially<br />
in <strong>the</strong> Wilcox, with its considerable<br />
outcrop in <strong>the</strong> Sabine Uplift area. Also <strong>of</strong><br />
interest in <strong>the</strong> nor<strong>the</strong>rn area is <strong>the</strong> source<br />
<strong>of</strong> capture for <strong>the</strong> pumping. The percent<br />
<strong>of</strong> outflow to <strong>the</strong> streams changes only<br />
slightly from predevelopment to 1999,<br />
but <strong>the</strong> percent <strong>of</strong> outflow to groundwater<br />
evapotranspiration decreases from<br />
47 percent to 12 percent in <strong>the</strong> Carrizo,<br />
and 44 percent to 17 percent in <strong>the</strong> Wilcox.<br />
Both groundwater evapotranspiration<br />
and cross-formational flow are <strong>the</strong><br />
major sources <strong>of</strong> capture in <strong>the</strong> nor<strong>the</strong>rn<br />
region.<br />
The distribution <strong>of</strong> pumping in <strong>the</strong><br />
Carrizo-Wilcox Aquifer in 1999 is shown<br />
in Figure 3-15. In this figure, <strong>the</strong> pumping<br />
rates were plotted for each square mile.<br />
Rates <strong>of</strong> less than 10 acre-feet per year<br />
in a square mile were not plotted. This<br />
rate corresponds to about 10,000 gallons<br />
per day, or <strong>the</strong> production from<br />
a typical private domestic well. In <strong>the</strong><br />
sou<strong>the</strong>rn region, most <strong>of</strong> <strong>the</strong> pumping<br />
is in <strong>the</strong> Winter Garden area, which is<br />
consistent with <strong>the</strong> drawdowns shown in<br />
Figure 3-11. Similarly, Brazos County has<br />
<strong>the</strong> highest concentration <strong>of</strong> withdrawals<br />
in <strong>the</strong> central region. In <strong>the</strong> nor<strong>the</strong>rn<br />
region, Angelina and Nacogdoches counties<br />
show <strong>the</strong> highest concentration <strong>of</strong><br />
withdrawals, consistent with <strong>the</strong> drawdown<br />
cones shown in Figure 3-11<br />
3.8<br />
Summary and Conclusions<br />
In this paper, we provided a basic<br />
summary <strong>of</strong> <strong>the</strong> hydrogeology <strong>of</strong> <strong>the</strong><br />
Carrizo-Wilcox Aquifer in <strong>Texas</strong>. The<br />
Carrizo-Wilcox is a major aquifer in<br />
<strong>Texas</strong>, providing approximately 450,000<br />
acre-feet <strong>of</strong> water in 2003 to users in <strong>the</strong><br />
state. The Carrizo-Wilcox in <strong>Texas</strong> lies<br />
roughly parallel to <strong>the</strong> coast from <strong>the</strong><br />
Rio Grande in <strong>the</strong> south to <strong>the</strong> <strong>Texas</strong>-<br />
Louisiana border in <strong>the</strong> nor<strong>the</strong>ast.<br />
The sediments that form <strong>the</strong> Carrizo-<br />
Wilcox Aquifer are part <strong>of</strong> a gulfward<br />
thickening wedge <strong>of</strong> Cenozoic sediments<br />
deposited in <strong>the</strong> Rio Grande Embayment<br />
<strong>of</strong> <strong>the</strong> northwest Gulf Coast Basin. In<br />
<strong>the</strong> south, <strong>the</strong> Carrizo-Wilcox is composed<br />
<strong>of</strong> <strong>the</strong> Carrizo Formation and <strong>the</strong><br />
Wilcox Group, with <strong>the</strong> Wilcox Group<br />
typically divided into upper, middle, and<br />
56 <strong>Texas</strong> Water Development Board <strong>Report</strong> <strong>374</strong>
Model boundary<br />
State line<br />
Gulf <strong>of</strong> Mexico<br />
Pumping rate<br />
(acre-feet/year)<br />
10–30<br />
N<br />
30–100<br />
100–300<br />
300–1,000<br />
1,000–3,000<br />
0 20 40<br />
Miles<br />
Figure 3-15. Estimated pumping rates in <strong>the</strong> Carrizo-Wilcox Aquifer in 1999.<br />
Figure 15. Estimated pumping rates in <strong>the</strong> Carrizo-Wilcox Aquifer in 1999.<br />
<strong>Texas</strong> Water Development Board <strong>Report</strong> <strong>374</strong> 57
lower units. In <strong>the</strong> central portion <strong>of</strong> <strong>the</strong><br />
area, <strong>the</strong> three Wilcox units are called<br />
<strong>the</strong> Hooper, Simsboro, and Calvert Bluff<br />
formations, with <strong>the</strong> Simsboro being<br />
<strong>the</strong> most productive <strong>of</strong> <strong>the</strong> three. In <strong>the</strong><br />
north, <strong>the</strong> contrast between <strong>the</strong> Carrizo<br />
and Wilcox can be poorly defined, with<br />
<strong>the</strong> combination collectively referred to<br />
as <strong>the</strong> Cypress Aquifer.<br />
The Rio Grande and Houston embayments,<br />
East <strong>Texas</strong> Embayment, Sabine<br />
Uplift, and San Marcos Arch are <strong>the</strong> main<br />
structural features intersecting <strong>the</strong> Carrizo-Wilcox<br />
Aquifer. Various fault zones<br />
are associated with <strong>the</strong> basin history <strong>of</strong><br />
crustal warping, subsidence, and sediment<br />
loading. From coastward to inland,<br />
<strong>the</strong>se include <strong>the</strong> Wilcox Growth Fault<br />
Zone, <strong>the</strong> Karnes Mexia Fault Zone, <strong>the</strong><br />
Elkhart-Mount Enterprise Fault Zone,<br />
and <strong>the</strong> Balcones Fault Zone.<br />
We reanalyzed a database <strong>of</strong> hydraulic<br />
conductivity estimates from Mace and<br />
o<strong>the</strong>rs (2003), locating <strong>the</strong> measurements<br />
in specific formations based on <strong>the</strong><br />
structure <strong>of</strong> <strong>the</strong> groundwater availability<br />
models. The estimated mean hydraulic<br />
conductivity in <strong>the</strong> Carrizo Formation<br />
ranges from 44 feet per day in <strong>the</strong> south<br />
to 12 feet per day in <strong>the</strong> north. Hydraulic<br />
conductivity in <strong>the</strong> formations that make<br />
up <strong>the</strong> Wilcox generally decreases with<br />
depth <strong>of</strong> formation. Overall, <strong>the</strong> Carrizo<br />
Formation and portions <strong>of</strong> <strong>the</strong> Wilcox<br />
Group, including <strong>the</strong> Simsboro, can contain<br />
very productive sands.<br />
Groundwater movement within <strong>the</strong><br />
Carrizo-Wilcox Aquifer is significantly<br />
influenced by <strong>the</strong> topography and <strong>the</strong><br />
structure <strong>of</strong> <strong>the</strong> units. Shallow groundwater<br />
flow is dominated by topography,<br />
with flow from <strong>the</strong> higher topographic<br />
areas toward <strong>the</strong> stream channels. In <strong>the</strong><br />
subcrop, flow is generally downdip, which<br />
follows regional topography. Groundwater<br />
production has significantly affected<br />
water levels in <strong>the</strong> Carrizo-Wilcox, especially<br />
in <strong>the</strong> Winter Garden area in <strong>the</strong><br />
sou<strong>the</strong>rn region, Brazos County in <strong>the</strong><br />
central region, and Smith, Angelina, and<br />
Nacogdoches counties in <strong>the</strong> nor<strong>the</strong>rn<br />
region. Measured drawdowns <strong>of</strong> over 300<br />
feet have been recorded in <strong>the</strong> Carrizo<br />
Formation. Water quality in <strong>the</strong> aquifer<br />
is generally good, with fresh water<br />
in most <strong>of</strong> <strong>the</strong> outcrop and subcrop (up<br />
to 30 miles in <strong>the</strong> dip direction) areas.<br />
Fur<strong>the</strong>r downdip, <strong>the</strong> water transitions<br />
to slightly and moderately saline.<br />
In predevelopment, <strong>the</strong> dominant<br />
source <strong>of</strong> inflow to <strong>the</strong> aquifer is recharge<br />
from precipitation. The dominant shallow<br />
discharge mechanism is through<br />
streams and groundwater evapotranspiration,<br />
with <strong>the</strong> relative importance <strong>of</strong><br />
groundwater evapotranspiration increasing<br />
from south to north, as water tables<br />
rise closer to ground surface. The dominant<br />
deeper discharge mechanism is<br />
through upward cross-formational flow<br />
from <strong>the</strong> Carrizo Formation to younger<br />
sediments. Under current developed conditions,<br />
pumping makes up <strong>the</strong> majority<br />
<strong>of</strong> outflow in <strong>the</strong> Carrizo. In <strong>the</strong> south,<br />
much <strong>of</strong> <strong>the</strong> pumped water comes from<br />
storage along with significant capture<br />
from cross-formational flow, as vertical<br />
gradients are reversed. Moving to <strong>the</strong><br />
nor<strong>the</strong>rn region, capture from groundwater<br />
evapotranspiration increases, and<br />
<strong>the</strong> decrease in cross-formational flow is<br />
less significant.<br />
58 <strong>Texas</strong> Water Development Board <strong>Report</strong> <strong>374</strong>
3.9<br />
References<br />
Ashworth, J.B., and Hopkins, J., 1995, Major and minor aquifers <strong>of</strong> <strong>Texas</strong>: <strong>Texas</strong> Water<br />
Development Board <strong>Report</strong> 345, 69 p.<br />
Ayers, W.B., Jr., and Lewis, A.H., 1985, The Wilcox Group and Carrizo Sand (Paleogene)<br />
in east-central <strong>Texas</strong>—Depositional systems and deep-basin lignite: University <strong>of</strong><br />
<strong>Texas</strong> at Austin, Bureau <strong>of</strong> Economic Geology Special Publication, 19 p., 30 pls.<br />
Bebout, D.G., Weise, B.R., Gregory, A.R., and Edwards, M.B., 1982, Wilcox sandstone<br />
reservoirs in <strong>the</strong> deep subsurface along <strong>the</strong> <strong>Texas</strong> Gulf Coast—Their potential for<br />
production <strong>of</strong> geopressured geo<strong>the</strong>rmal energy: University <strong>of</strong> <strong>Texas</strong> at Austin, Bureau<br />
<strong>of</strong> Economic Geology <strong>Report</strong> <strong>of</strong> Investigations No. 117, 125 p.<br />
Collins, E.W., and Laubach, S.E., 1990, Faults and fractures in <strong>the</strong> Balcones Fault Zone,<br />
Austin region, Central <strong>Texas</strong>: Austin Geological Society Guidebook 13, 34 p.<br />
Collins, E.W., Hovorka, S.D., and Laubach, S.E., 1992, Fracture systems <strong>of</strong> <strong>the</strong> Austin<br />
Chalk, north-central <strong>Texas</strong>, in Schmoker, W., and o<strong>the</strong>rs, eds., Geological studies<br />
relevant to horizontal drilling—Examples from western North America: Rocky<br />
Mountain Association <strong>of</strong> Geologists, p. 129–142.<br />
Deeds, N., Kelley, V., Fryar, D., Jones, T., Whallon, A., and Dean, K., 2003, Groundwater<br />
availability model for <strong>the</strong> sou<strong>the</strong>rn Carrizo-Wilcox Aquifer: Prepared for <strong>the</strong><br />
<strong>Texas</strong> Water Development Board, 452 p.<br />
Dutton, A.R., Harden, R.W., Nicot, J.-P., and O’Rourke, D., 2003, Groundwater availability<br />
model for <strong>the</strong> central part <strong>of</strong> <strong>the</strong> Carrizo-Wilcox Aquifer in <strong>Texas</strong>: University<br />
<strong>of</strong> <strong>Texas</strong> at Austin, Bureau <strong>of</strong> Economic Geology: Prepared for <strong>the</strong> <strong>Texas</strong> Water<br />
Development Board, 295 p.<br />
Ewing, T.E., 1990, Tectonic map <strong>of</strong> <strong>Texas</strong>: University <strong>of</strong> <strong>Texas</strong> at Austin, Bureau <strong>of</strong><br />
Economic Geology, scale 1:750:000.<br />
Fisher, W.L., and McGowen, J.H., 1967, Depositional systems in <strong>the</strong> Wilcox Group <strong>of</strong><br />
<strong>Texas</strong> and <strong>the</strong>ir relationship to occurrence <strong>of</strong> oil and gas: Transactions-Gulf Coast<br />
Association <strong>of</strong> Geological Societies, v. XVII.<br />
Fogg, G.E., and Kreitler, C.W., 1982, Ground-water hydraulics and hydrochemical facies<br />
in Eocene aquifers <strong>of</strong> <strong>the</strong> East <strong>Texas</strong> Basin: University <strong>of</strong> <strong>Texas</strong> at Austin, Bureau <strong>of</strong><br />
Economic Geology <strong>Report</strong> <strong>of</strong> Investigations No. 127, 75 p.<br />
Fryar, D., Senger, R., Deeds, N., Pickens, J., Whallon, A. and Dean, K., 2003, Groundwater<br />
availability model for <strong>the</strong> nor<strong>the</strong>rn Carrizo-Wilcox Aquifer: Prepared for <strong>the</strong><br />
<strong>Texas</strong> Water Development Board, 529 p.<br />
Galloway, W.E., 1982, Depositional architecture <strong>of</strong> Cenozoic Gulf <strong>Coastal</strong> Plain Fluvial<br />
Systems, University <strong>of</strong> <strong>Texas</strong> at Austin, Bureau <strong>of</strong> Economic Geology Geological<br />
Circular 82-5, 29 p.<br />
Galloway, W.E., Liu, X., Travis-Neuberger, D., and Xue, L., 1994, References high-resolution<br />
correlation cross sections, Paleogene section, <strong>Texas</strong> <strong>Coastal</strong> Plain: University<br />
<strong>of</strong> <strong>Texas</strong> at Austin, Bureau <strong>of</strong> Economic Geology.<br />
Galloway, W.E., Ganey-Curry, P.E., Li, X., and Buffler, R.T., 2000, Cenozoic depositional<br />
history <strong>of</strong> <strong>the</strong> Gulf <strong>of</strong> Mexico Basin: American Association <strong>of</strong> Petroleum Geologists<br />
Bulletin, v. 84, no. 11, p. 1743–1774.<br />
<strong>Texas</strong> Water Development Board <strong>Report</strong> <strong>374</strong> 59
Guevara, E.H., and Garcia, R., 1972, Depositional systems and oil-gas reservoirs in <strong>the</strong><br />
Queen City Formation (Eocene), <strong>Texas</strong>: Gulf Coast Association <strong>of</strong> Geological Societies<br />
Transactions, v. 22, p.1–22.<br />
Grubb, H.F., 1997, Summary <strong>of</strong> hydrology <strong>of</strong> <strong>the</strong> regional aquifer systems, Gulf <strong>Coastal</strong> Plain,<br />
south-central United States: U.S. Geological Survey Pr<strong>of</strong>essional Paper 1416-A, 61 p.<br />
Hamlin, H.S., 1988, Depositional and ground-water flow systems <strong>of</strong> <strong>the</strong> Carrizo-<strong>Upper</strong><br />
Wilcox, South <strong>Texas</strong>: University <strong>of</strong> <strong>Texas</strong> at Austin, Bureau <strong>of</strong> Economic Geology<br />
<strong>Report</strong> <strong>of</strong> Investigations No. 175, 61 p.<br />
Hatcher, R.D., 1995, Structural geology, principles, concepts, and problems (2 nd ed.): <strong>Upper</strong><br />
Saddle River, N.J., Prentice Hall, Inc., 525 p.<br />
Henry, C.D., Basciano, J.M., and Duex, T.W., 1980, Hydrology and water quality <strong>of</strong> <strong>the</strong><br />
Eocene Wilcox Group—Significance for lignite development in East <strong>Texas</strong>: University<br />
<strong>of</strong> <strong>Texas</strong> at Austin, Bureau <strong>of</strong> Economic Geology Geological Circular 80-3, 9 p.<br />
Jackson, M.P.A., 1982, Fault tectonics <strong>of</strong> <strong>the</strong> East <strong>Texas</strong> Basin: University <strong>of</strong> <strong>Texas</strong> at Austin,<br />
Bureau <strong>of</strong> Economic Geology Geological Circular 84-2, 31 p.<br />
Kaiser, W.R., 1974, <strong>Texas</strong> lignite—Near-surface and deep-basin resources: University <strong>of</strong><br />
<strong>Texas</strong> at Austin, Bureau <strong>of</strong> Economic Geology <strong>Report</strong> <strong>of</strong> Investigations No. 79, 70 p.<br />
Kaiser, W.R., 1978, Depositional systems in <strong>the</strong> Wilcox Group (Eocene) <strong>of</strong> east-central <strong>Texas</strong><br />
and <strong>the</strong> occurrence <strong>of</strong> lignite, in 1976 Gulf Coast Lignite Conference Proceedings—<br />
Geology, Utilization, and Environmental Aspects, W.R. Kaiser, ed.: University <strong>of</strong> <strong>Texas</strong><br />
at Austin, Bureau <strong>of</strong> Economic Geology <strong>Report</strong> <strong>of</strong> Investigations No. 90, p. 33–53.<br />
Kaiser, W.R., 1990, The Wilcox Group (Paleocene-Eocene) in <strong>the</strong> Sabine Uplift area,<br />
<strong>Texas</strong>—Depositional systems and deep-basin lignite: University <strong>of</strong> <strong>Texas</strong> at Austin,<br />
Bureau <strong>of</strong> Economic Geology Special Publication, 20 p.<br />
Kelley, V.A., Deeds, N.E., Fryar, D.G., and Nicot, J.-P., 2004, Groundwater availability<br />
models for <strong>the</strong> Queen City and Sparta aquifers: Prepared for <strong>the</strong> <strong>Texas</strong> Water Development<br />
Board.<br />
Klemt, W.B., Duffin, G.L., and Elder, G.R., 1976, Ground-water resources <strong>of</strong> <strong>the</strong> Carrizo<br />
aquifer in <strong>the</strong> Winter Garden area <strong>of</strong> <strong>Texas</strong>, v. 1: <strong>Texas</strong> Water Development Board<br />
<strong>Report</strong> 210, 30 p.<br />
Mace, R.E., and Smyth, R.C., 2003, Hydraulic properties <strong>of</strong> <strong>the</strong> Carrizo-Wilcox aquifer<br />
in <strong>Texas</strong>—Information for groundwater modeling, planning, and management: University<br />
<strong>of</strong> <strong>Texas</strong> at Austin, Bureau <strong>of</strong> Economic Geology <strong>Report</strong> <strong>of</strong> Investigations No.<br />
269, 40 p. + CD-ROM.<br />
Moulder, E.A., 1957, Development <strong>of</strong> ground water from <strong>the</strong> Carrizo Sand and Wilcox<br />
Group in Dimmit, Zavala, Maverick, Frio, Atascosa, Medina, Bexar, Live Oak, McMullen,<br />
La Salle, and Webb counties, <strong>Texas</strong>: United States Geological Survey Open-File<br />
<strong>Report</strong> 55-77, 24 p.<br />
Murray, G. E., 1961, Geology <strong>of</strong> <strong>the</strong> Atlantic and Gulf Coast Province <strong>of</strong> North America:<br />
New York, Harper Bro<strong>the</strong>rs, 692 p.<br />
Salvador, A., 1991, Origin and development <strong>of</strong> <strong>the</strong> Gulf <strong>of</strong> Mexico basin, in Salvador, A.,<br />
ed., The Gulf <strong>of</strong> Mexico Basin: The Geological Society <strong>of</strong> America, The Geology <strong>of</strong><br />
North America, v. J, p. 53–72.<br />
TWDB (<strong>Texas</strong> Water Development Board), 2007, Water for <strong>Texas</strong>, Volume 2: <strong>Texas</strong> Water<br />
Development Board, 392 p.<br />
60 <strong>Texas</strong> Water Development Board <strong>Report</strong> <strong>374</strong>
Chapter 4<br />
Ecology <strong>of</strong> <strong>the</strong> Carrizo-Wilcox Aquifer<br />
Chad W. Norris 1 and Daniel R. Opdyke, Ph.D., P.E. 1<br />
Groundwater is a major source <strong>of</strong><br />
water in <strong>Texas</strong>, supplying almost<br />
60 percent <strong>of</strong> <strong>the</strong> water used statewide<br />
in 2003 (TWDB, 2007). As <strong>the</strong> development<br />
<strong>of</strong> land and water resources<br />
has increased over <strong>the</strong> last several<br />
decades and <strong>the</strong> availability <strong>of</strong> suitable<br />
surface water development locations<br />
has diminished, increased pressure has<br />
been placed on groundwater resources<br />
to meet future needs. However, <strong>the</strong> connection<br />
between groundwater and surface<br />
water resources is <strong>of</strong>ten overlooked<br />
as <strong>the</strong>y are developed.<br />
Many surface water features, including<br />
lakes, streams, reservoirs, wetlands,<br />
and estuaries, interact with groundwater<br />
to some extent (Winter and o<strong>the</strong>rs,<br />
1998). In some situations, surface water<br />
bodies gain water from groundwater<br />
systems, and in o<strong>the</strong>rs, <strong>the</strong> surface<br />
water body is a source <strong>of</strong> groundwater<br />
recharge. As a result, <strong>the</strong> withdrawal <strong>of</strong><br />
water from streams can reduce groundwater<br />
recharge, and in o<strong>the</strong>r situations,<br />
groundwater pumping can deplete water<br />
in lakes, streams, and wetlands. Thus,<br />
<strong>the</strong>re is concern about <strong>the</strong> potential<br />
impact groundwater withdrawals will<br />
have on surface water habitats supported<br />
by groundwater. To manage land and<br />
water resources effectively, <strong>the</strong> hydrogeologic<br />
linkages between groundwater<br />
and surface water must be understood.<br />
The most apparent linkage between<br />
groundwater and surface water is <strong>the</strong><br />
expression <strong>of</strong> springs, which are defined<br />
as <strong>the</strong> natural flow <strong>of</strong> groundwater to<br />
<strong>the</strong> land surface. Springs have long<br />
been recognized as valuable ecological<br />
(Danielopol, 1989; Williams and Danks,<br />
1991), natural (Bowles and Arsuffi, 1993;<br />
TPWD, 2005), and cultural (Brune, 1975;<br />
Brune, 1981; Weniger, 1984) resources.<br />
They are an important natural feature<br />
that played a major role in <strong>the</strong> lives <strong>of</strong><br />
early inhabitants and settlers, determining<br />
<strong>the</strong> location <strong>of</strong> trails, providing<br />
power for mills, and supplying water for<br />
domestic, municipal, agricultural, and<br />
recreational uses.<br />
The unique aquatic and wetland<br />
habitats formed by springs represent<br />
<strong>the</strong> interface between hypogean (subterranean)<br />
and epigean (surface water)<br />
habitats. These habitats are recognized<br />
for <strong>the</strong>ir high proportion <strong>of</strong> unique biota<br />
that <strong>of</strong>ten include rare, endemic, and relict<br />
species. The presence <strong>of</strong> such species<br />
is <strong>of</strong>ten owed to <strong>the</strong> hydrologic stability<br />
displayed by many springs in terms <strong>of</strong><br />
<strong>the</strong> quantity and quality <strong>of</strong> water discharged<br />
over time (Hynes, 1970; Ward<br />
1992). Because <strong>of</strong> <strong>the</strong>ir relative stability<br />
(as compared to streams and reservoirs),<br />
springs play a vital role in ensuring that<br />
common (non-game) aquatic species<br />
remain common. Springs provide <strong>the</strong><br />
base flows to rivers and streams that sustain<br />
aquatic, wetland, and riparian habitats<br />
during drought and <strong>of</strong>ten support<br />
disjunct headwater habitats that serve<br />
as isolated refuges. In addition, springs<br />
<strong>of</strong>ten maintain downstream aquatic and<br />
riparian habitats, enhance and/or sustain<br />
surface water supplies, provide recharge<br />
to downstream aquifers, and <strong>of</strong>fer a<br />
natural, relatively inexpensive means <strong>of</strong><br />
monitoring groundwater quality.<br />
Despite <strong>the</strong> ecological and hydrological<br />
significance <strong>of</strong> springs, a paucity<br />
<strong>of</strong> data exists on <strong>the</strong> vast majority<br />
<strong>of</strong> springs that occupy <strong>the</strong> <strong>Texas</strong> landscape.<br />
Moreover, many springs in <strong>the</strong><br />
state have not been assessed by biologists<br />
1 <strong>Texas</strong> Parks and Wildlife Department, Water<br />
Resources Branch<br />
<strong>Texas</strong> Water Development Board <strong>Report</strong> <strong>374</strong> 61
or hydrologists, and a large proportion<br />
<strong>of</strong> <strong>the</strong> data that exist on spring systems<br />
are from a relatively small number <strong>of</strong><br />
springs (Brune 1981; Ourso and Hornig,<br />
1999). Because <strong>the</strong> loss and decline <strong>of</strong><br />
<strong>Texas</strong> springs has been well documented<br />
(Brune, 1975, 1981; Bowles and Arsuffi,<br />
1993), it is likely that remaining spring<br />
systems, <strong>the</strong> habitats <strong>the</strong>y support, and<br />
<strong>the</strong> biota that rely on <strong>the</strong>m will be negatively<br />
impacted to some extent by human<br />
activities as <strong>the</strong> population continues to<br />
increase. A significant and obvious threat<br />
to spring habitats is groundwater withdrawals<br />
that directly impact springflows.<br />
O<strong>the</strong>r less obvious threats include contamination,<br />
development within recharge<br />
zones, introductions <strong>of</strong> exotic species,<br />
and poor land management practices.<br />
4.1<br />
Carrizo-Wilcox Aquifer<br />
The Carrizo-Wilcox Aquifer is a major<br />
aquifer in <strong>Texas</strong> that ranges from <strong>the</strong><br />
Rio Grande in South <strong>Texas</strong> nor<strong>the</strong>astward<br />
into <strong>the</strong> Piney Woods <strong>of</strong> East<br />
<strong>Texas</strong> (Figure 4-1). The aquifer consists<br />
<strong>of</strong> <strong>the</strong> Wilcox Group and Carrizo Formation.<br />
These geologic units crop out<br />
in a narrow band that extends from <strong>the</strong><br />
Sabine River in nor<strong>the</strong>ast <strong>Texas</strong> to <strong>the</strong><br />
Rio Grande in southwest <strong>Texas</strong>.<br />
The aquifer is composed primarily<br />
<strong>of</strong> hydraulically connected sands locally<br />
interbedded with gravel, silt, clay, and lignite<br />
deposited during <strong>the</strong> Tertiary Period.<br />
The Carrizo is a homogeneous sand unit<br />
overlying <strong>the</strong> thicker, more heterogeneous<br />
Wilcox Group (Deeds and o<strong>the</strong>rs,<br />
2003; Dutton and o<strong>the</strong>rs, 2003; Fryar and<br />
o<strong>the</strong>rs, 2003). In most <strong>of</strong> Central <strong>Texas</strong>,<br />
<strong>the</strong> Wilcox Group is divided into three<br />
distinct formations: <strong>the</strong> Hooper, Simsboro,<br />
and Calvert Bluff formations. This<br />
division cannot be made north <strong>of</strong> <strong>the</strong><br />
Trinity River and south <strong>of</strong> <strong>the</strong> Colorado<br />
River due to <strong>the</strong> absence <strong>of</strong> <strong>the</strong> Simsboro<br />
Formation as a distinct unit.<br />
Groundwater in <strong>the</strong> Carrizo-Wilcox<br />
Aquifer exists under both water table<br />
(unconfined) and artesian (confined)<br />
conditions. Water table conditions usually<br />
occur in <strong>the</strong> outcrop areas, and artesian<br />
conditions occur where <strong>the</strong> aquifer<br />
is overlain by confining beds with lower<br />
hydraulic conductivity rates. The major<br />
water-bearing units <strong>of</strong> <strong>the</strong> Carrizo-Wilcox<br />
Aquifer are <strong>the</strong> Carrizo and Simsboro<br />
formations, which contain more<br />
permeable and thicker sand deposits. In<br />
contrast, <strong>the</strong> Calvert Bluff and Hooper<br />
formations are made <strong>of</strong> clay, silt, sand,<br />
and lignite mixtures and generally have<br />
a low vertical permeability, which make<br />
<strong>the</strong>m act as leaky aquitards that confine<br />
fluid pressures in <strong>the</strong> Carrizo and Simsboro<br />
and restrict groundwater movement<br />
between <strong>the</strong> layers (Dutton and<br />
o<strong>the</strong>rs, 2003).<br />
The Carrizo-Wilcox Aquifer is in<br />
communication with several minor<br />
aquifers that overlie its confined portion,<br />
including <strong>the</strong> Queen City, Sparta,<br />
and Yegua formations (Figure 4-2). In<br />
this chapter, <strong>the</strong>se minor aquifers will be<br />
referred to as associated minor aquifers.<br />
These aquifers represent sediments from<br />
contrasting depositional environments.<br />
Water is pumped from <strong>the</strong>se aquifers to<br />
some extent for various uses, and <strong>the</strong>y<br />
also support various spring habitats.<br />
More information on <strong>the</strong> Carrizo-Wilcox<br />
and associated aquifers is presented by<br />
Ashworth and Hopkins (1995).<br />
Groundwater is pumped from <strong>the</strong><br />
Carrizo-Wilcox in about 60 counties<br />
in <strong>Texas</strong> for various uses. Irrigation<br />
pumping occurs throughout <strong>the</strong> aquifer<br />
and accounted for 43 percent <strong>of</strong> <strong>the</strong><br />
total groundwater removed in 2003.<br />
Approximately 35 percent <strong>of</strong> <strong>the</strong> total<br />
groundwater removed from <strong>the</strong> aquifer<br />
in 2003 was for municipal water supply<br />
(TWDB, 2009). Public water supply<br />
systems in Bryan-College Station,<br />
Lufkin-Nacogdoches, and Tyler make up<br />
a large portion <strong>of</strong> <strong>the</strong> municipal percentage<br />
as <strong>the</strong>y are population centers in <strong>the</strong><br />
region and receive significant amounts<br />
<strong>of</strong> <strong>the</strong>ir water from <strong>the</strong> Carrizo-Wilcox<br />
Aquifer (TWDB, 2007; TWDB, 2009).<br />
Lignite mining operations also remove a<br />
62 <strong>Texas</strong> Water Development Board <strong>Report</strong> <strong>374</strong>
FRANKLIN<br />
BOWIE<br />
³<br />
VAN ZANDT<br />
HOPKINS<br />
WOOD<br />
TITUS<br />
MORRIS CASS<br />
CAMP<br />
MARION<br />
UPSHUR<br />
HARRISON<br />
GREGG<br />
SMITH<br />
HENDERSON<br />
RUSK<br />
PANOLA<br />
NAVARRO<br />
LIMESTONE<br />
FREESTONE<br />
ANDERSON<br />
CHEROKEE<br />
NACOGDOCHES<br />
SHELBY<br />
FALLS<br />
ROBERTSON<br />
LEON<br />
MADISON<br />
HOUSTON<br />
TRINITY<br />
ANGELINA<br />
SABINE<br />
SAN AUGUSTINE<br />
MILAM<br />
WALKER<br />
WILLIAMSON<br />
BRAZOS<br />
BURLESON<br />
GRIMES<br />
LEE<br />
WASHINGTON<br />
BASTROP<br />
CALDWELL<br />
FAYETTE<br />
GUADALUPE<br />
UVALDE<br />
MEDINA<br />
BEXAR<br />
WILSON<br />
GONZALES<br />
LAVACA<br />
Carrizo Aquifer<br />
Carrizo downdip<br />
Carrizo outcrop<br />
MAVERICK<br />
ZAVALA<br />
FRIO<br />
ATASCOSA<br />
KARNES<br />
0 50 100<br />
Miles<br />
DIMMIT<br />
LA SALLE<br />
MCMULLEN<br />
LIVE OAK<br />
BEE<br />
Compiled by <strong>the</strong> <strong>Texas</strong> Parks and<br />
Wildlife Department Water Resources<br />
Branch. No claims are made to <strong>the</strong><br />
accuracy <strong>of</strong> <strong>the</strong> data or its suitablility<br />
to a particular use.<br />
WEBB<br />
Figure 4-1. Map <strong>of</strong> Carrizo-Wilcox Aquifer (aquifer data from <strong>the</strong> TWDB database, www.twdb.state.tx.us/data/data.asp).<br />
Figure 1: Map <strong>of</strong> Carrizo-Wilcox Aquifer<br />
<strong>Texas</strong> Water Development Board <strong>Report</strong> <strong>374</strong> 63
significant portion <strong>of</strong> groundwater from<br />
<strong>the</strong> central area <strong>of</strong> <strong>the</strong> aquifer (Deeds and<br />
o<strong>the</strong>rs, 2003; Dutton and o<strong>the</strong>rs, 2003;<br />
Fryar and o<strong>the</strong>rs, 2003).<br />
As <strong>the</strong> population <strong>of</strong> <strong>Texas</strong> continues<br />
to grow at a rapid rate, increased pressure<br />
is being placed on groundwater<br />
resources. The proximity <strong>of</strong> <strong>the</strong> Carrizo-<br />
Wilcox Aquifer in relation to many urban<br />
areas and estimates <strong>of</strong> water availability<br />
from <strong>the</strong> aquifer have made it a target for<br />
various entities seeking to obtain future<br />
water supplies. As such, <strong>the</strong>re is concern<br />
about <strong>the</strong> potential impact groundwater<br />
withdrawals will have on surface water<br />
habitats that rely on groundwater contributions<br />
from <strong>the</strong> aquifer. Under natural<br />
conditions (no wells pumping), aquifers<br />
approach a state <strong>of</strong> dynamic equilibrium<br />
where recharge to <strong>the</strong> aquifer essentially<br />
equals <strong>the</strong> natural discharge (Theis,<br />
1940). Discharge from wells alters this<br />
equilibrium by reducing aquifer storage,<br />
inducing additional recharge, and<br />
decreasing natural discharge. The location<br />
<strong>of</strong> <strong>the</strong> well in relation to <strong>the</strong> source<br />
area <strong>of</strong> induced recharge and/or <strong>the</strong> natural<br />
discharge areas plays a major role in<br />
<strong>the</strong> significance <strong>of</strong> <strong>the</strong> impacts.<br />
4.2<br />
Natural discharge <strong>of</strong> <strong>the</strong><br />
Carrizo-Wilcox Aquifer<br />
Groundwater in <strong>the</strong> Carrizo-Wilcox<br />
Aquifer moves slowly under <strong>the</strong> influence<br />
<strong>of</strong> gravity from areas <strong>of</strong> recharge<br />
to areas <strong>of</strong> discharge. Recharge to <strong>the</strong><br />
Carrizo-Wilcox Aquifer occurs primarily<br />
in <strong>the</strong> outcrop portion and is<br />
derived mainly from direct precipitation<br />
and losses from surface water bodies.<br />
Recharge rates vary during seasonal,<br />
annual, and longer time periods and differ<br />
across <strong>the</strong> outcrop according to vegetation,<br />
slope, soils, and o<strong>the</strong>r factors.<br />
Estimates <strong>of</strong> <strong>the</strong> recharge rate for <strong>the</strong><br />
Carrizo-Wilcox Aquifer range from 0.1<br />
to more than 5 inches per year (Ryder<br />
and Ardis, 1991; Thorkildsen and Price,<br />
1991; Dutton, 1999; Scanlon and o<strong>the</strong>rs,<br />
2002). In general, only a small amount<br />
<strong>of</strong> annual rainfall reaches <strong>the</strong> water<br />
table because most rainfall runs <strong>of</strong>f or<br />
is evapotranspired. Dutton (1990) estimated<br />
that only about 10 percent <strong>of</strong> precipitation<br />
may end up as recharge.<br />
Springs are natural discharge points<br />
for aquifers. They emerge through natural<br />
openings in rock or soil under gravity<br />
or artesian conditions. Gravity springs<br />
commonly occur in <strong>the</strong> unconfined portion<br />
<strong>of</strong> <strong>the</strong> Carrizo-Wilcox and associated<br />
minor aquifers in one <strong>of</strong> two ways.<br />
The first type <strong>of</strong> gravity spring occurs<br />
when groundwater percolates downward,<br />
moves laterally due to underlying impermeable<br />
strata, and emerges at <strong>the</strong> land<br />
surface, <strong>of</strong>ten on hillsides or in headwater<br />
streambeds. Springs <strong>of</strong> this type are<br />
<strong>of</strong>ten apparent and are commonly fed<br />
by seepage from isolated hills or topographic<br />
highs, such as <strong>the</strong> Yegua Knobbs<br />
in Lee County. The second type <strong>of</strong> gravity<br />
spring represents water that enters <strong>the</strong><br />
water table in <strong>the</strong> unconfined portion <strong>of</strong><br />
<strong>the</strong> aquifer but emerges as discharge to<br />
seeps and springs in valleys, base flows to<br />
rivers and streams, and evapotranspiration<br />
in bottomland areas. This is <strong>of</strong>ten<br />
referred to as rejected recharge. These<br />
springs may form in alluvial deposits and<br />
be apparent along streams and rivers,<br />
such as Bastrop Springs. However, <strong>the</strong>se<br />
types <strong>of</strong> springs more commonly issue<br />
subaqueously in stream and river bottoms<br />
as <strong>the</strong>y traverse aquifer outcrops<br />
and form gaining reaches <strong>of</strong> streams.<br />
Groundwater that does not emerge as<br />
gravity springs and seeps and makes its<br />
way to <strong>the</strong> confined portion <strong>of</strong> <strong>the</strong> aquifer<br />
is discharged naturally through artesian<br />
springs and cross-formational leakage as<br />
well as artificially through wells. Artesian<br />
springs form where groundwater<br />
confined by relatively impermeable beds<br />
and/or faults is forced to <strong>the</strong> surface,<br />
which is relatively uncommon in <strong>the</strong><br />
Carrizo-Wilcox and associated aquifers.<br />
One example is <strong>the</strong> springs associated<br />
with <strong>the</strong> Elkhart Graben-Mount Enterprise<br />
fault system that provide flow to<br />
Elkhart Creek (Brune, 1975). Many, if not<br />
64 <strong>Texas</strong> Water Development Board <strong>Report</strong> <strong>374</strong>
FRANKLIN<br />
BOWIE<br />
³<br />
HOPKINS TITUS<br />
MORRIS CASS<br />
CAMP<br />
MARION<br />
WOOD<br />
UPSHUR<br />
VAN ZANDT<br />
HARRISON<br />
GREGG<br />
SMITH<br />
HENDERSON<br />
RUSK<br />
PANOLA<br />
NAVARRO<br />
FREESTONE<br />
ANDERSON<br />
CHEROKEE<br />
NACOGDOCHES<br />
SHELBY<br />
LIMESTONE<br />
SAN AUGUSTINE<br />
FALLS<br />
LEON<br />
HOUSTON<br />
TRINITY<br />
ANGELINA<br />
SABINE<br />
ROBERTSON<br />
MADISON<br />
MILAM<br />
WALKER<br />
WILLIAMSON<br />
BRAZOS<br />
BURLESON<br />
GRIMES<br />
LEE<br />
WASHINGTON<br />
BASTROP<br />
CALDWELL<br />
FAYETTE<br />
GUADALUPE<br />
UVALDE<br />
MEDINA<br />
BEXAR<br />
GONZALES<br />
LAVACA<br />
WILSON<br />
Carrizo Aquifer<br />
MAVERICK<br />
ZAVALA<br />
FRIO<br />
ATASCOSA<br />
KARNES<br />
Carrizo downdip<br />
Carrizo outcrop<br />
DIMMIT<br />
LA SALLE<br />
MCMULLEN<br />
LIVE OAK<br />
BEE<br />
Minor aquifers<br />
Sparta<br />
WEBB<br />
Brazos River Alluvium<br />
Yegua-Jackson<br />
Queen City<br />
0 50 100<br />
Miles<br />
Compiled by <strong>the</strong> <strong>Texas</strong> Parks and<br />
Wildlife Department Water Resources<br />
Branch. No claims are made to <strong>the</strong><br />
accuracy <strong>of</strong> <strong>the</strong> data or its suitablility<br />
to a particular use.<br />
Figure 4-2. Map <strong>of</strong> Carrizo-Wilcox and associated minor aquifers (aquifer data from <strong>the</strong> TWDB database, www.twdb.state.<br />
tx.us/data/data.asp).<br />
<strong>Texas</strong> Water Development Board <strong>Report</strong> <strong>374</strong> 65
most, <strong>of</strong> <strong>the</strong> artesian springs historically<br />
documented from <strong>the</strong> Carrizo-Wilcox<br />
and associated aquifers ceased to flow<br />
decades ago as development <strong>of</strong> <strong>the</strong> aquifer<br />
reduced <strong>the</strong> hydraulic head or artesian<br />
pressure (Brune, 1981). Alterations<br />
to <strong>the</strong> hydraulic head may also impact <strong>the</strong><br />
relationship between adjacent aquifers<br />
and cross-formational flow.<br />
Cross-formational leakage is <strong>the</strong><br />
movement <strong>of</strong> water from one aquifer<br />
to an underlying or overlying aquifer,<br />
depending upon <strong>the</strong> vertical gradient<br />
in hydraulic head. Several studies have<br />
found that <strong>the</strong> Carrizo-Wilcox Aquifer<br />
discharges water upward to younger,<br />
overlying aquifers such as <strong>the</strong> Queen City<br />
Aquifer (Kreitler, 1979; Fogg and o<strong>the</strong>rs,<br />
1983; Hamlin, 1988). This is significant<br />
because as <strong>the</strong> Carrizo-Wilcox Aquifer<br />
has been developed, <strong>the</strong> natural balance<br />
<strong>of</strong> recharge and discharge (such as<br />
cross-formational flow and springflow)<br />
has changed (Dutton and o<strong>the</strong>rs, 2003).<br />
In areas experiencing heavy groundwater<br />
pumping, <strong>the</strong> hydraulic gradient between<br />
aquifers has been reversed, resulting in<br />
cross-formational flow from overlying<br />
younger units (for example, <strong>the</strong> Queen<br />
City Sand) to <strong>the</strong> Carrizo-Wilcox Aquifer.<br />
The resulting reduction in upward flow<br />
from <strong>the</strong> confined portion <strong>of</strong> <strong>the</strong> Carrizo-Wilcox<br />
Aquifer may ultimately have<br />
an indirect impact on <strong>the</strong> quantity and<br />
reliability <strong>of</strong> water produced by springs<br />
issuing from <strong>the</strong> Queen City Aquifer and<br />
o<strong>the</strong>r minor aquifers as dynamic equilibrium<br />
is fur<strong>the</strong>r impacted.<br />
4.3<br />
Springs <strong>of</strong> <strong>the</strong> Carrizo-<br />
Wilcox and associated<br />
aquifers<br />
Information on <strong>Texas</strong> springs is largely<br />
limited to that collected by <strong>the</strong> U.S.<br />
Geological Survey and <strong>the</strong> <strong>Texas</strong> Water<br />
Development Board (TWDB) while<br />
inventorying and studying groundwater<br />
supplies across <strong>the</strong> state. As such,<br />
<strong>the</strong> information is scattered in various<br />
reports, and <strong>the</strong> springs documented<br />
are primarily limited to those that were<br />
or are used for domestic, livestock, or<br />
agricultural purposes. Moreover, <strong>the</strong><br />
data contained in <strong>the</strong> reports were<br />
generally limited to location, geologic<br />
formation, and one or more discharge<br />
estimates. Very little data have been<br />
ga<strong>the</strong>red on <strong>the</strong> vast majority <strong>of</strong> <strong>Texas</strong><br />
springs. In fact, information as basic as<br />
<strong>the</strong> location, distribution, and extent <strong>of</strong><br />
springs in <strong>Texas</strong> is lacking, as no thorough<br />
inventory has been performed.<br />
Gunnar Brune, a geologist for TWDB,<br />
compiled much <strong>of</strong> <strong>the</strong> information<br />
available on springs in state and federal<br />
reports and ga<strong>the</strong>red some additional<br />
data. Brune (1975) first identified some<br />
281 major and historical springs in <strong>Texas</strong>,<br />
only 11 <strong>of</strong> which reportedly issue from <strong>the</strong><br />
Carrizo-Wilcox and associated aquifers.<br />
Later, Brune (1981) compiled existing data<br />
and ga<strong>the</strong>red some additional information<br />
on slightly more than 2,000 springs<br />
from 183 <strong>of</strong> <strong>the</strong> 254 <strong>Texas</strong> counties. The<br />
work <strong>of</strong> Brune essentially documented<br />
<strong>the</strong> loss and decline <strong>of</strong> <strong>Texas</strong> springs but<br />
provided little ecological information.<br />
In 2003, <strong>the</strong> U.S. Geological Survey,<br />
in cooperation with TWDB, published<br />
a database <strong>of</strong> historically documented<br />
springs and springflow measurements<br />
in <strong>Texas</strong> (Heitmuller and Reece, 2003).<br />
Approximately 2,000 springs were identified<br />
and are in <strong>the</strong> database. Approximately<br />
217 <strong>of</strong> <strong>the</strong>se springs are reported<br />
to issue from <strong>the</strong> Carrizo-Wilcox and<br />
associated aquifers. Analysis <strong>of</strong> <strong>the</strong> distribution<br />
<strong>of</strong> springs contained in <strong>the</strong><br />
database reveals clusters <strong>of</strong> springs in<br />
<strong>the</strong> eastern portion <strong>of</strong> <strong>the</strong> Panhandle,<br />
southwestern portion <strong>of</strong> <strong>the</strong> Big Bend<br />
region, in a band that follows <strong>the</strong> Carrizo-Wilcox<br />
and associated aquifers<br />
from south central <strong>Texas</strong> nor<strong>the</strong>asterly<br />
toward Texarkana, and throughout <strong>the</strong><br />
Edwards Plateau. The density <strong>of</strong> springs<br />
issuing from <strong>the</strong> Carrizo-Wilcox and<br />
associated aquifers is greatest in <strong>the</strong><br />
central and nor<strong>the</strong>rn part <strong>of</strong> <strong>the</strong> aquifer<br />
66 <strong>Texas</strong> Water Development Board <strong>Report</strong> <strong>374</strong>
systems, with few documented springs<br />
occurring southwest <strong>of</strong> Wilson County<br />
(Figure 4-3).<br />
In general, <strong>the</strong> density <strong>of</strong> springs<br />
appears greatest in headwater regions<br />
and is remarkably low in <strong>the</strong> lower<br />
reaches <strong>of</strong> large river basins. This may be<br />
due to physiographic differences between<br />
headwaters and lower reaches <strong>of</strong> river<br />
systems. Of course, many springs issuing<br />
into streams from sandy and alluvial<br />
aquifers, such as <strong>the</strong> Carrizo-Wilcox or<br />
Gulf Coast aquifers, do so subaqueously.<br />
They are <strong>of</strong>ten not readily apparent, may<br />
occur over great distances <strong>of</strong> aquifer outcrops,<br />
and may move to some extent in<br />
relation to river processes. As such, <strong>the</strong>se<br />
springs have been largely neglected in<br />
mapping, documenting, and studying<br />
springs. Most subaqueous springs are<br />
identified as gaining reaches <strong>of</strong> rivers in<br />
various reports, much <strong>of</strong> which was compiled<br />
by Slade and o<strong>the</strong>rs (2002).<br />
Ano<strong>the</strong>r source for identifying springs<br />
is <strong>the</strong> 7.5 minute U.S. Geological Survey<br />
topographic maps. Stevens and Meretsky<br />
(2008) searched <strong>the</strong>se maps for named<br />
springs and developed a georeferenced<br />
database for those in <strong>the</strong> western United<br />
States, including <strong>Texas</strong>. A total <strong>of</strong> 745<br />
named springs were identified in <strong>Texas</strong>.<br />
This is surprisingly low considering <strong>the</strong><br />
number <strong>of</strong> springs identified by Brune<br />
(1981) and Heitmuller and Reece (2003).<br />
However, many <strong>of</strong> <strong>the</strong> springs identified<br />
by Brune (1981) and Heitmuller and<br />
Reece (2003) are ei<strong>the</strong>r unnamed or are<br />
not depicted on U.S. Geological Survey<br />
maps.<br />
Without question, <strong>the</strong> number <strong>of</strong><br />
springs that actually exists in <strong>the</strong> state,<br />
including those associated with <strong>the</strong><br />
Carrizo-Wilcox Aquifer, is much greater<br />
than what is currently documented.<br />
For example, analysis <strong>of</strong> U.S. Geological<br />
Survey topographic maps and state<br />
and federal databases revealed only six<br />
springs in Gonzales County. With <strong>the</strong><br />
assistance <strong>of</strong> <strong>the</strong> local groundwater conservation<br />
district and landowners, Helen<br />
Besse (personal communication 2009)<br />
identified 20 springs in <strong>the</strong> county. This<br />
represents a threefold increase in <strong>the</strong><br />
number <strong>of</strong> springs documented in <strong>the</strong><br />
county and highlights <strong>the</strong> need for more<br />
on-<strong>the</strong>-ground research.<br />
4.4<br />
Characteristics <strong>of</strong><br />
Carrizo-Wilcox springs<br />
The geology and characteristics <strong>of</strong> an<br />
aquifer (for example, parent material,<br />
permeability, and porosity) from which<br />
a spring flows dictate <strong>the</strong> location <strong>of</strong> <strong>the</strong><br />
spring outflow, <strong>the</strong> physical and chemical<br />
properties <strong>of</strong> <strong>the</strong> water it discharges,<br />
and <strong>the</strong> type <strong>of</strong> habitat formed by <strong>the</strong><br />
spring outflow. From <strong>the</strong> perspective<br />
<strong>of</strong> spring ecology, <strong>the</strong> most important<br />
hydrogeological distinction may be<br />
between springs fed by slow seepage<br />
through small pore spaces and those fed<br />
by rapid flow through wide openings<br />
in rock. For example, springs issuing<br />
from <strong>the</strong> Carrizo-Wilcox Aquifer differ<br />
greatly from those in Central <strong>Texas</strong><br />
that issue from karst limestone aquifers<br />
such as <strong>the</strong> Trinity and Edwards. Carrizo-Wilcox<br />
springs are typically smaller,<br />
younger, and less stable than those <strong>of</strong><br />
<strong>the</strong> Edwards or Trinity aquifers.<br />
Springs issuing from <strong>the</strong> Carrizo-<br />
Wilcox and associated minor aquifers,<br />
including <strong>the</strong> Queen City, Sparta,<br />
Weches, and Yegua formations, tend to<br />
be smaller in size both in terms <strong>of</strong> <strong>the</strong><br />
actual orifice and <strong>the</strong> volume <strong>of</strong> discharge<br />
produced and <strong>of</strong>ten rise discretely<br />
as a group or series <strong>of</strong> seeps that coalesce<br />
into a stream. The sands that form <strong>the</strong>se<br />
aquifers were deposited during <strong>the</strong> Tertiary<br />
Period (65 to 1.8 million years ago).<br />
However, because <strong>of</strong> <strong>the</strong> unconsolidated<br />
nature <strong>of</strong> sand, springs produced from<br />
it are typically young, rarely surviving<br />
100 years (Brune, 1981). They are easily<br />
destroyed or altered by natural and<br />
human means, but new springs will<br />
appear in <strong>the</strong> same general area as long<br />
as <strong>the</strong> water table remains above <strong>the</strong><br />
spring orifice. The relatively low transmissivity<br />
<strong>of</strong> sand as compared to <strong>the</strong><br />
<strong>Texas</strong> Water Development Board <strong>Report</strong> <strong>374</strong> 67
³<br />
HOPKINS<br />
FRANKLIN<br />
TITUS<br />
MORRIS<br />
CAMP<br />
WOOD<br />
UPSHUR<br />
VAN ZANDT<br />
SMITH<br />
GREGG<br />
BOWIE<br />
CASS<br />
MARION<br />
HARRISON<br />
HENDERSON<br />
RUSK<br />
PANOLA<br />
NAVARRO<br />
FREESTONE<br />
CHEROKEE<br />
ANDERSON<br />
SHELBY<br />
NACOGDOCHES<br />
LIMESTONE<br />
FALLS<br />
LEON<br />
HOUSTON<br />
TRINITY<br />
SAN AUGUSTINE<br />
ANGELINA<br />
SABINE<br />
ROBERTSON<br />
MADISON<br />
WILLIAMSON<br />
MILAM<br />
BRAZOS<br />
GRIMES<br />
WALKER<br />
BASTROP<br />
LEE<br />
BURLESON<br />
WASHINGTON<br />
CALDWELL<br />
FAYETTE<br />
GUADALUPE<br />
UVALDE<br />
MEDINA<br />
BEXAR<br />
GONZALES<br />
LAVACA<br />
Carrizo Aquifer<br />
WILSON<br />
Carrizo downdip<br />
ZAVALA<br />
FRIO<br />
ATASCOSA<br />
KARNES<br />
Carrizo outcrop<br />
MAVERICK<br />
DIMMIT<br />
LA SALLE<br />
MCMULLEN<br />
LIVE OAK<br />
BEE<br />
Minor aquifers<br />
Sparta<br />
Brazos River Alluvium<br />
WEBB<br />
Yegua-Jackson<br />
Queen City<br />
Springs<br />
0 50 100<br />
Miles<br />
Compiled by <strong>the</strong> <strong>Texas</strong> Parks and<br />
Wildlife Department Water Resources<br />
Branch. No claims are made to <strong>the</strong><br />
accuracy <strong>of</strong> <strong>the</strong> data or its suitablility<br />
to a particular use.<br />
Figure 4-3. Carrizo-Wilcox and associated aquifers with springs (Heitmuller and Reece, 2003; aquifer data from <strong>the</strong> TWDB<br />
database, www.twdb.state.tx.us/data/data.asp).<br />
68 <strong>Texas</strong> Water Development Board <strong>Report</strong> <strong>374</strong>
karstic limestone aquifers <strong>of</strong> Central<br />
<strong>Texas</strong> imparts less variability in flow and<br />
allows flow to persist for many months<br />
to years without rainfall in <strong>the</strong> recharge<br />
zone (Brune, 1981). However, <strong>the</strong> relatively<br />
small pore spaces that impart less<br />
variability in flow also limit <strong>the</strong> distribution<br />
<strong>of</strong> hypogean species, which result in<br />
a lower proportion <strong>of</strong> rare, endemic, and<br />
relict species as compared to <strong>the</strong> limestone<br />
springs <strong>of</strong> Central <strong>Texas</strong>.<br />
Water traveling through a carbonate<br />
aquifer system, such as <strong>the</strong> Edwards-<br />
Trinity Aquifer, becomes charged with<br />
calcium bicarbonate and loses carbon<br />
dioxide, resulting in an increased pH. In<br />
<strong>the</strong>se types <strong>of</strong> aquifers, calcium carbonate,<br />
aided by photosyn<strong>the</strong>sis, is deposited<br />
in <strong>the</strong> groundwater (Hynes, 1970).<br />
Because <strong>of</strong> <strong>the</strong> freshwater input from<br />
and stable substrate <strong>of</strong> limestone springs,<br />
algae, mosses, and o<strong>the</strong>r higher plants,<br />
referred to as hydrophytes, are <strong>of</strong>ten well<br />
developed (Ward, 1992). Hydrophyte<br />
communities provide a mosaic <strong>of</strong> habitat<br />
patches in springs (Minckley, 1963: Ward<br />
and Dufford, 1979) and can be a major<br />
source <strong>of</strong> organic detritus (Ward, 1992).<br />
As a result, <strong>the</strong> primary productivity <strong>of</strong><br />
<strong>the</strong>se springs is principally autochthonous,<br />
or derived from within <strong>the</strong> system<br />
(Thorup, 1966; Ward and Dufford<br />
1979).<br />
Carrizo-Wilcox springs are more<br />
acidic with fewer aquatic macrophytes<br />
and more allochthonous (derived from<br />
outside <strong>the</strong> system) sources <strong>of</strong> energy as<br />
compared to springs from <strong>the</strong> Edwards<br />
or Trinity aquifers. Shading from <strong>the</strong><br />
canopy prevents extensive hydrophyte<br />
production, and <strong>the</strong> influx <strong>of</strong> terrestrial<br />
leaf litter contributes greatly to <strong>the</strong><br />
composition <strong>of</strong> woodland spring habitats<br />
(Minshall, 1968; Ward, 1992).<br />
As a result <strong>of</strong> <strong>the</strong> acidity, groundwater<br />
from Carrizo-Wilcox springs tends to<br />
leach iron, resulting in high concentrations<br />
<strong>of</strong> ferrous bicarbonate in solution.<br />
As <strong>the</strong> spring water reaches <strong>the</strong> surface<br />
and acquires oxygen, <strong>the</strong> deposition <strong>of</strong><br />
ferric hydroxide occurs. As a result, <strong>the</strong><br />
spring orifices are <strong>of</strong>ten covered with<br />
masses <strong>of</strong> siderophile (iron-loving) bacteria.<br />
The downstream reaches <strong>of</strong> <strong>the</strong><br />
spring habitats generally clear up as <strong>the</strong><br />
water acquires inorganic ions.<br />
Several characteristics <strong>of</strong> groundwater<br />
that separate it from surface water<br />
are important in <strong>the</strong> ecology <strong>of</strong> spring<br />
habitats. Spring water is usually derived<br />
from water that has infiltrated at many<br />
locations over a range <strong>of</strong> time periods.<br />
Infiltration can occur a great distance<br />
from <strong>the</strong> site <strong>of</strong> discharge, and residence<br />
times can vary from days to thousands<br />
<strong>of</strong> years (Kamp, 1995). The solutes present<br />
and <strong>the</strong>ir relative concentrations<br />
are largely determined by <strong>the</strong> geology<br />
<strong>of</strong> <strong>the</strong> strata through which <strong>the</strong> water has<br />
passed (Freeze and Cherry, 1979). The<br />
water quality <strong>of</strong> <strong>the</strong> discharged spring<br />
water is important because it is also a<br />
major determinant for <strong>the</strong> ecology <strong>of</strong> a<br />
spring system.<br />
4.5<br />
Ecology <strong>of</strong> Carrizo-Wilcox<br />
springs<br />
Typically, physicochemical characteristics<br />
<strong>of</strong> spring systems are less variable<br />
than in surface water systems such as<br />
streams or reservoirs. Spring systems<br />
generally provide uniform conditions in<br />
contrast to surface water, which is generally<br />
subjected to more seasonal variation<br />
(Hynes, 1970). As a result, many springs<br />
harbor taxonomically or ecologically<br />
interesting organisms including rare,<br />
endemic, and relict species (Nielson,<br />
1950; Edwards and o<strong>the</strong>rs, 1989; Bowles<br />
and Arsuffi, 1993), which are adapted<br />
to and dependent upon <strong>the</strong> <strong>the</strong>rmal<br />
and hydrologic stability <strong>of</strong> <strong>the</strong>se environments<br />
(Hynes, 1970; Hubbs, 1995).<br />
Compared with higher-order streams,<br />
most springs have greater physical and<br />
chemical stability, smaller and more isolated<br />
habitat areas, fewer large predators,<br />
and presumably shorter durations<br />
in geologic time (Glazier, 1991; Kamp,<br />
<strong>Texas</strong> Water Development Board <strong>Report</strong> <strong>374</strong> 69
1995). All <strong>of</strong> <strong>the</strong>se factors, and possibly<br />
o<strong>the</strong>rs, are important determinants <strong>of</strong><br />
<strong>the</strong> distinctive spring fauna.<br />
Perhaps <strong>the</strong> most ecologically important<br />
feature <strong>of</strong> many springs is <strong>the</strong> <strong>the</strong>rmal<br />
and hydrologic consistency <strong>the</strong>y display<br />
through <strong>the</strong> year (Hynes, 1970; Ward,<br />
1992). The average water temperature<br />
<strong>of</strong> a typical spring is very nearly equal to<br />
<strong>the</strong> average mean air temperature in <strong>the</strong><br />
area. As a result, spring environments in<br />
<strong>the</strong> temperate zone are generally cooler<br />
than o<strong>the</strong>r natural surface waters in <strong>the</strong><br />
summer months and warmer in <strong>the</strong> winter<br />
months. Variations in temperature<br />
generally result from ei<strong>the</strong>r shallow flow<br />
areas near <strong>the</strong> spring or from very rapid<br />
infiltration and flow through cavernous<br />
formations (local flow systems with short<br />
residence times) (Kamp, 1995).<br />
Although <strong>the</strong> temperature requirements<br />
<strong>of</strong> many aquatic animals are not<br />
known, cold spring inhabitants, in general,<br />
are known to have narrow limits<br />
<strong>of</strong> tolerance to variation (Hynes, 1970;<br />
Hubbs, 1995), which probably accounts<br />
for <strong>the</strong> restriction <strong>of</strong> typical spring fauna<br />
to a narrow zone below <strong>the</strong> spring source<br />
where temperature variance is minimal.<br />
Such species are generally unable to<br />
maintain populations in habitats with<br />
greater <strong>the</strong>rmal variability.<br />
From a biological perspective, <strong>the</strong><br />
most important factor related to <strong>the</strong> flow<br />
<strong>of</strong> a spring is <strong>the</strong> persistence <strong>of</strong> <strong>the</strong> flow<br />
(Danks and Williams, 1991; Kamp, 1995).<br />
Also <strong>of</strong> great importance, and closely<br />
related to persistence, is <strong>the</strong> variability <strong>of</strong><br />
<strong>the</strong> flow. In general, <strong>the</strong> most permanent<br />
springs can be expected to be those fed<br />
by long flow systems with a moderately<br />
permeable material and with high porosity<br />
at <strong>the</strong> water table. Springs discharging<br />
from sand aquifers tend to display persistent<br />
flow as <strong>the</strong>y are fed by slow seepage<br />
through small pores with strong filtration.<br />
In some cases, many years may be<br />
required for water to travel from areas <strong>of</strong><br />
recharge to areas <strong>of</strong> discharge (springs),<br />
resulting in a delayed action that allows<br />
springs to flow persistently for many<br />
months to a year without significant<br />
rainfall in <strong>the</strong> recharge zone.<br />
The persistence <strong>of</strong> flow is important<br />
in terms <strong>of</strong> dispersal from and <strong>the</strong> colonization<br />
<strong>of</strong> spring habitats. As a spring<br />
habitat begins to dry up, aquatic organisms<br />
will generally ei<strong>the</strong>r disperse to find<br />
a favorable habitat, enter a dormant stage<br />
to avoid dessication, exploit hyporheic or<br />
hypogean habitats, or be extirpated from<br />
<strong>the</strong> habitat (Ward, 1992). Some common<br />
spring inhabitants such as amphipods,<br />
isopods, and snails have limited dispersal<br />
capabilities as <strong>the</strong>y lack <strong>the</strong> ability to<br />
fly. Dispersal efforts by such species are<br />
likely complicated by <strong>the</strong> fact that many<br />
spring habitats are isolated from o<strong>the</strong>r<br />
suitable habitats by great distances or by<br />
inhospitable habitats that <strong>the</strong>y are unable<br />
to traverse. The greatest impact from<br />
<strong>the</strong> cessation <strong>of</strong> flow is likely to occur in<br />
springs with historically persistent flow<br />
as <strong>the</strong>se are <strong>the</strong> springs that commonly<br />
harbor rare and interesting species.<br />
The variability <strong>of</strong> flow from a spring<br />
is also a major determinant in shaping<br />
<strong>the</strong> spring community. In some cases,<br />
<strong>the</strong> stable flow conditions allow colonization<br />
by certain species that are unable<br />
to maintain populations in streams with<br />
highly variable discharge (Ward, 1992). In<br />
o<strong>the</strong>r cases, it may preclude species that<br />
require variable discharges to complete<br />
<strong>the</strong>ir life cycle.<br />
4.5.1<br />
Spring fauna<br />
The fauna <strong>of</strong> springs is generally<br />
dominated by macroinvertebrates<br />
but also commonly includes amphibians,<br />
reptiles, and fish. The diversity in<br />
spring habitats is <strong>of</strong>ten reported to be<br />
depressed (Odum, 1957; Minshall, 1968;<br />
Ward and Dufford, 1979). Depressed<br />
diversity in spring habitats has been<br />
attributed to many factors, including<br />
poor water quality at <strong>the</strong> source area,<br />
<strong>the</strong> lack <strong>of</strong> heterogeneity in certain factors<br />
(such as temperature and flow) that<br />
are needed by some species to complete<br />
<strong>the</strong>ir life cycle, and <strong>the</strong> geographic<br />
70 <strong>Texas</strong> Water Development Board <strong>Report</strong> <strong>374</strong>
isolation <strong>of</strong> many springs (Ward, 1992).<br />
These factors not only affect <strong>the</strong> overall<br />
diversity <strong>of</strong> organisms present at a<br />
particular spring, but also <strong>the</strong> diversity<br />
within specific taxonomic groups.<br />
In most streams, <strong>the</strong>re is a progressive<br />
increase in numbers <strong>of</strong> fish (Mat<strong>the</strong>ws,<br />
1998) and macroinvertebrate (Ward,<br />
1992) species downstream as habitat<br />
heterogeneity increases.<br />
The organisms present at a particular<br />
spring usually include species restricted<br />
and adapted to springs and common species<br />
with a broader distribution that find<br />
conditions favorable in spring habitats.<br />
Organisms restricted to springs include<br />
those that are unable to maintain populations<br />
in streams with highly variable<br />
conditions. These organisms commonly<br />
include rare, endemic, relict, and hypogean<br />
organisms with specific life history<br />
requirements related to spring habitats.<br />
Organisms restricted to springs <strong>of</strong>ten<br />
form an important component <strong>of</strong> <strong>the</strong><br />
spring fauna and, although <strong>the</strong>y persist<br />
in sheltered places for some distance<br />
downstream, are commonly absent<br />
from downstream reaches. Common<br />
stream-dwelling species appear fur<strong>the</strong>r<br />
downstream but may also penetrate up<br />
to <strong>the</strong> spring orifice. In some cases, <strong>the</strong>y<br />
may find conditions in spring habitats<br />
more favorable at certain times <strong>of</strong> <strong>the</strong><br />
year or following certain environmental<br />
extremes.<br />
For example, <strong>the</strong> Mexican tetra<br />
(Astyanax mexicanus) is a common,<br />
widespread species found in a variety<br />
<strong>of</strong> habitats (Thomas and o<strong>the</strong>rs, 2007).<br />
The nor<strong>the</strong>rn distribution <strong>of</strong> <strong>the</strong> Mexican<br />
tetra is apparently limited by its lack<br />
<strong>of</strong> cold tolerance (Edwards, 1999). During<br />
winter months when spring habitats<br />
are relatively warm, Mexican tetras are<br />
<strong>of</strong>ten more abundant as compared to<br />
o<strong>the</strong>r times <strong>of</strong> year and are commonly<br />
<strong>the</strong> dominant fish species (Norris, 2009,<br />
unpublished data). Similarly, o<strong>the</strong>r common<br />
fish species, such as <strong>the</strong> channel<br />
catfish (Ictalurus punctatus) and black<br />
bass (Micropterus sp.), are <strong>of</strong>ten found in<br />
greater abundance in headwater spring<br />
habitats following flood events (Norris,<br />
2009, unpublished data). This suggests<br />
<strong>the</strong>y found refuge in <strong>the</strong> isolated spring<br />
habitats when a hydrologic connection<br />
during flood stage allowed entry to <strong>the</strong><br />
habitat. Over time, <strong>the</strong>se species are generally<br />
lost from <strong>the</strong> community.<br />
The fish community <strong>of</strong> headwater<br />
spring habitats is generally quite limited,<br />
and <strong>the</strong> presence <strong>of</strong> fish is <strong>of</strong>ten<br />
restricted to larger spring systems with<br />
dependable flow (Mat<strong>the</strong>ws and o<strong>the</strong>rs,<br />
1983; Pflieger, 1982). Many fish species<br />
endemic to spring habitats are now<br />
extinct, endangered, or <strong>of</strong> special concern<br />
due to a myriad <strong>of</strong> environmental<br />
changes, such as exotic species introductions,<br />
dam construction, and instream<br />
flow alteration, that have altered habitats<br />
(Anderson and o<strong>the</strong>rs, 1995; Miller and<br />
o<strong>the</strong>rs, 1989). Few, if any, endemic fish<br />
species found in East <strong>Texas</strong> are restricted<br />
to spring habitats associated with <strong>the</strong><br />
Carrizo-Wilcox and associated aquifers.<br />
This is not surprising as <strong>the</strong> proportion<br />
<strong>of</strong> endemic fish species is much lower in<br />
East <strong>Texas</strong> as compared to West <strong>Texas</strong><br />
(Hubbs and o<strong>the</strong>rs, 1991).<br />
Springs issuing from <strong>the</strong> Carrizo-Wilcox<br />
and associated aquifers, especially<br />
subaqueous springs, play an important<br />
role in sustaining downstream fish populations<br />
by providing perennial aquatic<br />
habitat during drought. Subaqueous<br />
springs also serve as a vital source <strong>of</strong><br />
prey items for downstream communities.<br />
These springs <strong>of</strong>ten issue through extensive<br />
alluvial deposits overlying larger<br />
regional aquifers. At <strong>the</strong> interface <strong>of</strong><br />
<strong>the</strong>se alluvial aquifers and surface water<br />
habitats where groundwater and surface<br />
water readily mix is <strong>the</strong> hyporheic<br />
zone. A distinct fauna, referred to as <strong>the</strong><br />
hyporheic mei<strong>of</strong>auna, inhabits <strong>the</strong> interstitial<br />
spaces between sediments. The<br />
hyporheic mei<strong>of</strong>auna includes a diverse<br />
group <strong>of</strong> organisms between 50 and 1,000<br />
micrometers in size from a wide range<br />
<strong>of</strong> taxa, including crustaceans, insects,<br />
rotifers, oligochaetes, nematodes, and<br />
<strong>Texas</strong> Water Development Board <strong>Report</strong> <strong>374</strong> 71
tartigrades. However, considerable differences<br />
exist in <strong>the</strong> percent composition<br />
<strong>of</strong> <strong>the</strong>se taxa in different streams.<br />
Coarse sediments <strong>of</strong>ten contain more<br />
crustaceans and insects, and sandy sediments<br />
<strong>of</strong>ten contain more rotifers, nematodes,<br />
and tartigrades (Hakenkamp and<br />
Palmer, 2000). This difference is likely<br />
due to size differences as crustaceans<br />
and insects are at <strong>the</strong> upper size range<br />
<strong>of</strong> mei<strong>of</strong>auna but may be an artifact <strong>of</strong><br />
<strong>the</strong> protocol and gear used in sampling<br />
<strong>the</strong> two substrates.<br />
The hyporheic mei<strong>of</strong>auna are important<br />
for several reasons. They are <strong>the</strong> link<br />
between microbial communities and<br />
higher trophic levels (as prey) and can<br />
be a significant food source for predators<br />
such as macroinvertebrates and fish<br />
(Pope and Brown, 1996; Hakenkamp and<br />
Palmer, 2000). The distribution <strong>of</strong> <strong>the</strong><br />
hyporheic mei<strong>of</strong>auna is greatly influenced<br />
by both <strong>the</strong> unidirectional flow<br />
<strong>of</strong> streams and <strong>the</strong> upwelling or downwelling<br />
<strong>of</strong> water vertically. Both forces<br />
influence whe<strong>the</strong>r <strong>the</strong> fauna are flushed<br />
from sediments (induced into drifting) or<br />
can settle from <strong>the</strong> water column. In fact,<br />
distinct species assemblages have been<br />
identified within <strong>the</strong> hyporheic zone in<br />
relation to <strong>the</strong> magnitude and direction<br />
<strong>of</strong> vertical water flux (Boulton and o<strong>the</strong>rs,<br />
1992; Williams, 1993). Because many<br />
fish species are known to feed on drifting<br />
invertebrates, areas <strong>of</strong> upwelling that<br />
induce invertebrates to drift likely serve<br />
as feeding hot spots. This may explain<br />
why it is common to see fish congregating<br />
in areas where springs emerge into<br />
stream bottoms.<br />
The invertebrate community <strong>of</strong> spring<br />
headwaters tends to be dominated by<br />
noninsect fauna such as amphipods, isopods,<br />
triclads, and mollusks, especially<br />
in <strong>the</strong> spring source area (Glazier and<br />
Gooch, 1987; Gooch and Glazier, 1991;<br />
Webb and o<strong>the</strong>rs, 1995; Williams and<br />
Williams, 1998). Hynes (1970) delineated<br />
four faunal components <strong>of</strong> spring macroinvertebrate<br />
communities: 1) groundwater<br />
forms—primarily noninsect taxa<br />
restricted to <strong>the</strong> spring source, 2) marginal<br />
forms—species normally inhabiting<br />
wet margin habitats that become more<br />
fully aquatic in <strong>the</strong> uniform conditions <strong>of</strong><br />
rheocrenes, 3) crenon forms—relict species<br />
<strong>of</strong> previously widespread populations<br />
that found refuge in spring habitats and<br />
species normally occurring in headwater<br />
reaches <strong>of</strong> streams that inhabit and are<br />
restricted to springs at lower elevations,<br />
and 4) stream forms—members <strong>of</strong> <strong>the</strong><br />
normal stream fauna that find conditions<br />
favorable in springs and springbrooks.<br />
In general, much like fish communities,<br />
<strong>the</strong> diversity <strong>of</strong> <strong>the</strong> macroinvertebrate<br />
community tends to increase<br />
downstream from spring sources due to<br />
increasing <strong>the</strong>rmal and habitat heterogeneity<br />
(Minckley, 1963; Minshall, 1968;<br />
Ward and Dufford, 1979; Ward, 1992).<br />
Depressed macroinvertebrate diversities<br />
at spring sources have been attributed to<br />
<strong>the</strong>rmal constancy (Ward and Stanford,<br />
1982), habitat persistence and structure<br />
(Erman and Erman, 1984; Glazier, 1991;<br />
Smith and o<strong>the</strong>rs, 2003), and water quality<br />
(Strayer, 1994). These characteristics<br />
or properties may eliminate or exclude<br />
species with life history requirements<br />
related to <strong>the</strong>se factors, such as those<br />
species that require changes in temperature<br />
to complete <strong>the</strong>ir life cycle (Hynes,<br />
1970; Ward, 1992). Interestingly, species<br />
that inhabit springs typically display a<br />
higher fecundity (number <strong>of</strong> <strong>of</strong>fspring<br />
per generation) and multi-voltinism<br />
(number <strong>of</strong> generations per year) than<br />
closely related species or even <strong>the</strong> same<br />
species that inhabit o<strong>the</strong>r natural surface<br />
waters (Hynes, 1970; Ward, 1992).<br />
The macroinvertebrate communities<br />
<strong>of</strong> 34 sandy East <strong>Texas</strong> springs were<br />
studied by Gibson (2000). He found<br />
that springs issuing from <strong>the</strong> Carrizo-<br />
Wilcox and associated aquifers have<br />
low endemicity as compared to springs<br />
<strong>of</strong> <strong>the</strong> Edwards Plateau and that <strong>the</strong><br />
fauna was dominated by nearctic taxa<br />
restricted to colder stream headwaters.<br />
Most <strong>of</strong> <strong>the</strong> invertebrate taxa collected<br />
were relatively common, but some rare<br />
72 <strong>Texas</strong> Water Development Board <strong>Report</strong> <strong>374</strong>
species, including hypogean species,<br />
were found. Gibson (2000) identified<br />
<strong>the</strong> following nine macroinvertebrate<br />
species as indicative and expected in<br />
permanent, sandy springs <strong>of</strong> East <strong>Texas</strong>:<br />
Synurella near bifurcata (Amphipoda),<br />
Crangonyx pseudogracilis (Amphipoda),<br />
Calopteryx maculata (Odonata), Argia<br />
immunda (Odonata), Cordulegaster<br />
maculata (Odonata), Diplectrona modesta<br />
(Trichoptera), Molanna tryphena<br />
(Trichoptera), Tipula sp. (Diptera), and<br />
Bittacomorpha clavipes (Diptera).<br />
4.5.2<br />
Spring flora<br />
Springs <strong>of</strong>ten support a diverse vegetative<br />
community that occupies both<br />
aquatic and riparian habitats. Aquatic<br />
vegetation includes flowering plants,<br />
mosses, liverworts, and large algal species<br />
collectively referred to as macrophytes.<br />
Macrophytes are commonly<br />
classified as floating, emergent, or submerged<br />
based on growth habits. They<br />
are usually found in both lotic and lentic<br />
habitats but generally obtain <strong>the</strong>ir<br />
greatest diversity and density in lentic<br />
habitats. Riparian vegetation occupies<br />
<strong>the</strong> streambank and portions <strong>of</strong> <strong>the</strong><br />
floodplain periodically inundated by<br />
floods. This includes both woody and<br />
herbaceous plants. Both aquatic vegetation<br />
and riparian vegetation washed<br />
into <strong>the</strong> stream as detritus are important<br />
for providing energy and habitat<br />
heterogeneity to aquatic ecosystems,<br />
among o<strong>the</strong>r aspects. This is especially<br />
true in headwater habitats where inputs<br />
<strong>of</strong> coarse particulate matter (such as<br />
woody debris, leaves, and aquatic macrophytes)<br />
are <strong>of</strong>ten greatest (Vannote<br />
and o<strong>the</strong>rs, 1980).<br />
Much <strong>of</strong> <strong>the</strong> energy that drives aquatic<br />
foodwebs is derived from aquatic and<br />
terrestrial vegetation. This vegetation<br />
serve as a source <strong>of</strong> non-living organic<br />
matter that is broken down by microorganisms<br />
(bacteria and fungi) into particulate<br />
and dissolved organic matter.<br />
As this matter is broken down, energy<br />
is released and made available to higher<br />
trophic levels. Aquatic and terrestrial<br />
vegetation washed into streams also provides<br />
shelter and foraging opportunities<br />
for macroinvertebrate and fish species.<br />
In general, greater diversity <strong>of</strong> vegetation<br />
and detritus in an aquatic ecosystem<br />
results in a more complex habitat, which,<br />
in turn, means more niches available for<br />
aquatic organisms to occupy. Greater<br />
diversity in aquatic macrophytes <strong>of</strong>ten<br />
results in greater diversity <strong>of</strong> fish and<br />
macroinvertebrate species.<br />
The floral community <strong>of</strong> springs<br />
issuing from <strong>the</strong> Carrizo-Wilcox and<br />
associated aquifers is perhaps <strong>the</strong> most<br />
unique aspect <strong>of</strong> <strong>the</strong>se habitats. Much<br />
like <strong>the</strong> fauna associated with spring<br />
habitats, <strong>the</strong> floral community generally<br />
includes both rare and endemic species<br />
restricted to spring-influenced waters as<br />
well as common species with a broader<br />
distribution. Many <strong>of</strong> <strong>the</strong>se species are<br />
disjunct from o<strong>the</strong>r populations or are<br />
at <strong>the</strong> geographic limit <strong>of</strong> <strong>the</strong>ir range.<br />
For example, Symphyotricum puniceum<br />
var. scabricaule (rough-stemmed aster)<br />
is <strong>the</strong> southwesternmost member <strong>of</strong> its<br />
complex, with none <strong>of</strong> its close relatives<br />
occurring in <strong>Texas</strong>. It is only known from<br />
eight counties in <strong>Texas</strong> where it occupies<br />
deep muck stream valley bogs (Bridges<br />
and Singhurst, 2007).<br />
4.5.3<br />
Spring habitats<br />
Springs are among <strong>the</strong> most structurally<br />
complicated, ecologically and biologically<br />
diverse, productive, evolutionarily<br />
provocative, and threatened ecosystems<br />
on earth (Danielopol, 1989; Williams and<br />
Danks, 1991; Bowles and Arsuffi, 1993;<br />
Stevens and Meretsky, 2008). They are<br />
transitional habitats that represent <strong>the</strong><br />
interface between groundwater and surface<br />
water habitats. The myriad <strong>of</strong> habitats<br />
supported by springs ranges from<br />
apparent isolated springs that form <strong>the</strong><br />
headwaters <strong>of</strong> streams or wetlands, such<br />
<strong>Texas</strong> Water Development Board <strong>Report</strong> <strong>374</strong> 73
as hillside seeps, bogs, and fens, to discrete<br />
springs that emerge subaqueously<br />
in river and stream bottoms.<br />
In <strong>the</strong>ir zonation scheme for running<br />
waters, Illies and Botosaneanu<br />
(1963) recognized <strong>the</strong> distinctiveness <strong>of</strong><br />
spring habitats and <strong>the</strong> organisms that<br />
inhabit <strong>the</strong>m and termed <strong>the</strong> spring-fed<br />
headwaters as crenal. Crenal habitats<br />
were fur<strong>the</strong>r divided into <strong>the</strong> eucrenal<br />
for spring sources and <strong>the</strong> hypocrenal<br />
for springbrooks, or spring runs. The<br />
boundary <strong>of</strong> <strong>the</strong> eucrenal zone with <strong>the</strong><br />
hypocrenal zone is generally defined as<br />
<strong>the</strong> point where <strong>the</strong> annual variation in<br />
water temperature does not exceed 2°C<br />
(Illies and Botosaneanu, 1963; Erman and<br />
Erman, 1984). The distance over which<br />
this change occurs varies depending<br />
on <strong>the</strong> volume <strong>of</strong> flow, <strong>the</strong> shape <strong>of</strong> <strong>the</strong><br />
spring run channel, <strong>the</strong> degree <strong>of</strong> shading<br />
by riparian vegetation, and <strong>the</strong> prevailing<br />
ambient air temperature, among o<strong>the</strong>r<br />
factors.<br />
The extent and type <strong>of</strong> habitat formed<br />
at a particular spring is directly related to<br />
<strong>the</strong> quantity and persistence <strong>of</strong> water it<br />
discharges. Spring sources are generally<br />
recognized as being one <strong>of</strong> three types:<br />
rheocrenes, limnocrenes, or helocrenes<br />
(Illies and Botosaneanu, 1963; Hynes,<br />
1970). Rheocrenes are springs that emerge<br />
as running water or lotic ecosystems and<br />
are commonly referred to as springbrooks<br />
or spring runs. Limnocrenes are<br />
springs that emerge to form ponds or<br />
lakes, which generally <strong>the</strong>n outflow to<br />
form a stream. Helocrenes are marshy<br />
areas formed by springs that generally<br />
emerge as diffuse seepage. All three <strong>of</strong><br />
<strong>the</strong>se habitat types exist at outflows <strong>of</strong><br />
<strong>the</strong> Carrizo-Wilcox Aquifer. However,<br />
this classification system for headwater<br />
spring habitats does not address alluvial<br />
springs that emerge from streambanks<br />
and into stream and river bottoms. These<br />
springs are a vital component <strong>of</strong> <strong>the</strong><br />
groundwater-surface water interactions<br />
that occur with <strong>the</strong> Carrizo-Wilcox and<br />
associated aquifers. Following is a brief<br />
description <strong>of</strong> selected springs issuing<br />
from <strong>the</strong> Carrizo-Wilcox and associated<br />
aquifers that represent <strong>the</strong>se habitat<br />
types.<br />
4.5.3.1<br />
Streams (Rheocrenes)<br />
A majority <strong>of</strong> <strong>the</strong> research performed<br />
on springs in <strong>Texas</strong> and, in general, has<br />
concentrated on rheocrenes. Rheocrenes<br />
are generally characterized by<br />
a relatively constant flow regime, clear<br />
water, and stable substrate conducive<br />
to establishing a well-developed hydrophyte<br />
community (Ward, 1992). As mentioned<br />
previously, sandy springs <strong>of</strong>ten<br />
lack a well-developed hydrophyte community;<br />
<strong>the</strong>ir major source <strong>of</strong> energy is<br />
derived from terrestrial vegetation; and<br />
<strong>the</strong>y rarely emerge from an apparent<br />
orifice to form a flowing stream. They<br />
are <strong>of</strong>ten better described as a series<br />
<strong>of</strong> seeps that coalesce to form a flowing<br />
stream. However, true rheocrene<br />
springs that issue from a relatively large,<br />
single orifice do exist. Gibson (2000)<br />
<strong>of</strong>fered <strong>the</strong> following descriptions <strong>of</strong><br />
several rheocrenes:<br />
Edie’s Spring is located in Leon<br />
County, three miles north <strong>of</strong><br />
Flynn <strong>of</strong>f State Highway 39. Water<br />
trapped by an impermeable layer<br />
<strong>of</strong> clay is forced up through coarse<br />
sand forming a large tunnel with<br />
an average depth <strong>of</strong> four feet and<br />
width <strong>of</strong> three feet. The tunnel walls<br />
are formed by loosely packed sand<br />
and <strong>the</strong> bottom is clay. This large<br />
permanent spring bubbles up out<br />
<strong>of</strong> Sparta sand forming a shallow<br />
pool and flowing into <strong>the</strong> beginnings<br />
<strong>of</strong> a small, fast flowing, shallow,<br />
sandy creek. This creek widens<br />
and deepens as <strong>the</strong> banks are cut<br />
deeper fur<strong>the</strong>r downstream with<br />
<strong>the</strong> added flow <strong>of</strong> ano<strong>the</strong>r much<br />
smaller spring and several small<br />
seeps. The pH (6.2) and dissolved<br />
74 <strong>Texas</strong> Water Development Board <strong>Report</strong> <strong>374</strong>
oxygen (7.3 mg/l) are moderate<br />
with <strong>the</strong> conductivity (52.8 µS)<br />
being relatively low.<br />
Red Moore Spring is located in<br />
Wood County, one mile north <strong>of</strong><br />
West Mineola. This spring, issuing<br />
from Queen City sand, emerges<br />
from under a s<strong>of</strong>t sandstone deposit,<br />
eroding back into this formation.<br />
This spring is <strong>the</strong> beginning <strong>of</strong> a<br />
large, fast flowing, sandy creek with<br />
a moderate allochthonous material<br />
component and little iron flocculate.<br />
The conductivity (53.3 µS) is<br />
low and <strong>the</strong> dissolved oxygen (14<br />
mg/l) is high and <strong>the</strong> pH (7.02) is<br />
neutral. The richness (<strong>of</strong> invertebrate<br />
taxa) here is high due to <strong>the</strong><br />
size <strong>of</strong> this spring. Fauna such as<br />
Baetidae and Coleoptera, which<br />
<strong>of</strong>ten occur in temporary pools,<br />
large streams, and lakes, are found<br />
here because <strong>of</strong> <strong>the</strong> permanence<br />
and large size <strong>of</strong> <strong>the</strong> many pools<br />
and backwaters.<br />
Tonkawa Springs is located in<br />
Nacogdoches County, seven miles<br />
sou<strong>the</strong>ast <strong>of</strong> Mount Enterprise <strong>of</strong>f<br />
State Highway 1087. This spring,<br />
issuing from Queen City sand,<br />
emerges from a sandstone cave<br />
eroded by <strong>the</strong> flow <strong>of</strong> <strong>the</strong> spring<br />
itself. This is <strong>the</strong> largest spring<br />
sampled with a flow <strong>of</strong> 11 liters/<br />
second in 1978, and is perhaps <strong>the</strong><br />
largest sandy spring that still exists<br />
in <strong>Texas</strong>. Chemical analysis at <strong>the</strong><br />
springhead showed <strong>the</strong> temperature<br />
(18ºC), pH (4.4), and dissolved<br />
oxygen (5.6 mg/l) to be relatively<br />
low, with <strong>the</strong> conductivity (109.3<br />
µS) to be moderate. The flow outside<br />
<strong>the</strong> cave is channeled within<br />
cement walls and fills a manmade<br />
pond. This spring, once used as<br />
a mill, has been dammed since<br />
before <strong>the</strong> Civil War. It has also<br />
been, and now is in <strong>the</strong> process <strong>of</strong><br />
being extensively used as a resource<br />
for bottled water. Changes made<br />
to increase <strong>the</strong> flow have resulted<br />
in erosion fur<strong>the</strong>r into <strong>the</strong> sandstone<br />
extending <strong>the</strong> length <strong>of</strong> <strong>the</strong><br />
cave and speeding up <strong>the</strong> inevitable<br />
collapse <strong>of</strong> this formation. Large<br />
amounts <strong>of</strong> sand pushed out <strong>of</strong> <strong>the</strong><br />
spring are slowly inching down <strong>the</strong><br />
channel like a glacier. The depth <strong>of</strong><br />
<strong>the</strong> water emerging from <strong>the</strong> cave is<br />
about two feet, which <strong>the</strong>n doubles<br />
about 40 feet down <strong>the</strong> channel at<br />
<strong>the</strong> end <strong>of</strong> this migrating sand bank.<br />
Large filamentous algae blooms<br />
were observed from this point<br />
in <strong>the</strong> channel continuing downstream<br />
and filling up <strong>the</strong> pond. The<br />
pond reaches depths up to 15 feet<br />
and probably averages near 7 feet.<br />
The overflow <strong>of</strong> <strong>the</strong> dam produced<br />
a more typical sand spring habitat<br />
forming a large, shallow stream<br />
winding through piney woods.<br />
This stream had large amounts <strong>of</strong><br />
allochthonous material and some<br />
small areas <strong>of</strong> iron flocculate. The<br />
temperature (23.1º C), conductivity<br />
(93.9 µS) and dissolved oxygen (6.6<br />
mg/l) were all found to be moderate<br />
here, with pH (4.78) still relatively<br />
low.<br />
4.5.3.2<br />
Hillside seeps and bogs (Helocrene)<br />
Wetland habitats supported by springs,<br />
such as hillside seeps and bogs, are perhaps<br />
<strong>the</strong> most biologically diverse <strong>of</strong> <strong>the</strong><br />
spring habitats found at outflows <strong>of</strong> <strong>the</strong><br />
Carrizo-Wilcox and associated aquifers.<br />
Among <strong>the</strong> most unique and specialized<br />
natural communities <strong>of</strong> <strong>the</strong> Post<br />
Oak Savanna Ecoregion <strong>of</strong> <strong>Texas</strong> are <strong>the</strong><br />
hillside seepage slopes and deep muck<br />
bogs (Sphagnum-Beakrush series; East<br />
<strong>Texas</strong> Bogs) (Bridges and Singhurst,<br />
2007). These communities are permanently<br />
saturated by diffuse groundwater<br />
seepage from <strong>the</strong> adjacent upslope<br />
sandhill savannas. They support very<br />
diverse and restricted assemblages <strong>of</strong><br />
<strong>Texas</strong> Water Development Board <strong>Report</strong> <strong>374</strong> 75
plant species, many <strong>of</strong> which are at <strong>the</strong>ir<br />
western range limits and in some cases<br />
disjunct from populations much far<strong>the</strong>r<br />
north or east.<br />
Despite <strong>the</strong>ir biodiversity value, very<br />
few studies have examined <strong>the</strong> ecological<br />
or botanical significance <strong>of</strong> <strong>the</strong>se communities.<br />
Most studies have focused<br />
on only one or a few sites each (Rowell,<br />
1949a, 1949b; Kral, 1955; Starbuck, 1984;<br />
MacRoberts and MacRoberts, 1998; Singhurst<br />
and o<strong>the</strong>rs, 2003). There has been<br />
no systematic overview <strong>of</strong> <strong>the</strong>se communities<br />
as to <strong>the</strong>ir geographic range,<br />
variation over this range, and <strong>the</strong> effect<br />
<strong>of</strong> differences in seepage hydrology on<br />
<strong>the</strong> composition <strong>of</strong> <strong>the</strong> plant community.<br />
Data ga<strong>the</strong>red by Bridges and Singhurst<br />
(2007) indicate <strong>the</strong>re is a strong case for<br />
recognizing <strong>the</strong>se communities as distinct<br />
from <strong>the</strong> hillside seepage slopes <strong>of</strong><br />
sou<strong>the</strong>astern <strong>Texas</strong> and southwestern<br />
Louisiana. Such a distinction results in<br />
<strong>the</strong> definition <strong>of</strong> a community type alliance,<br />
which is endemic to <strong>the</strong> Post Oak<br />
Savanna Ecoregion <strong>of</strong> <strong>Texas</strong> and, consequently,<br />
a high priority for inventory<br />
and protection in <strong>the</strong> state (Bridges and<br />
Singhurst, 2007).<br />
Bogs and seepage slopes are most<br />
common in <strong>the</strong> Nor<strong>the</strong>rn and Central<br />
Post Oak Ecoregion areas. Within <strong>the</strong><br />
Nor<strong>the</strong>rn Post Oak Ecoregion, <strong>the</strong> highest<br />
concentration <strong>of</strong> sites are in Henderson<br />
and Anderson counties, with perhaps<br />
<strong>the</strong> greatest concentration <strong>of</strong> extant sites<br />
occurring on <strong>the</strong> Queen City Sand Formation<br />
between A<strong>the</strong>ns and Cayuga. A<br />
second concentration is in <strong>the</strong> Central<br />
Post Oak Ecoregion in Leon and sou<strong>the</strong>rn<br />
Freestone counties, mostly on <strong>the</strong> Sparta<br />
Sand and Queen City Sand formations.<br />
There are probably more extant bog<br />
and seepage slope sites in Leon County<br />
than in any o<strong>the</strong>r county in <strong>the</strong> Post<br />
Oak Ecoregion, and <strong>the</strong>y are distributed<br />
through most <strong>of</strong> <strong>the</strong> county ra<strong>the</strong>r than<br />
being concentrated in a narrow band.<br />
However, even in Leon County, intact<br />
or well-developed examples <strong>of</strong> bogs and<br />
seepage slopes are still very rare (Bridges<br />
and Singhurst, 2007).<br />
In <strong>the</strong> sou<strong>the</strong>rn Post Oak Ecoregion,<br />
bogs and seepage slopes become<br />
increasingly rare and more restricted<br />
to specialized geologic and hydrologic<br />
situations. Only a few sites are known<br />
in Robertson, Milam, Burleson, Bastrop,<br />
and Lee counties. Sites in Gonzales and<br />
Guadalupe counties represent a unique<br />
community type in a naturally rare geologic<br />
context, and it is very unlikely that<br />
many more examples <strong>of</strong> this type exist.<br />
The small seepage sites in Wilson County<br />
may represent <strong>the</strong> extreme southwestern<br />
limit <strong>of</strong> <strong>Coastal</strong> Plain deep sand seepageinfluence<br />
on natural community composition.<br />
It is likely that seepage from <strong>the</strong><br />
surficial sandy aquifers is not constant<br />
enough or strong enough to support<br />
seepage-dependent wetland plants in <strong>the</strong><br />
increasingly arid climate, except in a few<br />
isolated situations. If areas <strong>of</strong> stronger<br />
seepage influence were found south and<br />
west <strong>of</strong> this region, <strong>the</strong>y would be highly<br />
significant and very rare.<br />
Many <strong>of</strong> <strong>the</strong>se bogs have been<br />
destroyed by mining activity, impoundments,<br />
drainage, overgrazing, and competition<br />
by invasive or exotic species.<br />
Very few examples <strong>of</strong> <strong>the</strong>se communities<br />
are permanently protected, with only<br />
248 acres <strong>of</strong> this community series statewide<br />
on state-owned conservation lands.<br />
Bridges and Singhurst (2007) estimate<br />
that bogs and seepage slopes represent<br />
only a small fraction <strong>of</strong> 1 percent <strong>of</strong> <strong>the</strong><br />
total land area in <strong>the</strong> Post Oak Ecoregion.<br />
Despite <strong>the</strong>ir limited distribution, <strong>the</strong>se<br />
habitats represent a significant feature <strong>of</strong><br />
<strong>the</strong> biodiversity <strong>of</strong> <strong>the</strong> Post Oak Savanna<br />
Ecoregion as <strong>the</strong>y contain a high proportion<br />
<strong>of</strong> plant species that are ei<strong>the</strong>r<br />
rare in general (Symphyotrichum puniceum<br />
var. scabricaule [rough-stemmed<br />
aster], Eriocaulon koernickianum [smallheaded<br />
pipewort], and Xyris chapmanii<br />
[Chapman’s yellow-eyed grass]); rare<br />
in <strong>Texas</strong> although common in o<strong>the</strong>r<br />
states (Cladium mariscoides [smooth<br />
76 <strong>Texas</strong> Water Development Board <strong>Report</strong> <strong>374</strong>
sawgrass], Cinna arundinacea [sweet<br />
redwood], Rhynchospora scirpoides<br />
[longbeak beaksedge], and Burmannia<br />
biflora [nor<strong>the</strong>rn bluethread]); or rare in<br />
<strong>the</strong> Post Oak Ecoregion but common in<br />
o<strong>the</strong>r regions <strong>of</strong> <strong>the</strong> state (Lachnocaulon<br />
anceps [whitehead bogbutton], Aletris<br />
aurea [golden colicroot], Lycopodiella<br />
caroliniana [slender clubmoss], Magnolia<br />
virginiana [sweetbay], Paspalum<br />
monostchyum [gulfdune paspalum],<br />
and Rhynchospora nitens [shortbeak<br />
beaksedge]).<br />
4.5.3.3<br />
Ponds (Limnocrenes)<br />
Many spring-fed ponds exist as outflows<br />
<strong>of</strong> <strong>the</strong> Carrizo-Wilcox and associated<br />
aquifers. However, many <strong>of</strong> <strong>the</strong>se are<br />
not natural features but manmade. The<br />
very nature <strong>of</strong> spring hydrology, being<br />
mostly permanent even in droughts,<br />
makes <strong>the</strong>m a successful location for<br />
constructing small ponds. It has been<br />
quite common over <strong>the</strong> last several<br />
decades to dredge wetland areas, such<br />
as those described above, or convert<br />
small flowing springs to form ponds for<br />
agricultural or livestock uses. Gibson<br />
(2000) reported that most <strong>of</strong> <strong>the</strong> previously<br />
reported springs he visited no<br />
longer flowed and many <strong>of</strong> <strong>the</strong>se had<br />
been converted to ponds.<br />
When discussing spring-fed ponds,<br />
many think <strong>of</strong> small upland pasture<br />
ponds. However, <strong>the</strong>y may include lakes,<br />
such as oxbow lakes, as well. Horseshoe<br />
Lake is a perennial oxbow lake associated<br />
with <strong>the</strong> Brazos River. The lake was<br />
determined to be largely disconnected<br />
from <strong>the</strong> Brazos River during summer<br />
months for <strong>the</strong> period 1984–2004.<br />
Through water chemistry and isotope<br />
analysis, <strong>the</strong> origin <strong>of</strong> water to <strong>the</strong> lake<br />
was determined to be hyporheic upwelling<br />
or groundwater (Chowdhury, 2004;<br />
Osting and o<strong>the</strong>rs, 2004). Fur<strong>the</strong>rmore,<br />
models predicted <strong>the</strong> oxbow was only<br />
connected to <strong>the</strong> river six times between<br />
1940 and 2000. Thus, groundwater<br />
contributions are key to maintaining <strong>the</strong><br />
perennial nature <strong>of</strong> this habitat and <strong>the</strong><br />
organisms that inhabit it.<br />
4.5.3.4<br />
Base flow springs<br />
Base flow is an important component<br />
<strong>of</strong> <strong>the</strong> natural flow regime in many<br />
streams that represents <strong>the</strong> contribution<br />
<strong>of</strong> groundwater to gaining reaches<br />
<strong>of</strong> a stream or river. When run<strong>of</strong>f from<br />
storm events has drained away, <strong>the</strong> natural<br />
surface water flow that continues<br />
<strong>of</strong>ten represents base flow contributions<br />
from groundwater. Streams can have<br />
an intermittent or perennial base flow<br />
component. In general, surface water<br />
bodies with relatively thick unsaturated<br />
zones in arid areas, such as <strong>the</strong> sou<strong>the</strong>rn<br />
Carrizo-Wilcox, lose water, and<br />
surface water bodies in humid areas,<br />
such as <strong>the</strong> nor<strong>the</strong>rn Carrizo-Wilcox,<br />
are more typically gaining (Scanlon and<br />
o<strong>the</strong>rs, 2002). Because base flow contributions<br />
represent a significant portion<br />
<strong>of</strong> <strong>the</strong> natural flow regime in many <strong>of</strong><br />
our state’s major rivers, it is important<br />
to identify those sections <strong>of</strong> rivers that<br />
interact with groundwater.<br />
Two methods are commonly used to<br />
characterize <strong>the</strong> interaction <strong>of</strong> surface<br />
water and groundwater in streams: gain/<br />
loss studies and base flow separation.<br />
Gain/loss studies involve <strong>the</strong> manual<br />
measurement <strong>of</strong> streamflow at various<br />
locations along <strong>the</strong> length <strong>of</strong> a stream.<br />
Streamflow gains and losses are <strong>the</strong>n<br />
identified by comparing <strong>the</strong> streamflow<br />
values measured at a given location to<br />
those measured at <strong>the</strong> next downstream<br />
location. Base flow separation is a standard<br />
technique applied to historical<br />
streamflow data that provides an estimate<br />
<strong>of</strong> groundwater discharge. Both <strong>of</strong><br />
<strong>the</strong>se methods can provide an estimate<br />
<strong>of</strong> gains or losses to streamflow from a<br />
particular aquifer outcrop if <strong>the</strong> spatial<br />
resolution is sufficient.<br />
In many cases, alluvial deposits act as<br />
a transition zone or aquifer that conveys<br />
<strong>Texas</strong> Water Development Board <strong>Report</strong> <strong>374</strong> 77
water between larger, regional aquifers<br />
and streams. For example, groundwater<br />
in <strong>the</strong> bedrock Carrizo-Wilcox Aquifer<br />
moves into <strong>the</strong> Quaternary alluvial<br />
deposits that floor <strong>the</strong> valleys <strong>of</strong> <strong>the</strong> Colorado,<br />
Brazos, and Trinity rivers (Dutton<br />
and o<strong>the</strong>rs, 2003).<br />
Numerous low-flow studies have<br />
been performed on streams that cross<br />
<strong>the</strong> outcrops <strong>of</strong> <strong>the</strong> Carrizo-Wilcox and<br />
associated aquifers. Slade (2002) compiled<br />
information on a total <strong>of</strong> 47 studies<br />
that identified reaches <strong>of</strong> streams and<br />
rivers gaining or losing water from <strong>the</strong><br />
Carrizo-Wilcox Aquifer. Streams identified<br />
as gaining water as <strong>the</strong>y cross <strong>the</strong><br />
Carrizo-Wilcox outcrop include <strong>the</strong> Colorado<br />
River, Leona River, Cibolo Creek,<br />
West Bowles Creek, Little Cypress Creek,<br />
and <strong>the</strong> Sabine River, among o<strong>the</strong>rs.<br />
In many cases where base flow springs<br />
exist, springs and seeps issue from alluvial<br />
and terrace deposits on <strong>the</strong> banks.<br />
This is <strong>the</strong> case with Bastrop Springs<br />
along <strong>the</strong> Colorado River and Su<strong>the</strong>rland<br />
Springs along Cibolo Creek. Bastrop<br />
Springs issues from terrace deposits<br />
on <strong>the</strong> nor<strong>the</strong>ast bank <strong>of</strong> <strong>the</strong> Colorado<br />
River. These springs have been altered<br />
to some extent by human activity as <strong>the</strong>y<br />
are located adjacent to <strong>the</strong> town square.<br />
It is likely <strong>the</strong> springs once formed a bog<br />
or o<strong>the</strong>r wetland habitat, but <strong>the</strong>y now<br />
form small pools. The Colorado River in<br />
this area has been recognized as a gaining<br />
section for many years.<br />
In 1918, <strong>the</strong> flow <strong>of</strong> <strong>the</strong> Colorado River<br />
increased from about 61 to 97 cubic feet<br />
per second, an increase <strong>of</strong> 59 percent,<br />
as <strong>the</strong> river crossed <strong>the</strong> outcrop <strong>of</strong> <strong>the</strong><br />
Carrizo-Wilcox Aquifer. Flow at <strong>the</strong><br />
Smithville gage during this period was<br />
101 cubic feet per second. That flow rate<br />
is exceeded 99.9 percent <strong>of</strong> <strong>the</strong> time at<br />
<strong>the</strong> Smithville gage (Dutton and o<strong>the</strong>rs,<br />
2003), indicating that this section <strong>of</strong> <strong>the</strong><br />
Colorado River has been a gaining reach<br />
across <strong>the</strong> outcrop <strong>of</strong> <strong>the</strong> Carrizo-Wilcox<br />
Aquifer even during times <strong>of</strong> extreme<br />
drought.<br />
Ano<strong>the</strong>r example <strong>of</strong> base flow springs<br />
occurs along Cibolo Creek as it crosses<br />
<strong>the</strong> outcrop <strong>of</strong> <strong>the</strong> Carrizo-Wilcox Aquifer<br />
at Su<strong>the</strong>rland Springs. Su<strong>the</strong>rland<br />
Springs is composed <strong>of</strong> numerous springs,<br />
including White, Sulphur, Cold, Sour,<br />
and Alligator springs, which issue from<br />
<strong>the</strong> Carrizo Sands (Brune, 1981). Historically,<br />
<strong>the</strong> springs were much used by <strong>the</strong><br />
Coahuiltecan Indians, served as a stop<br />
on <strong>the</strong> Chihuahua Road, and had <strong>the</strong> old<br />
town <strong>of</strong> Su<strong>the</strong>rland Springs built around<br />
<strong>the</strong>m. Su<strong>the</strong>rland Springs, <strong>Texas</strong>, was a<br />
resort town billed as <strong>the</strong> “most beautiful<br />
spot in <strong>Texas</strong>” with <strong>the</strong> “largest group <strong>of</strong><br />
mineral springs in America.” In <strong>the</strong> mid<br />
to late 1800s, <strong>the</strong> springs, reportedly with<br />
27 flavors, were known for <strong>the</strong>ir medicinal<br />
qualities and supported a resort community<br />
(Brune, 1981). Like many springs<br />
in <strong>Texas</strong>, Su<strong>the</strong>rland Springs have been<br />
severely altered over <strong>the</strong> last 100 years<br />
by a variety <strong>of</strong> human and natural activities,<br />
including increased use demands<br />
placed on aquifers and surface waters<br />
by an increasing population and siltation<br />
caused by flooding.<br />
Approximately nine springs were<br />
observed during a reconnaissance trip<br />
to Cibolo Creek at Su<strong>the</strong>rland Springs<br />
on March 15, 2005, when groundcover<br />
was moderate. Springs observed along<br />
<strong>the</strong> banks <strong>of</strong> Cibolo Creek at Su<strong>the</strong>rland<br />
Springs were primarily seeps emerging<br />
from holes in <strong>the</strong> steep, muddy bank.<br />
Spring orifices were much more difficult<br />
to locate during a return visit<br />
on May 31, 2005, as ground cover was<br />
dense and covered many <strong>of</strong> <strong>the</strong> spring<br />
orifices. Among <strong>the</strong> springs observed on<br />
March 15, 2005, was a sulphur spring that<br />
once provided flow to what was billed<br />
as <strong>the</strong> “largest sulphur bathing pool in<br />
America.” Alterations to this spring are<br />
evident and dramatic. In 1913, <strong>the</strong> creek<br />
reportedly flooded over its banks and<br />
filled <strong>the</strong> spring-fed pools with mud. The<br />
stone wall and dam that formed <strong>the</strong> pool<br />
are now buried below mud and flood<br />
debris, and <strong>the</strong> spring has been reduced<br />
78 <strong>Texas</strong> Water Development Board <strong>Report</strong> <strong>374</strong>
to a trickle that supports a small, shallow<br />
pool. Based on <strong>the</strong>se observations,<br />
it appears as though sedimentation from<br />
flood events may have contributed to<br />
reduced springflows by filling spring<br />
orifices.<br />
Gains and losses in <strong>the</strong> flow <strong>of</strong> Cibolo<br />
Creek have been addressed by several<br />
studies (Holland and Welborn, 1965;<br />
Reeves and Kunze, 1970; Buzan, 1982)<br />
and provide some insight to flows derived<br />
from Su<strong>the</strong>rland Springs. Holland and<br />
Welborn (1965) identified areas <strong>of</strong> gain<br />
and loss along Cibolo Creek and <strong>of</strong>fered<br />
probable sources <strong>of</strong> input. According to<br />
<strong>the</strong>ir measurements, most <strong>of</strong> <strong>the</strong> base<br />
flow <strong>of</strong> Cibolo Creek at its mouth was<br />
derived from about a 20-mile stretch that<br />
encompasses Su<strong>the</strong>rland Springs, <strong>the</strong><br />
Carrizo Aquifer outcrop, and numerous<br />
faults that transect Cibolo Creek. The<br />
maximum flow measured by Holland<br />
and Wellborn (1965) was 18.2 cubic feet<br />
per second, and <strong>the</strong> Carrizo Sand was<br />
identified as <strong>the</strong> source <strong>of</strong> most <strong>of</strong> this<br />
water. The results <strong>of</strong> Holland and Wellborn<br />
(1965) were generally confirmed by<br />
Reeves and Kunze (1970) despite differing<br />
antecedent rainfall. Reeves and Kunze<br />
(1970) measured a net streamflow gain <strong>of</strong><br />
8.6 cubic feet per second over approximately<br />
8.5 river miles as Cibolo Creek<br />
transects <strong>the</strong> Carrizo Sand outcrop in <strong>the</strong><br />
vicinity <strong>of</strong> Su<strong>the</strong>rland Springs. Rainfall<br />
in <strong>the</strong> months preceding <strong>the</strong> measurements<br />
<strong>of</strong> Reeves and Kunze (1970) was<br />
above average, so some portion <strong>of</strong> <strong>the</strong><br />
gain in streamflow is likely attributable<br />
to increased base flow from bank storage.<br />
However, a recent study initiated by <strong>the</strong><br />
U.S. Geological Survey has confirmed<br />
that Cibolo Creek near Su<strong>the</strong>rland<br />
Springs gains water but has also shown<br />
even more substantial gains in streamflow<br />
from <strong>the</strong> downstream Gulf Coast<br />
Aquifer (Darwin Ockerman, personal<br />
communication, 2009).<br />
4.6<br />
Discussion<br />
Despite <strong>the</strong> interconnected nature <strong>of</strong><br />
surface and groundwater, <strong>Texas</strong> water<br />
law treats <strong>the</strong> two separately and <strong>of</strong>fers<br />
no protection for spring habitats. Surface<br />
water is publicly owned and governed<br />
by <strong>the</strong> “prior appropriation”<br />
doctrine. It can only be used with permission<br />
<strong>of</strong> <strong>the</strong> <strong>Texas</strong> Commission on<br />
Environmental Quality under provisions<br />
<strong>of</strong> <strong>the</strong> <strong>Texas</strong> Water Code. In contrast<br />
to surface water, groundwater in<br />
<strong>Texas</strong> is governed by <strong>the</strong> rule <strong>of</strong> capture,<br />
except in those areas where management<br />
is accomplished through local<br />
groundwater conservation districts. All<br />
confirmed groundwater conservation<br />
districts in <strong>Texas</strong> are required to develop<br />
and implement a management plan and<br />
rules for managing <strong>the</strong>ir groundwater<br />
resources, which may include modifying<br />
or eliminating <strong>the</strong> rule <strong>of</strong> capture.<br />
Most groundwater conservation districts<br />
require new wells to be registered<br />
and keep records <strong>of</strong> <strong>the</strong> production and<br />
use <strong>of</strong> groundwater, and <strong>the</strong>y may also<br />
make and enforce rules to conserve,<br />
protect, and recharge groundwater.<br />
Such rules may include limiting production<br />
based on tract size or <strong>the</strong> spacing <strong>of</strong><br />
wells. Some groundwater conservation<br />
districts have developed management<br />
plans and rules that protect springflow<br />
(for example, Barton Springs/Edwards<br />
Aquifer Conservation District).<br />
In <strong>Texas</strong>’ regional and state water<br />
planning, management goals for aquifers<br />
in different areas <strong>of</strong> <strong>the</strong> state range<br />
from sustainability to eventual (planned)<br />
depletion (TWDB, 2007). However, <strong>the</strong><br />
definition <strong>of</strong> sustainability can be elusive<br />
(Devlin and Sophocleous, 2005). Potential<br />
environmental impacts from <strong>the</strong>se various<br />
management strategies are difficult<br />
to predict. When a well is pumped, <strong>the</strong><br />
water comes from various proportions<br />
<strong>Texas</strong> Water Development Board <strong>Report</strong> <strong>374</strong> 79
<strong>of</strong> captured recharge, captured discharge<br />
(seeps and springs), and storage depletion.<br />
Although <strong>the</strong> relative volumes from<br />
<strong>the</strong>se three sources is highly site specific<br />
and varies with time, “it is usually <strong>the</strong><br />
groundwater discharge that is captured<br />
during groundwater development”<br />
(Bredeh<strong>of</strong>t, 2007). Alterations to surface<br />
flows due to groundwater pumping<br />
can have serious impacts to aquatic and<br />
aquatic-dependent habitats by reducing<br />
instream habitat diversity and availability,<br />
altering trophic and community structure,<br />
reducing assimilative capacity and<br />
water quality characteristics, and reducing<br />
overall stream productivity (Annear<br />
and o<strong>the</strong>rs, 2002). Additional research<br />
related to <strong>the</strong> impacts <strong>of</strong> groundwater<br />
pumping on surface water resources and<br />
ecosystems is needed to promote sound<br />
management as population and water<br />
demands grow. When such information<br />
is available, groundwater conservation<br />
districts have <strong>the</strong> authority to manage<br />
for <strong>the</strong> protection <strong>of</strong> springflows, and<br />
some already do so.<br />
As mentioned previously, <strong>the</strong> use <strong>of</strong><br />
groundwater resources results in <strong>the</strong><br />
withdrawal <strong>of</strong> groundwater from storage,<br />
a reduction in natural discharge, and an<br />
increase in recharge. The effects <strong>of</strong> declining<br />
groundwater levels and subsequent<br />
reduced springflows on surface water<br />
flow could greatly affect <strong>the</strong> availability <strong>of</strong><br />
surface water supplies since springflows<br />
<strong>of</strong>ten compose a significant proportion<br />
<strong>of</strong> streamflow. Feliciano (1985) estimated<br />
that approximately 30 percent <strong>of</strong> <strong>the</strong><br />
nation’s surface water flow is provided<br />
by groundwater. More locally, a recent<br />
streamflow gain/loss study concluded<br />
that “appreciable increases in streamflow,<br />
apparently <strong>the</strong> result <strong>of</strong> increases<br />
in base flow, occur in <strong>the</strong> reach <strong>of</strong> <strong>the</strong><br />
Brazos River that crosses <strong>the</strong> outcrops <strong>of</strong><br />
<strong>the</strong> Carrizo-Wilcox, Queen City, Sparta,<br />
and Yegua-Jackson aquifers” (Turco and<br />
o<strong>the</strong>rs, 2007). If broken down by season,<br />
it is likely groundwater accounts for a<br />
much more significant proportion <strong>of</strong> surface<br />
flow during drier summer months,<br />
as springflows <strong>of</strong>ten sustain base flows.<br />
Although recognizing that springflows<br />
had declined considerably, Brune (1981)<br />
estimated <strong>the</strong> total flow <strong>of</strong> <strong>Texas</strong>’ springs<br />
to be in excess <strong>of</strong> 4,132 cubic feet per<br />
second, or almost 3 million acre-feet per<br />
year. This volume <strong>of</strong> water equals about<br />
33 percent <strong>of</strong> <strong>the</strong> estimated 9 million<br />
acre-feet per year <strong>of</strong> total surface water<br />
available for use in 2010 (TWDB, 2007)<br />
and constitutes a significant contribution<br />
to <strong>the</strong> surface water supplies <strong>of</strong> <strong>the</strong> state.<br />
Because surface water availability analysis<br />
in <strong>Texas</strong> is generally based on historical<br />
streamflows, groundwater pumping<br />
may reduce <strong>the</strong> historical groundwater<br />
contribution to streams and effectively<br />
reduce actual streamflows to levels below<br />
that predicted (TNRCC, 1995). During<br />
extended drought conditions, this could<br />
have a significant impact on <strong>the</strong> availability<br />
<strong>of</strong> surface water for municipal,<br />
industrial, agricultural, and o<strong>the</strong>r uses.<br />
80 <strong>Texas</strong> Water Development Board <strong>Report</strong> <strong>374</strong>
4.7<br />
References<br />
Ashworth, J.B., and Hopkins, J., 1995, <strong>Aquifers</strong> <strong>of</strong> <strong>Texas</strong>: <strong>Texas</strong> Water Development<br />
Board <strong>Report</strong> 345, 69 p.<br />
Anderson, A., Hubbs, C., Winemiller, K.O., and Edwards, R.J., 1995, <strong>Texas</strong> freshwater<br />
fish assemblages following three decades <strong>of</strong> environmental change: Southwestern<br />
Naturalist, v. 40, no. 3, p. 314–321.<br />
Annear, T., Chisholm, I., Beecher, H., Locke, A., Aarrestad, P., Burkhart, N., Coomer,<br />
C., Estes, C., Hunt, J., Jacobson, R., Jobsis, G., Kauffman, J., Marshall, J., Mayes, K.,<br />
Stalnaker, C., and Wentworth, R., 2002, Instream flows for riverine resource stewardship:<br />
Instream Flow Council, 411 p.<br />
Besse, H., 2009, Personal communication, Ecological Recovery Foundation, Austin,<br />
<strong>Texas</strong>.<br />
Boulton, A.J., Valett, H.M., and Fisher, S.G., 1992, Spatial distribution and taxonomic<br />
composition <strong>of</strong> <strong>the</strong> hyporheos <strong>of</strong> several Sonoran Desert streams: Archiv für Hydrobiologia,<br />
v. 125, p. 37–61.<br />
Bowles, D.E., and Arsuffi, T.L., 1993, Karst aquatic ecosystems <strong>of</strong> <strong>the</strong> Edwards Plateau<br />
region <strong>of</strong> Central <strong>Texas</strong>, USA—A consideration <strong>of</strong> <strong>the</strong>ir importance, threats to <strong>the</strong>ir<br />
existence, and efforts for <strong>the</strong>ir conservation: Aquatic Conservation, Marine and<br />
Freshwater Ecosystems, v. 3, p. 317–329.<br />
Bredeh<strong>of</strong>t, J., 2007, It is <strong>the</strong> discharge: Ground Water, v. 45, no.5, p. 523.<br />
Bridges, E.L., and Singhurst, J.R., 2007, Distribution, ecology, and initial vegetation<br />
mapping <strong>of</strong> Post Oak Savanna Ecoregion bogs and seepage slopes: Edwin L. Bridges<br />
Botanical and Ecological Consultant, Bremerton, Washington, 114 p.<br />
Brune, G., 1975, Major and historical springs <strong>of</strong> <strong>Texas</strong>: <strong>Texas</strong> Water Development Board<br />
<strong>Report</strong> 189, 95 p.<br />
Brune, G., 1981, Springs <strong>of</strong> <strong>Texas</strong>—Volume 1: College Station, Tex., <strong>Texas</strong> A&M University<br />
Press Agricultural series, no. 5, 566 p.<br />
Buzan, D., 1982, Intensive survey <strong>of</strong> Cibolo Creek Segment 1902: <strong>Texas</strong> Department <strong>of</strong><br />
Water Resources <strong>Report</strong> No. IS-39, 56 p.<br />
Chowdhury, A., 2004, Hydraulic interaction between groundwater, Brazos River and<br />
oxbow lakes—Evidence from chemical and isotopic compositions, Brazos River<br />
Basin, <strong>Texas</strong>: <strong>Texas</strong> Water Development Board, 22 p. Available from: http://www.<br />
twdb.state.tx.us/instreamflows/pdfs/TWDB_GWBrazosOxbow_Final.pdf.<br />
Danielopol, D.L., 1989, Groundwater fauna associated with riverine aquifers: Journal<br />
<strong>of</strong> <strong>the</strong> North American Benthological Society, v. 8, no. 1, p. 8–35.<br />
Danks, H.V., and Williams, D.D., 1991, Arthropods <strong>of</strong> springs, with particular reference<br />
to Canada—Syn<strong>the</strong>sis and needs for research, in Williams, D.D., and Danks, H.V.,<br />
eds., Arthropods <strong>of</strong> springs, with particular reference to Canada: Memoirs <strong>of</strong> <strong>the</strong><br />
Entomological Society <strong>of</strong> Canada, v. 156, 217 p.<br />
Deeds, N., Kelley, V., Fryar, D., Jones, T., Whallon, A.J., and Dean, K.E., 2003, Groundwater<br />
availability model for <strong>the</strong> sou<strong>the</strong>rn Carrizo-Wilcox Aquifer: Prepared for <strong>the</strong><br />
<strong>Texas</strong> Water Development Board, 452 p.<br />
<strong>Texas</strong> Water Development Board <strong>Report</strong> <strong>374</strong> 81
Devlin, J.F., and Sophocleous, M., 2005, The persistence <strong>of</strong> <strong>the</strong> water budget myth and<br />
its relationship to sustainability: Hydrogeology Journal, v. 13, p. 549–554.<br />
Dutton, A.R., 1990, Vadose-zone recharge and wea<strong>the</strong>ring in an Eocene sand deposit,<br />
East <strong>Texas</strong>, U.S.A.: Journal <strong>of</strong> Hydrology, v. 114, p. 93–108.<br />
Dutton, A.R., 1999, Groundwater availability in <strong>the</strong> Carrizo-Wilcox aquifer in Central<br />
<strong>Texas</strong>—Numerical simulations <strong>of</strong> 2000 through 2050 withdrawal projections: University<br />
<strong>of</strong> <strong>Texas</strong> at Austin, Bureau <strong>of</strong> Economic Geology <strong>Report</strong> <strong>of</strong> Investigations<br />
No. 256, 295 p.<br />
Dutton, A.R., Harden, B., Nicot, J.-P., and O’Rourke, D., 2003, Groundwater availability<br />
model for <strong>the</strong> central part <strong>of</strong> <strong>the</strong> Carrizo-Wilcox Aquifer in <strong>Texas</strong>: Prepared for <strong>Texas</strong><br />
Water Development Board, 295 p.<br />
Edwards, R.J., 1999, Ecological pr<strong>of</strong>iles for selected stream-dwelling <strong>Texas</strong> freshwater<br />
fishes, II: Prepared for <strong>the</strong> <strong>Texas</strong> Water Development Board, 69 p.<br />
Edwards, R.J., Longley, G., Moss, R., Ward, J., Mat<strong>the</strong>ws, R., and Stewart, B., 1989, A<br />
classification <strong>of</strong> <strong>Texas</strong> aquatic communities with special consideration toward <strong>the</strong><br />
conservation <strong>of</strong> endangered and threatened taxa: <strong>Texas</strong> Journal <strong>of</strong> Science, v. 41, no.<br />
3, p. 231–240.<br />
Erman, D.C., and Erman, N.A., 1984, The response <strong>of</strong> stream macroinvertebrates to<br />
substrate size and heterogeneity: Hydrobiologia, v. 108, p. 75–82.<br />
Feliciano, D.V., 1985, Groundwater—What it is and how it is being protected: Library<br />
<strong>of</strong> Congress, Congressional Research Service, 85-191 ENR, 50 p.<br />
Fogg, G.E., Seni, S.J., and Kreitler, C.W., 1983, Three-dimensional ground-water modeling<br />
in depositional systems, Wilcox Group, Oakwood salt dome area, East <strong>Texas</strong>:<br />
University <strong>of</strong> <strong>Texas</strong> at Austin, Bureau <strong>of</strong> Economic Geology <strong>Report</strong> <strong>of</strong> Investigations<br />
No. 133, 55 p.<br />
Freeze, R.A., and Cherry, J.A., 1979, Groundwater: Englewood Cliffs, New Jersey, Prentice-Hall,<br />
Inc., 604 p.<br />
Fryar, D., Senger, R., Deeds, N., Pickens, J., Jones, T., Whallon, A.J., and Dean, K.E., 2003,<br />
Groundwater availability model for <strong>the</strong> nor<strong>the</strong>rn Carrizo-Wilcox Aquifer: Prepared<br />
for <strong>the</strong> <strong>Texas</strong> Water Development Board.<br />
Gibson, R., 2000, Macroarthropod communities <strong>of</strong> sandy springs <strong>of</strong> East <strong>Texas</strong>: College<br />
Station, Tex., <strong>Texas</strong> A&M University, Master’s <strong>the</strong>sis, 190 p.<br />
Glazier, D.S., 1991, The fauna <strong>of</strong> North American temperate cold springs: patterns and<br />
hypo<strong>the</strong>ses: Freshwater Biology, v. 26, p. 527–542.<br />
Glazier, D.S., and Gooch, J.L., 1987, Macroinvertebrate assemblages in Pennsylvania<br />
(U.S.A.) springs: Hydrobiologia, v. 150, p. 33–43.<br />
Gooch, J.L., and Glazier, D.S., 1991, Temporal and spatial patterns in mid-Appalachian<br />
springs: Memoirs <strong>of</strong> <strong>the</strong> Entomological Society <strong>of</strong> Canada, v. 155, p. 29–49.<br />
Grantham, C., 1996, An assessment <strong>of</strong> <strong>the</strong> ecological impacts <strong>of</strong> groundwater overdraft<br />
on wetlands and riparian areas in <strong>the</strong> United States: U.S. Environmental Protection<br />
Agency, Office <strong>of</strong> Water, 813-S-96-001, 103 p.<br />
Hamlin, H.S., 1988, Depositional and ground-water flow systems <strong>of</strong> <strong>the</strong> Carrizo-<strong>Upper</strong><br />
Wilcox, South <strong>Texas</strong>: University <strong>of</strong> <strong>Texas</strong> at Austin, Bureau <strong>of</strong> Economic Geology<br />
<strong>Report</strong> <strong>of</strong> Investigations No. 175, 61 p.<br />
82 <strong>Texas</strong> Water Development Board <strong>Report</strong> <strong>374</strong>
Heitmuller, F.T., and Reece, B.D., 2003, Database <strong>of</strong> historically documented springs<br />
and springflow measurements in <strong>Texas</strong>: U.S. Geological Survey Open-File <strong>Report</strong><br />
03-315.<br />
Hakenkamp, C.C., and Palmer, M.A., 2000, The ecology <strong>of</strong> hyporheic mei<strong>of</strong>auna, in<br />
Jones, J.B., and Mulholland, P.J., eds., Streams and ground waters: San Diego, Calif.,<br />
Academic Press, p. 307–329.<br />
Holland, P.H., and Welborn, C.T., 1965, Base-flow studies Cibolo Creek, <strong>Texas</strong>—Quantity<br />
and quality, March 5–7, 1963: <strong>Texas</strong> Water Commission Bulletin 6511, 13 p.<br />
Hubbs, C., 1995, Springs and spring runs as unique aquatic systems: Copeia, v. 1995, p.<br />
989–991.<br />
Hubbs, C., Edwards, R.J., and Garrett, G.P., 1991, An annotated checklist <strong>of</strong> <strong>the</strong> freshwater<br />
fishes <strong>of</strong> <strong>Texas</strong>, with keys to identification <strong>of</strong> species: <strong>Texas</strong> Journal <strong>of</strong> Science,<br />
Special Supplement, v. 43, 56 p.<br />
Hynes, H.B.N., 1970, The ecology <strong>of</strong> running waters: University <strong>of</strong> Toronto Press, 555<br />
p.<br />
Illies, J., and Botosaneanu, L., 1963, Problemes et methods de la classification et de la<br />
zonation ecologique des eaux courantes, considerees surtout du point de vue faunistique:<br />
Mitt International Verein Limnology, v. 12, p. 1–57.<br />
Kamp, G., 1995, The hydrogeology <strong>of</strong> springs in relation to <strong>the</strong> biodiversity <strong>of</strong> spring<br />
fauna—A review: Journal <strong>of</strong> <strong>the</strong> Kansas Entomological Society, supplement, v. 68,<br />
no. 2, p. 4–17.<br />
Kral, R., 1955, A floristic comparison <strong>of</strong> two hillside bog localities in nor<strong>the</strong>ast <strong>Texas</strong>:<br />
Field and Laboratory, v. 23, p. 47–69.<br />
Kreitler, C.W., 1979, Ground-water hydrology <strong>of</strong> depositional systems, in Galloway,<br />
W.E., and o<strong>the</strong>rs, eds., Depositional and ground-water flow systems in <strong>the</strong> exploration<br />
for uranium, a research colloquium: University <strong>of</strong> <strong>Texas</strong> at Austin, Bureau <strong>of</strong><br />
Economic Geology, 267 p.<br />
MacRoberts, B.R., and MacRoberts, M.H., 1998, Floristics <strong>of</strong> muck bogs in east central<br />
<strong>Texas</strong>: Phytologia, v. 85, p. 61–73.<br />
Mat<strong>the</strong>ws, W.J., 1998, Patterns in freshwater fish ecology: New York, Chapman and<br />
Hall, 756 p.<br />
Mat<strong>the</strong>ws, W.J., Hoover, J.J., and Milstead, W.B., 1983, Biota <strong>of</strong> Oklahoma springs—<br />
Natural biological monitoring <strong>of</strong> groundwater quality: Oklahoma State University,<br />
Oklahoma Water Research Institute, 64 p.<br />
Miller, R.R., Williams, J.D., and Williams, J.E., 1989, Extinctions <strong>of</strong> North American<br />
fishes during <strong>the</strong> past century: Fisheries, v. 14, no. 6, p. 22–38.<br />
Minckley, W.L., 1963, The ecology <strong>of</strong> a spring stream, Doe Run, Meade County, Kentucky:<br />
Wildlife Monographs, v. 11, p. 1–124<br />
Minshall, G.W., 1968, Community dynamics <strong>of</strong> <strong>the</strong> benthic fauna in a woodland springbrook:<br />
Hydrobiologia, v. 32, p. 305–339.<br />
Nielsen, A., 1950, On <strong>the</strong> zoogeography <strong>of</strong> springs: Hydrobiologia, v. 2, p. 313–321.<br />
Ockerman, D., 2009, personal communication: U.S. Geological Survey, San Antonio,<br />
<strong>Texas</strong>.<br />
<strong>Texas</strong> Water Development Board <strong>Report</strong> <strong>374</strong> 83
Odum, H.T., 1957, Trophic structure and productivity <strong>of</strong> Silver Springs, Florida: Ecological<br />
Monographs, v. 27, p. 55–112.<br />
Osting, T., Furnans, J., and Mat<strong>the</strong>ws, R., 2004, Surface connectivity between six oxbow<br />
lakes and <strong>the</strong> Brazos River, <strong>Texas</strong>: <strong>Texas</strong> Water Development Board, 62 p., Available<br />
from: http://www.twdb.state.tx.us/InstreamFlows/pdfs/TWDB_SurfaceBrazosOxbowFinal_20041207.pdf.<br />
Ourso, R.T., and Hornig, C.E., 1999, Stream and aquifer biology <strong>of</strong> south-central <strong>Texas</strong>—A<br />
literature review, 1973–97: U.S. Geological Survey Open File <strong>Report</strong> 99-243, 38 p.<br />
Pflieger W.L., 1982, Fauna <strong>of</strong> Missouri Springs, in Vineyard, J.D. and Feder, G.L., Springs<br />
<strong>of</strong> Missouri: Missouri Department <strong>of</strong> Natural Resources, Water Resources <strong>Report</strong><br />
No. 29, 212 p.<br />
Pope, M.L., and Brown, A.V., 1996, Effects <strong>of</strong> flow rate, predation and diel periodicity on<br />
drifting and benthic mei<strong>of</strong>auna densities in artificial streams: Bulletin <strong>of</strong> <strong>the</strong> North<br />
American Benthological Society, v. 13, p. 135–152.<br />
Reeves, W.E., and Kunze, H.L., 1970, Quantity and chemical quality <strong>of</strong> low flow in Cibolo<br />
Creek, <strong>Texas</strong>, March 4–8, 1968: <strong>Texas</strong> Water Development Board <strong>Report</strong> 112, 16 p.<br />
Rowell, C. M., 1949a, Floral composition <strong>of</strong> a Sphagnum bog in Robertson County, <strong>Texas</strong>:<br />
College Station, Tex., <strong>Texas</strong> A&M University, Master’s <strong>the</strong>sis.<br />
Rowell, C.M., 1949b, A preliminary report on <strong>the</strong> floral composition <strong>of</strong> a Sphagnum bog<br />
in Robertson County, <strong>Texas</strong>: <strong>Texas</strong> Journal <strong>of</strong> Science, v. 1, p. 50–53.<br />
Ryder, P.D., and Ardis, A.F., 1991, Hydrology <strong>of</strong> <strong>the</strong> <strong>Texas</strong> Gulf Coast aquifer systems:<br />
U.S. Geological Survey Open-File <strong>Report</strong> 91-64.<br />
Scanlon, B.R., Dutton, A., and Sophocleus, M., 2002, Groundwater recharge in <strong>Texas</strong>:<br />
Prepared for <strong>the</strong> <strong>Texas</strong> Water Development Board, 84 p.<br />
Singhurst, J.R., Cathy, J.C., Prochaska, D., Haucke, H., Kroh, G.C., and Holmes W.C.,<br />
2003, The vascular flora <strong>of</strong> Gus Engeling Wildlife Management Area, Anderson<br />
County, <strong>Texas</strong>: Sou<strong>the</strong>astern Naturalist, v. 2, p. 347–368.<br />
Slade, R.M., Bentely, J.T., and Michaud, D., 2002, Results <strong>of</strong> streamflow gain-loss studies<br />
in <strong>Texas</strong>, with emphasis on gains from and losses to major and minor aquifers. U.S.<br />
Geological Survey Open File <strong>Report</strong> 02-068, 131 p.<br />
Smith, H., Wood, P.J., and Gunn, J., 2003, The influence <strong>of</strong> habitat structure and flow<br />
permanence on invertebrate communities in karst spring systems: Hydrobiologia,<br />
v. 510, p. 53–66<br />
Starbuck, T.J., 1984, The vascular flora <strong>of</strong> Robertson County, <strong>Texas</strong>: College Station,<br />
Tex., <strong>Texas</strong> A&M University, Master’s <strong>the</strong>sis, 334 p.<br />
Stevens, L.E., and Meretsky, V.J., 2008, Aridland springs <strong>of</strong> North America—Ecology<br />
and conservation: University <strong>of</strong> Arizona Press, 432 p.<br />
Strayer, D.L., 1994, Limits to biological distributions in groundwater, in Gibert, J., and<br />
o<strong>the</strong>rs, eds., Groundwater ecology: Academic Press, 571 p.<br />
TNRCC (<strong>Texas</strong> Natural Resource Conservation Commission), 1995, A regulatory guidance<br />
document for applications to divert, store or use state water: <strong>Texas</strong> Natural<br />
Resource Conservation Commission, RG-141, 89 p.<br />
84 <strong>Texas</strong> Water Development Board <strong>Report</strong> <strong>374</strong>
Theis, C.V., 1940, The source <strong>of</strong> water derived from wells—Essential factors controlling<br />
<strong>the</strong> response <strong>of</strong> an aquifer to development: Civil Engineering, American Society <strong>of</strong><br />
Civil Engineers, p. 277–280.<br />
Thomas, C., Bonner, T.H., and Whiteside, B.G., 2007, Freshwater fishes <strong>of</strong> <strong>Texas</strong>: College<br />
Station, Tex., <strong>Texas</strong> A&M University Press, 202 p.<br />
Thorkildsen, D., and Price, R.D., 1991, Ground-water resources <strong>of</strong> <strong>the</strong> Carrizo-Wilcox<br />
aquifer in <strong>the</strong> Central <strong>Texas</strong> region: <strong>Texas</strong> Water Development Board <strong>Report</strong> 332,<br />
59 p.<br />
Thorup, J., 1966, Substrate-type and its value as a basis for <strong>the</strong> delimitation <strong>of</strong> bottom<br />
fauna communities in running waters: Pymatuning Laboratory Ecology v. 4, p.<br />
59–74.<br />
TPWD (<strong>Texas</strong> Parks and Wildlife Department), 2005, 2005 land and water resources<br />
conservation and recreation plan: <strong>Texas</strong> Parks and Wildlife Department, 137 p.<br />
Turco, M.J., East, J.W., and Milburn, M.S., 2007, Base flow (1966–2005) and streamflow<br />
gain and loss (2006) <strong>of</strong> <strong>the</strong> Brazos River, McLennan County to Fort Bend County,<br />
<strong>Texas</strong>: U.S. Geological Survey Scientific Investigations <strong>Report</strong> 2007–5286, 27 p.<br />
TWDB (<strong>Texas</strong> Water Development Board), 2007, Water for <strong>Texas</strong>, 2007, Volume 2:<br />
<strong>Texas</strong> Water Development Board, 392 p.<br />
TWDB (<strong>Texas</strong> Water Development Board), 2009, Water use survey: Historical water<br />
use summary information database, www.twdb.state.tx.us/wrpi.<br />
Vannote, R.L., Minshall, G.W., Cummins, K.W., Sedell J.R., and. Cushing, C.E, 1980, The<br />
river continuum concept: Canadian Journal <strong>of</strong> Aquatic Science, v. 37, p. 130–137.<br />
Ward, J.V., 1992, Aquatic insect ecology 1—Biology and habitat: John Wiley and Sons,<br />
Inc., 438 p.<br />
Ward, J.V., and Dufford, R.G., 1979, Longitudinal and seasonal distribution <strong>of</strong> macroinvertebrates<br />
and epilithic algae in a Colorado springbrook-pond system: Archive<br />
Hydrobiologia, v. 86, p. 284–321.<br />
Ward, J.V., and Stanford, J.A., 1982, Thermal responses in <strong>the</strong> evolutionary ecology <strong>of</strong><br />
aquatic insects: Annual Review <strong>of</strong> Entomology, v. 27, p. 97–117.<br />
Webb, D.W., Wetzel, M.J., Reed, P.C., Phillippe, L.R., and Harris, M.A., 1995, Aquatic<br />
biodiversity in Illinois springs: Journal <strong>of</strong> <strong>the</strong> Kansas Entomological Society, v. 68,<br />
no. 2, p. 93–107.<br />
Weniger, D., 1984, The explorers’ <strong>Texas</strong>, Volume 1—The land and waters: Austin, Tex.,<br />
Eakin Press, 200 p.<br />
Williams, D.D., 1991, The spring as an interface between groundwater and lotic faunas<br />
as a tool in assessing groundwater quality: Verhandlungen der Internationalen Vereinigung<br />
für Theoretische und Angewandie Limnologie, v. 24, p. 1621–1624.<br />
Williams, D.D., 1993, Nutrient and flow vector dynamics at <strong>the</strong> hyporheic/groundwater<br />
interface and <strong>the</strong>ir effects on <strong>the</strong> interstitial fauna: Hydrobiologia, v. 251, p.<br />
185–198.<br />
Williams, D.D., and Danks, H.V., 1991, Arthropods <strong>of</strong> springs: introduction, in Williams,<br />
D.D., and Danks, H.V., eds., Arthropods <strong>of</strong> springs, with particular reference<br />
to Canada: Memoirs <strong>of</strong> <strong>the</strong> Entomological Society <strong>of</strong> Canada, v. 155, 217 p.<br />
<strong>Texas</strong> Water Development Board <strong>Report</strong> <strong>374</strong> 85
Williams, D.D., and Williams, N.E., 1998, Invertebrate communities from freshwater<br />
springs—What can <strong>the</strong>y contribute to pure and applied ecology, in Botosaneanu, L.,<br />
Studies in crenobiology: The biology <strong>of</strong> springs and springbrooks, p. 251–261.<br />
Winter, T.C., Harvey, J.W., Franke, O.L., and Alley, W.M., 1998, Groundwater and surface<br />
water—A single resource: U.S. Geological Survey Circular 1139, 79 p.<br />
86 <strong>Texas</strong> Water Development Board <strong>Report</strong> <strong>374</strong>
Chapter 5<br />
Hydrogeology <strong>of</strong> <strong>the</strong> Queen City and Sparta <strong>Aquifers</strong> with<br />
an Emphasis on Regional Mechanisms <strong>of</strong> Discharge<br />
Van Kelley 1 , Dennis Fryar 1 , and Neil E. Deeds 1<br />
The Queen City and Sparta aquifers<br />
are classified as minor aquifers in<br />
<strong>Texas</strong> (Ashworth and Hopkins, 1995).<br />
Groundwater use for <strong>the</strong> Queen City<br />
and Sparta aquifers is relatively minor,<br />
with reported water uses <strong>of</strong> 16,000<br />
and 10,000 acre-feet per year in 2003,<br />
respectively (TWDB, 2007). However,<br />
<strong>the</strong>se two minor aquifers are important<br />
water resources in <strong>the</strong> state, with<br />
groundwater availability estimates<br />
<strong>of</strong> 300,000 acre-feet per year for <strong>the</strong><br />
Queen City Aquifer and 51,000 acrefeet<br />
per year for <strong>the</strong> Sparta Aquifer<br />
under drought conditions in <strong>the</strong> year<br />
2000 (TWDB, 2007). These aquifers<br />
extend from <strong>the</strong> Frio River in South<br />
<strong>Texas</strong> to East <strong>Texas</strong>, with <strong>the</strong> Sparta<br />
Aquifer continuing into Louisiana and<br />
Arkansas (Figure 5-1). The Queen City<br />
Aquifer provides water to all or parts <strong>of</strong><br />
42 <strong>Texas</strong> counties and is used primarily<br />
for livestock and domestic purposes,<br />
with significant municipal and industrial<br />
use in nor<strong>the</strong>ast <strong>Texas</strong> (Ashworth<br />
and Hopkins, 1995). The Sparta Aquifer<br />
provides water to all or parts <strong>of</strong> 25 <strong>Texas</strong><br />
counties and is used for livestock and<br />
domestic needs along its extent, with<br />
some municipal, industrial, and irrigation<br />
uses locally (Ashworth and Hopkins,<br />
1995).<br />
Pumping from <strong>the</strong> Queen City and<br />
Sparta aquifers to date has been generally<br />
low as evidenced by relatively stable<br />
groundwater levels. However, development<br />
has been significant in select<br />
locales, resulting in significant drawdown<br />
in <strong>the</strong>se areas. In <strong>the</strong>se regions, impacts<br />
<strong>of</strong> <strong>the</strong> high pumping include decreased<br />
groundwater storage, decreased stream<br />
base flow, decreased springflow, and<br />
decreased shallow groundwater evapotranspiration.<br />
Cross-formational flow<br />
would also be altered in response to <strong>the</strong><br />
localized high pumping.<br />
This chapter will review <strong>the</strong> hydrogeologic<br />
characteristics <strong>of</strong> <strong>the</strong> Queen<br />
City and Sparta aquifers. The chapter will<br />
end with an emphasis on a review <strong>of</strong> <strong>the</strong><br />
recharge-discharge mechanisms in <strong>the</strong><br />
two aquifers and <strong>the</strong>ir significance and<br />
relation to future aquifer development.<br />
5.1<br />
Setting<br />
The Queen City and Sparta aquifers<br />
are classified as minor aquifers in <strong>Texas</strong><br />
(Ashworth and Hopkins, 1995). They are<br />
composed <strong>of</strong> sediments <strong>of</strong> <strong>the</strong> Tertiary<br />
Claiborne Group, which extend from<br />
South <strong>Texas</strong> nor<strong>the</strong>astward through<br />
East <strong>Texas</strong>. Figure 5-1 shows <strong>the</strong> surface<br />
outcrop and downdip subcrop <strong>of</strong><br />
<strong>the</strong> Queen City and Sparta aquifers as<br />
defined by <strong>the</strong> <strong>Texas</strong> Water Development<br />
Board (TWDB). The outcrop areas<br />
<strong>of</strong> <strong>the</strong> Queen City and Sparta aquifers<br />
lie between <strong>the</strong> Carrizo-Wilcox Aquifer<br />
and <strong>the</strong> Yegua-Jackson Aquifer in a<br />
band subparallel to <strong>the</strong> Gulf Coast from<br />
South <strong>Texas</strong> to East <strong>Texas</strong>. The outcrop<br />
area <strong>of</strong> <strong>the</strong> Sparta Aquifer occurs in isolated<br />
locations in <strong>the</strong> East <strong>Texas</strong> Basin.<br />
The Queen City and Sparta aquifers are<br />
not recognized southwest <strong>of</strong> <strong>the</strong> Frio<br />
River because <strong>of</strong> generally poor water<br />
quality. However, <strong>the</strong>se aquifers do exist<br />
west <strong>of</strong> <strong>the</strong> Frio and to <strong>the</strong> Rio Grande<br />
and were included in <strong>the</strong> state groundwater<br />
availability models completed in<br />
2004 (Kelley and o<strong>the</strong>rs, 2004). The<br />
1 INTERA Incorporated<br />
<strong>Texas</strong> Water Development Board <strong>Report</strong> <strong>374</strong> 87
Sparta Aquifer outcrop<br />
Sparta Aquifer downdip<br />
Queen City Aquifer outcrop<br />
Queen City Aquifer downdip<br />
County/Parish boundary<br />
0 90 180<br />
Miles<br />
Figure 5-1. Outcrop and subcrop <strong>of</strong> Queen City and Sparta aquifers.<br />
Sparta Aquifer continues to <strong>the</strong> east <strong>of</strong><br />
<strong>Texas</strong> into Louisiana and Mississippi,<br />
whereas <strong>the</strong> Queen City loses productivity<br />
and is generally not recognized<br />
east <strong>of</strong> <strong>Texas</strong>. This paper will focus on<br />
<strong>the</strong>se aquifers in <strong>Texas</strong> and east to <strong>the</strong><br />
Red River in southwestern Arkansas<br />
and western Louisiana.<br />
The Queen City and Sparta aquifers<br />
are located within <strong>the</strong> Interior <strong>Coastal</strong><br />
<strong>Plains</strong> subprovince <strong>of</strong> <strong>the</strong> Gulf <strong>Coastal</strong><br />
<strong>Plains</strong> physiographic province (Wermund,<br />
1996). The Interior <strong>Coastal</strong> <strong>Plains</strong><br />
comprise alternating sequences <strong>of</strong> unconsolidated<br />
sands and clays. The sands tend<br />
to be more resistant to erosion than <strong>the</strong><br />
clay-rich soils and, as a result, <strong>the</strong> province<br />
is characterized as having sand<br />
ridges paralleling <strong>the</strong> coast. Figure 5-2<br />
provides a topographic map that includes<br />
<strong>the</strong> outcrop <strong>of</strong> <strong>the</strong> aquifers. Generally,<br />
<strong>the</strong> study area is characterized as having<br />
low relief, with ground surface elevations<br />
gently decreasing from <strong>the</strong> southwest<br />
to <strong>the</strong> nor<strong>the</strong>ast and sou<strong>the</strong>ast. Ground<br />
surface elevation varies from over 800<br />
feet above sea level in <strong>the</strong> far western<br />
portion <strong>of</strong> <strong>the</strong> study area to less than 100<br />
feet above sea level in river valleys and<br />
in <strong>the</strong> sou<strong>the</strong>astern-most regions <strong>of</strong> <strong>the</strong><br />
88 <strong>Texas</strong> Water Development Board <strong>Report</strong> <strong>374</strong>
Elevation<br />
(feet amsl)<br />
Queen City Aquifer boundary<br />
Gulf<br />
State line<br />
Major towns & cities<br />
Rivers & streams<br />
Lakes & reservoirs<br />
County/Parish boundaries<br />
0 90 180<br />
Miles<br />
0–100<br />
101–200<br />
201–300<br />
301–400<br />
401–500<br />
501–600<br />
601–700<br />
701–800<br />
801–900<br />
901–1,000<br />
1,001–2,000<br />
Figure 5-2. Topographic map <strong>of</strong> <strong>the</strong> study area.<br />
amsl = above mean sea level<br />
study area. The gentle gulfward decrease<br />
in ground surface elevation is interrupted<br />
by resistant Tertiary sandstone outcrops.<br />
River valleys are broadly incised with terraced<br />
valleys hundreds <strong>of</strong> feet lower than<br />
<strong>the</strong> surface basin divide elevations.<br />
The study area is characterized by<br />
pine and hardwood forests in <strong>the</strong> nor<strong>the</strong>ast,<br />
with a dense network <strong>of</strong> perennial<br />
streams. The density <strong>of</strong> trees in <strong>the</strong> study<br />
area decreases from <strong>the</strong> north to <strong>the</strong><br />
south and south <strong>of</strong> San Antonio, where<br />
<strong>the</strong> landscape is dominated by chaparral<br />
brush and grasses (Wermund, 1996). The<br />
study area resides in <strong>the</strong> cool portion<br />
<strong>of</strong> <strong>the</strong> Temperate Zone <strong>of</strong> <strong>the</strong> Nor<strong>the</strong>rn<br />
hemisphere and intersects two climatic<br />
zones in <strong>Texas</strong>: <strong>the</strong> Subtropical Humid<br />
division and <strong>the</strong> Subtropical Subhumid<br />
division (Larkin and Bomar, 1983). Most<br />
<strong>of</strong> <strong>the</strong> study area has a Modified Marine<br />
climate termed Subtropical, which is<br />
dominated by <strong>the</strong> onshore flow <strong>of</strong> humid<br />
tropical air from <strong>the</strong> Gulf <strong>of</strong> Mexico. The<br />
amount <strong>of</strong> moisture decreases as it flows<br />
from <strong>the</strong> east to <strong>the</strong> west and as continental<br />
air masses intrude from <strong>the</strong> north,<br />
resulting in <strong>the</strong> climate subdivisions <strong>of</strong><br />
humid, semihumid, and semiarid. The<br />
Subtropical Humid climate zone extends<br />
<strong>Texas</strong> Water Development Board <strong>Report</strong> <strong>374</strong> 89
from <strong>the</strong> <strong>Texas</strong>/Louisiana border in <strong>the</strong><br />
nor<strong>the</strong>astern part <strong>of</strong> <strong>the</strong> study area to<br />
approximately Guadalupe and Wilson<br />
counties to <strong>the</strong> southwest. This climate<br />
is characterized as having warm summers<br />
and mild winters. The Subtropical<br />
Subhumid climate zone exists between<br />
Guadalupe and Wilson counties and Zavala<br />
and Dimmit counties in <strong>the</strong> sou<strong>the</strong>rn<br />
study area. This climate zone is characterized<br />
as having hot summers and dry<br />
winters.<br />
Precipitation is greatest in <strong>the</strong> nor<strong>the</strong>ast,<br />
and historical averages range from a<br />
low <strong>of</strong> 20.9 inches at Eagle Pass to a high<br />
<strong>of</strong> 59.9 inches in Jasper County. Generally,<br />
<strong>the</strong> average annual precipitation<br />
decreases from <strong>the</strong> east to <strong>the</strong> west. In<br />
<strong>the</strong> nor<strong>the</strong>rn half <strong>of</strong> <strong>the</strong> study area, precipitation<br />
also increases with proximity<br />
to <strong>the</strong> coast. The average annual net pan<br />
evaporation depth in <strong>the</strong> aquifer outcrop<br />
area ranges from a low <strong>of</strong> 38.3 inches per<br />
year in <strong>the</strong> far nor<strong>the</strong>ast portion <strong>of</strong> <strong>the</strong><br />
study area to a high <strong>of</strong> 65.9 inches per<br />
year in <strong>the</strong> southwest. In general, <strong>the</strong><br />
pan evaporation rate exceeds <strong>the</strong> annual<br />
average rainfall. Annual rainfall exceeds<br />
<strong>the</strong> pan evaporation rate in limited portions<br />
<strong>of</strong> <strong>the</strong> study area in far nor<strong>the</strong>astern<br />
<strong>Texas</strong>, contrasting with <strong>the</strong> greatest<br />
rainfall deficits with regard to <strong>the</strong> net<br />
evaporation rate occurring in <strong>the</strong> far<br />
southwestern portions <strong>of</strong> <strong>the</strong> aquifer<br />
system.<br />
5.2<br />
Geology<br />
The sediments that form <strong>the</strong> Queen<br />
City and Sparta aquifers in <strong>Texas</strong> are<br />
part <strong>of</strong> a gulfward thickening wedge <strong>of</strong><br />
Cenozoic sediments deposited in <strong>the</strong><br />
Rio Grande Embayment and Houston<br />
Embayment <strong>of</strong> <strong>the</strong> northwest Gulf<br />
Coast Basin. Deposition has been influenced<br />
by regional crust subsidence,<br />
episodes <strong>of</strong> sediment inflow from areas<br />
outside <strong>of</strong> <strong>the</strong> Gulf <strong>Coastal</strong> Plain, and<br />
eustatic sea level change (Grubb, 1997).<br />
Galloway and o<strong>the</strong>rs (1994) characterized<br />
Cenozoic sequences in <strong>the</strong> Gulf<br />
Coast in <strong>the</strong> following three ways: (1)<br />
Deposition <strong>of</strong> Cenozoic sequences is<br />
characterized as an <strong>of</strong>flapping progression<br />
<strong>of</strong> successive, basinward thickening<br />
wedges. (2) These depositional wedges<br />
aggraded <strong>the</strong> continental platform and<br />
prograded <strong>the</strong> shelf margin and continental<br />
slope from <strong>the</strong> Cretaceous shelf<br />
edge to <strong>the</strong> current <strong>Texas</strong> coastline. (3)<br />
Deposition occurred along sand-rich,<br />
continental margin deltaic depocenters<br />
within embayments (Rio Grande, Houston,<br />
and Mississippi embayments) and<br />
was modified by growth faults and salt<br />
dome development. The primary Paleogene<br />
depositional sequences in ascending<br />
stratigraphic order are <strong>the</strong> Lower<br />
Wilcox, <strong>the</strong> <strong>Upper</strong> Wilcox, <strong>the</strong> Carrizo,<br />
<strong>the</strong> Queen City, <strong>the</strong> Sparta, <strong>the</strong> Yegua-<br />
Cockfield, <strong>the</strong> Jackson, and <strong>the</strong> Vicksburg-Frio<br />
(Galloway and o<strong>the</strong>rs, 1994).<br />
Each <strong>of</strong> <strong>the</strong>se depositional sequences<br />
is bounded by marine shales and finergrained<br />
sediments representing transgressions<br />
(for example, <strong>the</strong> Reklaw and<br />
Weches formations).<br />
Figure 5-3 shows a generalized stratigraphic<br />
section for <strong>the</strong> study area. The<br />
Recklaw Formation, composed <strong>of</strong> marine<br />
clays deposited in a major marine transgression,<br />
represents <strong>the</strong> base <strong>of</strong> <strong>the</strong> Queen<br />
City Aquifer. The Queen City, Weches,<br />
and Sparta formations overlie <strong>the</strong> Reklaw<br />
and Carrizo formations and <strong>the</strong> Wilcox<br />
Group. The Queen City Formation is<br />
composed <strong>of</strong> several fluvio-deltaic depositional<br />
systems. In <strong>the</strong> nor<strong>the</strong>rn study<br />
area, <strong>the</strong> Queen City Formation was<br />
deposited as part <strong>of</strong> a high-constructive,<br />
lobate delta system (Guevara and Garcia,<br />
1972). The deltaic sands <strong>of</strong> <strong>the</strong> Queen City<br />
Formation thin toward <strong>the</strong> sou<strong>the</strong>astern<br />
portion <strong>of</strong> <strong>the</strong> study area near <strong>the</strong> <strong>Texas</strong>/<br />
Louisiana line. In south-central <strong>Texas</strong><br />
(western Fayette to Wilson County),<br />
<strong>the</strong> dominant depositional facies for <strong>the</strong><br />
Queen City Formation is <strong>the</strong> stand-plain<br />
facies, which is characterized as having<br />
strike-oriented sand trends (Guevara and<br />
Garcia, 1972). In South <strong>Texas</strong>, <strong>the</strong> Queen<br />
City Formation was deposited as part <strong>of</strong> a<br />
90 <strong>Texas</strong> Water Development Board <strong>Report</strong> <strong>374</strong>
Figure 5-3. Generalized stratigraphic section for <strong>the</strong> Wilcox and Claiborne groups in <strong>Texas</strong> (after Ayers<br />
and Lewis, 1985; Hamlin, 1988; Kaiser, 1978; Ricoy and Brown, 1977; Guevara and Garcia, 1972; and<br />
Payne, 1968).<br />
Fm = formation<br />
high‐destructive, wave-dominated delta<br />
system (Guevara and Garcia, 1972). The<br />
Queen City sands thicken in <strong>the</strong> western<br />
part <strong>of</strong> <strong>the</strong> study area and extend<br />
southward into Mexico along <strong>the</strong> Rio<br />
Grande Embayment. West <strong>of</strong> <strong>the</strong> Frio<br />
River, <strong>the</strong> Reklaw thins significantly and<br />
is equivalent to <strong>the</strong> base <strong>of</strong> <strong>the</strong> Bigford<br />
Formation. The Queen City Formation<br />
thickens and correlates to <strong>the</strong> Bigford<br />
Formation and <strong>the</strong> lower part <strong>of</strong> <strong>the</strong> El<br />
Pico Clay. The Bigford can be composed<br />
<strong>of</strong> up to 75 percent sands. West <strong>of</strong> <strong>the</strong><br />
Frio River, <strong>the</strong> upper Queen City and<br />
<strong>the</strong> Weches formations become indistinguishable<br />
and interfinger with <strong>the</strong> clays<br />
<strong>of</strong> <strong>the</strong> El Pico Clay.<br />
The Queen City Formation is overlain<br />
by <strong>the</strong> Weches Formation, a marine<br />
unit composed <strong>of</strong> glauconitic muds.<br />
This formation represents a marine<br />
transgression between Queen City and<br />
Sparta deposition. The Weches is a thin<br />
formation, generally less than 100 feet<br />
thick. West <strong>of</strong> <strong>the</strong> Frio River, <strong>the</strong> Weches<br />
Formation becomes indistinguishable<br />
from <strong>the</strong> underlying Queen City and is<br />
considered part <strong>of</strong> <strong>the</strong> El Pico Clay.<br />
Overlying <strong>the</strong> Weches Formation is<br />
<strong>the</strong> Sparta Formation. Ricoy and Brown<br />
(1977) identified three principal depositional<br />
facies within <strong>the</strong> Sparta: (1) a highconstructive<br />
delta facies in East <strong>Texas</strong>, (2)<br />
a stand-plain/barrier bar facies in Central<br />
<strong>Texas</strong>, and (3) a high-destructive wave<br />
dominated deltaic facies in South <strong>Texas</strong>.<br />
The Sparta is very identifiable in <strong>Texas</strong><br />
as a sand-rich unit overlain and underlain<br />
by marly marine transgressive units,<br />
<strong>the</strong> Cook Mountain and Weches formations,<br />
respectively. The sources <strong>of</strong> sand<br />
to <strong>the</strong> Sparta delta systems were primarily<br />
from East and South <strong>Texas</strong>, with <strong>the</strong><br />
stand-plain facies being fed by longshore<br />
currents in Central <strong>Texas</strong>. The Sparta is<br />
significantly thicker east <strong>of</strong> <strong>the</strong> study area<br />
in Louisiana, Arkansas, and Mississippi<br />
and also thickens southwest <strong>of</strong> <strong>the</strong> study<br />
area in nor<strong>the</strong>astern Mexico (Ricoy and<br />
Brown, 1977). The Sparta and overlying<br />
Cook Mountain grade into <strong>the</strong> Laredo<br />
Formation west <strong>of</strong> <strong>the</strong> Frio River.<br />
<strong>Texas</strong> Water Development Board <strong>Report</strong> <strong>374</strong> 91
5.3<br />
Aquifer structure and<br />
character<br />
The Rio Grande and Houston embayments,<br />
East <strong>Texas</strong> Embayment (sometimes<br />
referred to as <strong>the</strong> East <strong>Texas</strong><br />
Basin), Sabine Uplift, and San Marcos<br />
Arch are <strong>the</strong> main structural features<br />
underlying <strong>the</strong> onshore part <strong>of</strong> <strong>the</strong><br />
Gulf <strong>of</strong> Mexico Basin (Jackson, 1982;<br />
Galloway and o<strong>the</strong>rs, 2000). Sediment<br />
input for <strong>the</strong> Queen City Formation<br />
was focused in <strong>the</strong> Rio Grande Embayment,<br />
whereas for <strong>the</strong> Sparta Formation<br />
<strong>the</strong> main sediment input was to<br />
<strong>the</strong> east in <strong>the</strong> central Mississippi axis<br />
(Galloway and o<strong>the</strong>rs, 2000). The East<br />
<strong>Texas</strong> Embayment is one <strong>of</strong> <strong>the</strong> major<br />
sub-basins formed early in <strong>the</strong> Mesozoic,<br />
and it had significant thicknesses<br />
<strong>of</strong> halite deposition. Subsidence, tilting,<br />
and differential loading by Cenozoic<br />
sediments caused <strong>the</strong> displacement <strong>of</strong><br />
halite beds and <strong>the</strong> formation <strong>of</strong> various<br />
salt-tectonic features such as salt<br />
ridges and salt diapirs or domes (Jackson,<br />
1982). The Sabine Uplift, which lies<br />
at <strong>the</strong> eastern edge <strong>of</strong> <strong>the</strong> study area and<br />
extends into Louisiana, is a broad structural<br />
dome. Its topographic expression<br />
influenced sediment deposition in <strong>the</strong><br />
East <strong>Texas</strong> Embayment during <strong>the</strong> Tertiary<br />
(Fogg and o<strong>the</strong>rs, 1991). The San<br />
Marcos Arch is a structurally high basement<br />
feature beneath <strong>the</strong> central part <strong>of</strong><br />
<strong>the</strong> <strong>Texas</strong> <strong>Coastal</strong> Plain, separating <strong>the</strong><br />
East <strong>Texas</strong> and Rio Grande basins, areas<br />
that had greater rates <strong>of</strong> subsidence.<br />
The Queen City and Sparta formations<br />
drape over <strong>the</strong> San Marcos Arch.<br />
As part <strong>of</strong> <strong>the</strong> development <strong>of</strong> <strong>the</strong><br />
TWDB groundwater availability model<br />
for <strong>the</strong> Queen City and Sparta aquifers,<br />
Seay Nance (Jackson School <strong>of</strong> Geosciences)<br />
developed additional structural<br />
control and net sand picks for <strong>the</strong> Queen<br />
City and Sparta aquifers across <strong>Texas</strong>.<br />
Construction <strong>of</strong> structural contour surfaces<br />
<strong>of</strong> <strong>the</strong> Queen City and Sparta aquifers<br />
required compiling and digitizing<br />
structural information from a number<br />
<strong>of</strong> sources. Sources on subsurface structure<br />
included Payne (1968), Garcia (1972),<br />
Guevara and Garcia (1972), Guevara<br />
(1972), Ricoy (1976), Ricoy and Brown<br />
(1977), unpublished data from an East<br />
<strong>Texas</strong> groundwater model developed<br />
by TWDB, and data from <strong>the</strong> U.S. Geological<br />
Survey’s Regional Aquifer-System<br />
Analysis (Wilson and Hossman, 1988).<br />
The groundwater availability model<br />
development effort used a subset <strong>of</strong><br />
<strong>the</strong> original logs used from <strong>the</strong> work <strong>of</strong><br />
Guevara (1972), Garcia (1972), and Ricoy<br />
(1976) to develop <strong>the</strong> structure. These<br />
were augmented by additional geophysical<br />
logs ga<strong>the</strong>red at <strong>the</strong> <strong>Texas</strong> Commission<br />
on Environmental Quality Surface<br />
Casing Unit.<br />
Figure 5-4 shows two structural<br />
cross sections in <strong>the</strong> study area. Cross<br />
section A-A’ shows <strong>the</strong> Tertiary formations<br />
from <strong>the</strong> Wilcox Group through<br />
<strong>the</strong> Sparta Formation in East <strong>Texas</strong>. The<br />
primary structural features in <strong>the</strong> eastern<br />
part <strong>of</strong> <strong>the</strong> study area are <strong>the</strong> East<br />
<strong>Texas</strong> Basin, <strong>the</strong> Sabine Uplift, and <strong>the</strong><br />
Houston Embayment. The Queen City<br />
Formation outcrops in <strong>the</strong> East <strong>Texas</strong><br />
Basin (Figure 5-4). In portions <strong>of</strong> <strong>the</strong> East<br />
<strong>Texas</strong> Basin, <strong>the</strong> Weches and overlying<br />
Sparta formations are still present and<br />
confine <strong>the</strong> Queen City Formation. The<br />
Queen City, Weches, and Sparta formations<br />
are eroded and not present over<br />
<strong>the</strong> Sabine Uplift. South <strong>of</strong> <strong>the</strong> Sabine<br />
Uplift, <strong>the</strong>se formations outcrop in a<br />
narrow band parallel to <strong>the</strong> present-day<br />
coastline. The entire Tertiary section<br />
steeply dips into <strong>the</strong> Gulf Coast Basin<br />
south <strong>of</strong> <strong>the</strong> Sabine Uplift and <strong>the</strong> East<br />
<strong>Texas</strong> Basin. Westward through Central<br />
and South <strong>Texas</strong>, <strong>the</strong> Queen City,<br />
Weches, and Sparta formations outcrop<br />
in a narrow band paralleling <strong>the</strong> present<br />
day coast and dipping strongly toward<br />
<strong>the</strong> Gulf Coast Basin. Cross section B-B’<br />
(Figure 5-4) is representative <strong>of</strong> Central<br />
and South <strong>Texas</strong>. The dip <strong>of</strong> <strong>the</strong> formations<br />
in <strong>the</strong> subsurface can reach 250 feet<br />
per mile in portions <strong>of</strong> South and Central<br />
<strong>Texas</strong>.<br />
92 <strong>Texas</strong> Water Development Board <strong>Report</strong> <strong>374</strong>
Elevation (feet above mean level)<br />
0<br />
-1,000<br />
-2,000<br />
-3,000<br />
-4,000<br />
0<br />
A A’<br />
B<br />
100,000 200,000 300,000 400,000 500,000 600,000 700,000 800,000 900,000 1,000,000<br />
Distance (feet)<br />
B’<br />
0<br />
Elevation (feet above mean sea level)<br />
-2,000<br />
-4,000<br />
-6,000<br />
-8,000<br />
0 100,000 200,000 300,000<br />
Younger sediments<br />
Sparta Sand<br />
Weches Formation<br />
Queen City Sand<br />
Reklaw Formation<br />
Carrizo Sand<br />
Wilcox Group<br />
Distance (feet)<br />
Figure 5-4. Generalized structural cross sections for <strong>the</strong> Queen City and Sparta aquifers (Kelley and o<strong>the</strong>rs, 2004).<br />
B<br />
B'<br />
A<br />
A'<br />
Figure 4.<br />
Figures 5-5 and 5-6 show <strong>the</strong> isopach<br />
surfaces for <strong>the</strong> Queen City and Sparta<br />
aquifers, respectively. The thickness<br />
<strong>of</strong> <strong>the</strong> Queen City Formation and its<br />
stratigraphic equivalents increases considerably<br />
from almost nothing at <strong>the</strong><br />
Louisiana state line to more than 2,000<br />
feet at <strong>the</strong> Mexican border (Figure 5-5).<br />
In East <strong>Texas</strong> and west <strong>of</strong> <strong>the</strong> Sabine<br />
Uplift along <strong>the</strong> East <strong>Texas</strong> Embayment,<br />
<strong>the</strong> Queen City Formation is in<br />
outcrop and is generally between 200<br />
and 400 feet thick but locally reaches<br />
more than 500 feet in Smith County.<br />
The Queen City Formation as a deltaic<br />
sandy aquifer pinches out south <strong>of</strong> <strong>the</strong><br />
Sabine Uplift where its stratigraphic<br />
equivalent is part <strong>of</strong> <strong>the</strong> marine Cane<br />
River Formation. Toward <strong>the</strong> southwest,<br />
<strong>the</strong> thickness gradually increases from<br />
about 400 feet in Leon County to about<br />
800 feet in Wilson County. Fur<strong>the</strong>r south,<br />
approaching <strong>the</strong> center <strong>of</strong> <strong>the</strong> Rio Grande<br />
Embayment, <strong>the</strong> thickness <strong>of</strong> <strong>the</strong> Queen<br />
City Formation increases dramatically to<br />
more than 1,200 feet and becomes more<br />
clayey, transitioning to its stratigraphic<br />
equivalent west <strong>of</strong> <strong>the</strong> Frio River, <strong>the</strong> El<br />
Pico Clay.<br />
The thickness <strong>of</strong> <strong>the</strong> Weches Formation<br />
is generally under 100 feet and<br />
reaches more than 200 feet only in <strong>the</strong><br />
deep confined sections <strong>of</strong> <strong>the</strong> aquifer system.<br />
In Louisiana and south <strong>of</strong> <strong>the</strong> Sabine<br />
Uplift, <strong>the</strong> stratigraphic equivalent <strong>of</strong> <strong>the</strong><br />
Weches Formation is <strong>the</strong> Cane River Formation,<br />
which also includes <strong>the</strong> stratigraphic<br />
equivalent <strong>of</strong> <strong>the</strong> Queen City and<br />
Structural cross sections for <strong>the</strong> Carrizo-Wilcox Aquifer and overlying sediments.<br />
<strong>Texas</strong> Water Development Board <strong>Report</strong> <strong>374</strong> 93
Structure control points<br />
Kelley and o<strong>the</strong>rs (2004)<br />
East <strong>Texas</strong> model<br />
Queen City Aquifer boundary<br />
County/Parish boundaries<br />
0 90 180<br />
Miles<br />
Thickness <strong>of</strong><br />
Queen City<br />
Formation (feet)<br />
0–300<br />
300–600<br />
600–900<br />
900–1,200<br />
1,200–1,500<br />
1,500–1,800<br />
1,800–2,100<br />
Figure 5-5. Thickness <strong>of</strong> Queen City Aquifer.<br />
Reklaw formations. The thickness <strong>of</strong> <strong>the</strong><br />
Sparta Formation varies gradually from<br />
more than 700 feet at <strong>the</strong> Red River in<br />
Louisiana to about 200 feet in <strong>the</strong> updip<br />
subsurface in South <strong>Texas</strong> (Figure 5-6).<br />
The thickness <strong>of</strong> <strong>the</strong> formation generally<br />
increases with depth and also varies<br />
locally along strike, correlating with<br />
<strong>the</strong> axes <strong>of</strong> <strong>the</strong> fluvio-deltaic deposition<br />
centers. In particular, <strong>the</strong> expression <strong>of</strong><br />
<strong>the</strong> San Marcos Arch is visible in Gonzales<br />
County, with a local decrease in<br />
both <strong>the</strong> formation thickness and net<br />
sand thickness. West <strong>of</strong> <strong>the</strong> Frio River,<br />
<strong>the</strong> Sparta Formation merges into <strong>the</strong><br />
Laredo Formation, which is <strong>the</strong> stratigraphic<br />
equivalent to <strong>the</strong> Cook Mountain<br />
Formation.<br />
Figures 5-7 and 5-8 plot net sand maps<br />
for <strong>the</strong> Queen City and Sparta aquifers.<br />
These maps were developed and documented<br />
as part <strong>of</strong> <strong>the</strong> development efforts<br />
<strong>of</strong> <strong>the</strong> TWDB groundwater availability<br />
model (Kelley and o<strong>the</strong>rs, 2004) and<br />
based upon maps published in Guevara<br />
and Garcia (1972) and Ricoy and Brown<br />
(1977), respectively, and <strong>the</strong> work <strong>of</strong> Payne<br />
(1968), Ricoy (1976), Garcia (1972), and<br />
94 <strong>Texas</strong> Water Development Board <strong>Report</strong> <strong>374</strong>
Structure control points<br />
Kelley and o<strong>the</strong>rs (2004)<br />
East <strong>Texas</strong> model<br />
Sparta Aquifer boundary<br />
County/Parish boundaries<br />
0 90 180<br />
Miles<br />
Thickness<br />
<strong>of</strong> Sparta<br />
Formation (feet)<br />
15–100<br />
100–200<br />
200–300<br />
300–400<br />
400–500<br />
500–700<br />
Figure 5-6. Thickness <strong>of</strong> <strong>the</strong> Sparta Aquifer.<br />
Guevara (1972). Because <strong>of</strong> inadequate<br />
control, <strong>the</strong> Queen City Aquifer net<br />
sand isopach map (Figure 5-7) does not<br />
include areas within <strong>the</strong> outcrop, which<br />
are a significant portion <strong>of</strong> <strong>the</strong> East <strong>Texas</strong><br />
Basin. For <strong>the</strong> same reasons, <strong>the</strong> Sparta<br />
net sand isopach map (Figure 5-8) does<br />
not include outcrop areas. Sand thicknesses<br />
decrease downdip moving away<br />
from sediment sources and from highenergy<br />
to low-energy depositional settings.<br />
The impact <strong>of</strong> <strong>the</strong> basement high<br />
<strong>of</strong> <strong>the</strong> San Marcos Arch is apparent in<br />
decreasing sand thickness <strong>of</strong> both <strong>the</strong><br />
Queen City and Sparta formations. The<br />
Queen City Formation sand thickness in<br />
<strong>the</strong> updip subsurface varies from more<br />
than 250 feet in East <strong>Texas</strong> southwest <strong>of</strong><br />
<strong>the</strong> Sabine Uplift to more than 1,000 feet<br />
in <strong>the</strong> Rio Grande Embayment.<br />
The lobate complex shape <strong>of</strong> <strong>the</strong> contour<br />
lines, particularly in East and Central<br />
<strong>Texas</strong>, reflects <strong>the</strong> individual fluvial<br />
sand input centers. Slightly less lobate<br />
contour lines in South <strong>Texas</strong> suggest that<br />
<strong>the</strong> sediments were partially reworked<br />
and redistributed. The Sparta Formation<br />
sand thickness in <strong>the</strong> updip subsurface is<br />
<strong>Texas</strong> Water Development Board <strong>Report</strong> <strong>374</strong> 95
Figure 5-7. Queen City sand thickness (after Guevara and Garcia, 1972).<br />
more constant throughout <strong>the</strong> study area<br />
at approximately 200 to 300 feet, with<br />
<strong>the</strong> influence <strong>of</strong> <strong>the</strong> San Marcos Arch in<br />
Wilson, Gonzales, and Fayette counties<br />
again manifested in a reduced sand thickness<br />
<strong>of</strong> about 100 feet. The contour lines<br />
show well-developed lobes on ei<strong>the</strong>r side<br />
<strong>of</strong> <strong>the</strong> arch but are parallel to <strong>the</strong> formation<br />
strike at <strong>the</strong> arch location. This is<br />
explained by a lack <strong>of</strong> terrestrial sediment<br />
input during <strong>the</strong> time <strong>of</strong> <strong>the</strong> Sparta<br />
sedimentation on <strong>the</strong> San Marcos Arch<br />
and by lateral sediment transport along<br />
<strong>the</strong> coast <strong>of</strong> <strong>the</strong> ancestral Gulf <strong>of</strong> Mexico<br />
(Ricoy, 1976).<br />
5.4<br />
Hydraulic properties<br />
Relatively few aquifer pump tests have<br />
been performed in <strong>the</strong> Queen City<br />
and Sparta aquifers. Kelley and o<strong>the</strong>rs<br />
(2004) performed a review <strong>of</strong> <strong>the</strong> available<br />
aquifer hydraulic properties for<br />
<strong>the</strong>se aquifers. In support <strong>of</strong> <strong>the</strong> development<br />
<strong>of</strong> <strong>the</strong> TWDB groundwater<br />
availability model, specific capacity data<br />
96 <strong>Texas</strong> Water Development Board <strong>Report</strong> <strong>374</strong>
Figure 5-8. Sparta sand thickness (after Ricoy and Brown, 1977).<br />
were compiled from <strong>the</strong> well records at<br />
<strong>the</strong> <strong>Texas</strong> Commission on Environmental<br />
Quality. A total <strong>of</strong> 617 unique tests<br />
were assigned to <strong>the</strong> Queen City Aquifer,<br />
but only 38 measurements were<br />
identified as Sparta Aquifer tests. In<br />
addition, direct hydraulic conductivity<br />
data for <strong>the</strong> Queen City Aquifer were<br />
extracted from a Bureau <strong>of</strong> Economic<br />
Geology report developed for TWDB<br />
documenting aquifer properties <strong>of</strong> <strong>the</strong><br />
Carrizo-Wilcox <strong>Aquifers</strong> (Mace and<br />
o<strong>the</strong>rs, 2002). Table 5-1 provides a<br />
summary <strong>of</strong> <strong>the</strong> hydraulic conductivity<br />
database developed in Kelley and o<strong>the</strong>rs<br />
(2004) for <strong>the</strong> Queen City and Sparta<br />
aquifers.<br />
Issues <strong>of</strong> bias surely affect <strong>the</strong> available<br />
measured hydraulic conductivities.<br />
Specifically, <strong>the</strong>se measurements are representative<br />
<strong>of</strong> <strong>the</strong> more productive portions<br />
<strong>of</strong> <strong>the</strong> aquifers, which correspond<br />
to <strong>the</strong> sandier sections <strong>of</strong> <strong>the</strong> aquifers.<br />
Second, <strong>the</strong>y are almost all restricted to<br />
shallow measurements. Payne (1968),<br />
Prudic (1991), and Young and Kelley<br />
(2006) have shown evidence for positive<br />
correlation between sand bed thickness<br />
<strong>Texas</strong> Water Development Board <strong>Report</strong> <strong>374</strong> 97
Table 5-1. Summary statistics for hydraulic conductivity.<br />
Statistic<br />
Queen City<br />
TCEQ Mace Combined<br />
Number <strong>of</strong> samples 617 412 1,029 38<br />
Sparta<br />
Arithmetic mean (ft/day) 9.8 17.0 12.7 18.3<br />
Median (ft/day) 3.9 5.0 4.2 5.7<br />
Geometric mean (ft/day) 3.8 5.7 4.5 5.8<br />
Standard deviation K (ft/day) 18.0 52.7 36.3 30.0<br />
Standard deviation Log10(K ft/day) 0.62 0.64 0.63 0.80<br />
Source: Data after Kelley and o<strong>the</strong>rs (2004)<br />
TCEQ = <strong>Texas</strong> Commission on Environmental Quality; ft/day = feet per day<br />
and hydraulic conductivity. Prudic (1991)<br />
also demonstrated in <strong>the</strong> <strong>Texas</strong> Gulf<br />
<strong>Coastal</strong> Plain aquifers that hydraulic conductivity<br />
decreases with depth, a concept<br />
explored in more detail from a <strong>the</strong>oretical<br />
basis in Young and Kelley (2006).<br />
Nei<strong>the</strong>r <strong>of</strong> <strong>the</strong>se trends was discerned<br />
in <strong>the</strong> Queen City and Sparta hydraulic<br />
conductivity data analyzed by Kelley and<br />
o<strong>the</strong>rs (2004).<br />
Very few measurements <strong>of</strong> storativity<br />
and specific yield are published for<br />
<strong>the</strong> Queen City and Sparta aquifers. A<br />
literature review was performed for <strong>the</strong><br />
aquifers in <strong>Texas</strong> and was documented<br />
in Kelley and o<strong>the</strong>rs (2004). The literature<br />
review <strong>of</strong> values <strong>of</strong> storativity <strong>of</strong> <strong>the</strong><br />
Queen City and Sparta aquifers provides<br />
a range in magnitude from 1.0x10 -4 to<br />
5.2x10 -3 , with a geometric mean equal to<br />
2.35x10 -4 . Specific yield estimates were<br />
all from previously calibrated modeling<br />
studies and ranged from 0.01, which is<br />
unrealistically low for an unconsolidated<br />
clastic aquifer, to 0.25.<br />
5.5<br />
Water levels and<br />
groundwater flow<br />
Groundwater within <strong>the</strong> Queen City<br />
and Sparta aquifers occurs under water<br />
table conditions in <strong>the</strong> outcrop areas<br />
and artesian conditions downdip <strong>of</strong> <strong>the</strong><br />
outcrops where <strong>the</strong> aquifers are confined.<br />
Groundwater flow within <strong>the</strong><br />
outcrop areas is essentially controlled<br />
by local topography, flowing from <strong>the</strong><br />
higher elevation areas and discharging<br />
in <strong>the</strong> lower elevation areas (streams<br />
and riparian corridors). Within <strong>the</strong> confined<br />
portions <strong>of</strong> <strong>the</strong> aquifer, groundwater<br />
flow is controlled by regional<br />
topography, flowing from <strong>the</strong> outcrop<br />
toward <strong>the</strong> subcrop and discharging by<br />
processes <strong>of</strong> cross-formational flow and<br />
flow to regional sinks (major streams<br />
and rivers). The relative amount <strong>of</strong><br />
groundwater flow occurring within <strong>the</strong><br />
unconfined portions <strong>of</strong> <strong>the</strong> aquifer is<br />
thought to greatly exceed <strong>the</strong> downdip<br />
groundwater flow occurring in <strong>the</strong> confined<br />
sections <strong>of</strong> <strong>the</strong> aquifer (see discussion<br />
<strong>of</strong> aquifer discharge below).<br />
Over a large portion <strong>of</strong> East <strong>Texas</strong>,<br />
<strong>the</strong> Queen City Aquifer exists in outcrop<br />
(ground surface) within <strong>the</strong> East <strong>Texas</strong><br />
Embayment and surrounding <strong>the</strong> Sabine<br />
Uplift. In this portion <strong>of</strong> <strong>Texas</strong>, <strong>the</strong> presence<br />
<strong>of</strong> ridges and valleys with significant<br />
elevation differences results in <strong>the</strong> development<br />
<strong>of</strong> localized groundwater basins<br />
within <strong>the</strong> aquifer and <strong>the</strong> absence <strong>of</strong> a<br />
regionally coherent flow system (Fogg<br />
and Kreitler, 1982). This implies that most<br />
flow paths in this region are locally controlled<br />
from topographic highs to topographic<br />
lows, with <strong>the</strong> great majority <strong>of</strong><br />
recharge discharging locally.<br />
In <strong>the</strong> outcrop belt <strong>of</strong> <strong>the</strong> Queen<br />
City and Sparta aquifers, groundwater<br />
recharges in <strong>the</strong> higher elevations along<br />
drainage divides and discharges in lower<br />
elevations in creeks and rivers. Some<br />
98 <strong>Texas</strong> Water Development Board <strong>Report</strong> <strong>374</strong>
Figure 5-9. Estimated water level elevation contours for predevelopment conditions in <strong>the</strong> entire Sparta Aquifer.<br />
portion <strong>of</strong> recharge at <strong>the</strong> outcrop flows<br />
into <strong>the</strong> confined portions <strong>of</strong> <strong>the</strong> aquifers,<br />
moving horizontally along <strong>the</strong> dip <strong>of</strong> <strong>the</strong><br />
formations in response to regional elevation<br />
gradients and vertically through<br />
cross-formational flow. In general, <strong>the</strong><br />
dip <strong>of</strong> <strong>the</strong> formations and land surface<br />
is toward <strong>the</strong> Gulf <strong>of</strong> Mexico, resulting<br />
in groundwater flow in southward and<br />
southwesterly directions in Nacogdoches,<br />
San Augustine, and Sabine counties<br />
and in <strong>the</strong> sou<strong>the</strong>asterly direction in <strong>the</strong><br />
counties from Houston County in <strong>the</strong><br />
north to La Salle County in <strong>the</strong> south.<br />
Predevelopment and historical water<br />
level surfaces were constructed for <strong>the</strong><br />
Queen City and Sparta aquifers and are<br />
documented in Kelley and o<strong>the</strong>rs (2004).<br />
Please see Kelley and o<strong>the</strong>rs (2004) for<br />
details regarding assumptions and data<br />
supporting interpreted head surfaces.<br />
Figure 5-9 shows <strong>the</strong> estimated predevelopment<br />
head surface for <strong>the</strong> Sparta<br />
Aquifer. As expected, <strong>the</strong> heads are highest<br />
in <strong>the</strong> outcrop and lower in <strong>the</strong> confined<br />
downdip portions <strong>of</strong> <strong>the</strong> aquifer.<br />
Conceptually, this suggests that <strong>the</strong> aquifer<br />
system recharges at <strong>the</strong> outcrop in <strong>the</strong><br />
<strong>Texas</strong> Water Development Board <strong>Report</strong> <strong>374</strong> 99
highest elevations available to <strong>the</strong> aquifer<br />
system and flows out as streams, springs,<br />
and groundwater evapotranspiration in<br />
<strong>the</strong> outcrop and into <strong>the</strong> confined section<br />
<strong>of</strong> <strong>the</strong> aquifer, losing potential (head)<br />
along <strong>the</strong> flow path. Groundwater reaching<br />
<strong>the</strong> confined portions <strong>of</strong> <strong>the</strong> aquifer<br />
discharges upward under natural conditions<br />
to overlying units between <strong>the</strong> outcrop<br />
and <strong>the</strong> portions <strong>of</strong> <strong>the</strong> aquifer with<br />
poor water quality. A similar predevelopment<br />
map was developed for <strong>the</strong> Queen<br />
City Aquifer in sou<strong>the</strong>rn and Central<br />
<strong>Texas</strong>. Head patterns were similar, with<br />
heads being generally higher, reflecting<br />
an updip outcrop elevation relative to<br />
<strong>the</strong> Sparta (higher ground elevation). A<br />
predevelopment head surface was not<br />
developed for <strong>the</strong> nor<strong>the</strong>rn portions <strong>of</strong><br />
<strong>the</strong> Queen City Aquifer because data<br />
were lacking over large portions <strong>of</strong> <strong>the</strong><br />
region, and contouring could not replicate<br />
<strong>the</strong> subregional hill to valley flow<br />
systems seen in <strong>the</strong> few counties with<br />
significant data.<br />
As a result <strong>of</strong> limited historical development,<br />
water levels in <strong>the</strong> Queen City<br />
and Sparta aquifers have generally been<br />
stable across <strong>the</strong> state, except for localized<br />
declines in areas <strong>of</strong> high pumping.<br />
Because pumping volumes are relatively<br />
small and <strong>the</strong>se aquifers are less productive<br />
than many o<strong>the</strong>r <strong>Texas</strong> <strong>Coastal</strong><br />
Plain aquifers, drawdown associated with<br />
pumping tends to be local, and regional<br />
reductions in head in <strong>the</strong> confined portions<br />
<strong>of</strong> <strong>the</strong>se aquifers have not been<br />
observed. Water level declines in <strong>the</strong><br />
Queen City tend to be more common<br />
in <strong>the</strong> central and sou<strong>the</strong>rn parts <strong>of</strong> <strong>the</strong><br />
aquifer where <strong>the</strong> aquifer is more likely<br />
to be confined or semi-confined and<br />
storativity is low. Water level declines in<br />
<strong>the</strong> Sparta are less common, with local<br />
declines reaching 40 to 60 feet in wells<br />
screened in <strong>the</strong> confined portions <strong>of</strong> <strong>the</strong><br />
aquifer.<br />
To better conceptualize vertical gradients<br />
and <strong>the</strong> potential for cross-formational<br />
flow between <strong>the</strong> Queen City<br />
and Sparta aquifers and between <strong>the</strong>se<br />
aquifers and <strong>the</strong> underlying Carrizo-<br />
Wilcox Aquifer, Kelley and o<strong>the</strong>rs (2004)<br />
conducted a pressure head versus screenmidpoint<br />
depth analysis similar to methods<br />
used in Fogg and Kreitler (1982). In<br />
summary, vertical pressure gradients are<br />
generally upward in areas <strong>of</strong> Central and<br />
South <strong>Texas</strong> and are generally downward<br />
in <strong>the</strong> nor<strong>the</strong>ast. There is evidence for a<br />
decrease in upward gradients in Central<br />
<strong>Texas</strong> from pre-1950 to post-1950 head<br />
measurements, suggesting decreasing<br />
heads in <strong>the</strong> Carrizo. There was a lack<br />
<strong>of</strong> measurements prior to 1950 in <strong>the</strong><br />
sou<strong>the</strong>rn portions <strong>of</strong> <strong>the</strong> aquifers from<br />
which to investigate temporal trends.<br />
However, <strong>the</strong> magnitude <strong>of</strong> <strong>the</strong> downward<br />
vertical gradient in nor<strong>the</strong>ast <strong>Texas</strong><br />
showed evidence <strong>of</strong> an increasing trend<br />
over time, reflecting development and<br />
water level decline <strong>of</strong> <strong>the</strong> underlying Carrizo<br />
Aquifer.<br />
5.6<br />
Recharge and discharge<br />
Recharge can be defined as water that<br />
enters <strong>the</strong> saturated zone at <strong>the</strong> water<br />
table (Freeze, 1969). Recharge is a complex<br />
function <strong>of</strong> rate and volume <strong>of</strong><br />
precipitation, soil type, water level, soil<br />
moisture, topography, and evapotranspiration<br />
(Freeze, 1969). Recharge is<br />
expected to vary seasonally. For example,<br />
winter and early spring is generally<br />
a high precipitation time. During this<br />
time, soil moisture would also be high<br />
while evapotranspiration rates would<br />
be low. These conditions combine to<br />
increase <strong>the</strong> potential for recharge.<br />
In <strong>the</strong> heat <strong>of</strong> <strong>the</strong> summer, precipitation<br />
events tend to be more isolated,<br />
soil moisture is lower, and evapotranspiration<br />
is highest. These conditions<br />
combine to decrease <strong>the</strong> potential for<br />
recharge. Potential sources for recharge<br />
to <strong>the</strong> water table include precipitation,<br />
stream or reservoir leakage, or irrigation<br />
return flow. In <strong>the</strong> Queen City and<br />
Sparta aquifers, recharge is conceptualized<br />
to occur both as diffuse recharge in<br />
<strong>the</strong> outcrop and as focused recharge in<br />
100 <strong>Texas</strong> Water Development Board <strong>Report</strong> <strong>374</strong>
areas where streams are predominantly<br />
losing (South <strong>Texas</strong>). Similarly, <strong>the</strong><br />
amount <strong>of</strong> recharge occurring as diffuse<br />
recharge is expected to decrease from<br />
<strong>the</strong> wet humid nor<strong>the</strong>ast portions <strong>of</strong> <strong>the</strong><br />
state to <strong>the</strong> more arid southwest.<br />
Recharge in <strong>the</strong> major aquifers <strong>of</strong><br />
<strong>Texas</strong> has been studied by many investigators.<br />
These studies have been summarized<br />
by Scanlon and o<strong>the</strong>rs (2002).<br />
However, few estimates <strong>of</strong> recharge are<br />
available for <strong>the</strong> Queen City and Sparta<br />
aquifers in <strong>Texas</strong>. Muller and Price (1979)<br />
estimated groundwater availability for<br />
<strong>the</strong> aquifers <strong>of</strong> <strong>Texas</strong>, which <strong>the</strong>y typically<br />
equated to recharge estimates.<br />
The development <strong>of</strong> <strong>the</strong> Queen City<br />
and Sparta groundwater availability<br />
models (Kelley and o<strong>the</strong>rs, 2004) also<br />
provides estimates <strong>of</strong> recharge. If Muller<br />
and Price (1979) availability estimates are<br />
considered equivalent to recharge, <strong>the</strong>y<br />
can be compared to estimates developed<br />
by Kelley and o<strong>the</strong>rs (2004). Table 5-2<br />
summarizes this comparison, and shows<br />
that <strong>the</strong> recharge estimate from Kelley<br />
and o<strong>the</strong>rs (2004) is similar to that by<br />
Muller and Price (1979) for <strong>the</strong> Sparta<br />
but is significantly reduced for <strong>the</strong> Queen<br />
City Aquifer.<br />
In <strong>the</strong> predevelopment long-term<br />
steady-state condition <strong>of</strong> an aquifer,<br />
recharge equals discharge. As a result,<br />
quantifying stream base flow and springflow<br />
can provide one <strong>of</strong> <strong>the</strong> few, if not<br />
<strong>the</strong> only, means <strong>of</strong> constraining regional<br />
aquifer recharge. A limitation <strong>of</strong> this<br />
approach is <strong>the</strong> inability to account for<br />
downdip flow to <strong>the</strong> confined section<br />
and groundwater evapotranspiration.<br />
Thus, this approach tends to underestimate<br />
recharge. The value <strong>of</strong> <strong>the</strong>se estimates<br />
is that <strong>the</strong>y provide a lower limit<br />
to regional aquifer recharge. Such studies<br />
have not been performed over <strong>the</strong><br />
entirety <strong>of</strong> <strong>the</strong> Queen City and Sparta<br />
aquifers to date.<br />
Estimates <strong>of</strong> stream-aquifer interaction<br />
and springflow have been made<br />
across various portions <strong>of</strong> <strong>the</strong> aquifers in<br />
<strong>Texas</strong> and are documented in Kelley and<br />
Table 5-2. Recharge estimates for <strong>the</strong> Queen City<br />
and Sparta aquifers.<br />
Aquifer<br />
Queen<br />
City<br />
Muller and<br />
Price (1979)<br />
AFY<br />
Kelley and<br />
o<strong>the</strong>rs (2004)<br />
in/<br />
yr AFY in/yr<br />
682,100 1.3 364,522 0.7<br />
Sparta 163,800 1.3 196,442 1.5<br />
AFY = acre-feet per year; in/yr = inches per year<br />
o<strong>the</strong>rs (2004). This chapter summarizes<br />
those studies that apply most directly<br />
to <strong>the</strong> Queen City and Sparta aquifers.<br />
Table 5-3 summarizes <strong>the</strong> Queen City<br />
and Sparta stream-aquifer interaction<br />
studies. Stream-aquifer interaction can<br />
be quantified through several means,<br />
including low-flow studies, hydrograph<br />
separation studies, and modeling studies.<br />
Most studies germane to <strong>the</strong>se aquifers<br />
were reported in a survey study performed<br />
by <strong>the</strong> U.S. Geological Survey<br />
(Slade and o<strong>the</strong>rs, 2002). They documented<br />
41 gain/loss studies that intersect<br />
<strong>the</strong> Queen City and/or Sparta outcrop.<br />
Most <strong>of</strong> <strong>the</strong>se studies also intersected<br />
o<strong>the</strong>r aquifers in <strong>the</strong> study segments and<br />
are not included in Table 5-3. In addition<br />
to <strong>the</strong>se studies documented by Slade<br />
and o<strong>the</strong>rs (2002), three additional studies<br />
have become available since <strong>the</strong> U.S.<br />
Geological Survey study.<br />
In support <strong>of</strong> <strong>the</strong> Lower Colorado<br />
River Authority-San Antonio Water<br />
System water supply project studies,<br />
<strong>the</strong> Lower Colorado River Authority<br />
performed a detailed low-flow study on<br />
<strong>the</strong> Colorado River below Austin to Bay<br />
City in Matagorda County (Saunders,<br />
2006). The study period was carefully<br />
chosen to be a dry (low run<strong>of</strong>f) period<br />
from October 1, 1999, through March<br />
31, 2000. In <strong>the</strong> reach from Bastrop to<br />
Smithville, which included <strong>the</strong> Queen<br />
City and Sparta aquifers, <strong>the</strong>y observed<br />
an average gain <strong>of</strong> 59 cubic feet per second<br />
(47,741 acre-feet per year or 1,723<br />
acre-feet per year per mile).<br />
The U.S. Geological Survey performed<br />
base flow (1966 through 2005)<br />
<strong>Texas</strong> Water Development Board <strong>Report</strong> <strong>374</strong> 101
and low-flow (2006) studies from<br />
McLennan County to Fort Bend County<br />
(Turco and o<strong>the</strong>rs, 2007). They estimated<br />
a gain <strong>of</strong> 134 cubic feet per second (97,075<br />
acre-feet per year or 4,221 acre-feet per<br />
year per mile) across <strong>the</strong> Queen City and<br />
Sparta outcrops. Recently, <strong>the</strong> U.S. Geological<br />
Survey published a gain and loss<br />
study on <strong>the</strong> Guadalupe River (Ockerman<br />
and Slattery, 2008). In <strong>the</strong> reach across<br />
<strong>the</strong> Queen City and Sparta aquifers in <strong>the</strong><br />
Lower San Marcos River, <strong>the</strong>y estimated<br />
a net gain <strong>of</strong> 293 cubic feet per second<br />
(212,261 acre-feet per year or 6,065 acrefeet<br />
per year per mile).<br />
Although <strong>the</strong>re is likely great uncertainty<br />
in <strong>the</strong> stream gain estimates<br />
provided in Table 5-3, it has been documented<br />
that streams gain in <strong>the</strong> order <strong>of</strong><br />
100 to 1,000 acre-feet per year per mile <strong>of</strong><br />
stream for <strong>the</strong> major rivers crossing <strong>the</strong><br />
outcrops <strong>of</strong> <strong>the</strong> Queen City and Sparta<br />
aquifers and <strong>the</strong> Carrizo-Wilcox Aquifer<br />
in areas <strong>of</strong> <strong>the</strong> state nor<strong>the</strong>ast <strong>of</strong> <strong>the</strong> Guadalupe.<br />
As a result, one can conclude that<br />
aquifer stream discharge in <strong>the</strong> Queen<br />
City and Sparta aquifers is probably in<br />
<strong>the</strong> order <strong>of</strong> 100,000s <strong>of</strong> acre-feet per<br />
year in <strong>the</strong> Queen City and Sparta aquifers<br />
in <strong>Texas</strong>.<br />
Discharge also occurs in areas where<br />
<strong>the</strong> water table intersects <strong>the</strong> surface at<br />
springs or seeps. These springs usually<br />
occur in topographically low areas in river<br />
valleys or in areas <strong>of</strong> <strong>the</strong> outcrop where<br />
hydrogeologic conditions preferentially<br />
reject recharge. Kelley and o<strong>the</strong>rs (2004)<br />
provide a complete review <strong>of</strong> <strong>the</strong> available<br />
information at that time. A summary <strong>of</strong><br />
available springflow data for <strong>the</strong> Queen<br />
City and Sparta aquifers is available in<br />
Table 5-4. The available information is<br />
limited because <strong>the</strong> primary source for<br />
spring information (Brune, 1981) did not<br />
include spring surveys for counties from<br />
Angelina County southwest to Burleson<br />
County and from Gonzales County<br />
southwest to Atascosa County. In fact,<br />
only eight counties are represented in<br />
Table 5-4. Therefore, is likely that <strong>the</strong>re<br />
Table 5-3. Stream-aquifer interaction studies predominantly in <strong>the</strong> Queen City and Sparta outcrop.<br />
River<br />
Guadalupe<br />
River<br />
Colorado<br />
River<br />
Brazos<br />
River<br />
Red River<br />
Trinity<br />
Trinity<br />
River reach<br />
Lower San<br />
Marcos River<br />
Bastrop -<br />
Smithville<br />
Brazos - Valley<br />
Junction to SH-<br />
21 near Bryan<br />
Sugar Creek -<br />
FM 1403 to SH<br />
154<br />
Big Elkhart<br />
Creek -<br />
northwest <strong>of</strong><br />
Grapeland to<br />
mouth<br />
Little Elkhart<br />
Creek - south<br />
<strong>of</strong> Grapeland to<br />
mouth<br />
Gain<br />
(cfs)<br />
Gain<br />
(AFY)<br />
Reach<br />
(mile) AFY/ mile Date <strong>of</strong> study Reference<br />
293 212,261 35 6,065 1987–2006<br />
59 42,742 24.8 1,723<br />
10/1999–<br />
3/31/2000<br />
134 97,075 23 4,221 3/8/2006<br />
0.15 109 0.8 136 6/10–11/1964<br />
5.18 3,753 25.7 146 9/15–16/1965<br />
-1.59 (1,152) 17.5 (66) 9/16/1965<br />
cfs = cubic feet per second; AFY = acre-feet per year; SH = state highway; FM = farm to market<br />
Ockerman<br />
and Slattery<br />
(2008)<br />
Saunders<br />
(2006)<br />
Turco and<br />
o<strong>the</strong>rs<br />
(2007)<br />
Slade and<br />
o<strong>the</strong>rs<br />
(2002)<br />
Slade and<br />
o<strong>the</strong>rs<br />
(2002)<br />
Slade and<br />
o<strong>the</strong>rs<br />
(2002)<br />
102 <strong>Texas</strong> Water Development Board <strong>Report</strong> <strong>374</strong>
are many more undocumented smaller<br />
springs and seeps, particularly in <strong>the</strong><br />
nor<strong>the</strong>astern part <strong>of</strong> <strong>the</strong> outcrop.<br />
The available measured springflow<br />
rates range from 0.23 cubic feet per<br />
second (167 acre-feet per year) to a<br />
high <strong>of</strong> 3.4 cubic feet per second (2,463<br />
acre-feet per year) measured at Elkhart<br />
Creek Springs and originating from <strong>the</strong><br />
Sparta Sand (Brune, 1975). Springs in <strong>the</strong><br />
Queen City and Sparta aquifers are limited<br />
to <strong>the</strong> outcrop and typically would<br />
be integrating flow from shallow subregional<br />
flow paths. Brune (1981) noted<br />
that throughout much <strong>of</strong> <strong>the</strong> region he<br />
studied, including select regions <strong>of</strong> <strong>the</strong><br />
Queen City and Sparta outcrop area,<br />
springflows have shown a general decline<br />
over time.<br />
In addition to stream and spring discharge,<br />
groundwater evapotranspiration<br />
is also expected to be a significant discharge<br />
mechanism for <strong>the</strong> aquifer. However,<br />
no quantitative estimates exist <strong>of</strong><br />
this flux for <strong>the</strong>se or any o<strong>the</strong>r aquifers<br />
in <strong>Texas</strong> o<strong>the</strong>r than model predictions.<br />
In 2005, <strong>the</strong> TWDB funded a study on<br />
groundwater evapotranspiration and<br />
its application to <strong>Texas</strong> groundwater<br />
availability models (Scanlon and o<strong>the</strong>rs,<br />
2005). The study did provide evidence to<br />
suggest that groundwater evapotranspiration<br />
is potentially a significant discharge<br />
mechanism. The limited riparian<br />
Table 5-4. Documented springs in <strong>the</strong> Queen City and Sparta aquifers.<br />
County Spring Formation<br />
Burleson<br />
Sour or Spring Lake<br />
Springs<br />
Flow<br />
rate (cfs)<br />
Flow rate<br />
(AFY)<br />
Date <strong>of</strong><br />
measurement<br />
Source<br />
Sparta 0.40 290 1936 Brune (1975)<br />
Camp Couch or Lee Springs Queen City 0.27 196 1-21-78 Brune (1981)<br />
Houston Caney Creek Springs Sparta 1.70 1,232 9-16-65 Brune (1975)<br />
Houston Elkhart Creek Springs Sparta 3.40 2,463 9-15-65 Brune (1975)<br />
Houston Hays Branch Springs Sparta 1.80 1,304 9-16-65 Brune (1975)<br />
Nacogdoches<br />
Nacogdoches<br />
Waterworks Springs<br />
(1 <strong>of</strong> 2)<br />
Waterworks Springs<br />
(2 <strong>of</strong> 2)<br />
Sparta 0.46 333 1914 Brune (1981)<br />
Sparta 0.46 333 2-13-78 Brune (1981)<br />
Rusk Spring Queen City 0.51 369 11-17-78<br />
TWDB well<br />
database<br />
Smith Spring Lake Springs Queen City 1.27 920 10-31-79 Brune (1981)<br />
Smith<br />
Upshur<br />
Springs in Ray Creek<br />
Hoover Springs and<br />
o<strong>the</strong>r nearby springs<br />
Sparta and<br />
Weches<br />
0.81 587 10-30-79 Brune (1981)<br />
Queen City 0.23 167 1-17-78 Brune (1981)<br />
Upshur Horn Springs Queen City 0.49 355 1-20-78 Brune (1981)<br />
Upshur Valley Springs Queen City 0.49 355 1-20-78 Brune (1981)<br />
Van Zandt Cherokee Springs Queen City 0.26 188 9-26-79 Brune (1981)<br />
Van Zandt Red Hill Springs Queen City 0.25 181 9-26-79 Brune (1981)<br />
Wood Big Woods Springs Queen City 0.34 246 10-23-79 Brune (1981)<br />
Wood Gunstream Springs Queen City 3.25 2,354 1978 Brune (1981)<br />
Wood<br />
Holly Springs and<br />
o<strong>the</strong>r nearby springs<br />
cfs = cubic feet per second; AFY = acre-feet per year<br />
Queen City 1.94 1,405 10-22-79 Brune (1981)<br />
<strong>Texas</strong> Water Development Board <strong>Report</strong> <strong>374</strong> 103
studies where groundwater evapotranspiration<br />
has been estimated through field<br />
measurements have generally found that<br />
groundwater evapotranspiration rates<br />
range between 30 percent and 50 percent<br />
<strong>of</strong> potential evapotranspiration. Generally<br />
speaking, maximum groundwater<br />
evapotranspiration rates could vary<br />
from 19 to 66 inches per year (Scanlon<br />
and o<strong>the</strong>rs, 2005). Unfortunately, <strong>the</strong>re<br />
is a lack <strong>of</strong> riparian evapotranspiration<br />
measurements in <strong>Texas</strong>, leaving this discharge<br />
mechanism poorly constrained<br />
in regional groundwater availability<br />
modeling.<br />
In addition to mechanisms <strong>of</strong> natural<br />
discharge, post-development groundwater<br />
pumping is a key aquifer discharge<br />
mechanism. Pumping <strong>of</strong> <strong>the</strong> Queen City<br />
Aquifer has historically been focused in<br />
<strong>the</strong> nor<strong>the</strong>astern parts <strong>of</strong> <strong>the</strong> state in <strong>the</strong><br />
outcrop areas <strong>of</strong> <strong>the</strong> aquifer where water<br />
quality is <strong>the</strong> best. Earliest reports <strong>of</strong><br />
development <strong>of</strong> <strong>the</strong> aquifer in East <strong>Texas</strong><br />
date back to <strong>the</strong> mid- to late-1800s, and<br />
<strong>the</strong> first water level measurements were<br />
made in Cherokee, Henderson, Freestone,<br />
Leon, Nacogdoches, and Rusk<br />
counties in 1936. Early water levels are<br />
also available from <strong>the</strong> 1940s for portions<br />
<strong>of</strong> Cass, Harrison, Upshur, and Wood<br />
counties. Pumpage from <strong>the</strong> Sparta Aquifer<br />
began in <strong>the</strong> late 1800s and <strong>the</strong> early<br />
1900s across <strong>the</strong> state. The first recorded<br />
water level measurement available on<br />
<strong>the</strong> TWDB Web site was taken in 1900<br />
in Fayette County. Significant numbers<br />
<strong>of</strong> water level measurements are not<br />
available until about 1936. In general,<br />
groundwater from <strong>the</strong> Sparta Aquifer is<br />
used predominantly for domestic and<br />
stock purposes, with two exceptions. The<br />
Sparta Aquifer has been used as a primary<br />
source <strong>of</strong> groundwater in Houston<br />
and Brazos counties. In Brazos County,<br />
wells tapping <strong>the</strong> Queen City and Sparta<br />
sands have provided groundwater for <strong>the</strong><br />
city <strong>of</strong> Bryan since 1915 and for <strong>Texas</strong><br />
A&M University and <strong>the</strong> city <strong>of</strong> College<br />
Station since 1951.<br />
The most current estimates <strong>of</strong><br />
pumping for <strong>the</strong> Queen City and Sparta<br />
aquifers are available on <strong>the</strong> TWDB<br />
Historical Water Use Web site for <strong>the</strong><br />
year 2003. Table 5-5 provides a summary<br />
<strong>of</strong> <strong>the</strong> groundwater use by water<br />
user group for 2003. Kelley and o<strong>the</strong>rs<br />
(2004) reported historical pumping<br />
through 1999 and projected pumping<br />
through 2050 for <strong>the</strong>se aquifers. At that<br />
time projected pumping was expected to<br />
triple for <strong>the</strong> Sparta and double for <strong>the</strong><br />
Queen City by 2050.<br />
Comparing pumping volumes to aquifer<br />
recharge estimates (and by extension<br />
natural discharge estimates) reveals that<br />
pumping is a relatively small percent <strong>of</strong><br />
recharge even if one considers <strong>the</strong> lower<br />
recharge estimates (Table 5-2).<br />
5.7<br />
Water Quality<br />
Water quality <strong>of</strong> <strong>the</strong> Queen City and<br />
Sparta aquifers has been described by<br />
many county assessments <strong>of</strong> groundwater<br />
resources. In Kelley and o<strong>the</strong>rs<br />
(2004), Dr. Alan Dutton (now with<br />
<strong>the</strong> University <strong>of</strong> <strong>Texas</strong>, San Antonio)<br />
evaluated both hydrochemical facies<br />
and total dissolved solids <strong>of</strong> groundwater<br />
in <strong>the</strong>se aquifers across <strong>the</strong> entire<br />
state. This section will review his maps<br />
<strong>of</strong> total dissolved solids and some <strong>of</strong> <strong>the</strong><br />
relevant conclusions from his work.<br />
Table 5-5. <strong>Report</strong>ed water use in acre-feet per year for 2003.<br />
Aquifer Municipal Manufacturing<br />
Queen<br />
City<br />
Steamelectric<br />
Irrigation Mining Livestock Total<br />
7,844 0 0 901 1,741 5,527 16,013<br />
Sparta 3,995 2,944 0 1,142 58 1,803 9,942<br />
Source: TWDB Historical Water Use Web site, www.twdb.state.tx.us/wrpi/wus/summary.htm<br />
104 <strong>Texas</strong> Water Development Board <strong>Report</strong> <strong>374</strong>
Total dissolved<br />
solids (milligrams<br />
per liter)<br />
!(<br />
!(<br />
!(<br />
10–50<br />
!( !(<br />
!(<br />
!(<br />
!( !(<br />
50–100<br />
!(!( !(<br />
!(<br />
!(<br />
!( !(<br />
100–500<br />
!( !(<br />
!( !( !(!(!(<br />
500–1,000<br />
!(<br />
!( !(<br />
1,000–5,000<br />
!( !( !(<br />
!( !(<br />
5,000–10,000<br />
!( !(!(!( !( !( !( !( !( !(!( !( !(<br />
10,000–50,000<br />
!(<br />
!(<br />
50,000–100,000<br />
!( !(!(<br />
!( !(<br />
>100,000<br />
!( !( !(!( !(<br />
!(<br />
!( !(!(<br />
!( !(!( !( !(!(!(!(<br />
!(!(!(<br />
!( !(<br />
!( !(<br />
!(<br />
!( !( !(<br />
!( !(<br />
!( !( !(<br />
!(<br />
!( !(!( !(!( !(!( !(<br />
!(<br />
!(!(!( !( !(!(<br />
!(!( !(!(!(!( !(<br />
!( !(!( !(!(!( !( !(!(!(!( !(!( !(!(!(!(!(!(!(!(!(!(!(<br />
!(<br />
!(<br />
!(<br />
!(!(<br />
!(!(<br />
!(!(<br />
!( !( !(<br />
!( !(<br />
!( !( !(<br />
!( !(!(!(!(!(!(!(!(!(!(!(!(!(!(!(!(!(!(!(!(!(!(!(!(!(!(!(!(!(<br />
!(!(!(!(!(!(!(!(!(!(!(!(!(!(!(!(!(<br />
!(!(!(!( !(!( !(<br />
!( !(!(!(<br />
!(!( !(!(<br />
!(<br />
!( !(!(<br />
!( !( !(!(<br />
!(<br />
!(!(<br />
!(!( !(!(!(<br />
!(!(!( !(!(<br />
!(!(!( !(!(<br />
!(!(<br />
!(<br />
!( !(!(!(!( !(!(<br />
!(!(!( !(!( !( !( !( !(!(!(!(!(!(!(!(<br />
!( !( !( !(!(!(<br />
!( !(<br />
!(!(!( !(<br />
!( !( !( !( !( !(<br />
!( !( !( !(<br />
!(<br />
!(<br />
!( !(<br />
!(<br />
Queen City Aquifer boundary<br />
!(<br />
County/Parish boundaries<br />
!(!(<br />
!(<br />
!(<br />
!(<br />
!(<br />
!(<br />
!( Oilfield sample location<br />
!( Water well sample location<br />
0 90 180<br />
Figure 5-10. Map <strong>of</strong> total dissolved solids in <strong>the</strong> Queen City Aquifer and equivalent downdip section in <strong>Texas</strong>.<br />
Miles<br />
Water quality data were compiled<br />
from water supply wells taken from<br />
TWDB Internet files and were augmented<br />
with data from <strong>the</strong> U.S. Geological<br />
Survey Internet files on chemical<br />
composition <strong>of</strong> co-produced formation<br />
waters from oil or gas wells in <strong>the</strong> downdip<br />
section <strong>of</strong> <strong>the</strong> Claiborne Group. Figures<br />
5-10 and 5-11 plot <strong>the</strong> total dissolved<br />
solids trends for both <strong>the</strong> Queen City<br />
and <strong>the</strong> Sparta aquifers, respectively.<br />
The aquifers were found to have similar<br />
chemical compositions, similar regional<br />
trends in water quality, and very similar<br />
average total dissolved solids values (516<br />
milligrams per liter in <strong>the</strong> Queen City and<br />
610 milligrams per liter in <strong>the</strong> Sparta).<br />
The groundwater total dissolved solids<br />
were generally higher in <strong>the</strong> confined<br />
portions <strong>of</strong> <strong>the</strong> aquifers as compared to<br />
<strong>the</strong> unconfined portions <strong>of</strong> <strong>the</strong> aquifer,<br />
and in general, total dissolved solids were<br />
greater in <strong>the</strong> sou<strong>the</strong>rn portions <strong>of</strong> <strong>the</strong><br />
aquifer than in <strong>the</strong> central and nor<strong>the</strong>rn<br />
portions. In <strong>the</strong> Queen City Aquifer, this<br />
trend is at least in part driven by <strong>the</strong> large<br />
amount <strong>of</strong> outcrop in <strong>the</strong> nor<strong>the</strong>astern<br />
half <strong>of</strong> <strong>the</strong> state.<br />
Differences in average total dissolved<br />
solids and <strong>the</strong> proportion <strong>of</strong><br />
<strong>Texas</strong> Water Development Board <strong>Report</strong> <strong>374</strong> 105
!(<br />
!(!(!(<br />
!(!( !(<br />
!(!(!(<br />
!(<br />
!( !(<br />
!(<br />
!(!( !(!(!(!(<br />
!( !( !(!( !(<br />
!(<br />
!(!(!(!(!( !(!(!(<br />
!(!(!(!(!(<br />
!( !( !( !(<br />
!(<br />
!( !(<br />
!(!(!(!(!(<br />
!(<br />
!( !(!(!(!( !(<br />
!(!( !(<br />
!( !(<br />
!(<br />
!(!(!(<br />
!(!(!( !(<br />
!(<br />
!(!(!(!(!(<br />
!(<br />
!(<br />
!(<br />
!(<br />
!(<br />
!(<br />
!(<br />
!(<br />
!(!( !( !( !( !(!(!(!(<br />
!(<br />
!( !(<br />
!( !(<br />
!(<br />
!( !(<br />
Total dissolved<br />
solids (milligrams<br />
per liter)<br />
10–50<br />
!(<br />
50–100<br />
100–500<br />
500–1,000<br />
1,000–5,000<br />
5,000–10,000<br />
10,000–50,000<br />
50,000–100,000<br />
>100,000<br />
!( !(<br />
!( !( !(!(<br />
!( !(<br />
!( !(!(<br />
!(!(<br />
!(!(!(!(<br />
!( !(!( !(!(<br />
!( !(!( !(!(!(<br />
!( !(!( !(!( !(!( !(!( !(!(!(!(<br />
!( !(<br />
!(!( !(!(!( !(!(!(<br />
!( !(!( !( !( !( !(!( !( !(!(<br />
!( !(!( !( !(!( !(<br />
!(!(!(!( !(!(<br />
!(!(<br />
!(<br />
!( !( !(<br />
!(!(!( !(<br />
!(<br />
!(<br />
!(!(!(!( !(!( !( !(<br />
!( !(!( !(!( !( !(<br />
!( !( !( !( !(!(!( !(!( !(!(<br />
!( !( !( !(!( !(<br />
!( !( !(<br />
!(!(<br />
!( !(<br />
!( !(<br />
!(<br />
!(!( !( !( !(<br />
!( !(!(!( !(!(!(<br />
!( !( !(!(!(<br />
!(!(!( !(!( !( !(<br />
!( !( !(<br />
!(<br />
!(!( !(!( !(!(<br />
!(!(!(!(!(!( !(!( !(!(!(!(!(!(!(!( !( !( !(<br />
!(<br />
!(!(<br />
!(<br />
!(<br />
!(!(!(!( !( !(!( !(!( !(!(!(!(!(!(!(!(!(!(!(<br />
!(!(<br />
!( !(!(<br />
!(<br />
!(!(!( !(!(!(!(!( !(!(!( !(<br />
!(!(<br />
!(<br />
!(<br />
!( !(!(<br />
!(<br />
!(!(!(!(!( !(!(<br />
!( !(!(!(!(!(!(!(!(!(!(!(!(!(!(!(!(!(!(!(!(!(!(!(!(!(!(!(!(!(<br />
!(<br />
!(<br />
!(!(!(!(!(!(!(!(!(!(!(!(!(!(!(!(!(<br />
!( !(<br />
!(!(!( !(!(<br />
!(!(!(!(<br />
!(<br />
!(!( !(<br />
!(!(<br />
!(!(<br />
!(!( !(<br />
!( !(!(!(!(!(!(!(<br />
!(!( !(!(!(!(<br />
!(!(<br />
!(<br />
!(!( !(<br />
!(<br />
!(!(!(!(!(<br />
!( !( !( !(!(!(<br />
!(!( !(<br />
!(!(!(!(!(!(!(!(<br />
!(<br />
!(!(!(<br />
Sparta Aquifer boundary<br />
County/Parish boundaries<br />
!( Oilfield sample location<br />
!( Water well sample locations<br />
0 90 180<br />
Figure 5-11. Map <strong>of</strong> total dissolved solids in <strong>the</strong> Sparta Aquifer and equivalent downdip section in <strong>Texas</strong>.<br />
Miles<br />
hydrochemical facies in <strong>the</strong> sou<strong>the</strong>rn<br />
versus nor<strong>the</strong>rn parts <strong>of</strong> <strong>the</strong> Queen City<br />
and Sparta aquifers have implications for<br />
<strong>the</strong> conceptual model <strong>of</strong> <strong>the</strong> movement<br />
<strong>of</strong> groundwater and recharge. Domenico<br />
and Robbins (1985) found that recharge<br />
rate, breadth <strong>of</strong> <strong>the</strong> recharge area, and<br />
aquifer transmissivity control <strong>the</strong> displacement<br />
<strong>of</strong> <strong>the</strong> connate water and<br />
<strong>the</strong> subsequent replacement with fresh<br />
water. The downdip increase in total<br />
dissolved solids along with sodium and<br />
chloride concentrations in both aquifers<br />
might reflect less displacement by<br />
meteoric water <strong>of</strong> connate water. The<br />
downdip extent <strong>of</strong> connate water displacement<br />
appears to be greater in <strong>the</strong><br />
nor<strong>the</strong>rn than in <strong>the</strong> sou<strong>the</strong>rn parts <strong>of</strong><br />
<strong>the</strong> aquifers. In <strong>the</strong> north, <strong>the</strong> Queen<br />
City Aquifer is shallow and unconfined<br />
across much <strong>of</strong> <strong>the</strong> East <strong>Texas</strong> Basin,<br />
which explains <strong>the</strong> observed lower total<br />
dissolved solids concentrations. Lower<br />
recharge rates, lower transmissivity, or<br />
both could account for less displacement<br />
<strong>of</strong> saline water and higher average total<br />
dissolved solids in <strong>the</strong> south than in <strong>the</strong><br />
north. Depositional environments within<br />
<strong>the</strong> aquifers can be <strong>the</strong> factor controlling<br />
connectivity <strong>of</strong> sands from <strong>the</strong> outcrop<br />
106 <strong>Texas</strong> Water Development Board <strong>Report</strong> <strong>374</strong>
areas to <strong>the</strong> deeper portions <strong>of</strong> <strong>the</strong> aquifer,<br />
<strong>the</strong>reby influencing displacement. Payne<br />
(1968) observed that in <strong>the</strong> south-central<br />
portions <strong>of</strong> <strong>the</strong> Sparta Aquifer in <strong>Texas</strong>,<br />
<strong>the</strong> distance to bad water is very close<br />
to <strong>the</strong> downdip extent <strong>of</strong> <strong>the</strong> outcrop as<br />
a result <strong>of</strong> limited downdip sand thickness<br />
due to <strong>the</strong> stand-plain depositional<br />
environment that tends to produce sand<br />
trends parallel to strike.<br />
5.8<br />
Impacts <strong>of</strong> aquifer<br />
development with an<br />
emphasis on aquifer<br />
discharge<br />
The preceding discussion has focused on<br />
<strong>the</strong> general hydrogeology and groundwater<br />
flow within <strong>the</strong> Queen City and Sparta<br />
aquifers. Some discussion has focused<br />
on historical changes in water levels<br />
and vertical gradients that have resulted<br />
from groundwater pumping. In this section,<br />
we will focus on a more quantitative<br />
discussion with <strong>the</strong> aid <strong>of</strong> <strong>the</strong> results<br />
<strong>of</strong> <strong>the</strong> Queen City and Sparta groundwater<br />
availability models. This section<br />
will review <strong>the</strong> steady-state groundwater<br />
flow balances for <strong>the</strong>se two aquifers on a<br />
regional basis.<br />
In a natural aquifer system unaffected<br />
by pumping, <strong>the</strong> aquifer system is in a<br />
long-term dynamic equilibrium condition<br />
generally referred to as a steady-state<br />
condition (or predevelopment). In this<br />
predevelopment state, aquifer recharge<br />
is balanced by aquifer discharge resulting<br />
in no net change in groundwater storage.<br />
Recharge may include areal recharge<br />
from precipitation, cross-formational flow<br />
from adjacent water-bearing formations,<br />
and stream losses. Discharge may include<br />
stream base flow, springflow, evapotranspiration,<br />
and cross-formational flow.<br />
Human activities alter <strong>the</strong> dynamic equilibrium<br />
<strong>of</strong> <strong>the</strong> predevelopment flow system<br />
through pumping withdrawals, changes in<br />
recharge through development and irrigation,<br />
and changes in vegetation and land<br />
use. Generally, groundwater withdrawals<br />
due to pumping have <strong>the</strong> most significant<br />
impact on aquifer hydraulics. The water<br />
removed by pumping is supplied through<br />
some combination <strong>of</strong> decreased groundwater<br />
storage, reduced groundwater<br />
discharge, and increased recharge. If<br />
pumping remains relatively constant and<br />
natural discharge can decrease and/or<br />
recharge can increase, a new steady-state<br />
condition will be established. In this new<br />
post-development equilibrium, <strong>the</strong> source<br />
<strong>of</strong> <strong>the</strong> pumped water will be drawn from<br />
some combination <strong>of</strong> reduced discharge<br />
or increased recharge, again <strong>the</strong> latter <strong>of</strong><br />
which is usually negligible. Bredehoeft<br />
(2002) terms <strong>the</strong>se two volumes as capture.<br />
The sources <strong>of</strong> discharge, which are<br />
ultimately captured by pumping, include<br />
stream base flow, springflow, evapotranspiration,<br />
and cross-formational flow.<br />
Bredehoeft (2002) defined sustainable<br />
yield (physically sustainable pumpage) as<br />
being equal to <strong>the</strong> rate <strong>of</strong> capture. In <strong>the</strong><br />
situation <strong>of</strong> sustainable aquifer dynamics,<br />
<strong>the</strong> pumping rates in <strong>the</strong> basin are being<br />
matched by <strong>the</strong> capture in discharge with<br />
a net result <strong>of</strong> water levels becoming stable<br />
(albeit at a lower level than prior to development).<br />
It is important to note that a sustainable<br />
yield may not be a desirable future<br />
state <strong>of</strong> an aquifer and, <strong>the</strong>refore, may not<br />
represent an optimal yield. For example, a<br />
sustained yield could result in decreased<br />
discharge to streams (streamflow capture)<br />
that would prove to be undesirable. If a<br />
basin is continually pumped at a rate that<br />
is greater than <strong>the</strong> basin’s discharge rate<br />
(potential capture), <strong>the</strong>n water levels will<br />
continually decline and natural discharge<br />
will diminish. This condition was referred<br />
to as an unstable basin by Freeze (1969)<br />
and is inherently unstable.<br />
Pumping from <strong>the</strong> Queen City and<br />
Sparta aquifers to date has been relatively<br />
low, as evidenced by relatively stable<br />
groundwater levels over time. Large<br />
portions <strong>of</strong> <strong>the</strong> Queen City and Sparta<br />
aquifers are minimally impacted by pumping<br />
relative to predevelopment. However,<br />
some portions <strong>of</strong> <strong>the</strong>se aquifers have experienced<br />
significant drawdown. In <strong>the</strong>se<br />
regions, stream base flow, springflow,<br />
<strong>Texas</strong> Water Development Board <strong>Report</strong> <strong>374</strong> 107
evapotranspiration, and cross-formational<br />
flow are expected to have been, or<br />
will be, decreased (pumping capture).<br />
A review <strong>of</strong> <strong>the</strong> steady-state water<br />
balance <strong>of</strong> <strong>the</strong> Queen City and Sparta<br />
aquifers taken from <strong>the</strong> groundwater<br />
availability model (Kelley and o<strong>the</strong>rs,<br />
2004) provides a quantitative tool for<br />
examining <strong>the</strong> issues <strong>of</strong> aquifer discharge<br />
(potential aquifer pumping capture)<br />
and <strong>the</strong> issue <strong>of</strong> sustainable yield<br />
(from an aquifer perspective). Table 5-6<br />
Table 5-6. Steady-state flow balance—Queen City and Sparta groundwater availability models.<br />
Region<br />
Recharge<br />
Total<br />
outflow<br />
Streams/<br />
Springs<br />
Volume <strong>of</strong> flow (acre-feet per year)<br />
Evapotranspiration<br />
<strong>Upper</strong><br />
boundary<br />
Lower<br />
boundary<br />
Lateral<br />
flow<br />
Total<br />
outflow<br />
Effective<br />
recharge<br />
Sparta - South 23,721 -63,979 -6,938 -3,472 -53,570 40,113 201 -63,979 -13,456 13,311<br />
Sparta - Central 49,461 -60,686 -21,411 -15,599 -23,676 10,917 20 -60,686 -12,759 12,451<br />
Sparta - North 123,260 -123,266 -46,472 -55,721 -1,706 -19,068 -299 -123,266 -20,774 21,067<br />
Queen City -<br />
South<br />
Queen City -<br />
Central<br />
Queen City -<br />
North<br />
Total 196,442 -247,931 -74,822 -74,791 -78,951 31,962 -78 -247,931 -46,989 46,829<br />
66,590 -109,826 -65,236 -7,271 -37,319 42,283 1,022 -109,826 4,964 -5,916<br />
49,278 -59,980 -31,772 -19,255 -8,857 10,163 -96 -59,980 1,306 -1,749<br />
248,653 -269,690 -121,206 -143,841 21,037 -3,983 -660 -269,690 17,054 -16,394<br />
Total 364,522 -439,496 -218,213 -170,367 -25,139 48,463 267 -439,496 23,323 -24,058<br />
Region<br />
Recharge<br />
Total<br />
outflow<br />
Streams/<br />
Springs<br />
Percent <strong>of</strong> total outflow Percent <strong>of</strong> recharge<br />
Net crossformation<br />
Evapotranspiration<br />
<strong>Upper</strong><br />
boundary<br />
Lower<br />
boundary<br />
Lateral<br />
flow<br />
Total<br />
outflow<br />
Net crossformation<br />
Effective<br />
recharge<br />
Sparta - South 37.1 -100.0 -10.8 -5.4 -83.7 62.7 0.3 -269.7 -56.7 56.1<br />
Sparta - Central 81.5 -100.0 -35.3 -25.7 -39.0 18.0 0.0 -122.7 -25.8 25.2<br />
Sparta - North 100.0 -100.0 -37.7 -45.2 -1.4 -15.5 -0.2 -100.0 -16.9 17.1<br />
Queen City -<br />
South<br />
Queen City -<br />
Central<br />
Queen City -<br />
North<br />
Average 72.9 -27.9 -25.4 -41.4 21.7 0.0 -164.1 -33.1 32.8<br />
60.6 -100.0 -59.4 -6.6 -34.0 38.5 0.9 -164.9 7.5 -8.9<br />
82.2 -100.0 -53.0 -32.1 -14.8 16.9 -0.2 -121.7 2.7 -3.5<br />
92.2 -100.0 -44.9 -53.3 7.8 -1.5 -0.2 -108.5 6.9 -6.6<br />
Average 78.3 -52.4 -30.7 -13.6 18.0 0.2 -131.7 5.7 -6.3<br />
Note: positive numbers indicate inflows; negative numbers indicate outflows<br />
Source: After Kelley and o<strong>the</strong>rs, 2004<br />
108 <strong>Texas</strong> Water Development Board <strong>Report</strong> <strong>374</strong>
0 30 60<br />
Miles<br />
Region<br />
Nor<strong>the</strong>rn<br />
Central<br />
Sou<strong>the</strong>rn<br />
Model boundary<br />
State line<br />
Figure 5-12. Aquifer subregions referenced in <strong>the</strong> water balance calculations.<br />
summarizes <strong>the</strong> steady-state water balance<br />
for <strong>the</strong> Queen City and Sparta<br />
aquifers expressed in acre-feet per year<br />
and as a percent <strong>of</strong> total outflow from<br />
each aquifer or as a percent <strong>of</strong> outcrop<br />
recharge. Aquifer inflows are positive<br />
numbers and aquifer outflows are negative.<br />
The aquifers have been divided into<br />
a sou<strong>the</strong>rn, central, and nor<strong>the</strong>rn region<br />
for comparative purposes (see Figure<br />
5-12 for delineation <strong>of</strong> <strong>the</strong>se regions).<br />
Flow within <strong>the</strong> Weches confining unit<br />
between <strong>the</strong> Sparta and <strong>the</strong> Queen City<br />
aquifers is considered vertical and is not<br />
included in Table 5-6. Recall that <strong>the</strong>se<br />
are steady-state flow terms; <strong>the</strong>refore,<br />
<strong>the</strong>re is no change in storage and aquifer<br />
inflows and outflows are balanced.<br />
To look at <strong>the</strong> regional sustainability<br />
<strong>of</strong> <strong>the</strong> aquifer systems, one can first look<br />
at total aquifer outflow, which <strong>the</strong>oretically<br />
equates to <strong>the</strong> available pumping<br />
capture existing for each aquifer. This<br />
represents a <strong>the</strong>oretical maximum development<br />
for <strong>the</strong> aquifer, which in reality is<br />
never achievable because local pumping<br />
<strong>Texas</strong> Water Development Board <strong>Report</strong> <strong>374</strong> 109
may be focused to <strong>the</strong> degree that it cannot<br />
capture adequate volumes in a time<br />
frame commensurate with <strong>the</strong> pumping<br />
duration. This condition is seen in select<br />
areas <strong>of</strong> <strong>the</strong>se aquifers.<br />
For both aquifers in all three regions,<br />
except <strong>the</strong> nor<strong>the</strong>rn Sparta region, <strong>the</strong>re<br />
is more aquifer outflow from <strong>the</strong> aquifer<br />
than <strong>the</strong> amount <strong>of</strong> recharge occurring<br />
within <strong>the</strong> outcrop. This is <strong>the</strong> result <strong>of</strong><br />
cross-formational flow. For example, <strong>the</strong><br />
Sparta south outcrop recharge is approximately<br />
23,721 acre-feet per year, but <strong>the</strong><br />
aquifer received an additional 40,113 acrefeet<br />
per year <strong>of</strong> inflow along its lower<br />
boundary, dominantly in <strong>the</strong> aquifer subcrop.<br />
The net cross-formational flow from<br />
<strong>the</strong> aquifer (lower boundary minus upper<br />
boundary flows) is approximately -13,456<br />
acre-feet per year, which is approximately<br />
equal to <strong>the</strong> aquifer downdip flow from<br />
<strong>the</strong> outcrop to <strong>the</strong> confined portion <strong>of</strong><br />
<strong>the</strong> aquifer (some refer to this as effective<br />
recharge). The sou<strong>the</strong>rn Sparta behaves<br />
like a classic coastal plain outcrop-confined<br />
aquifer system with some percent <strong>of</strong><br />
recharge discharging to streams, springs,<br />
and evapotranspiration and some moving<br />
to <strong>the</strong> confined section and exiting<br />
through cross-formational flow. A review<br />
<strong>of</strong> <strong>the</strong> effective recharge expressed as a<br />
percent <strong>of</strong> recharge for <strong>the</strong> Sparta Aquifer<br />
shows that <strong>the</strong> percent <strong>of</strong> recharge flowing<br />
downdip into <strong>the</strong> confined sections <strong>of</strong><br />
<strong>the</strong> aquifer decreases from south to north,<br />
whereas <strong>the</strong> volume increases. This is, in<br />
part, a product <strong>of</strong> <strong>the</strong> shallower water<br />
tables and perennial streams in nor<strong>the</strong>astern<br />
<strong>Texas</strong>, which act as large sinks to<br />
<strong>the</strong> increased recharge that occurs in <strong>the</strong><br />
more humid environment.<br />
In <strong>the</strong> Sparta, like <strong>the</strong> Queen City,<br />
total outflow from <strong>the</strong> aquifer is greater<br />
than outcrop recharge in all cases, indicating<br />
that cross-formational flow is<br />
important. However, in contrast to <strong>the</strong><br />
Sparta, <strong>the</strong> Queen City Aquifer outcrop<br />
regions are discharging more groundwater<br />
(to streams, springs, and evapotranspiration)<br />
than <strong>the</strong>y are receiving<br />
through recharge. This excess outcrop<br />
discharge in <strong>the</strong> nor<strong>the</strong>rn Queen City is<br />
<strong>the</strong> result <strong>of</strong> both flow from <strong>the</strong> overlying<br />
Sparta in Smith, Wood, and Upshur<br />
counties where <strong>the</strong> Sparta exists in outcrop<br />
and upward flow from <strong>the</strong> Carrizo<br />
Sand in river floodplains. Most <strong>of</strong> <strong>the</strong><br />
upper boundary flow into <strong>the</strong> Queen<br />
City is occurring in Smith County from<br />
<strong>the</strong> overlying Sparta.<br />
One <strong>of</strong> <strong>the</strong> many significant conclusions<br />
that must be drawn from this analysis<br />
is that cross-formational flow, though<br />
hard to conceptualize and effectively<br />
impossible to measure, is a significant<br />
source <strong>of</strong> flow for coastal plain aquifer<br />
systems. Therefore, when we model an<br />
aquitard underlying an aquifer as a n<strong>of</strong>low<br />
boundary, in many instances this<br />
must significantly affect model results.<br />
Secondly, it shows that <strong>the</strong> coastal plain<br />
aquifers are connected and that production<br />
from one aquifer may be supported<br />
by flow from ano<strong>the</strong>r aquifer.<br />
Ano<strong>the</strong>r important conclusion is that<br />
it is very important to properly characterize<br />
<strong>the</strong> major sources <strong>of</strong> aquifer<br />
discharge under predevelopment conditions<br />
because <strong>the</strong>y are <strong>the</strong> portions <strong>of</strong><br />
<strong>the</strong> aquifer flow balance eclipsed through<br />
development (pumping capture). Table<br />
5-7 summarizes <strong>the</strong> recharge and total<br />
discharge volumes for <strong>the</strong> Queen City<br />
and Sparta aquifers and also includes<br />
<strong>the</strong> components <strong>of</strong> aquifer discharge as<br />
a percent <strong>of</strong> <strong>the</strong> aquifer total discharge.<br />
This table highlights <strong>the</strong> importance <strong>of</strong><br />
each discharge mechanism, as currently<br />
modeled, for <strong>the</strong> aquifers. To accurately<br />
model <strong>the</strong> future state <strong>of</strong> an aquifer being<br />
developed, <strong>the</strong> natural discharge mechanisms<br />
must be accurately modeled in<br />
terms <strong>of</strong> location and volume.<br />
Stream and spring discharge is an<br />
important discharge mechanism, representing<br />
approximately 28 percent and<br />
52 percent <strong>of</strong> total aquifer discharge for<br />
<strong>the</strong> Sparta and Queen City <strong>Aquifers</strong>,<br />
respectively (Table 5-7). Groundwater<br />
evapotranspiration is modeled to be<br />
a significant discharge mechanism in<br />
<strong>the</strong> nor<strong>the</strong>rn Queen City Aquifer. This<br />
110 <strong>Texas</strong> Water Development Board <strong>Report</strong> <strong>374</strong>
would be expected because <strong>the</strong> Queen<br />
City exists in outcrop across <strong>the</strong> majority<br />
<strong>of</strong> <strong>the</strong> East <strong>Texas</strong> Basin where water<br />
tables are shallow because <strong>of</strong> significant<br />
rainfall. Cross-formational flow can only<br />
become a source <strong>of</strong> capture if <strong>the</strong>re is a<br />
net outflow. In <strong>the</strong> coastal plain under<br />
predevelopment conditions, this will<br />
result when outcrop recharge enters <strong>the</strong><br />
confined section <strong>of</strong> <strong>the</strong> aquifer and discharges<br />
through cross-formational flow.<br />
This condition is predicted to occur in<br />
<strong>the</strong> Sparta but generally not in <strong>the</strong> Queen<br />
City because <strong>the</strong> groundwater availability<br />
models predict that <strong>the</strong> Queen City<br />
outcrops discharge more groundwater<br />
than is recharging through precipitation.<br />
Cross-formational flow is occurring<br />
from <strong>the</strong> Carrizo to <strong>the</strong> Queen City<br />
within <strong>the</strong> Queen City outcrop. This<br />
is most pronounced in <strong>the</strong> nor<strong>the</strong>rn<br />
Queen City Aquifer where <strong>the</strong> Queen<br />
City outcrops across <strong>the</strong> majority <strong>of</strong> <strong>the</strong><br />
East <strong>Texas</strong> Basin, and, <strong>the</strong>refore, deeper<br />
aquifers must regionally discharge to<br />
major streams through <strong>the</strong> Queen City<br />
(see Fogg and Kreitler, 1982). Table 5-7<br />
shows that under predevelopment conditions,<br />
<strong>the</strong>re is little lateral flow across<br />
<strong>the</strong> boundaries chosen to divide <strong>the</strong> three<br />
aquifer regions. This, <strong>of</strong> course, could<br />
change significantly after development.<br />
A review <strong>of</strong> heads within <strong>the</strong> Carrizo,<br />
Queen City, and Sparta aquifers<br />
provides some physical evidence <strong>of</strong> <strong>the</strong><br />
cross-formational flow characteristics <strong>of</strong><br />
<strong>the</strong>se aquifers predicted by <strong>the</strong> groundwater<br />
availability models. As a result<br />
<strong>of</strong> pumping, vertical gradients within<br />
coastal plain layered aquifer systems<br />
such as <strong>the</strong> Carrizo-Wilcox, Queen City,<br />
and Sparta aquifers are altered from <strong>the</strong>ir<br />
predevelopment conditions. Figure 5-13<br />
shows <strong>the</strong> head difference, measured<br />
in feet, between <strong>the</strong> combined Queen<br />
City and Sparta Aquifer head and <strong>the</strong><br />
Carrizo-Wilcox Aquifer head. The head<br />
surfaces used to make this difference<br />
plot are representative <strong>of</strong> 1980 and were<br />
developed as part <strong>of</strong> <strong>the</strong> U.S. Geological<br />
Survey Regional Aquifer-System Analysis<br />
program (Garza and o<strong>the</strong>rs, 1987). A<br />
gray dot represents a location where <strong>the</strong><br />
vertical hydraulic head difference (gradient)<br />
is down from <strong>the</strong> Queen City and<br />
Sparta aquifers to <strong>the</strong> Carrizo-Wilcox<br />
Aquifer. A triangle represents a location<br />
where <strong>the</strong> vertical head difference (gradient)<br />
is upward from <strong>the</strong> Carrizo-Wilcox<br />
Aquifer to <strong>the</strong> Queen City and Sparta<br />
aquifers.<br />
In predevelopment, one would expect<br />
dominantly downward gradients in <strong>the</strong><br />
East <strong>Texas</strong> Basin and dominantly upward<br />
Table 5-7. Aquifer discharge under predevelopment conditions as predicted by <strong>the</strong> Queen City and Sparta groundwater<br />
availability models.<br />
Total<br />
Discharge flow component as a percent <strong>of</strong> total outflow<br />
Region<br />
Recharge<br />
(AFY)<br />
outflow<br />
(AFY)<br />
Stream/<br />
Springs<br />
Evapotranspiration<br />
Crossformational<br />
Lateral<br />
Sparta - South 23,721 -63,979 -10.8% -5.4% -83.7% 0.0%<br />
Sparta - Central 49,461 -60,686 -35.3% -25.7% -39.0% 0.0%<br />
Sparta - North 123,260 -123,266 -37.7% -45.2% -16.9% -0.2%<br />
Total/Average 196,442 -247,931 -27.9% -25.4% -46.5% 0.0%<br />
Queen City - South 66,590 -109,826 -59.4% -6.6% -34.0% 0.0%<br />
Queen City - Central 49,278 -59,980 -53.0% -32.1% -14.8% -0.2%<br />
Queen City - North 248,653 -269,690 -44.9% -53.3% -1.5% -0.2%<br />
Total/Average 364,522 -439,496 -52.4% -30.7% -16.7% -0.1%<br />
AFY = acre-feet per year<br />
<strong>Texas</strong> Water Development Board <strong>Report</strong> <strong>374</strong> 111
!(!(# ! !( !(<br />
!( !(!(<br />
! !(<br />
! !(<br />
!<br />
! !<br />
!<br />
! ! !<br />
! !<br />
! !!<br />
!(<br />
!<br />
!(<br />
!(<br />
! !(<br />
!(<br />
!( !( !(<br />
#<br />
#<br />
##<br />
!(<br />
!(<br />
# !(<br />
#<br />
!(<br />
Head difference <strong>of</strong><br />
Carrizo-Wilcox &<br />
Queen City-Sparta<br />
aquifers (feet)<br />
# -100–50<br />
# -49–0<br />
(!<br />
!<br />
!<br />
!<br />
!<br />
!<br />
!<br />
!<br />
!(<br />
!( !(<br />
1–50<br />
51–100<br />
101–150<br />
151–200<br />
201–250<br />
251–300<br />
301–350<br />
351–400<br />
## #<br />
# # ## !(<br />
!(#<br />
# ##<br />
##<br />
!(<br />
## !( #<br />
## #<br />
# # # #<br />
##<br />
#<br />
!( #<br />
##<br />
! !( !<br />
!!<br />
!( ! !<br />
!! !( #<br />
!(!( ! !!!<br />
!<br />
!( !(<br />
!( !( !(<br />
#!(<br />
! # ! !<br />
! ! !!!<br />
!(!(!(<br />
!! ! !!<br />
!(<br />
!( !(<br />
!(<br />
!<br />
!<br />
! !(<br />
! !<br />
! !<br />
!( !( !( !!<br />
!( !<br />
!( !<br />
!(<br />
! !(<br />
!(<br />
!(<br />
!(<br />
!(<br />
!<br />
!!!! !<br />
!( ! !<br />
!( !!!<br />
!( !!(<br />
!(<br />
! !<br />
!<br />
!<br />
!(<br />
!(<br />
!(<br />
!<br />
!( !! ! !!<br />
!<br />
!<br />
!<br />
!(<br />
! !<br />
!<br />
!<br />
! !( ! ! !(<br />
!! ! ! !(<br />
!!(<br />
! !<br />
!! ! !( !( !<br />
!! !<br />
!!!<br />
!<br />
!<br />
!!! !!!<br />
#!(<br />
! !(<br />
#!( !!! ! !(<br />
! !(<br />
!!(<br />
!(<br />
!(<br />
!( ! !(<br />
!(<br />
# # #<br />
!( !(<br />
! ! !(<br />
!( !(#<br />
!<br />
!!(<br />
!<br />
!<br />
!<br />
!<br />
! !(<br />
!( !( !(<br />
!(<br />
!(<br />
# !<br />
!( !( !(<br />
!(<br />
# !(<br />
## ## # !(<br />
Queen City Aquifer boundary<br />
County/Parish boundaries<br />
0 90 180<br />
Miles<br />
Figure 5-13. Vertical head differences between <strong>the</strong> Queen City and Sparta Aquifer system and <strong>the</strong> Carrizo-Wilcox<br />
Aquifer system in 1980 (after Garza and o<strong>the</strong>rs, 1987) (positive values indicate flow from <strong>the</strong> Queen City and Sparta<br />
aquifers to <strong>the</strong> Carrizo-Wilcox Aquifer; negative values indicate flow from <strong>the</strong> Carrizo-Wilcox Aquifer to <strong>the</strong> Queen<br />
City and Sparta aquifers).<br />
gradients in areas where <strong>the</strong> aquifers are<br />
dipping into <strong>the</strong> Gulf Coast Basin. Figure<br />
5-13 is not representative <strong>of</strong> predevelopment<br />
conditions, as it represents heads<br />
in 1980. However, this figure shows that<br />
gradients tend to be downward in East<br />
<strong>Texas</strong>, which is consistent with <strong>the</strong> conceptual<br />
model and <strong>the</strong> fact that <strong>the</strong> Queen<br />
City and Sparta aquifers are unconfined<br />
in that region. It does appear that gradients<br />
are interpreted by Garza and o<strong>the</strong>rs<br />
(1987) to be upward in <strong>the</strong> Cypress<br />
Creek valley, which is consistent with <strong>the</strong><br />
groundwater availability model predictions<br />
<strong>of</strong> flow from <strong>the</strong> Carrizo-Wilcox<br />
across <strong>the</strong> Queen City to discharge to<br />
streams. Moving from East <strong>Texas</strong> to Central<br />
<strong>Texas</strong>, <strong>the</strong> gradients tend to become<br />
upward, consistent with an elevationdriven<br />
system. This trend is reversed in<br />
areas where <strong>the</strong> Carrizo-Wilcox Aquifer<br />
had been substantially developed by<br />
1980, with significant head declines. Such<br />
a case can be observed around Brazos<br />
112 <strong>Texas</strong> Water Development Board <strong>Report</strong> <strong>374</strong>
County where <strong>the</strong> Carrizo heads have<br />
been significantly lowered. This head<br />
reversal becomes dominant in <strong>the</strong> Winter<br />
Garden region where Carrizo-Wilcox<br />
heads have significantly decreased<br />
as a result <strong>of</strong> development. In this area,<br />
vertical gradients have been reversed<br />
from predevelopment times, with flow<br />
directions now being downward from<br />
<strong>the</strong> Queen City and Sparta aquifers (and<br />
facies equivalents) to <strong>the</strong> Carrizo-Wilcox<br />
Aquifer. This is a situation where natural<br />
vertical flow from <strong>the</strong> Carrizo to <strong>the</strong><br />
Queen City in <strong>the</strong> Winter Garden region<br />
has been reversed as a result <strong>of</strong> crossformational<br />
discharge capture caused by<br />
heavy pumping from <strong>the</strong> Carrizo in <strong>the</strong><br />
region. The head reversals between <strong>the</strong><br />
Queen City and <strong>the</strong> Carrizo also affect<br />
groundwater flow within <strong>the</strong> Queen City<br />
and Sparta, impacting natural crossformational<br />
flow within those aquifers.<br />
In <strong>the</strong> long term, development <strong>of</strong> <strong>the</strong><br />
Carrizo-Wilcox Aquifer and <strong>the</strong> Queen<br />
City and Sparta aquifers is coupled by<br />
capture hydraulics, which can only be<br />
quantified by predictive models.<br />
5.9<br />
Summary<br />
The Queen City and Sparta aquifers are<br />
coastal plain aquifers that are classified<br />
as minor aquifers. These aquifers (and<br />
<strong>the</strong>ir facies equivalents) extend from<br />
<strong>the</strong> Rio Grande in South <strong>Texas</strong> to East<br />
<strong>Texas</strong>, with <strong>the</strong> Sparta Aquifer continuing<br />
into Louisiana and Arkansas. These<br />
aquifers provide sufficient productivity<br />
across <strong>the</strong>ir extent in <strong>Texas</strong> but development<br />
is sometimes limited by poor<br />
water quality.<br />
Natural groundwater flow within<br />
<strong>the</strong>se aquifers is from areas <strong>of</strong> recharge<br />
in <strong>the</strong> outcrops and downdip through<br />
cross-formational inflow to areas <strong>of</strong><br />
discharge through groundwater flow to<br />
streams and springs, groundwater evapotranspiration,<br />
and cross-formational outflow.<br />
Although impacts from pumping<br />
can be observed locally, water levels have<br />
remained relatively stable regionally,<br />
indicative <strong>of</strong> relatively low pumping.<br />
In areas impacted by pumping, it is<br />
expected that in addition to decreased<br />
water levels (storage decline), stream<br />
base flow, springflow, evapotranspiration,<br />
and cross-formational flow have<br />
been decreased, and cross-formational<br />
inflow has increased as a result <strong>of</strong> pumping<br />
capture.<br />
Through a review <strong>of</strong> <strong>the</strong> current<br />
Queen City and Sparta groundwater<br />
availability models, this chapter has<br />
shown that <strong>the</strong> dominant mechanisms<br />
<strong>of</strong> discharge within <strong>the</strong>se aquifers are<br />
stream and spring discharge and groundwater<br />
evapotranspiration. Cross-formational<br />
flow is also a significant aquifer<br />
outflow mechanism, which has been<br />
estimated through regional modeling.<br />
Because <strong>the</strong>se components <strong>of</strong> aquifer<br />
discharge are <strong>the</strong> aquifer flows that are<br />
most impacted by pumping, characterization<br />
<strong>of</strong> <strong>the</strong>m is important to ongoing<br />
management <strong>of</strong> <strong>the</strong> groundwater in<br />
<strong>the</strong>se areas. Understanding <strong>the</strong> current<br />
and future impacts to <strong>the</strong> Queen City<br />
and Sparta aquifers as well as <strong>the</strong> o<strong>the</strong>r<br />
<strong>Texas</strong> <strong>Coastal</strong> Plain aquifers will require<br />
a continuation <strong>of</strong> aquifer monitoring<br />
and characterization, stream-aquifer<br />
interaction studies, and recharge studies.<br />
In addition, evapotranspiration and<br />
groundwater evapotranspiration studies<br />
are warranted in areas where this<br />
discharge mechanism is considered<br />
important.<br />
Because <strong>of</strong> a lack <strong>of</strong> groundwater<br />
evapotranspiration measurements,<br />
uncertainty in this source <strong>of</strong> discharge<br />
could be <strong>the</strong> single greatest contributor<br />
to uncertainty in present and future predictions<br />
<strong>of</strong> sustainability <strong>of</strong> groundwater<br />
resources. Groundwater evapotranspiration<br />
is known to be a significant source <strong>of</strong><br />
groundwater discharge in riparian areas<br />
and represents a significant source <strong>of</strong><br />
pumping capture, especially in arid environments.<br />
However, groundwater evapotranspiration<br />
presents perhaps one <strong>of</strong>, if<br />
not <strong>the</strong> largest, hurdles for quantification,<br />
especially in humid environments where<br />
<strong>Texas</strong> Water Development Board <strong>Report</strong> <strong>374</strong> 113
surface evaporation and vadose-zone<br />
evapotranspiration can be significant.<br />
Managing <strong>Texas</strong> water resources<br />
will require a focus on understanding<br />
<strong>the</strong> mechanisms and scales <strong>of</strong> aquifer<br />
discharge. Future characterization and<br />
modeling studies should be focused on<br />
conceptualization and characterization<br />
<strong>of</strong> <strong>the</strong> aquifer water balance. Groundwater<br />
models provide <strong>the</strong> only means <strong>of</strong><br />
integrating aquifer information and estimating<br />
<strong>the</strong> available discharge volumes<br />
and timing <strong>of</strong> discharge capture. From<br />
a review <strong>of</strong> <strong>the</strong> Queen City and Sparta<br />
aquifers and <strong>the</strong> associated groundwater<br />
availability models, we can see <strong>the</strong><br />
importance <strong>of</strong> discharge as it relates<br />
to pumping capture and how many <strong>of</strong><br />
our aquifer systems are regionally interrelated<br />
over <strong>the</strong> long term.<br />
5.10<br />
Acknowledgments<br />
Much <strong>of</strong> this paper is taken from <strong>the</strong><br />
report documenting <strong>the</strong> Queen City<br />
and Sparta aquifer groundwater availability<br />
models. As such, we would like<br />
to acknowledge our co-authors on that<br />
study: Jean-Philippe Nicot and Seay<br />
Nance <strong>of</strong> <strong>the</strong> Bureau <strong>of</strong> Economic Geology<br />
and Alan Dutton currently at <strong>the</strong><br />
University <strong>of</strong> <strong>Texas</strong> in San Antonio. We<br />
would also like to thank <strong>the</strong> <strong>Texas</strong> Water<br />
Development Board for funding much<br />
<strong>of</strong> <strong>the</strong> research provided herein.<br />
5.11<br />
References<br />
Ashworth, J.B., and Hopkins, J., 1995, <strong>Aquifers</strong> <strong>of</strong> <strong>Texas</strong>: <strong>Texas</strong> Water Development<br />
Board <strong>Report</strong> 345 [variously paged].<br />
Ayers, W.B., Jr., and Lewis, A.H., 1985, The Wilcox Group and Carrizo Sand (Paleogene)<br />
in east-central <strong>Texas</strong>—Depositional systems and deep-basin lignite: University <strong>of</strong><br />
<strong>Texas</strong> at Austin, Bureau <strong>of</strong> Economic Geology Special Publication, 19 p., 30 pls.<br />
Bredehoeft, J.D., 2002, The water budget myth revisited—Why hydrogeologists model:<br />
Ground Water, v. 40, no. 4, p. 340–345.<br />
Brune, G., 1975, Major and historical springs <strong>of</strong> <strong>Texas</strong>: <strong>Texas</strong> Water Development Board<br />
<strong>Report</strong> No. 189, 566 p.<br />
Brune, G., 1981, Springs <strong>of</strong> <strong>Texas</strong>, Volume I: Branch-Smith, Inc.<br />
Domenico, P.A., and Robbins, G.A., 1985, The displacement <strong>of</strong> connate water from<br />
aquifers: Geological Society <strong>of</strong> America Bulletin, v. 96, no. 3, p. 328–335.<br />
Fogg, G.E., and Kreitler, C.W., 1982, Ground-water hydraulics and hydrochemical facies<br />
in Eocene aquifers <strong>of</strong> <strong>the</strong> East <strong>Texas</strong> Basin: University <strong>of</strong> <strong>Texas</strong> at Austin, Bureau <strong>of</strong><br />
Economic Geology <strong>Report</strong> <strong>of</strong> Investigations No. 127, 75 p.<br />
Fogg, G.E., Kaiser, W.R., and Ambrose, M.L., 1991, The Wilcox Group and Carrizo<br />
Sand (Paleogene) in <strong>the</strong> Sabine Uplift area, <strong>Texas</strong>—Ground-Water hydraulics and<br />
hydrochemistry: University <strong>of</strong> <strong>Texas</strong> at Austin, Bureau <strong>of</strong> Economic Geology Special<br />
publication 70 p.<br />
114 <strong>Texas</strong> Water Development Board <strong>Report</strong> <strong>374</strong>
Freeze, R.A., 1969, The mechanism <strong>of</strong> natural ground-water recharge and discharge—<br />
One-dimensional, vertical, unsteady, unsaturated flow above a recharging or discharging<br />
ground-water flow system: Water Resources Research, v. 5, no. 1, p. 153–171.<br />
Galloway, W.E., Liu, X., Travis-Neuberger, D., and Xue, L., 1994, References high-resolution<br />
correlation cross sections, Paleogene section, <strong>Texas</strong> <strong>Coastal</strong> Plain: University<br />
<strong>of</strong> <strong>Texas</strong> at Austin, Bureau <strong>of</strong> Economic Geology.<br />
Galloway, W.E., Ganey-Curry, P.E., Li, X., and Buffler, R.T., 2000, Cenozoic depositional<br />
history <strong>of</strong> <strong>the</strong> Gulf <strong>of</strong> Mexico Basin: American Association <strong>of</strong> Petroleum Geologists<br />
Bulletin, v. 84, no. 11, p. 1743–1774.<br />
Garcia, R., 1972, Depositional Systems in <strong>the</strong> Queen City Formation (Eocene), Central<br />
and South <strong>Texas</strong>: Austin, Tex., University <strong>of</strong> <strong>Texas</strong> at Austin, Master’s <strong>the</strong>sis, 100<br />
p.<br />
Garza, S., Jones, B.D., Baker, Jr., E.T., 1987, Approximate potentiometric surfaces for<br />
<strong>the</strong> <strong>Texas</strong> <strong>Coastal</strong> Uplands System, 1980: U.S. Geological Survey Hydrologic Investigations<br />
Atlas HA-704.<br />
Grubb, H.F., 1997, Summary <strong>of</strong> hydrology <strong>of</strong> <strong>the</strong> regional aquifer systems, Gulf <strong>Coastal</strong><br />
Plain, south-central United States: U.S. Geological Survey Pr<strong>of</strong>essional Paper 1416-<br />
A.<br />
Guevara, E.H., 1972, Depositional Systems in <strong>the</strong> Queen City Formation (Eocene), Central<br />
and East <strong>Texas</strong>: Austin, Tex., University <strong>of</strong> <strong>Texas</strong> at Austin, Master’s <strong>the</strong>sis, 71 p.<br />
Guevara, E.H., and Garcia, R., 1972, Depositional systems and oil-gas reservoirs in<br />
<strong>the</strong> Queen City Formation (Eocene), <strong>Texas</strong>: Gulf Coast Association <strong>of</strong> Geological<br />
Societies Transactions, Volume 22.<br />
Hamlin, S., 1988, Depositional and ground-water flow systems <strong>of</strong> <strong>the</strong> Carrizo-Wilcox,<br />
South <strong>Texas</strong>: University <strong>of</strong> <strong>Texas</strong> at Austin, Bureau <strong>of</strong> Economic Geology <strong>Report</strong> <strong>of</strong><br />
Investigations 173, 61 p.<br />
Jackson, M.P.A., 1982, Fault tectonics <strong>of</strong> <strong>the</strong> East <strong>Texas</strong> Basin: University <strong>of</strong> <strong>Texas</strong><br />
at Austin, Bureau <strong>of</strong> Economic Geology Geological Circular 84-2, 31 p.<br />
Kaiser, W.R., 1978, Depositional systems in <strong>the</strong> Wilcox Group (Eocene) <strong>of</strong> east-central<br />
<strong>Texas</strong> and <strong>the</strong> occurrence <strong>of</strong> lignite, in Kaiser, W.R., ed., 1976 Gulf Coast Lignite<br />
Conference—Geology, Utilization, and Environmental Aspects, Proceedings: University<br />
<strong>of</strong> <strong>Texas</strong> at Austin, Bureau <strong>of</strong> Economic Geologic <strong>Report</strong> <strong>of</strong> Investigations,<br />
No. 90, p. 33–53.<br />
Kelley, V.A., Deeds, N.E., Fryar, D.G., and Nicot, J.-P., 2004, Groundwater availability<br />
models for <strong>the</strong> Queen City and Sparta aquifers: Prepared for <strong>the</strong> <strong>Texas</strong> Water<br />
Development Board.<br />
Larkin, T.J., and Bomar, G.W., 1983, Climatic atlas <strong>of</strong> <strong>Texas</strong>: Department <strong>of</strong> Water<br />
Resources, <strong>Report</strong> LP-192, 151 p.<br />
Mace, R.E., Smyth, R.C., Xu, L., and Liang, J., 2002, Transmissivity, hydraulic conductivity,<br />
and storativity <strong>of</strong> <strong>the</strong> Carrizo-Wilcox Aquifer in <strong>Texas</strong>: University <strong>of</strong> <strong>Texas</strong>, Bureau<br />
<strong>of</strong> Economic Geology: Prepared for <strong>the</strong> <strong>Texas</strong> Water Development Board, 76 p.<br />
Muller, D.A., and Price, R.D., 1979, Ground-water availability in <strong>Texas</strong>, estimates and<br />
projections through 2030: <strong>Texas</strong> Department <strong>of</strong> Water Resources <strong>Report</strong> No. 238,<br />
77 p.<br />
<strong>Texas</strong> Water Development Board <strong>Report</strong> <strong>374</strong> 115
Ockerman, D.J., and Slattery, R.N., 2008, Streamflow conditions in <strong>the</strong> Guadalupe River<br />
Basin, south central <strong>Texas</strong>, water years 1987–2006—An assessment <strong>of</strong> streamflow<br />
gains and losses and relative contribution <strong>of</strong> major springs to streamflow: U.S. Geological<br />
Survey Scientific Investigations <strong>Report</strong> 2008-5165, 21 p.<br />
Payne, J.N., 1968, Hydrologic significance <strong>of</strong> <strong>the</strong> lith<strong>of</strong>acies <strong>of</strong> <strong>the</strong> Sparta Sand in Arkansas,<br />
Louisiana, Mississippi, and <strong>Texas</strong>: U.S. Geological Survey Pr<strong>of</strong>essional Paper 569‐A,<br />
17 p., 10 plates.<br />
Prudic, D.E., 1991, Estimates <strong>of</strong> hydraulic conductivity from aquifer-test analyses and<br />
specific capacity data, Gulf Coast regional aquifer systems, south-central United<br />
States: U.S. Geological Survey Water-Resources Investigation <strong>Report</strong> 90-4121.<br />
Ricoy, J.U., 1976, Depositional Systems in <strong>the</strong> Sparta Formation (Eocene), Gulf Coast<br />
Basin <strong>of</strong> <strong>Texas</strong>: Austin, Tex., University <strong>of</strong> <strong>Texas</strong> at Austin, Master’s <strong>the</strong>sis, 98 p.<br />
Ricoy, J.U., and Brown, Jr., L.F., 1977, Depositional systems in <strong>the</strong> Sparta Formation<br />
(Eocene) Gulf Coast Basin <strong>of</strong> <strong>Texas</strong>: Gulf Coast Association <strong>of</strong> Geological Societies<br />
Transactions, v. 27, p. 139–154.<br />
Saunders, G.P., 2006, Low flow gain-loss tudy <strong>of</strong> <strong>the</strong> Colorado River in <strong>Texas</strong>, in Mace,<br />
R.E., and o<strong>the</strong>rs, eds., <strong>Aquifers</strong> <strong>of</strong> <strong>the</strong> Gulf Coast <strong>of</strong> <strong>Texas</strong>: <strong>Texas</strong> Water Development<br />
Board <strong>Report</strong> 365, pp. 293–297.<br />
Scanlon, B., Keese, K., Bonal, N., Deeds, N., Kelley V., and Litvak, M., 2005, Evapotranspiration<br />
rates with emphasis on groundwater evapotranspiration in <strong>Texas</strong>: Prepared<br />
for <strong>the</strong> <strong>Texas</strong> Water Development Board, 123 p.<br />
Scanlon, B.R., Dutton, A., and Sophocleus, M., 2002, Groundwater recharge in <strong>Texas</strong>:<br />
University <strong>of</strong> <strong>Texas</strong> at Austin, Bureau <strong>of</strong> Economic Geology: Prepared for <strong>the</strong> <strong>Texas</strong><br />
Water Development Board.<br />
Slade, R.M., Jr., Bentley, J.T., and Michaud, D., 2002, Results <strong>of</strong> streamflow gain-loss<br />
studies in <strong>Texas</strong>, with emphasis on gains from and losses to major and minor aquifers,<br />
<strong>Texas</strong>, 2000: U.S. Geological Survey Open-File <strong>Report</strong> 02-068.<br />
TWDB (<strong>Texas</strong> Water Development Board), 2007, Water for <strong>Texas</strong>–Volume 2: <strong>Texas</strong><br />
Water Development Board, 392 p.<br />
Turco, M.J., East, J.W., and Milburn, M.S., 2007, Base flow (1966–2005) and streamflow<br />
gain and loss (2006) <strong>of</strong> <strong>the</strong> Brazos River, McLennan County to Fort Bend County,<br />
<strong>Texas</strong>: U.S. Geological Survey Scientific Investigations <strong>Report</strong> 2007-5286, 27 p.<br />
Wermund, E.G., 1996, Physiographic map <strong>of</strong> <strong>Texas</strong>: University <strong>of</strong> <strong>Texas</strong> at Austin, Bureau<br />
<strong>of</strong> Economic Geology, 1 pl.<br />
Wilson, T.A., and Hossman, R.L., 1988, Geophysical well-log data base for <strong>the</strong> Gulf<br />
Coast aquifer systems, south-central United States: U.S. Geological Survey Open-<br />
File <strong>Report</strong> 87-677.<br />
Young, S.C., and Kelley, V.A,. eds., 2006, A site conceptual model to support <strong>the</strong> development<br />
<strong>of</strong> a detailed groundwater model for Colorado, Wharton, and Matagorda<br />
counties: Prepared for <strong>the</strong> Lower Colorado River Authority, Austin, <strong>Texas</strong>, 118 p.<br />
116 <strong>Texas</strong> Water Development Board <strong>Report</strong> <strong>374</strong>
Chapter 6<br />
Geology, Structure, and Depositional History <strong>of</strong> <strong>the</strong><br />
Yegua-Jackson <strong>Aquifers</strong><br />
Paul Knox, P.G. 1 , Neil E. Deeds, P.E. 2 , Scott Hamlin, P.G. 3 , and Van Kelley, P.G. 2<br />
The <strong>Texas</strong> Water Development Board<br />
(TWDB) designated <strong>the</strong> Eoceneage<br />
Yegua-Jackson interval as a minor<br />
aquifer in <strong>the</strong> 2002 State Water Plan<br />
(TWDB, 2002). This increase in status<br />
from “o<strong>the</strong>r aquifer” was a consequence<br />
<strong>of</strong> recognizing <strong>the</strong> large number <strong>of</strong> wells<br />
in <strong>the</strong> TWDB database completed in <strong>the</strong><br />
Yegua-Jackson and <strong>the</strong> relatively large<br />
use <strong>of</strong> water from this interval (Preston,<br />
2006). In <strong>the</strong> 2007 State Water Plan, it is<br />
reported that <strong>the</strong> existing groundwater<br />
supply in <strong>the</strong> aquifer is 7,285 acre-feet<br />
per year (assuming existing wells and<br />
infrastructure) with a total availability<br />
estimated at 25,000 acre-feet per year<br />
(TWDB, 2007). Domestic, livestock,<br />
irrigation, and some municipal uses<br />
occur from <strong>the</strong> Yegua-Jackson Aquifer.<br />
Several regions have developed water<br />
management strategies in <strong>the</strong> 2007 State<br />
Water plan that would fur<strong>the</strong>r develop<br />
<strong>the</strong> aquifer, including drilling new wells<br />
and desalination. With <strong>the</strong> implementation<br />
<strong>of</strong> <strong>the</strong> proposed water management<br />
strategies, production from <strong>the</strong> aquifer<br />
is expected to exceed 15,000 acre-feet<br />
per year by 2040.<br />
From a hydrogeologic perspective,<br />
<strong>the</strong>re had been very little work done<br />
in <strong>the</strong> Yegua-Jackson Aquifer prior to<br />
2006, especially at a scale larger than an<br />
individual county (Preston, 2006). As a<br />
result, TWDB sponsored a study over<br />
<strong>the</strong> last several years to determine <strong>the</strong><br />
structure <strong>of</strong> <strong>the</strong> Yegua-Jackson Aquifer<br />
for <strong>the</strong> complete <strong>Texas</strong> section (results<br />
reported in Knox and o<strong>the</strong>rs, 2007) and<br />
is currently funding <strong>the</strong> development <strong>of</strong><br />
<strong>the</strong> Yegua-Jackson Aquifer groundwater<br />
availability model. This chapter will focus<br />
on <strong>the</strong> results <strong>of</strong> <strong>the</strong> recent structure<br />
development and will draw some inferences<br />
into how <strong>the</strong> results from this<br />
work can be <strong>of</strong> use for hydrogeologists<br />
interested in developing a groundwater<br />
availability model <strong>of</strong> <strong>the</strong> aquifer.<br />
6.1<br />
Yegua-Jackson Aquifer<br />
setting<br />
The Yegua-Jackson Aquifer exists predominantly<br />
in <strong>the</strong> outcrop or near-outcrop<br />
areas <strong>of</strong> <strong>the</strong> Yegua Formation and<br />
Jackson Group. In <strong>Texas</strong>, this outcrop<br />
area stretches in a thin band approximately<br />
parallel to <strong>the</strong> coastline, from<br />
Starr County in <strong>the</strong> Rio Grande Valley<br />
to Sabine County in East <strong>Texas</strong>, and is<br />
thus bracketed by <strong>the</strong> Rio Grande River<br />
to <strong>the</strong> south and <strong>the</strong> Toledo Bend Reservoir<br />
(along <strong>the</strong> Sabine River) to <strong>the</strong> east<br />
(Figure 6-1). The width <strong>of</strong> this outcrop<br />
varies from less than 10 miles in Gonzales<br />
County to almost 40 miles in La<br />
Salle County, with an area <strong>of</strong> approximately<br />
11,000 square miles (Preston,<br />
2006). Thirty-five counties intersect<br />
<strong>the</strong> Yegua-Jackson Aquifer as currently<br />
delineated (Preston, 2006).<br />
The alternating sand- and clay-rich<br />
Yegua-Jackson interval includes <strong>the</strong><br />
middle Eocene <strong>Upper</strong> Claiborne Group<br />
(Yegua and Cook Mountain formations)<br />
and <strong>the</strong> overlying upper Eocene to Oligocene<br />
Jackson Group (Caddell, Wellborn,<br />
Manning, and Whitsett formations), as<br />
shown in Figure 6-2. These units dip<br />
toward <strong>the</strong> modern coastline and are<br />
1 Baer Engineering and Environmental Consulting<br />
2 INTERA, Incorporated<br />
3 Bureau <strong>of</strong> Economic Geology, Jackson School <strong>of</strong><br />
Geosciences, The University <strong>of</strong> <strong>Texas</strong> at Austin<br />
<strong>Texas</strong> Water Development Board <strong>Report</strong> <strong>374</strong> 117
Limit <strong>of</strong><br />
salt deposition<br />
#<br />
Houston Embayment<br />
Major<br />
sediment<br />
sources<br />
San Marcos<br />
Arch<br />
Sabine<br />
Transfer Fault<br />
Picachos<br />
Arch<br />
Del Rio<br />
Foldbelt<br />
#<br />
Rio Grande<br />
Embayment<br />
Areas <strong>of</strong><br />
significant<br />
salt deposition<br />
Brazos Transfer Fault<br />
Galveston Transfer Fault<br />
Matagorda Transfer Fault<br />
Active boundary<br />
State line<br />
Gulf <strong>of</strong> Mexico<br />
County boundaries<br />
0 20 40<br />
Miles<br />
Yegua-Jackson Aquifer<br />
Outcrop<br />
Downdip<br />
Figure 6-1. Yegua-Jackson structure development study area and major structural elements along <strong>the</strong> <strong>Texas</strong> Gulf Coast.<br />
Areas <strong>of</strong> significant salt deposition taken from Galloway and o<strong>the</strong>rs (1983). Transfer faults from Huh and o<strong>the</strong>rs (1996).<br />
O<strong>the</strong>r features from Ewing (1991).<br />
part <strong>of</strong> <strong>the</strong> progressive filling <strong>of</strong> <strong>the</strong> Gulf<br />
<strong>of</strong> Mexico Basin by sand, silt, and clay<br />
carried from <strong>the</strong> mountains <strong>of</strong> nor<strong>the</strong>rn<br />
Mexico and <strong>the</strong> Rocky Mountains,<br />
as well as from o<strong>the</strong>r areas <strong>of</strong> <strong>Texas</strong> and<br />
<strong>the</strong> western part <strong>of</strong> <strong>the</strong> North American<br />
continental interior.<br />
The generalized chronostratigraphy<br />
and lithostratigraphy for <strong>the</strong> Yegua-<br />
Jackson interval are shown in Figure 6-2<br />
in relation to underlying and overlying<br />
units. The Yegua Formation was deposited<br />
during a strong influx <strong>of</strong> sediment,<br />
primarily in <strong>the</strong> Houston Embayment,<br />
during <strong>the</strong> time period from 38.2 to 37.8<br />
mega-annum (Ma). The Jackson Group<br />
resulted from a much smaller sediment<br />
influx from 37.8 to 37.1 Ma and was<br />
deposited primarily on <strong>the</strong> shelf built<br />
by Yegua deposits.<br />
118 <strong>Texas</strong> Water Development Board <strong>Report</strong> <strong>374</strong>
6.2<br />
Previous investigations<br />
An abundant body <strong>of</strong> previous work<br />
exists for <strong>the</strong> Yegua-Jackson interval<br />
because <strong>of</strong> its extensive resources <strong>of</strong><br />
oil, gas, coal, and uranium. Geologic<br />
investigations extend from initial and<br />
broad stratigraphic investigations in<br />
<strong>the</strong> 19 th century to modern-day detailed<br />
subsurface structural, chronostratigraphic,<br />
micropaleontologic, and depositional<br />
analyses. The hydrogeologic<br />
literature is more limited in quantity<br />
and scope than <strong>the</strong> stratigraphic literature<br />
and includes county water resource<br />
studies by both <strong>the</strong> U.S. Geological Survey<br />
and TWDB.<br />
Early outcrop geology and stratigraphy<br />
were established by Renick (1926,<br />
1936) and Sellards and o<strong>the</strong>rs (1932). The<br />
economic importance <strong>of</strong> oil, gas, coal,<br />
and finally uranium resources spurred<br />
investigations from <strong>the</strong> early 1960s<br />
through about 1990 (for example, Fisher,<br />
1963; Fisher and o<strong>the</strong>rs, 1970; Eargle,<br />
1972; Quick and o<strong>the</strong>rs, 1977; Galloway<br />
and o<strong>the</strong>rs, 1979; Kaiser and o<strong>the</strong>rs, 1980;<br />
Jackson and Garner, 1982; Ewing, 1986;<br />
and Galloway and o<strong>the</strong>rs, 1991). This<br />
work established, on <strong>the</strong> basis <strong>of</strong> outcrop<br />
and subsurface detailed investigations,<br />
<strong>the</strong> general structure, stratigraphy, depositional<br />
systems, and lithologic distribution<br />
<strong>of</strong> <strong>the</strong> Yegua-Jackson interval.<br />
Period<br />
Epoch<br />
Stratigraphic<br />
units<br />
Age (in 10 6 years)<br />
Paleontologic markers<br />
32.0<br />
Oligocene<br />
Lower<br />
Vicksburg Formation<br />
Textularia warreni<br />
Globigerina ampliapertura<br />
Loxostoma delicata<br />
33.9<br />
<strong>Upper</strong><br />
Jackson Group<br />
Whitsett Formation<br />
Manning Formation<br />
Wellborn Formation<br />
Caddell Formation<br />
37.1<br />
Marginulina cocoaensis, Massalina pratti<br />
Textularia hockleyensis<br />
Textularia dibollensis<br />
Camerina moodysbranchensis<br />
Nonionella cockfieldensis<br />
Eocene<br />
Yegua Formation<br />
37.8<br />
Discorbis yeguaensis<br />
Eponides yeguaensis<br />
Middle<br />
Cook Mountain Formation<br />
38.2<br />
Anomalina umbonata, Nodosaria Mexicana<br />
Ceratobulimina eximia<br />
Operculinoides sabinensis<br />
Clavulinoides guaybalensis,<br />
Globorotalia spinulosa, Truncorotaloides<br />
topilensis<br />
Figure 6-2. Paleontologic markers and approximate ages for <strong>the</strong> Yegua-Jackson interval and adjacent<br />
formations. Markers and ages from Fang (2000), Harland and o<strong>the</strong>rs (1990), and Galloway and o<strong>the</strong>rs<br />
(1991).<br />
<strong>Texas</strong> Water Development Board <strong>Report</strong> <strong>374</strong> 119
Also during this period, <strong>the</strong> U.S.<br />
Geological Survey and TWDB carried<br />
out joint studies <strong>of</strong> <strong>the</strong> water resources<br />
<strong>of</strong> <strong>the</strong> Yegua-Jackson in many counties,<br />
especially those in sou<strong>the</strong>ast <strong>Texas</strong> (for<br />
example, Winslow, 1950; Dale, 1952;<br />
Anders and Baker, 1961; Tarver, 1966;<br />
Thompson, 1966; Rogers, 1967; Wesselman,<br />
1967; Tarver, 1968; William F. Guyton<br />
and Associates, 1970; and Baker and<br />
o<strong>the</strong>rs, 1974). These subsurface studies<br />
added important information regarding<br />
<strong>the</strong> distribution <strong>of</strong> fresh and slightly<br />
saline water in <strong>the</strong> aquifer and aquifer<br />
geochemistry.<br />
Yegua-Jackson outcrop distribution<br />
was identified and compiled by <strong>the</strong><br />
Bureau <strong>of</strong> Economic Geology at The University<br />
<strong>of</strong> <strong>Texas</strong> at a 1:250,000 scale during<br />
<strong>the</strong> 1970s, 1980s, and 1990s under <strong>the</strong><br />
direction <strong>of</strong> Virgil Barnes (Barnes, 1968a,<br />
b; 1974a, b, c; 1975; 1976a; 1976b, c; and<br />
1992). The Yegua and Cook Mountain/<br />
Laredo formations were mapped across<br />
<strong>the</strong> state. Over a large area <strong>of</strong> outcrop<br />
belt, <strong>the</strong> main formations <strong>of</strong> <strong>the</strong> Jackson<br />
Group (Caddell, Wellborn, Manning,<br />
and Whitsett) were mapped individually,<br />
including some local unit names<br />
such as <strong>the</strong> Yazoo Shale and <strong>the</strong> Nash<br />
Draw Sand.<br />
Studies from <strong>the</strong> early 1990s to present<br />
have been prompted by <strong>the</strong> discovery<br />
<strong>of</strong> <strong>the</strong> downdip Yegua oil and gas trend<br />
and have employed <strong>the</strong> technologies <strong>of</strong><br />
sequence stratigraphy, three dimensional<br />
seismic surveys, and organic geochemistry<br />
(for example, Sneider, 1992; Goings<br />
and Smosna, 1994; Ewing, 1994; Yuliantoro,<br />
1995; Meckel and Galloway, 1996;<br />
Swenson, 1997; Ewing and Vincent, 1997;<br />
Thomas, 1999; Routh and o<strong>the</strong>rs, 1999;<br />
Galloway and o<strong>the</strong>rs, 2000; and Fang,<br />
2000). This work has produced a refined<br />
chronostratigraphic understanding <strong>of</strong> <strong>the</strong><br />
Yegua-Jackson interval that stands in<br />
some contrast to <strong>the</strong> lithostratigraphicdominated<br />
understanding evident in outcrop<br />
mapping and in studies from <strong>the</strong><br />
1960s, 1970s, and 1980s.<br />
6.3<br />
Study approach<br />
The literature review was followed<br />
by ga<strong>the</strong>ring geophysical well logs<br />
and associated well data, chronostratigraphic<br />
analysis, digital lithologic<br />
analysis, mapping structure, sand distribution,<br />
and depositional systems.<br />
This analysis supported <strong>the</strong> subdivision<br />
<strong>of</strong> <strong>the</strong> Yegua-Jackson Aquifer into<br />
operable units that could be correlated<br />
across <strong>the</strong> state. From <strong>the</strong> top <strong>of</strong> <strong>the</strong><br />
aquifer downward, <strong>the</strong>se are <strong>the</strong> <strong>Upper</strong><br />
Jackson, Lower Jackson, <strong>Upper</strong> Yegua,<br />
and Lower Yegua layers.<br />
Data used to support <strong>the</strong> above analysis<br />
comprises three types: (1) stakeholder<br />
data, (2) borehole geophysical logs, and<br />
(3) literature data on Yegua-Jackson<br />
structure and on Yegua-Jackson lithology<br />
and depositional systems.<br />
6.3.1<br />
Data sources<br />
Solicitation <strong>of</strong> stakeholders resulted in<br />
no electric log data that could be directly<br />
used in <strong>the</strong> project. The bulk <strong>of</strong> geophysical<br />
logs came from The University<br />
<strong>of</strong> <strong>Texas</strong> Bureau <strong>of</strong> Economic Geology,<br />
TWDB, and <strong>the</strong> <strong>Texas</strong> Commission on<br />
Environmental Quality Surface Casing<br />
Division:<br />
• A grid <strong>of</strong> well logs and cross sections<br />
established by Dodge and Posey<br />
(1981) were used as a basis to develop<br />
a collection <strong>of</strong> geophysical logs.<br />
Where original logs were missing<br />
or inadequate for <strong>the</strong> study (did not<br />
cover <strong>the</strong> stratigraphic interval) and<br />
where wells were needed to create a<br />
more uniform grid, additional well<br />
logs were obtained from Bureau <strong>of</strong><br />
Economic Geology files.<br />
• Geophysical logs from two Yegua-<br />
Jackson wells in <strong>the</strong> TWDB library<br />
were ga<strong>the</strong>red.<br />
• About 30 logs were obtained from<br />
<strong>the</strong> files <strong>of</strong> <strong>the</strong> <strong>Texas</strong> Commission<br />
on Environmental Quality Surface<br />
Casing Division.<br />
120 <strong>Texas</strong> Water Development Board <strong>Report</strong> <strong>374</strong>
A total <strong>of</strong> 250 geophysical logs were<br />
selected (Figure 6-3), ga<strong>the</strong>red, and<br />
scanned at 300 to 400 dots per inch resolution.<br />
Well locations were confirmed<br />
from Tobin base maps, and latitudes<br />
and longitudes were transferred to a<br />
geographic information system database<br />
with a resulting accuracy <strong>of</strong> approximately<br />
1 mile. The spontaneous potential<br />
and resistivity curves from 150 logs<br />
were digitized for consistent, repeatable<br />
percent-sand calculations.<br />
A number <strong>of</strong> faults that <strong>of</strong>fset <strong>the</strong><br />
Yegua and Jackson are known to exist<br />
within <strong>the</strong> study area (Quick and o<strong>the</strong>rs,<br />
1977; Dodge and Posey, 1981). These are<br />
predominantly downdip <strong>of</strong> <strong>the</strong> outcrop<br />
area, but throws on some faults reportedly<br />
exceed several hundred feet. These<br />
data were summarized in Knox and<br />
o<strong>the</strong>rs (2007). Additionally, salt-related<br />
structures occur as localized features in<br />
<strong>the</strong> Rio Grande Embayment and downdip<br />
in <strong>the</strong> Houston Embayment (Ewing,<br />
1986). Although <strong>the</strong>se features may<br />
become important for fine-scale aquifer<br />
modeling, data spacing in this study<br />
was insufficient to yield well-supported<br />
detailed structure contour maps.<br />
Data spacing also prevented highly<br />
detailed sand thickness mapping. To<br />
ensure that significant trends identified<br />
in o<strong>the</strong>r more detailed studies were not<br />
missed, information from Van Dalen<br />
(1981), Fisher (1969), and Fisher and<br />
o<strong>the</strong>rs (1970) was compared to sand<br />
thickness trends identified in this study.<br />
Because Fisher and o<strong>the</strong>rs (1970) studied<br />
<strong>the</strong> Jackson Group as a single interval,<br />
sand thickness contours were used only<br />
as very general trends in mapping <strong>the</strong><br />
two (aquifer) layers <strong>of</strong> <strong>the</strong> Jackson that<br />
this study recognizes.<br />
6.3.2<br />
Methodology<br />
To apply <strong>the</strong> chronostratigraphic concepts<br />
to <strong>the</strong> Yegua-Jackson interval, we<br />
(1) identified major flooding surfaces in<br />
well logs, (2) correlated <strong>the</strong>se flooding<br />
surfaces to known paleontologic markers<br />
to ensure agreement with existing<br />
subsurface formation nomenclature,<br />
and (3) correlated <strong>the</strong> flooding surfaces<br />
updip to <strong>the</strong> point <strong>of</strong> outcrop and evaluated<br />
<strong>the</strong> correspondence with mapped<br />
outcrop formation boundaries. Because<br />
major lithologic differences are predominant<br />
in outcrop and age-specific<br />
flooding surfaces are more prominent<br />
in subsurface data, opportunities exist<br />
for disagreement between subsurface<br />
and outcrop formation boundaries.<br />
From <strong>the</strong> distribution <strong>of</strong> <strong>the</strong> 250 wells<br />
used, a grid <strong>of</strong> 30 dip-oriented cross sections<br />
and 3 strike-oriented cross sections<br />
was created (Figure 6-3). Dip sections<br />
extend from <strong>the</strong> Yegua-Jackson outcrop<br />
area downdip (sou<strong>the</strong>ast) more than 50<br />
miles and to depths exceeding 6,000 feet<br />
subsea to allow a more complete stratigraphic<br />
analysis. Strike sections extend<br />
from <strong>the</strong> Mexico to Louisiana borders.<br />
Two sections roughly parallel <strong>the</strong> outcrop<br />
and, depending on <strong>the</strong>ir location, show<br />
ei<strong>the</strong>r mostly <strong>the</strong> Jackson interval (A-A’)<br />
or mostly <strong>the</strong> Yegua interval (B-B’). A<br />
third strike section, C‐C’, was created<br />
from selected wells so that coverage <strong>of</strong><br />
both intervals was optimized.<br />
Previous interpretations <strong>of</strong> bounding<br />
surfaces for <strong>the</strong> base Yegua, top Yegua,<br />
top Jackson, base Vicksburg, and top<br />
Jackson/Vicksburg were taken directly<br />
from or correlated into <strong>the</strong> well grid from<br />
Dodge and Posey (1981), Coleman (1990),<br />
and various U.S. Geological Survey/<br />
TWDB county studies. Micropaleontologic<br />
markers on Dodge and Posey (1981)<br />
sections were correlated into <strong>the</strong> well<br />
grid and also taken directly from annotations<br />
on original copies <strong>of</strong> logs used<br />
in <strong>the</strong> grid. Because <strong>of</strong> <strong>the</strong> uncertainty<br />
<strong>of</strong> <strong>the</strong> source <strong>of</strong> <strong>the</strong> latter information,<br />
those data were used more as a rough<br />
check on correlations. Outcrop boundaries<br />
<strong>of</strong> <strong>the</strong> Jackson and Yegua intervals<br />
were projected onto cross sections, and<br />
surface elevations along section lines<br />
were taken from <strong>the</strong> U.S. Geological<br />
<strong>Texas</strong> Water Development Board <strong>Report</strong> <strong>374</strong> 121
4<br />
3<br />
2<br />
1<br />
5<br />
A', C'<br />
7<br />
6<br />
B'<br />
9<br />
8<br />
10<br />
13<br />
12<br />
11<br />
14<br />
16<br />
15<br />
17<br />
18<br />
19<br />
20<br />
21<br />
22<br />
23<br />
24<br />
25<br />
26<br />
27<br />
28<br />
29<br />
Yegua-Jackson outcrop<br />
State line<br />
County boundaries<br />
Well locations<br />
Cross sections (DIP)<br />
Cross sections (STRIKES A and B)<br />
Cross section (STRIKE C)<br />
0 20 40 80<br />
Miles<br />
30<br />
A B C<br />
Figure 6-3. Stratigraphic correlation basemap with cross section lines.<br />
Survey digital elevation model to place<br />
outcrop boundaries precisely on cross<br />
sections.<br />
6.3.2.1<br />
Structure mapping approach<br />
• The structural elevation relative<br />
to sea level was mapped across <strong>the</strong><br />
study area for five key surfaces:<br />
• Top <strong>of</strong> <strong>the</strong> Jackson Group (top <strong>of</strong><br />
<strong>Upper</strong> Jackson layer)<br />
• Top <strong>of</strong> Lower Jackson layer<br />
• Top <strong>of</strong> Yegua Formation (top <strong>of</strong><br />
<strong>Upper</strong> Yegua layer)<br />
• Top <strong>of</strong> Lower Yegua layer<br />
• Base <strong>of</strong> Yegua-Jackson Aquifer<br />
The first four surfaces are chronostratigraphic,<br />
meaning that <strong>the</strong>y correspond<br />
to maximum flooding surfaces.<br />
The fifth surface, <strong>the</strong> base <strong>of</strong> <strong>the</strong> Yegua-<br />
Jackson Aquifer, is a lithostratigraphic<br />
surface. It does not follow a maximum<br />
122 <strong>Texas</strong> Water Development Board <strong>Report</strong> <strong>374</strong>
flooding surface but instead generally<br />
corresponds to <strong>the</strong> base <strong>of</strong> significant<br />
sand bodies in <strong>the</strong> Yegua depositional<br />
cycle. A sixth surface, <strong>the</strong> chronostratigraphic<br />
base <strong>of</strong> <strong>the</strong> Yegua depositional<br />
cycle, was also interpreted, corresponding<br />
to <strong>the</strong> maximum flooding surface<br />
between <strong>the</strong> Sparta and Yegua depositional<br />
cycles.<br />
6.3.2.2<br />
Lithologic interpretation approach<br />
Cumulative sand thickness in aquifer<br />
studies has been determined in <strong>the</strong> past<br />
using many different approaches, yielding<br />
results that are sometimes difficult<br />
for subsequent workers to reproduce. To<br />
overcome this issue, 150 well logs were<br />
selected, and spontaneous potential<br />
and resistivity curves digitized. Baseline<br />
values for shale and/or sand were established,<br />
and a cut<strong>of</strong>f value was used that<br />
produced results similar to geologist<br />
estimates. Because <strong>the</strong> study interval<br />
included freshwater, transitional, and<br />
saline water-bearing sediments, different<br />
algorithms and cut<strong>of</strong>fs were used for<br />
each interval. In freshwater zones, <strong>the</strong><br />
resistivity curve was used to delineate<br />
lithology. In saline zones, spontaneous<br />
potential was used. And in transitional<br />
zones, ei<strong>the</strong>r curve or a combination<br />
<strong>of</strong> curves was used, depending on mud<br />
resistivity and resulting spontaneous<br />
potential behavior.<br />
A semi-automated approach was<br />
used to estimate <strong>the</strong> basic lithology, or<br />
<strong>the</strong> relative locations <strong>of</strong> sands and shales,<br />
from appropriate well logs. The automated<br />
approach was based on a simple<br />
set <strong>of</strong> rules that an analyst might use in<br />
interpreting a well log manually. Implemented<br />
in Perl programming language,<br />
it established lithology “baselines” for<br />
curves based upon <strong>the</strong> 5 th and 95 th percentiles<br />
<strong>of</strong> digital log data. A cut<strong>of</strong>f was<br />
applied at 50 percent between those two<br />
end members to discriminate sand from<br />
shale at <strong>the</strong> sample spacing <strong>of</strong> 0.5 foot.<br />
Values were summed over each layer to<br />
yield total sand thickness by layer. After<br />
calculated values were posted on base<br />
maps for each interval, each value was<br />
qualitatively compared to <strong>the</strong> original<br />
log by a geologist to confirm reasonable<br />
accuracy. When wells only partially penetrate<br />
a layer, sand thickness was considered<br />
a minimum value for <strong>the</strong> purpose<br />
<strong>of</strong> data contouring. In such cases, values<br />
were posted as ‘>’ to visually indicate a<br />
minimum value and note <strong>the</strong> associated<br />
uncertainty.<br />
Sand thickness values at wellbores<br />
were <strong>the</strong>n divided by <strong>the</strong> isopach values<br />
at <strong>the</strong> wellbores to determine <strong>the</strong> layer<br />
sand percent, which was <strong>the</strong>n gridded<br />
in ArcGIS 9.2 using <strong>the</strong> “topo to raster”<br />
function. Sand thickness grids were <strong>the</strong>n<br />
created by multiplying <strong>the</strong> sand percent<br />
grids by <strong>the</strong> layer isopach grids. The final<br />
sand thickness maps contoured with<br />
“topo-to-raster” were <strong>the</strong>n compared<br />
to sand thickness maps from previous<br />
workers such as Fisher and o<strong>the</strong>rs (1970).<br />
In all cases, major features <strong>of</strong> published<br />
maps were captured adequately using <strong>the</strong><br />
current distribution <strong>of</strong> study wells and<br />
unbiased computer contouring. Final<br />
maps were thus computer contoured,<br />
as opposed to hand contoured, because<br />
this process is simple and repeatable, and<br />
maps are easily updated as additional<br />
data become available.<br />
6.3.2.3<br />
Depositional systems mapping approach<br />
For <strong>the</strong> four Yegua-Jackson layers, sand<br />
thickness trends from this study and<br />
o<strong>the</strong>r published studies were incorporated<br />
with interpretations <strong>of</strong> depositional<br />
setting based upon log curve<br />
shape and previous work. Regions <strong>of</strong><br />
a layer dominated by similar depositional<br />
facies were outlined by hand,<br />
and hand-drawn boundaries were <strong>the</strong>n<br />
digitized for incorporation as a geographic<br />
information system layer. In<br />
many cases, sand thickness values were<br />
used as proxies for determining position<br />
within a larger depositional system.<br />
<strong>Texas</strong> Water Development Board <strong>Report</strong> <strong>374</strong> 123
For example, deltaic settings in a Yegua<br />
layer containing less than 100 feet <strong>of</strong><br />
sand were mapped as delta margins.<br />
The resulting facies-based regions <strong>of</strong> a<br />
layer can be used in modeling to constrain<br />
hydrologic parameters across a<br />
modeling layer.<br />
6.4<br />
Aquifer structure and<br />
hydrostratigraphy<br />
As discussed previously, <strong>the</strong> Yegua-<br />
Jackson Aquifer was subdivided into<br />
four layers on <strong>the</strong> basis <strong>of</strong> regionally<br />
correlatable shale-dominated horizons.<br />
Each <strong>of</strong> <strong>the</strong>se layers is a separate<br />
hydrostratigraphic unit in which fluid<br />
flow is dominantly lateral and crosslayer<br />
flow is limited.<br />
6.4.1<br />
Yegua-Jackson Aquifer structure<br />
This section will describe each <strong>of</strong> <strong>the</strong><br />
four units <strong>of</strong> <strong>the</strong> Yegua-Jackson Aquifer<br />
and provide structure contour and<br />
isopach maps for each. Structure contours<br />
are generally smooth and follow<br />
<strong>the</strong> directional trends <strong>of</strong> <strong>the</strong> outcrop belt.<br />
Although down-to-<strong>the</strong>-coast growth<br />
faults, salt features, and even small, local<br />
up-to-<strong>the</strong>-coast faults exist, <strong>the</strong>y were<br />
not accurately mappable, given <strong>the</strong> data<br />
spacing <strong>of</strong> this study. Future detailed<br />
studies should refer to Quick and o<strong>the</strong>rs<br />
(1977), Dodge and Posey (1981), or Ewing<br />
(1986). In general, many faults exceeding<br />
300 feet <strong>of</strong> throw for distances <strong>of</strong> 10<br />
to 20 miles occur near <strong>the</strong> outcrop and<br />
in <strong>the</strong> shallow subsurface in South <strong>Texas</strong><br />
from <strong>the</strong> San Marcos Arch southward<br />
(DeWitt, Karnes, Bee, Live Oak, Duval,<br />
Webb, Jim Hogg, and Starr counties).<br />
Fewer such faults are noted north and<br />
east <strong>of</strong> <strong>the</strong> San Marcos Arch, but studies<br />
<strong>of</strong> <strong>the</strong> detail <strong>of</strong> Quick and o<strong>the</strong>rs (1977)<br />
that cover this area were not found during<br />
this study. Longer faults with throws<br />
exceeding 1,000 feet occur in <strong>the</strong> deeper<br />
subsurface <strong>of</strong> <strong>the</strong> Yegua-Jackson interval<br />
more than 30 miles downdip <strong>of</strong> <strong>the</strong><br />
outcrop and roughly coincident with<br />
<strong>the</strong> Yegua-Jackson shelf edge.<br />
Structural dips <strong>of</strong> Yegua-Jackson<br />
Aquifer layers are markedly steeper<br />
across <strong>the</strong> San Marcos Arch and flatter<br />
in <strong>the</strong> Houston and Rio Grande embayments<br />
(Figures 6-4 and 6-5). The Rio<br />
Grande Embayment has perhaps <strong>the</strong><br />
gentlest dips, which occur in <strong>the</strong> LaSalle-<br />
McMullen County area. South <strong>Texas</strong> also<br />
has <strong>the</strong> steepest dips, occurring in southwestern<br />
Zapata and western Starr counties.<br />
Similarly, isopach maps (Figure 6-6)<br />
show that <strong>the</strong> thinnest areas are across<br />
<strong>the</strong> San Marcos Arch, with <strong>the</strong> Houston<br />
and Rio Grande embayments collecting<br />
<strong>the</strong> greatest sediment thicknesses. Cross<br />
sections and isopach maps (Figures 6-6,<br />
6-7, and 6-8) <strong>of</strong> <strong>the</strong> interpreted structure<br />
(Knox and o<strong>the</strong>rs, 2007) demonstrate<br />
that layers thicken very gradually in <strong>the</strong><br />
downdip direction, resulting in subtle<br />
divergence <strong>of</strong> layer boundaries. Following<br />
is a discussion <strong>of</strong> regional thickness<br />
trends in each layer.<br />
The Lower Yegua unit ranges in<br />
thickness from less than 500 feet near <strong>the</strong><br />
updip limit <strong>of</strong> well control to more than<br />
1,100 feet in middip to downdip parts <strong>of</strong><br />
<strong>the</strong> study area. The <strong>Upper</strong> Yegua unit<br />
varies in thickness from less than 500<br />
feet at <strong>the</strong> updip limit <strong>of</strong> well control<br />
up to more than 1,200 feet at <strong>the</strong> downdip<br />
study edge. The Lower Jackson unit<br />
ranges in thickness from less than 400<br />
feet at <strong>the</strong> updip limit <strong>of</strong> well control to<br />
nearly 600 feet at <strong>the</strong> downdip edge <strong>of</strong><br />
<strong>the</strong> study area. The <strong>Upper</strong> Jackson unit<br />
varies in thickness from less than 500<br />
feet at <strong>the</strong> updip limit <strong>of</strong> well control<br />
to more than 1,000 feet at <strong>the</strong> downdip<br />
study edge.<br />
6.4.2<br />
Aquifer heterogeneity and character<br />
Preceding discussions have addressed<br />
<strong>the</strong> logical subdivision <strong>of</strong> <strong>the</strong> Yegua-<br />
Jackson Aquifer into four layers and<br />
elucidated <strong>the</strong> structure and thickness<br />
<strong>of</strong> those layers. Each layer will likely be<br />
124 <strong>Texas</strong> Water Development Board <strong>Report</strong> <strong>374</strong>
Leon<br />
Houston<br />
Cherokee Nacogdoches San<br />
Augustine<br />
Angelina<br />
Sabine<br />
Caldwell<br />
Bastrop<br />
Trinity<br />
Robertson<br />
Madison<br />
Newton<br />
Milam<br />
Grimes<br />
Jasper<br />
Walker<br />
Tyler<br />
Polk<br />
Brazos<br />
San Jacinto<br />
Burleson<br />
Hardin<br />
Lee<br />
Montgomery<br />
Washington<br />
Liberty<br />
Orange<br />
Jefferson<br />
Austin<br />
Fayette<br />
Waller Harris<br />
Chambers<br />
Guadalupe<br />
Wilson<br />
Gonzales<br />
Lavaca<br />
Colorado<br />
Wharton<br />
Fort Bend<br />
Brazoria<br />
Galveston<br />
Frio<br />
La Salle<br />
Atascosa<br />
McMullen<br />
Live Oak<br />
Karnes<br />
Bee<br />
De Witt<br />
Jackson<br />
Victoria<br />
Goliad<br />
Calhoun<br />
Refugio<br />
Matagorda<br />
Top <strong>of</strong> Jackson (feet)<br />
-5,505–5,000<br />
-4,999–4,000<br />
Webb<br />
Duval<br />
San Patricio<br />
Jim Wells<br />
Nueces<br />
Kleberg<br />
Aransas<br />
-3,999–3,000<br />
-2,999–2,000<br />
-1,999–1,000<br />
-999–0<br />
Zapata<br />
Jim Hogg<br />
Brooks<br />
Kenedy<br />
1–1,000<br />
Well locations<br />
Active boundary<br />
Starr<br />
Hidalgo<br />
Willacy<br />
Cameron<br />
0 20 40<br />
Miles<br />
County boundaries<br />
State line<br />
Gulf <strong>of</strong> Mexico<br />
Figure 6-4. Top <strong>of</strong> <strong>Upper</strong> Jackson unit (Knox and o<strong>the</strong>rs, 2007).<br />
modeled as an individual unit. The lateral<br />
distribution <strong>of</strong> sand thickness within<br />
each layer and <strong>the</strong> depositional facies <strong>of</strong><br />
those sands constitute <strong>the</strong> depositional<br />
heterogeneity <strong>of</strong> <strong>the</strong> aquifer. The quality<br />
and vertical and lateral connectedness<br />
<strong>of</strong> sands, along with any structural overprinting,<br />
govern <strong>the</strong> character <strong>of</strong> <strong>the</strong><br />
aquifer. In this sense, character refers to<br />
<strong>the</strong> overall behavior <strong>of</strong> <strong>the</strong> aquifer and<br />
its response to inputs such as reduced<br />
recharge or increased pumping.<br />
<strong>Texas</strong> Water Development Board <strong>Report</strong> <strong>374</strong> 125
Leon<br />
Houston<br />
Cherokee Nacogdoches<br />
Trinity<br />
Angelina<br />
San<br />
Augustine<br />
Sabine<br />
Webb<br />
Frio<br />
La Salle<br />
Atascosa<br />
McMullen<br />
Duval<br />
Robertson<br />
Madison<br />
Newton<br />
Tyler Jasper<br />
Milam<br />
Walker<br />
Polk<br />
Brazos<br />
Burleson<br />
Grimes<br />
San Jacinto<br />
Hardin<br />
Lee<br />
Montgomery<br />
Washington<br />
Liberty<br />
Orange<br />
Bastrop<br />
Jefferson<br />
Austin<br />
Waller Harris<br />
Chambers<br />
Caldwell<br />
Fayette<br />
Colorado<br />
Guadalupe<br />
Fort Bend<br />
Lavaca<br />
Wharton<br />
Brazoria<br />
Galveston<br />
Wilson<br />
Bottom <strong>of</strong> Yegua (feet)<br />
De Witt<br />
Jackson<br />
Karnes<br />
Matagorda<br />
-8,477–8,000<br />
Victoria<br />
Goliad<br />
-7,999–7,000<br />
Calhoun<br />
-6,999–6,000<br />
Bee<br />
Refugio<br />
Live Oak<br />
-5,999–5,000<br />
-4,999–4,000<br />
San Patricio<br />
Jim Wells<br />
Aransas<br />
-3,999–3,000<br />
Nueces<br />
-2,999–2,000<br />
Gonzales<br />
Kleberg<br />
-1,999–1,000<br />
-999–0<br />
Zapata<br />
Jim Hogg<br />
Brooks<br />
Kenedy<br />
1–1,000<br />
Well locations<br />
Starr<br />
Hidalgo<br />
Willacy<br />
Cameron<br />
0 20 40<br />
Miles<br />
Active boundary<br />
County boundaries<br />
State line<br />
Gulf <strong>of</strong> Mexico<br />
Figure 6-5. Base <strong>of</strong> Yegua-Jackson Aquifer (Knox and o<strong>the</strong>rs, 2007).<br />
General sand thickness, depositional<br />
facies, and character for each unit are<br />
discussed in <strong>the</strong> following sections, in<br />
<strong>the</strong> order in which <strong>the</strong>y were deposited<br />
(Lower Yegua through <strong>Upper</strong> Jackson).<br />
For a complete discussion <strong>of</strong> <strong>the</strong> interpretive<br />
methods used, please refer to<br />
Knox and o<strong>the</strong>rs (2007).<br />
6.4.2.1<br />
Lower Yegua unit<br />
Net sand thickness <strong>of</strong> <strong>the</strong> Lower Yegua<br />
exceeds 400 feet in small areas and is<br />
greater than 100 feet across three-quarters<br />
<strong>of</strong> <strong>the</strong> study area. Sand thickness<br />
in <strong>the</strong> outcrop area is generally greater<br />
126 <strong>Texas</strong> Water Development Board <strong>Report</strong> <strong>374</strong>
Frio<br />
Atascosa<br />
Cherokee Nacogdoches<br />
San<br />
Augustine<br />
Houston<br />
Sabine<br />
Leon<br />
Angelina<br />
Trinity<br />
Robertson<br />
Madison<br />
Newton<br />
Tyler<br />
Milam<br />
Polk<br />
Jasper<br />
Walker<br />
Brazos<br />
Grimes<br />
San Jacinto<br />
Burleson<br />
Hardin<br />
Lee<br />
Montgomery<br />
Washington<br />
Liberty<br />
Orange<br />
Bastrop<br />
Jefferson<br />
Austin<br />
Waller Harris<br />
Chambers<br />
Caldwell<br />
Fayette<br />
Colorado<br />
Guadalupe<br />
Fort Bend<br />
Gonzales<br />
Lavaca<br />
Wharton<br />
Brazoria<br />
Galveston<br />
Wilson<br />
De Witt<br />
Jackson<br />
Matagorda<br />
Karnes<br />
Victoria<br />
La Salle<br />
Goliad<br />
Calhoun<br />
McMullen<br />
Live Oak<br />
Bee<br />
Refugio<br />
<strong>Upper</strong> Yegua<br />
thickness (feet)<br />
Webb<br />
Jim Wells<br />
San Patricio<br />
Aransas<br />
25–250<br />
251–500<br />
Duval<br />
Nueces<br />
501–750<br />
Kleberg<br />
751–1,000<br />
1,001–1,250<br />
Zapata<br />
Jim Hogg<br />
Brooks<br />
Kenedy<br />
Well locations<br />
Active boundary<br />
Starr<br />
Hidalgo<br />
Willacy<br />
0 20 40<br />
County boundaries<br />
State line<br />
Cameron<br />
Miles<br />
Gulf <strong>of</strong> Mexico<br />
Figure 6-6. Thickness <strong>of</strong> <strong>Upper</strong> Yegua unit (Knox and o<strong>the</strong>rs, 2007).<br />
than 100 feet, except along <strong>the</strong> north<br />
and south flanks <strong>of</strong> <strong>the</strong> San Marcos<br />
Arch, and is commonly greater than<br />
200 feet, reaching a maximum <strong>of</strong> more<br />
than 500 feet in far South <strong>Texas</strong>. In <strong>the</strong><br />
subsurface, <strong>the</strong> Lower Yegua unit is<br />
thicker than 250 feet over large areas <strong>of</strong><br />
<strong>the</strong> Houston Embayment and exceeds<br />
400 feet across a broad area downdip<br />
<strong>of</strong> LaSalle and Webb counties in South<br />
<strong>Texas</strong>.<br />
In <strong>the</strong> Lower Yegua unit, updip sandrich<br />
intervals dominated by upward-fining<br />
sands are interpreted as dip-oriented<br />
fluvial deposits. Intervening areas <strong>of</strong> less<br />
than 100 feet <strong>of</strong> sand are marginal to <strong>the</strong>se<br />
<strong>Texas</strong> Water Development Board <strong>Report</strong> <strong>374</strong> 127
Figure 6-7. Modified dip section 4.<br />
Trinity County Polk County<br />
Datum: Sea level<br />
Bend in<br />
section<br />
Ground surface<br />
128 <strong>Texas</strong> Water Development Board <strong>Report</strong> <strong>374</strong>
Bend in<br />
section<br />
Figure 6-8. Modified dip section 22.<br />
Webb County Duval County<br />
Ground surface<br />
Datum: Sea level<br />
Bend in<br />
section<br />
Bend in<br />
section<br />
Bend in<br />
section<br />
<strong>Texas</strong> Water Development Board <strong>Report</strong> <strong>374</strong> 129
fluvial axes and are considered floodplain<br />
deposits, even though <strong>the</strong>se areas may<br />
contain some individual upward-fining<br />
fluvial sand bodies. Sand-rich regions<br />
across <strong>the</strong> middle <strong>of</strong> <strong>the</strong> study area that<br />
are dominated by upward coarsening or<br />
blocky sand bodies are interpreted as<br />
deltaic facies fed by updip fluvial systems.<br />
In <strong>the</strong> nor<strong>the</strong>rn and sou<strong>the</strong>rn part<br />
<strong>of</strong> <strong>the</strong> study area, <strong>the</strong>se deltas prograde<br />
out to <strong>the</strong> shelf-edge position as interpreted<br />
by Galloway and o<strong>the</strong>rs (1983).<br />
Areas between <strong>the</strong> fluvial deposits and<br />
<strong>the</strong> shelf edge that contain less than 50<br />
feet <strong>of</strong> net sand are interpreted as delta<br />
margin deposits. The area downdip <strong>of</strong><br />
<strong>the</strong> shelf edge is dominated by shale, but<br />
a sandy interval in a well in South <strong>Texas</strong><br />
exhibits an upward-fining sand body<br />
approximately 100 feet thick. This suggests<br />
that sandy sediment bypassed <strong>the</strong><br />
delta and was carried by channels across<br />
<strong>the</strong> slope.<br />
The predominance <strong>of</strong> fluvial facies in<br />
<strong>the</strong> outcrop area <strong>of</strong> <strong>the</strong> Lower Yegua unit<br />
would be expected to impart a strong<br />
dip-oriented bias in fluid flow, with<br />
only localized outcropping sand bodies<br />
to receive recharge. Deeper portions <strong>of</strong><br />
<strong>the</strong> aquifer in <strong>the</strong> Houston Embayment<br />
will also probably have a dip-oriented<br />
grain, impressed upon it by <strong>the</strong> fluvially<br />
dominated deltaic facies and apparent<br />
dip-oriented incised channels on <strong>the</strong><br />
shelf and slope. Communication with<br />
higher salinity areas <strong>of</strong> <strong>the</strong> aquifer and<br />
with basinal fluid might be expected to<br />
be significant, but downdip faulting may<br />
limit basinal driving pressures. Downdip<br />
deposits across <strong>the</strong> San Marcos Arch are<br />
limited and do not extend far downdip. In<br />
South <strong>Texas</strong>, <strong>the</strong> apparent dominance <strong>of</strong><br />
wave-influenced deposition is expected<br />
to impart a more strike-oriented grain<br />
to fluid flow in <strong>the</strong> deeper subsurface.<br />
Progradation in far South <strong>Texas</strong> <strong>of</strong> deltas<br />
to and over <strong>the</strong> shelf edge have <strong>the</strong><br />
possibility <strong>of</strong> increasing communication<br />
with deep basinal fluid regimes, especially<br />
because <strong>of</strong> locally steeper dips.<br />
However, <strong>the</strong> abundance <strong>of</strong> faults <strong>of</strong> more<br />
than 300 feet <strong>of</strong> throw for strike distances<br />
<strong>of</strong> 10 to 20 miles in <strong>the</strong> subsurface may<br />
act, especially locally, to impede such<br />
communication.<br />
Fluvial sand bodies encountered in<br />
outcrop are expected to have high horizontal<br />
hydraulic conductivities and,<br />
internally, low to moderate vertical<br />
conductivities. Fluvial sand bodies in<br />
South <strong>Texas</strong> may have been influenced<br />
by a more arid climate, producing bedload-dominated<br />
rivers, <strong>the</strong> deposits <strong>of</strong><br />
which will be coarser grained and more<br />
internally heterogeneous. Such deposits<br />
would have very high lateral conductivity<br />
and moderate to good vertical conductivity.<br />
Fluvially dominated deltaic<br />
sands <strong>of</strong> <strong>the</strong> Houston Embayment will<br />
likely have slightly lower lateral conductivities<br />
and perhaps significantly lower<br />
effective vertical conductivity because<br />
<strong>of</strong> an increase in interbedded clay and<br />
mud. Distal deltaic and shelf facies can<br />
be expected to have progressively lower,<br />
respectively, lateral conductivity because<br />
<strong>of</strong> reduced grain size and reduced vertical<br />
conductivity because <strong>of</strong> increasingly<br />
laterally continuous mud and clay layers.<br />
Wave-modified or -dominated deltas<br />
from <strong>the</strong> San Marcos Arch southward<br />
would be expected to have finer grain<br />
size but better sorting and less interbedded<br />
mud and clay, resulting in moderate<br />
to high lateral conductivity and moderate<br />
to high vertical conductivity.<br />
6.4.2.2<br />
<strong>Upper</strong> Yegua unit<br />
Sand thickness in <strong>the</strong> <strong>Upper</strong> Yegua<br />
unit outcrop area (Figure 6-9) generally<br />
exceeds 10 feet, except in <strong>the</strong> Rio<br />
Grande Embayment where sand is limited<br />
to very narrow dip-oriented bodies.<br />
Thicknesses <strong>of</strong> more than 200 feet<br />
are common in <strong>the</strong> outcrop area <strong>of</strong> <strong>the</strong><br />
Houston Embayment, and across <strong>the</strong><br />
San Marcos Arch, outcrop areas may<br />
contain as much as 400 feet <strong>of</strong> sand. In<br />
<strong>the</strong> subsurface, broad regions greater<br />
than 200 feet in thickness occur in<br />
130 <strong>Texas</strong> Water Development Board <strong>Report</strong> <strong>374</strong>
Leon<br />
Houston<br />
San<br />
Cherokee Nacogdoches<br />
Augustine<br />
Angelina<br />
Sabine<br />
Caldwell<br />
Bastrop<br />
Robertson<br />
Milam<br />
Brazos<br />
Burleson<br />
Lee<br />
Washington<br />
Austin<br />
Fayette<br />
Trinity<br />
Madison<br />
Newton<br />
Tyler Jasper<br />
Walker<br />
Polk<br />
Grimes<br />
San Jacinto<br />
Hardin<br />
Montgomery<br />
Liberty<br />
Orange<br />
Jefferson<br />
Waller<br />
Chambers<br />
Harris<br />
Guadalupe<br />
Colorado<br />
Fort Bend<br />
Wilson<br />
Gonzales<br />
De Witt<br />
Lavaca<br />
Wharton<br />
Brazoria<br />
Galveston<br />
Atascosa<br />
Jackson<br />
Frio<br />
Karnes<br />
Victoria<br />
Matagorda<br />
Goliad<br />
Calhoun<br />
La Salle<br />
McMullen<br />
Live Oak<br />
Bee<br />
Refugio<br />
<strong>Upper</strong> Yegua net sand thickness (feet)<br />
Jim Wells<br />
San Patricio<br />
Aransas<br />
0–50<br />
51–100<br />
301–350<br />
351– 400<br />
Webb<br />
Duval<br />
Nueces<br />
101–150<br />
401– 450<br />
Kleberg<br />
151–200<br />
451–500<br />
201–250<br />
501–550<br />
Zapata<br />
Jim Hogg<br />
Brooks<br />
Kenedy<br />
251–300 551–600<br />
Well locations<br />
Active boundary<br />
Starr<br />
Hidalgo<br />
Willacy<br />
County boundaries<br />
Cameron<br />
0 20 40<br />
Miles<br />
State line<br />
Gulf <strong>of</strong> Mexico<br />
Figure 6-9. Net sand thickness <strong>of</strong> <strong>Upper</strong> Yegua unit (Knox and o<strong>the</strong>rs, 2007).<br />
<strong>the</strong> Houston Embayment, reaching a<br />
maximum <strong>of</strong> more than 400 feet near<br />
<strong>the</strong> junction <strong>of</strong> Liberty and San Jacinto<br />
counties. A strike-oriented sand exceeding<br />
350 feet in thickness stretches from<br />
near <strong>the</strong> outcrop across <strong>the</strong> San Marcos<br />
Arch into <strong>the</strong> subsurface <strong>of</strong> <strong>the</strong><br />
Rio Grande Embayment (Figure 6-9),<br />
emerging in outcrop in far South <strong>Texas</strong>.<br />
A maximum thickness <strong>of</strong> 575 feet was<br />
encountered in <strong>the</strong> subsurface <strong>of</strong> eastern<br />
Starr County. Shales in <strong>the</strong> updip<br />
area may contain thin (5 feet) to thick<br />
(50 feet) upward-fining sand interbeds,<br />
whereas downdip shales commonly<br />
occur in <strong>the</strong> upper part <strong>of</strong> <strong>the</strong> unit, may<br />
<strong>Texas</strong> Water Development Board <strong>Report</strong> <strong>374</strong> 131
0 10 20 40 60<br />
Miles<br />
State line<br />
Shelf edge<br />
Yegua-Jackson outcrop<br />
County boundaries<br />
Well locations<br />
Sediment input axis (Size<br />
relative to sediment volume)<br />
Facies<br />
Deltaic/Delta front/Strand plain<br />
Wave-dominated delta<br />
Delta margin < 100'<br />
Fluvial<br />
Floodplain<br />
Slope<br />
Shelf-edge delta<br />
Shelf/Slope sand > 100'<br />
Figure 6-10. <strong>Upper</strong> Yegua depositional facies map (Knox and o<strong>the</strong>rs, 2007).<br />
be several hundred feet thick, and may<br />
contain thin (
It is extremely likely, assuming <strong>the</strong> shelfedge<br />
position is accurate, that abundant<br />
sand bypassed deltas near <strong>the</strong> shelf edge<br />
and was deposited on and carried across<br />
<strong>the</strong> slope.<br />
As with <strong>the</strong> Lower Yegua unit, <strong>the</strong><br />
predominance <strong>of</strong> fluvial facies in <strong>the</strong><br />
outcrop area <strong>of</strong> <strong>the</strong> <strong>Upper</strong> Yegua unit in<br />
<strong>the</strong> Rio Grande Embayment would be<br />
expected to impart a strong dip-oriented<br />
bias in fluid flow, with only localized outcropping<br />
sand bodies receiving recharge.<br />
Outcrops as well as deeper portions <strong>of</strong><br />
<strong>the</strong> aquifer in <strong>the</strong> Houston Embayment<br />
will also probably have a dip-oriented<br />
grain, impressed upon <strong>the</strong>m by <strong>the</strong><br />
fluvially dominated deltaic facies and<br />
apparent dip-oriented incised channels<br />
on <strong>the</strong> shelf and slope. Communication<br />
with higher salinity areas <strong>of</strong> <strong>the</strong> aquifer<br />
and with basinal fluid might be expected<br />
to be significant, but downdip faulting<br />
may limit basinal driving pressures. Sand<br />
deposits across <strong>the</strong> San Marcos Arch<br />
are significant near outcrop but do not<br />
extend far downdip. The linear strikeparallel<br />
nature <strong>of</strong> areas <strong>of</strong> thick sand<br />
suggest deposition in a wave-modified<br />
or -dominated deltaic or strand-plain<br />
setting, which is expected to impart a<br />
strike-oriented grain governing fluid<br />
flow. These trends continue into South<br />
<strong>Texas</strong>, where a similar strike-oriented<br />
bias would be expected. Progradation in<br />
far South <strong>Texas</strong> <strong>of</strong> deltas to and over <strong>the</strong><br />
shelf edge have <strong>the</strong> possibility <strong>of</strong> increasing<br />
communication with deep basinal<br />
fluid regimes, especially because dips in<br />
<strong>the</strong> outcrop belt are markedly steeper.<br />
However, <strong>the</strong> abundance <strong>of</strong> faults <strong>of</strong><br />
more than 300 feet <strong>of</strong> throw for strike<br />
distances <strong>of</strong> 10 to 20 miles in <strong>the</strong> subsurface<br />
may act, especially locally, to impede<br />
such communication.<br />
Fluvial sand bodies encountered in <strong>the</strong><br />
outcrops <strong>of</strong> South <strong>Texas</strong> are expected to<br />
have very high horizontal hydraulic conductivities<br />
and moderate to good vertical<br />
conductivities, for reasons cited above,<br />
whereas those in <strong>the</strong> Houston Embayment<br />
will likely have high horizontal and<br />
low to moderate vertical conductivities.<br />
Fluvially dominated deltaic sands <strong>of</strong> <strong>the</strong><br />
Houston Embayment will likely have<br />
slightly lower lateral conductivities and<br />
perhaps significantly lower effective vertical<br />
conductivity because <strong>of</strong> decreased<br />
grain size compared with fluvial sands<br />
and an increase in interbedded clay and<br />
mud. Distal deltaic and shelf facies can<br />
be expected to have progressively lower,<br />
respectively, lateral conductivity because<br />
<strong>of</strong> reduced grain size and reduced vertical<br />
conductivity because <strong>of</strong> increasingly<br />
laterally continuous mud and clay layers.<br />
Wave-modified or -dominated deltas<br />
from <strong>the</strong> San Marcos Arch southward<br />
would be expected to have finer grain<br />
size but better sorting and less interbedded<br />
mud and clay, resulting in moderate<br />
to high lateral and vertical conductivity.<br />
Incised channels on <strong>the</strong> shelf and slope<br />
are expected to have moderate to high<br />
horizontal conductivity because <strong>of</strong> <strong>the</strong><br />
coarser nature <strong>of</strong> sediments commonly<br />
delivered during sea level lowstands, <strong>the</strong><br />
time at which such channels are most<br />
active. However, fill in <strong>the</strong>se channels<br />
may be complex, so horizontal conductivity<br />
orthogonal to channel axes may be<br />
significantly reduced, as would be vertical<br />
conductivities.<br />
6.4.2.3<br />
Lower Jackson unit<br />
Sand is a minority lithology in <strong>the</strong><br />
Lower Jackson interval. Sand thicknesses<br />
in <strong>the</strong> outcrop exceed 100 feet<br />
only in <strong>the</strong> sou<strong>the</strong>rn part <strong>of</strong> <strong>the</strong> Houston<br />
Embayment, <strong>the</strong> flanks <strong>of</strong> <strong>the</strong> San<br />
Marcos Arch, and far South <strong>Texas</strong>.<br />
Sand is broadly present in outcrops <strong>of</strong><br />
<strong>the</strong> nor<strong>the</strong>rn Houston Embayment but<br />
is generally thin, being less than 100<br />
feet thick. In <strong>the</strong> main part <strong>of</strong> <strong>the</strong> Rio<br />
Grande Embayment, sand is present at<br />
outcrop only in narrow dip-oriented<br />
bodies. In <strong>the</strong> subsurface <strong>of</strong> <strong>the</strong> Houston<br />
Embayment, rounded sand regions<br />
20 to 40 miles across occur where sand<br />
thickness exceeds 150 feet. These thick<br />
<strong>Texas</strong> Water Development Board <strong>Report</strong> <strong>374</strong> 133
areas give way downdip to narrower<br />
(10–20 mile wide), dip-oriented regions<br />
approximately 100 feet thick. Areas<br />
between <strong>the</strong>se rounded regions are narrow<br />
(5 miles) areas where sand may be<br />
less than 50 feet thick. From <strong>the</strong> south<br />
flank <strong>of</strong> <strong>the</strong> San Marcos Arch through<br />
<strong>the</strong> Rio Grande Embayment, a strikeparallel<br />
region approximately 30 miles<br />
wide exists where sand thickness <strong>of</strong>ten<br />
exceeds 100 feet and locally exceeds<br />
200 feet. Downdip <strong>of</strong> this region, sand<br />
thickness tapers rapidly to zero. In far<br />
South <strong>Texas</strong>, an area where sand thickness<br />
exceeds 300 feet locally extends<br />
from <strong>the</strong> outcrop area in a dip direction<br />
to <strong>the</strong> downdip limit <strong>of</strong> control.<br />
In <strong>the</strong> updip regions <strong>of</strong> <strong>the</strong> Lower<br />
Jackson unit, as in <strong>the</strong> Yegua, <strong>the</strong> depositional<br />
facies are interpreted as fluvial<br />
axes separated by floodplain deposits<br />
(defined as having less than 50 feet <strong>of</strong><br />
net sand). Sand-rich regions across <strong>the</strong><br />
middle <strong>of</strong> <strong>the</strong> study area are interpreted<br />
as deltaic deposits fed by <strong>the</strong> updip fluvial<br />
systems. Areas between fluvial and<br />
deltaic settings but containing less than<br />
50 feet <strong>of</strong> net sand and dominated by thin<br />
upward-coarsening sands are interpreted<br />
as delta margins. Areas downdip <strong>of</strong> deltaic<br />
regions and containing between zero<br />
and 50 feet <strong>of</strong> net sand are interpreted<br />
as distal deltaic facies. Deltaic centers in<br />
<strong>the</strong> sou<strong>the</strong>rn part <strong>of</strong> <strong>the</strong> study area have<br />
been interpreted by Fisher and o<strong>the</strong>rs<br />
(1970) as being more wave-dominated<br />
deltas, or even strand-plain/barrier bar<br />
systems, as suggested by strike alignment<br />
and <strong>the</strong> dominance <strong>of</strong> blocky sand bodies.<br />
A similar interpretation is made here,<br />
and it is noted that more strike-aligned<br />
sand bodies result in a decrease <strong>of</strong> sand<br />
in <strong>the</strong> outcrop direction. Downdip shaledominated<br />
intervals are more abundant<br />
in <strong>the</strong> Lower Jackson than in ei<strong>the</strong>r <strong>of</strong><br />
<strong>the</strong> Yegua units, indicating a significantly<br />
higher relative sea level, possibly related<br />
to decreased sediment supply. Thick sand<br />
accumulations at <strong>the</strong> shelf edge containing<br />
blocky sands or interbedded sand and<br />
shale are again interpreted as shelf-edge<br />
deltas, which feed sand down across <strong>the</strong><br />
slope in narrow dip-oriented channels.<br />
As with Yegua units, <strong>the</strong> predominance<br />
<strong>of</strong> fluvial facies in <strong>the</strong> outcrop<br />
area <strong>of</strong> <strong>the</strong> Lower Jackson unit in <strong>the</strong><br />
Rio Grande Embayment and parts <strong>of</strong> <strong>the</strong><br />
Houston Embayment would be expected<br />
to impart a strong dip-oriented bias in<br />
fluid flow. Fluvial axes in <strong>the</strong> Rio Grande<br />
Embayment are narrow, whereas those in<br />
<strong>the</strong> Houston Embayment are broad and<br />
common, with concomitant differences<br />
in recharge opportunity. Outcrops, as<br />
well as deeper portions <strong>of</strong> <strong>the</strong> aquifer in<br />
<strong>the</strong> Houston Embayment, will also probably<br />
have a dip-oriented grain, impressed<br />
upon <strong>the</strong>m by <strong>the</strong> fluvially dominated<br />
deltaic facies and apparent dip-oriented<br />
incised channels on <strong>the</strong> shelf and slope.<br />
Communication with higher salinity<br />
areas <strong>of</strong> <strong>the</strong> aquifer and with basinal fluid<br />
might be expected to be significant, but<br />
downdip faulting <strong>of</strong> <strong>the</strong> few narrow shelf<br />
channels may strongly limit basinal driving<br />
pressures. Sand deposits across <strong>the</strong><br />
San Marcos Arch are significant near<br />
outcrop but do not extend far downdip.<br />
The linear strike-parallel nature <strong>of</strong><br />
areas <strong>of</strong> thick sand suggest deposition in<br />
a wave-modified or -dominated deltaic<br />
or strand-plain setting, which is expected<br />
to impart a strike-oriented grain governing<br />
fluid flow. These trends continue<br />
into South <strong>Texas</strong>, where a similar strikeoriented<br />
bias would be expected. Progradation<br />
in far South <strong>Texas</strong> <strong>of</strong> deltas to and<br />
over <strong>the</strong> shelf edge have <strong>the</strong> possibility<br />
<strong>of</strong> increasing communication with deep<br />
basinal fluid regimes, especially because<br />
dips in <strong>the</strong> outcrop belt are markedly<br />
steeper. However, <strong>the</strong> abundance <strong>of</strong><br />
faults <strong>of</strong> more than 300 feet <strong>of</strong> throw for<br />
strike distances <strong>of</strong> 10 to 20 miles in <strong>the</strong><br />
subsurface may act, especially locally, to<br />
impede such communication.<br />
Fluvial sand bodies encountered in<br />
<strong>the</strong> outcrops <strong>of</strong> South <strong>Texas</strong> are expected<br />
to have very high horizontal hydraulic<br />
conductivities and moderate to good<br />
vertical conductivities, for reasons cited<br />
above, whereas those in <strong>the</strong> Houston<br />
134 <strong>Texas</strong> Water Development Board <strong>Report</strong> <strong>374</strong>
Embayment will likely have high horizontal<br />
and low to moderate vertical conductivities.<br />
Fluvially dominated deltaic<br />
sands <strong>of</strong> <strong>the</strong> Houston Embayment will<br />
likely have slightly lower lateral conductivities<br />
and perhaps significantly lower<br />
effective vertical conductivity because<br />
<strong>of</strong> decreased grain size compared with<br />
fluvial sands and an increase in interbedded<br />
clay and mud. Distal deltaic<br />
and shelf facies can be expected to have<br />
progressively lower, respectively, lateral<br />
conductivity because <strong>of</strong> reduced grain<br />
size and reduced vertical conductivity,<br />
which results from increasingly laterally<br />
continuous mud and clay layers. Wavemodified<br />
or -dominated deltas from <strong>the</strong><br />
San Marcos Arch southward would be<br />
expected to have finer grain size but better<br />
sorting and less interbedded mud and<br />
clay, resulting in moderate to high lateral<br />
conductivity and moderate to high vertical<br />
conductivity. Incised channels on<br />
<strong>the</strong> shelf and slope are expected to have<br />
moderate to high horizontal conductivity<br />
because <strong>of</strong> <strong>the</strong> coarser nature <strong>of</strong> sediments<br />
commonly delivered during sea<br />
level lowstands, <strong>the</strong> time at which such<br />
channels are most active. However, fill in<br />
<strong>the</strong>se channels may be complex, so horizontal<br />
conductivity orthogonal to channel<br />
axes may be significantly reduced, as<br />
would be vertical conductivities.<br />
6.4.2.4<br />
<strong>Upper</strong> Jackson unit<br />
Shale dominates <strong>the</strong> <strong>Upper</strong> Jackson<br />
interval, with thin sands (most less than<br />
30 feet thick) occurring in <strong>the</strong> middle<br />
or upper parts <strong>of</strong> <strong>the</strong> unit. More than<br />
50 feet <strong>of</strong> sand is encountered in wide<br />
areas <strong>of</strong> <strong>the</strong> outcrop area, with <strong>the</strong><br />
exception <strong>of</strong> <strong>the</strong> nor<strong>the</strong>rnmost Houston<br />
Embayment and regions <strong>of</strong> <strong>the</strong> Rio<br />
Grande Embayment. Areas <strong>of</strong> unusually<br />
thick sand occur in <strong>the</strong> central Houston<br />
Embayment (Figure 6-11) where<br />
accumulations exceed 200 feet and far<br />
South <strong>Texas</strong> where <strong>the</strong>y locally exceed<br />
150 feet. A strike-oriented trend <strong>of</strong> thick<br />
sand extends from <strong>the</strong> central Houston<br />
Embayment where it can exceed 300<br />
feet down across <strong>the</strong> San Marcos Arch<br />
and through <strong>the</strong> Rio Grande Embayment<br />
where it can reach more than 200<br />
feet. This belt, which is approximately<br />
30 miles wide and begins at <strong>the</strong> outcrop<br />
or just downdip (Figure 6-11), is locally<br />
interrupted by breaks 5 to 20 miles<br />
wide in which sand accumulation is less<br />
than 100 feet. In <strong>the</strong> sou<strong>the</strong>rn Houston<br />
Embayment, dip-oriented fingers <strong>of</strong><br />
20 to 40 miles in width extend downdip<br />
to <strong>the</strong> limit <strong>of</strong> control. Across <strong>the</strong><br />
San Marcos Arch and into <strong>the</strong> nor<strong>the</strong>rn<br />
Rio Grande Embayment, broad regions<br />
where sand is absent lie downdip <strong>of</strong> <strong>the</strong><br />
sand belt.<br />
The interpreted facies map for <strong>the</strong><br />
<strong>Upper</strong> Jackson unit is shown in Figure<br />
6-12. As in <strong>the</strong> Yegua, updip regions are<br />
interpreted as fluvial axes separated by<br />
floodplain deposits (defined as having<br />
less than 50 feet <strong>of</strong> net sand). Sand-rich<br />
regions across <strong>the</strong> middle <strong>of</strong> <strong>the</strong> study<br />
area are interpreted as deltaic deposits<br />
fed by <strong>the</strong> updip fluvial systems. Areas<br />
between fluvial and deltaic settings but<br />
containing less than 50 feet <strong>of</strong> net sand<br />
and dominated by thin upward-coarsening<br />
sands are interpreted as delta margins.<br />
Areas downdip <strong>of</strong> deltaic regions<br />
and containing from less than 50 feet <strong>of</strong><br />
net sand to zero sand are interpreted as<br />
distal deltaic facies. Areas updip <strong>of</strong> <strong>the</strong><br />
shelf edge having no sand are mapped<br />
as “shelf” facies.<br />
Deltaic centers in <strong>the</strong> sou<strong>the</strong>rn part<br />
<strong>of</strong> <strong>the</strong> study area, as in <strong>the</strong> Lower Jackson<br />
layer, appear strongly wave influenced,<br />
especially compared to deltas in<br />
<strong>the</strong> nor<strong>the</strong>rn part <strong>of</strong> <strong>the</strong> study area in<br />
which patterns <strong>of</strong> thick sands are more<br />
dip-oriented and are likely more fluvially<br />
dominated. Downdip shale-dominated<br />
intervals are less abundant in <strong>the</strong> <strong>Upper</strong><br />
Jackson than in <strong>the</strong> Lower Jackson. This<br />
reinvigorated progradation (although still<br />
weaker than <strong>the</strong> Lower Yegua) indicates<br />
a lower relative sea level, possibly related<br />
to increased sediment supply. Thick<br />
<strong>Texas</strong> Water Development Board <strong>Report</strong> <strong>374</strong> 135
Leon<br />
Cherokee<br />
San<br />
Nacogdoches<br />
Augustine<br />
Houston<br />
Sabine<br />
Angelina<br />
Caldwell<br />
Bastrop<br />
Robertson<br />
Milam<br />
Brazos<br />
Burleson<br />
Lee<br />
Washington<br />
Austin<br />
Fayette<br />
Trinity<br />
Madison<br />
Newton<br />
Tyler<br />
Polk<br />
Jasper<br />
Walker<br />
Grimes<br />
San Jacinto<br />
Hardin<br />
Montgomery<br />
Liberty<br />
Orange<br />
Jefferson<br />
Waller<br />
Chambers<br />
Harris<br />
Guadalupe<br />
Colorado<br />
Fort Bend<br />
Wilson<br />
Gonzales<br />
De Witt<br />
Lavaca<br />
Wharton<br />
Brazoria<br />
Galveston<br />
Frio<br />
Atascosa<br />
Karnes<br />
Victoria<br />
Jackson<br />
Matagorda<br />
<strong>Upper</strong> Jackson net<br />
sand thickness (feet)<br />
La Salle<br />
McMullen<br />
Live Oak<br />
Bee<br />
Goliad<br />
Refugio<br />
Calhoun<br />
0–50<br />
51–100<br />
101–150<br />
Jim Wells<br />
San Patricio<br />
Aransas<br />
151–200<br />
201–250<br />
Webb<br />
Duval<br />
Nueces<br />
251–300<br />
Kleberg<br />
301–350<br />
351–400<br />
Zapata<br />
Jim Hogg<br />
Brooks<br />
Kenedy<br />
401–450<br />
Well locations<br />
Active boundary<br />
Starr<br />
Hidalgo<br />
Willacy<br />
0 20 40<br />
County boundaries<br />
State line<br />
Cameron<br />
Miles<br />
Gulf <strong>of</strong> Mexico<br />
Figure 6-11. Net sand thickness <strong>of</strong> <strong>Upper</strong> Jackson unit (Knox and o<strong>the</strong>rs, 2007).<br />
sand accumulations at <strong>the</strong> shelf edge<br />
containing blocky sands or interbedded<br />
sand and shale are again interpreted as<br />
shelf-edge deltas, which feed sand down<br />
across <strong>the</strong> slope in narrow dip-oriented<br />
channels. However, in <strong>the</strong> <strong>Upper</strong> Jackson,<br />
<strong>the</strong> sou<strong>the</strong>rn wave-dominated delta has<br />
built to, or past, <strong>the</strong> shelf edge, creating a<br />
strike-aligned shelf-edge sand body.<br />
Fluvial facies in <strong>the</strong> sou<strong>the</strong>rn half <strong>of</strong><br />
<strong>the</strong> outcrop area <strong>of</strong> <strong>the</strong> <strong>Upper</strong> Jackson<br />
unit are expected to impart a strong diporiented<br />
bias in fluid flow, as would fluvial<br />
and fluvially dominated deltaic deposits<br />
136 <strong>Texas</strong> Water Development Board <strong>Report</strong> <strong>374</strong>
0 10 20 40 60<br />
Miles<br />
State line<br />
Shelf edge<br />
Yegua-Jackson outcrop<br />
County boundaries<br />
Well locations<br />
Sediment input axis (Size<br />
relative to sediment volume)<br />
Facies<br />
Fluvial<br />
Floodplain < 50'<br />
Deltaic/Delta front/Strand plain<br />
Distal delta<br />
Delta margin < 50'<br />
Shelf<br />
Shelf channel<br />
Slope<br />
Shelf/Slope sand > 50'<br />
Figure 6-12. <strong>Upper</strong> Jackson depositional facies map (Knox and o<strong>the</strong>rs, 2007).<br />
in <strong>the</strong> nor<strong>the</strong>rn half <strong>of</strong> <strong>the</strong> outcrop area.<br />
Such a bias would continue into <strong>the</strong><br />
subsurface in <strong>the</strong> Houston Embayment,<br />
especially in <strong>the</strong> sou<strong>the</strong>rn end <strong>of</strong> that<br />
area where thick sands reach <strong>the</strong> shelf<br />
edge. Communication with higher salinity<br />
areas <strong>of</strong> <strong>the</strong> aquifer and with basinal<br />
fluid might be expected to be significant,<br />
but downdip faulting <strong>of</strong> broad delta lobes<br />
and narrow incised channels may limit<br />
basinal driving pressures. Downdip <strong>of</strong><br />
outcrops in <strong>the</strong> sou<strong>the</strong>rn half <strong>of</strong> <strong>the</strong><br />
study area, linear strike-parallel areas<br />
<strong>of</strong> wave-modified or -dominated deltaic<br />
or strand-plain sands are expected to<br />
impart a strike-oriented grain governing<br />
fluid flow. Because <strong>the</strong>se deltas reach<br />
<strong>the</strong> shelf edge, <strong>the</strong>re may be many narrow<br />
incised channels that cross <strong>the</strong> slope, in<br />
addition to <strong>the</strong> broad area mapped in<br />
Hidalgo County that does so. Communication<br />
with deep basinal fluid regimes<br />
would be expected, especially because <strong>of</strong><br />
<strong>the</strong> steep dips in <strong>the</strong> outcrop area <strong>of</strong> far<br />
<strong>Texas</strong> Water Development Board <strong>Report</strong> <strong>374</strong> 137
South <strong>Texas</strong>. However, <strong>the</strong> abundance <strong>of</strong><br />
faults <strong>of</strong> more than 300 feet <strong>of</strong> throw for<br />
strike distances <strong>of</strong> 10 to 20 miles in <strong>the</strong><br />
subsurface may act, especially locally, to<br />
impede such communication.<br />
Fluvial sand bodies encountered in<br />
<strong>the</strong> outcrops <strong>of</strong> South <strong>Texas</strong> are expected<br />
to have very high horizontal hydraulic<br />
conductivities and moderate to good<br />
vertical conductivities, for reasons cited<br />
above, whereas those in <strong>the</strong> Houston<br />
Embayment will likely have high horizontal<br />
and low to moderate vertical conductivities.<br />
Fluvially dominated deltaic<br />
sands <strong>of</strong> <strong>the</strong> Houston Embayment will<br />
likely have slightly lower lateral conductivities<br />
and perhaps significantly lower<br />
effective vertical conductivity because<br />
<strong>of</strong> decreased grain size compared with<br />
fluvial sands and an increase in interbedded<br />
clay and mud. Distal deltaic and shelf<br />
facies can be expected to have progressively<br />
lower, respectively, lateral conductivity<br />
because <strong>of</strong> reduced grain size and<br />
reduced vertical conductivity because<br />
<strong>of</strong> increasingly laterally continuous mud<br />
and clay layers. Wave-modified or -dominated<br />
deltas from <strong>the</strong> San Marcos Arch<br />
southward would be expected to have<br />
finer grain size but better sorting and less<br />
interbedded mud and clay, resulting in<br />
moderate to high lateral conductivity and<br />
moderate to high vertical conductivity.<br />
Incised channels on <strong>the</strong> shelf and slope<br />
are expected to have moderate to high<br />
horizontal conductivity because <strong>of</strong> <strong>the</strong><br />
coarser nature <strong>of</strong> sediments commonly<br />
delivered during sea level lowstands, <strong>the</strong><br />
time at which such channels are most<br />
active. However, fill in <strong>the</strong>se channels<br />
may be complex, so horizontal conductivity<br />
orthogonal to channel axes may be<br />
significantly reduced, as would be vertical<br />
conductivities.<br />
6.5<br />
Benefits to a<br />
chronostratigraphic<br />
approach<br />
The stratigraphic approach used in<br />
this study is slightly different from that<br />
<strong>of</strong> previous aquifer studies. Emphasis<br />
is placed upon age-specific horizons<br />
bounding or within <strong>the</strong> aquifer that are<br />
regional in nature and prone to aquitard-like<br />
behavior. This methodology is<br />
known as chronostratigraphy. Research<br />
related to <strong>the</strong> cyclic nature <strong>of</strong> deposition<br />
over <strong>the</strong> past several decades (for example,<br />
Hays and o<strong>the</strong>rs, 1976; Galloway,<br />
1989; Mitchum and VanWagoner, 1991;<br />
and Tyler and Finley, 1991) has established<br />
<strong>the</strong> importance <strong>of</strong> this approach,<br />
especially in terms <strong>of</strong> evaluating fluid<br />
flow in <strong>the</strong> subsurface. The method is<br />
critical to understanding <strong>the</strong> structure<br />
and internal heterogeneity and, thus,<br />
<strong>the</strong> hydrologic behavior <strong>of</strong> <strong>the</strong> aquifer.<br />
This, in turn, leads to improved model<br />
accuracy and aquifer predictability.<br />
Unlike lithostratigraphic correlation,<br />
which relies on lithologic changes<br />
to subdivide sedimentary intervals,<br />
chronostratigraphic correlation relies<br />
on recognition <strong>of</strong> depositional surfaces<br />
formed at critical times in a depositional<br />
cycle (Figure 6-13). During <strong>the</strong>se relatively<br />
brief periods <strong>of</strong> time, broad areas<br />
<strong>of</strong> <strong>the</strong> coast are undergoing similar<br />
Figure 6-13. Depositional cycles (modified from Galloway, 1989).<br />
138 <strong>Texas</strong> Water Development Board <strong>Report</strong> <strong>374</strong>
depositional processes. It is now understood<br />
that global sea level has risen and<br />
fallen by as much as 450 feet over time<br />
spans <strong>of</strong> approximately 100,000 years.<br />
At sea level “highstand” times, deposition<br />
<strong>of</strong> fine-grained deposits (future<br />
aquitards) cover a large portion <strong>of</strong> <strong>the</strong><br />
sand-rich sediments deposited during<br />
<strong>the</strong> last “lowstand” (future aquifer).<br />
Deposition at maximum highstand is<br />
idealized as a stratigraphic surface type<br />
known as a maximum flooding surface,<br />
and <strong>the</strong> associated fine-grained deposits<br />
are especially useful in defining aquifer<br />
framework in <strong>the</strong> subsurface because<br />
<strong>the</strong>y <strong>of</strong>ten have a characteristic signature<br />
on geophysical logs. The Tertiary Gulf<br />
Coast interval is one <strong>of</strong> <strong>the</strong> areas in which<br />
<strong>the</strong>se surfaces are expressed well in logs.<br />
Because <strong>the</strong> causative mechanism <strong>of</strong><br />
high sea level is global in nature, <strong>the</strong>se<br />
deposits can be traced across a regional<br />
extent. The intervals above and below<br />
<strong>the</strong>se fine-grained deposits are sand-rich<br />
packages deposited under a common<br />
set <strong>of</strong> conditions, including positions <strong>of</strong><br />
major sediment input. Predictive methods<br />
can <strong>the</strong>n be applied to evaluating<br />
<strong>the</strong> geographic distribution <strong>of</strong> sand-rich<br />
areas within <strong>the</strong> package. These predictive<br />
methods are based on observations<br />
<strong>of</strong> modern depositional processes and<br />
systems such as rivers and deltas. The<br />
methods rely on <strong>the</strong> commonality <strong>of</strong><br />
depositional conditions within <strong>the</strong> time<br />
frame <strong>of</strong> <strong>the</strong> package, and <strong>the</strong> location<br />
and style <strong>of</strong> sand-rich deposition will<br />
vary from package to package.<br />
Beyond <strong>the</strong> issue <strong>of</strong> aquifer layering<br />
is <strong>the</strong> distribution <strong>of</strong> depositional systems<br />
within an aquifer layer because it<br />
provides information on lateral heterogeneity<br />
<strong>of</strong> <strong>the</strong> layer. This is governed<br />
not only by sand thickness distribution<br />
but by depositional facies distribution.<br />
Sand-rich sediments deposited in different<br />
settings will have different hydrologic<br />
properties because <strong>of</strong> differing grain size,<br />
sorting, sand body size and shape, and<br />
degree <strong>of</strong> interbedding <strong>of</strong> silts and muds.<br />
This affects sediment properties such as<br />
horizontal and vertical conductivity and<br />
storativity that might be measured at a<br />
wellbore. The internal architecture <strong>of</strong> an<br />
aquifer layer, governed by <strong>the</strong> characteristics<br />
<strong>of</strong> its depositional system setting,<br />
creates an overlay <strong>of</strong> fluid flow behavior<br />
on top <strong>of</strong> typical considerations such as<br />
head (fluid pressure) distribution. A lateral<br />
(along-strike) flow element to aquifer<br />
behavior may be impressed upon an<br />
aquifer because <strong>of</strong> deposition <strong>of</strong> large<br />
areas <strong>of</strong> highly conductive sands in a<br />
wave-dominated, shore-parallel delta.<br />
Conversely, dip-oriented sand-rich<br />
lowstand fluvial channels may provide<br />
a localized hydraulic conduit between<br />
saline-rich basinal sands and shallower<br />
freshwater sands.<br />
6.6<br />
Challenges to a<br />
chronostratigraphic<br />
approach<br />
Outcrop mapping <strong>of</strong> geologic units is,<br />
by necessity, based on lithostratigraphy.<br />
The maximum flooding surfaces<br />
that are apparent in well logs cannot be<br />
readily identified in outcrop. Additionally,<br />
some stratigraphic relationships<br />
that are clear in <strong>the</strong> subsurface are more<br />
difficult to identify in outcrop, leading<br />
to discrepancies in <strong>the</strong> placement <strong>of</strong><br />
major formational boundaries. This is<br />
significant because outcrop boundaries<br />
for <strong>the</strong> Yegua-Jackson Aquifer are used<br />
to define <strong>the</strong> aquifer extent, but maximum<br />
flooding surfaces were used to<br />
subdivide <strong>the</strong> aquifer in <strong>the</strong> subsurface.<br />
Such issues did arise in <strong>the</strong> Yegua-<br />
Jackson Aquifer study. Outcrop studies<br />
identified <strong>the</strong> base <strong>of</strong> <strong>the</strong> Yegua as<br />
<strong>the</strong> first appearance, stratigraphically,<br />
<strong>of</strong> major sand beds. Subsurface correlation<br />
traced <strong>the</strong> maximum flooding surface<br />
within <strong>the</strong> shale below <strong>the</strong> Yegua.<br />
Thus, an additional surface had to be<br />
created for <strong>the</strong> subsurface that followed<br />
<strong>the</strong> convention <strong>of</strong> <strong>the</strong> outcrop: <strong>the</strong> first<br />
occurrence <strong>of</strong> major sand beds. Differences<br />
also occurred at <strong>the</strong> top <strong>of</strong> <strong>the</strong> Jackson<br />
Group. This boundary lies within a<br />
<strong>Texas</strong> Water Development Board <strong>Report</strong> <strong>374</strong> 139
uniform-appearing sand-shale interval,<br />
and <strong>the</strong> boundary is difficult to follow<br />
in outcrop, especially where topography<br />
and vegetation limit <strong>the</strong> frequency <strong>of</strong><br />
outcrops. Subsurface correlations were<br />
determined to be more accurate, and<br />
<strong>the</strong> recommendation has been made to<br />
change <strong>the</strong> aquifer boundaries slightly<br />
in some areas.<br />
6.7<br />
Conclusions<br />
This paper summarizes <strong>the</strong> development<br />
<strong>of</strong> <strong>the</strong> structure and depositional<br />
framework for <strong>the</strong> Yegua-Jackson Aquifer<br />
in <strong>Texas</strong>. The aquifer exists predominantly<br />
in <strong>the</strong> outcrop or near-outcrop<br />
areas <strong>of</strong> <strong>the</strong> Yegua Formation and<br />
Jackson group. In <strong>Texas</strong>, this outcrop<br />
area stretches in a relatively thin band<br />
approximately parallel to <strong>the</strong> coastline<br />
from Starr County in <strong>the</strong> Rio Grande<br />
Valley to Sabine County in East <strong>Texas</strong><br />
and is thus bracketed by <strong>the</strong> Rio Grande<br />
River to <strong>the</strong> south and <strong>the</strong> Toledo Bend<br />
Reservoir (along <strong>the</strong> Sabine River) to<br />
<strong>the</strong> east. The width <strong>of</strong> this outcrop varies<br />
from less than 10 miles in Gonzales<br />
County to almost 40 miles in La Salle<br />
County, with an area <strong>of</strong> approximately<br />
11,000 square miles.<br />
This paper describes <strong>the</strong> development<br />
<strong>of</strong> a chronostratigraphic framework for<br />
<strong>the</strong> Yegua-Jackson Aquifer that spans its<br />
entire extent in <strong>Texas</strong>. A chronostratigraphic<br />
approach to mapping provides<br />
a consistent depositional framework<br />
for <strong>the</strong> geologic intervals composing<br />
<strong>the</strong> aquifer. The dominant controls on<br />
aquifer framework in terms <strong>of</strong> fluid flow<br />
characteristics result from <strong>the</strong> distribution<br />
<strong>of</strong> sedimentary processes, both geographically<br />
and through geologic time.<br />
Estimating aquifer framework and heterogeneity<br />
on <strong>the</strong> basis <strong>of</strong> outcrop and<br />
limited subsurface data requires a predictive<br />
approach founded on an understanding<br />
<strong>of</strong> <strong>the</strong> activities that built <strong>the</strong> aquifer.<br />
The concepts <strong>of</strong> chronostratigraphy and<br />
depositional systems provide that predictive<br />
capability.<br />
Unlike lithostratigraphic correlation,<br />
which relies on lithologic changes to<br />
subdivide sedimentary intervals, chronostratigraphic<br />
correlation relies on recognition<br />
<strong>of</strong> depositional surfaces formed<br />
at critical times in a depositional cycle.<br />
During <strong>the</strong>se relatively brief periods <strong>of</strong><br />
time, broad areas <strong>of</strong> <strong>the</strong> coast are undergoing<br />
similar depositional processes. At<br />
sea level highstand times, deposition <strong>of</strong><br />
fine-grained deposits (an aquitard) cover<br />
a large portion <strong>of</strong> <strong>the</strong> sand-rich sediments<br />
deposited during <strong>the</strong> last lowstand (an<br />
aquifer). These highstand times are represented<br />
by maximum flooding surfaces,<br />
and <strong>the</strong>ir associated fine-grained deposits<br />
are especially useful in defining aquifer<br />
framework because <strong>the</strong>y <strong>of</strong>ten have<br />
a characteristic signature on geophysical<br />
logs from wellbores. Thus, <strong>the</strong>se deposits<br />
can be traced across a regional extent<br />
in <strong>the</strong> subsurface. The intervals above<br />
and below <strong>the</strong>se fine-grained deposits<br />
are sand-rich packages deposited under<br />
a common set <strong>of</strong> conditions, including<br />
positions <strong>of</strong> major sediment input. Predictive<br />
methods for evaluating <strong>the</strong> geographic<br />
distribution <strong>of</strong> sand-rich areas<br />
within <strong>the</strong> package can <strong>the</strong>n be applied.<br />
These predictive methods are based on<br />
observations <strong>of</strong> modern depositional<br />
processes and systems such as rivers<br />
and deltas. These methods rely on <strong>the</strong><br />
commonality <strong>of</strong> depositional conditions<br />
within <strong>the</strong> time frame <strong>of</strong> <strong>the</strong> package,<br />
and <strong>the</strong> location and style <strong>of</strong> sand-rich<br />
deposition will vary from package to<br />
package.<br />
Four major chronostratigraphic units<br />
(third-order genetic units) were defined<br />
for <strong>the</strong> Yegua-Jackson Aquifer. These<br />
include, from <strong>the</strong> bottom upward, <strong>the</strong><br />
Lower Yegua, <strong>Upper</strong> Yegua, Lower Jackson,<br />
and <strong>Upper</strong> Jackson units, which each<br />
span one to two million years <strong>of</strong> deposition<br />
(third-order genetic units) and are <strong>of</strong><br />
appropriate scale for regional groundwater<br />
availability modeling (generally 400<br />
to 800 feet thick, thickening in <strong>the</strong> downdip<br />
direction). In addition to <strong>the</strong> development<br />
<strong>of</strong> <strong>the</strong> chronostratigraphic units,<br />
140 <strong>Texas</strong> Water Development Board <strong>Report</strong> <strong>374</strong>
five types <strong>of</strong> maps were developed for<br />
<strong>the</strong> four chronostratigraphic units. These<br />
are a structure map, an isopach map, a<br />
sand thickness map, a sand percent map,<br />
and a depositional facies map. These<br />
maps provide <strong>the</strong> necessary framework<br />
for future hydrogeologic studies within<br />
<strong>the</strong> aquifers, studies that may include<br />
groundwater availability model development.<br />
The results <strong>of</strong> this research provide<br />
conceptual constraints on regional<br />
model parameterization and will have<br />
<strong>the</strong> depositional framework necessary<br />
to evaluate characterization data and to<br />
apply interpolation techniques during<br />
calibration.<br />
As water resources in <strong>the</strong> state<br />
become more valuable and subject to<br />
greater use, it is expected that groundwater<br />
availability models will have to<br />
increase <strong>the</strong>ir accuracy, which implies<br />
an increase in understanding <strong>of</strong> <strong>the</strong> aquifer<br />
flow controls and dynamics. There<br />
are many valuable stratigraphic studies<br />
within <strong>the</strong> <strong>Texas</strong> Tertiary aquifers.<br />
However, many times <strong>the</strong>se studies are<br />
at a subregional scale, and differences in<br />
nomenclature between studies make integration<br />
<strong>of</strong> <strong>the</strong>se studies into a coherent<br />
whole difficult. Studies such as <strong>the</strong> one<br />
presented herein are recommended to be<br />
continued in <strong>the</strong> <strong>Texas</strong> Tertiary aquifers<br />
as <strong>the</strong>y provide detailed structure, lithology,<br />
and depositional facies defined at<br />
<strong>the</strong> relevant aquifer scale. The resulting<br />
uniformity will prove critical to future<br />
groundwater resource management.<br />
6.8<br />
Acknowledgments<br />
The well logs critical to this investigation<br />
could not have been ga<strong>the</strong>red<br />
without open access to resources at<br />
<strong>the</strong> Bureau <strong>of</strong> Economic Geology, <strong>the</strong><br />
<strong>Texas</strong> Water Development Board, and<br />
<strong>the</strong> <strong>Texas</strong> Commission on Environmental<br />
Quality Surface Casing Division.<br />
Friendly and helpful guidance in<br />
<strong>the</strong>se respective facilities was provided<br />
by Daniel Ortuño, Deborah Schultz,<br />
and Julia Harvey. We would like to<br />
acknowledge Scott Hamlin, <strong>the</strong> TWDB<br />
project manager, for his support and<br />
guidance through this structure development<br />
project. The skills and patience<br />
<strong>of</strong> Astrid Vreugdenhil, Sarah Pierson,<br />
and Michelle Tiemeier at INTERA,<br />
Incorporated, and Alex Sanders at Baer<br />
Engineering and Environmental Services,<br />
Incorporated, have transformed<br />
thoughts and ideas into geographic<br />
information system-based maps. Computer-aided,<br />
design-based cross section<br />
drawing was accomplished by Jorge<br />
Garza <strong>of</strong> INTERA, Incorporated, and<br />
we appreciate his patience. Funding<br />
for this study was provided by TWDB<br />
under contract 0604830617.<br />
<strong>Texas</strong> Water Development Board <strong>Report</strong> <strong>374</strong> 141
6.9<br />
References<br />
Anders, R.B., and Baker, Jr., E.T., 1961, Groundwater geology <strong>of</strong> Live Oak County, <strong>Texas</strong>:<br />
<strong>Texas</strong> Water Commission Bulletin 6105, 93 p.<br />
Baker, Jr., E.T., Follett, C.R., McAdoo, G.D., and Bonnet, C.W., 1974, Ground-water<br />
resources <strong>of</strong> Grimes County, <strong>Texas</strong>: <strong>Texas</strong> Water Development Board <strong>Report</strong> 186,<br />
103 p.<br />
Barnes, V.E., 1968a, project director, Beaumont sheet—Geologic atlas <strong>of</strong> <strong>Texas</strong>: University<br />
<strong>of</strong> <strong>Texas</strong> at Austin, Bureau <strong>of</strong> Economic Geology, scale 1:250,000, revised 1992.<br />
Barnes, V.E., 1968b, project director, Palestine sheet—Geologic atlas <strong>of</strong> <strong>Texas</strong>: University<br />
<strong>of</strong> <strong>Texas</strong> at Austin, Bureau <strong>of</strong> Economic Geology, scale 1:250,000, Revised 1993.<br />
Barnes, V.E., 1974a, project director, Austin sheet—Geologic atlas <strong>of</strong> <strong>Texas</strong>: University<br />
<strong>of</strong> <strong>Texas</strong> at Austin, Bureau <strong>of</strong> Economic Geology, scale 1:250,000, revised 1981.<br />
Barnes, V.E., 1974b, project director, San Antonio sheet—Geologic atlas <strong>of</strong> <strong>Texas</strong>: University<br />
<strong>of</strong> <strong>Texas</strong> at Austin, Bureau <strong>of</strong> Economic Geology, scale 1:250,000, revised 1983.<br />
Barnes, V.E., 1974c, project director, Seguin sheet—Geologic atlas <strong>of</strong> <strong>Texas</strong>: University<br />
<strong>of</strong> <strong>Texas</strong> at Austin, Bureau <strong>of</strong> Economic Geology, scale 1:250,000.<br />
Barnes, V.E., 1975, project director, Beeville-Bay City sheet—Geologic atlas <strong>of</strong> <strong>Texas</strong>:<br />
University <strong>of</strong> <strong>Texas</strong> at Austin, Bureau <strong>of</strong> Economic Geology, scale 1:250,000, revised<br />
1987.<br />
Barnes, V.E., 1976a, project director, Crystal City-Eagle Pass sheet—Geologic atlas <strong>of</strong> <strong>Texas</strong>:<br />
University <strong>of</strong> <strong>Texas</strong> at Austin, Bureau <strong>of</strong> Economic Geology, scale 1:250,000.<br />
Barnes, V.E., 1976b, project director, Laredo sheet—Geologic atlas <strong>of</strong> <strong>Texas</strong>: University<br />
<strong>of</strong> <strong>Texas</strong> at Austin, Bureau <strong>of</strong> Economic Geology, scale 1:250,000.<br />
Barnes, V.E., 1976c, project director, McAllen-Brownsville sheet—Geologic atlas <strong>of</strong> <strong>Texas</strong>:<br />
University <strong>of</strong> <strong>Texas</strong> at Austin, Bureau <strong>of</strong> Economic Geology, scale 1:250,000.<br />
Barnes, V.E., 1992, Geologic map <strong>of</strong> <strong>Texas</strong>: University <strong>of</strong> <strong>Texas</strong>, Bureau <strong>of</strong> Economic<br />
Geology, State Map no. 3, scale 1:500,000.<br />
Coleman, J.M.C., 1990, Depositional systems and tectonic/eustatic history <strong>of</strong> <strong>the</strong> Oligocene<br />
Vicksburg episode <strong>of</strong> <strong>the</strong> nor<strong>the</strong>rn Gulf Coast: Austin, Tex., University <strong>of</strong><br />
<strong>Texas</strong> at Austin, Ph.D. dissertation, two volumes, 538 p.<br />
Dale, O.C., 1952, Groundwater resources <strong>of</strong> Starr County, <strong>Texas</strong>: <strong>Texas</strong> Water Commission<br />
Bulletin 5209, 47 p.<br />
Dodge, M.M., and Posey, J.S., 1981, Structural cross sections, Tertiary formations, <strong>Texas</strong><br />
Gulf Coast: University <strong>of</strong> <strong>Texas</strong> at Austin, Bureau <strong>of</strong> Economic Geology Cross Section<br />
Series no. 2, 6 p.<br />
Eargle, D.H., 1972, Revised classification and nomenclature <strong>of</strong> <strong>the</strong> Jackson Group<br />
(Eocene), south-central <strong>Texas</strong>: American Association <strong>of</strong> Petroleum Geologists Bulletin,<br />
v. 56, p. 561–66.<br />
Ewing, T.E., 1986, Tectonic map <strong>of</strong> <strong>Texas</strong>: University <strong>of</strong> <strong>Texas</strong> at Austin, Bureau <strong>of</strong> Economic<br />
Geology SM0001, 1:750,000, 4 sheets.<br />
142 <strong>Texas</strong> Water Development Board <strong>Report</strong> <strong>374</strong>
Ewing, T.E., 1994, Surface to subsurface correlation <strong>of</strong> <strong>the</strong> Claiborne and Jackson groups,<br />
Colorado River to Trinity River, Bulletin, v. 78, issue 9: 44th annual convention <strong>of</strong> <strong>the</strong><br />
Gulf Coast Association <strong>of</strong> Geological Societies and <strong>the</strong> 41st annual convention <strong>of</strong> <strong>the</strong><br />
Gulf Coast Section <strong>of</strong> <strong>the</strong> Society <strong>of</strong> Economic Paleontologists and Mineralogists,<br />
Austin, <strong>Texas</strong> (United States), p. 5–7 Oct 1994, PBD: Sep. 1994.<br />
Ewing, T.E., 1991, Chapter 3: Structural framework, in Salvador, A., ed., The Gulf <strong>of</strong><br />
Mexico Basin—The geology <strong>of</strong> North America, v. J: Boulder, Colo., The Geological<br />
Society <strong>of</strong> America, Inc., p. 31–52.<br />
Ewing, T.E., and Vincent, F., 1997, Correlation <strong>of</strong> Yegua/Cockfield genetic cycles, <strong>Texas</strong><br />
and Louisiana: American Association <strong>of</strong> Petroleum Geologists Bulletin, v. 81, no.<br />
9, p. 1574–1575.<br />
Fang, Q., 2000, Biostratigraphic and sequence stratigraphic analysis <strong>of</strong> <strong>the</strong> Yegua Formation,<br />
Houston salt embayment, nor<strong>the</strong>rn Gulf <strong>of</strong> Mexico: Austin, Tex., University<br />
<strong>of</strong> <strong>Texas</strong> at Austin, Ph.D. dissertation, 284 p.<br />
Fisher, W.L., 1963, Lignites <strong>of</strong> <strong>the</strong> <strong>Texas</strong> Gulf <strong>Coastal</strong> Plain: University <strong>of</strong> <strong>Texas</strong> at Austin,<br />
Bureau <strong>of</strong> Economic Geology <strong>Report</strong> <strong>of</strong> Investigations no. 50, 164 p.<br />
Fisher, W.L., 1969, Facies characterization <strong>of</strong> Gulf Coast Basin delta systems, with some<br />
Holocene analogues: Gulf Coast Association <strong>of</strong> Geological Societies Transactions,<br />
v. 19, p. 239–261.<br />
Fisher, W.L., Proctor, Jr., C.V., Galloway, W.E., and Nagle, J.S., 1970, Depositional systems<br />
in <strong>the</strong> Jackson Group <strong>of</strong> <strong>Texas</strong>—Their relationship to oil, gas, and uranium: Gulf<br />
Coast Association <strong>of</strong> Geological Societies Transactions, v. 20, p. 234–261.<br />
Galloway, W.E., 1989, Genetic stratigraphic sequences in basin analysis I, architecture<br />
and genesis <strong>of</strong> flooding-surface bounded depositional units: American Association<br />
<strong>of</strong> Petroleum Geologists Bulletin, v. 73, no. 2, p. 124–142.<br />
Galloway, W.E., Bebout, D.G., Fisher, W.L., Dunlap, Jr., J.B., Cabrera-Castro, R., Lugo-<br />
Rivera, J.E., and Scott, T.M., 1991, Chapter 11: Cenozoic, in Salvador, A., ed., The Gulf<br />
<strong>of</strong> Mexico Basin—The geology <strong>of</strong> North America, v. J: Boulder, Colo., The Geological<br />
Society <strong>of</strong> America, Inc., p. 245–324.<br />
Galloway, W.E., Ewing, T.E., Garrett, C.M., Tyler, N., Bebout, D.G., 1983, Atlas <strong>of</strong><br />
major <strong>Texas</strong> oil reservoirs: University <strong>of</strong> <strong>Texas</strong>, Bureau <strong>of</strong> Economic Geology, 139<br />
p. (oversize).<br />
Galloway, W.E., Finley, R.J., and Henry, C.D., 1979, South <strong>Texas</strong> uranium province—<br />
Geologic perspective: University <strong>of</strong> <strong>Texas</strong> at Austin, Bureau <strong>of</strong> Economic Geology,<br />
87 p.<br />
Galloway, W.E., Ganey-Curry, P.E., Li, X., and Buffler, R.T., 2000, Cenozoic depositional<br />
history <strong>of</strong> <strong>the</strong> Gulf <strong>of</strong> Mexico Basin: American Association <strong>of</strong> Petroleum Geologist<br />
Bulletin Guidebook 18, v. 84, no. 11, p. 1743–1774.<br />
Goings, R.E., and Smosna, R., 1994, A regional subsurface study <strong>of</strong> <strong>the</strong> expanded Yegua<br />
Formation in <strong>the</strong> Houston diapir province: Gulf Coast Association <strong>of</strong> Geological<br />
Societies Transactions, v. 44, p. 245–254.<br />
Harland, W.B., Armstrong, R.L., Cox, A.V., Craig, L.E., Smith, A.G., and Smith, D.G.,<br />
1990, A geologic time scale 1989: Cambridge, England, Cambridge University Press,<br />
263 p.<br />
<strong>Texas</strong> Water Development Board <strong>Report</strong> <strong>374</strong> 143
Hays, J.D., Imbrie, J., and Shackleton, N.J., 1976, Variation in <strong>the</strong> Earth’s orbit—Pacemaker<br />
<strong>of</strong> <strong>the</strong> ice ages: Science, v. 194, no. 4270, p. 1121–1132.<br />
Huh, S., Watkins, J.S., Kasande, R., Fiduk, J.C., Bryant, S., Silver, K.E., Bradshaw, B.E.,<br />
Xue, F., and Xi, J., 1996, Regional structure and tectonics <strong>of</strong> <strong>the</strong> <strong>Texas</strong> shelf; in Jones,<br />
J.O., and Freed, R.L., eds., Structural framework <strong>of</strong> <strong>the</strong> nor<strong>the</strong>rn Gulf <strong>of</strong> Mexico:<br />
Austin, <strong>Texas</strong>, Gulf Coast Association <strong>of</strong> Geological Societies Special Publication,<br />
p. 39–51.<br />
Jackson, M.L.W., and Garner, L.E., 1982, Environmental geology <strong>of</strong> <strong>the</strong> Yegua-Jackson<br />
lignite belt, sou<strong>the</strong>ast <strong>Texas</strong>: University <strong>of</strong> <strong>Texas</strong> at Austin, Bureau <strong>of</strong> Economic<br />
Geology <strong>Report</strong> <strong>of</strong> Investigations no. 129, 40 p.<br />
Kaiser, W.R., Ayers, Jr., W.B., and La Brie, L.W., 1980, Lignite resources in <strong>Texas</strong>: University<br />
<strong>of</strong> <strong>Texas</strong> at Austin, Bureau <strong>of</strong> Economic Geology <strong>Report</strong> <strong>of</strong> Investigations<br />
no. 104, 52 p.<br />
Knox, P.R., Kelley, V.A., Vreugdenhil, A., Deeds, N., and Seni, S.J., 2007, Structure <strong>of</strong><br />
<strong>the</strong> Yegua-Jackson Aquifer <strong>of</strong> <strong>the</strong> <strong>Texas</strong> Gulf <strong>Coastal</strong> Plain: Prepared for <strong>the</strong> <strong>Texas</strong><br />
Water Development Board, 174 p., 20 plates.<br />
Meckel, III, L.D., and Galloway, W.E., 1996, Formation <strong>of</strong> high-frequency sequences and<br />
<strong>the</strong>ir bounding surfaces—Case study <strong>of</strong> <strong>the</strong> Eocene Yegua Formation, <strong>Texas</strong> Gulf<br />
Coast, USA: Sedimentary Geology, v. 102, p. 155–187.<br />
Mitchum, R.M., and VanWagoner, J.C., 1991, High-frequency sequences and <strong>the</strong>ir stacking<br />
patterns—Sequence-stratigraphic evidence <strong>of</strong> high-frequency eustatic cycles:<br />
Sedimentary Geology, v. 70, p. 131–160.<br />
Preston, R.D., 2006, The Yegua-Jackson Aquifer, in Mace, R.E., and o<strong>the</strong>rs, eds., <strong>Aquifers</strong><br />
<strong>of</strong> <strong>the</strong> Gulf Coast <strong>of</strong> <strong>Texas</strong>: <strong>Texas</strong> Water Development Board <strong>Report</strong> 365, p. 51–59.<br />
Quick, J.V., Thomas, N.G., Brogdon, L.D., Jones, C.A, and Martin, T.S., 1977, Uranium<br />
favorability <strong>of</strong> late Eocene through Pliocene rocks <strong>of</strong> <strong>the</strong> South <strong>Texas</strong> <strong>Coastal</strong> <strong>Plains</strong>:<br />
Grand Junction, Colo., U.S. Energy Research and Development Administration,<br />
47 p.<br />
Renick, B.C., 1926, The Jackson Group and <strong>the</strong> Catahoula and Oakville formations in<br />
a part <strong>of</strong> <strong>the</strong> <strong>Texas</strong> Gulf <strong>Coastal</strong> Plain: University <strong>of</strong> <strong>Texas</strong> at Austin, Bureau <strong>of</strong> Economic<br />
Geology Bulletin 2645, 187 p.<br />
Renick, B.C., 1936, The Jackson Group and <strong>the</strong> Catahoula and Oakville formations in a<br />
part <strong>of</strong> <strong>the</strong> <strong>Texas</strong> Gulf <strong>Coastal</strong> Plain: University <strong>of</strong> <strong>Texas</strong> at Austin, Bureau <strong>of</strong> Economic<br />
Geology Bulletin 3619, 104 p.<br />
Rogers, L.T., 1967, Availability and quality <strong>of</strong> ground water in Fayette County, <strong>Texas</strong>:<br />
<strong>Texas</strong> Water Development Board <strong>Report</strong> 56, 117 p.<br />
Routh, J., McDonald, T.S., and Grossman, E.L., 1999, Sedimentary organic matter sources<br />
and depositional environment in Yegua Formation (Brazos County, <strong>Texas</strong>): Organic<br />
Geochemistry, v. 30, p. 1437–1453.<br />
Sellards, E.H., Adkins, W.W., and Plummer, F.B., 1932, The geology <strong>of</strong> <strong>Texas</strong>, Volume<br />
I Stratigraphy: University <strong>of</strong> <strong>Texas</strong> at Austin, Bureau <strong>of</strong> Economic Geology Bulletin<br />
3232, 818 p.<br />
Sneider, J.S., 1992, Sequence stratigraphy <strong>of</strong> <strong>the</strong> Yegua and Cook Mountain formations,<br />
Eocene <strong>of</strong> sou<strong>the</strong>astern <strong>Texas</strong>: The Geological Society <strong>of</strong> America Abstracts with<br />
Programs, v. 24, no. 1, p. 47.<br />
144 <strong>Texas</strong> Water Development Board <strong>Report</strong> <strong>374</strong>
Swenson, D.R., 1997, Basal Yegua shelf margin failures along <strong>the</strong> <strong>Texas</strong> Gulf Coast: Gulf<br />
Coast Association <strong>of</strong> Geological Societies Transactions, v. 47, p. 571–577.<br />
Tarver, G.R., 1966, Ground-water resources <strong>of</strong> Houston County, <strong>Texas</strong>: <strong>Texas</strong> Water<br />
Development Board <strong>Report</strong> 18, 86 p.<br />
Tarver, G.R., 1968, Ground-water Resources <strong>of</strong> Tyler County, <strong>Texas</strong>: <strong>Texas</strong> Water Development<br />
Board <strong>Report</strong> 74, 91 p.<br />
TWDB (<strong>Texas</strong> Water Development Board), 2002, Water for <strong>Texas</strong>: <strong>Texas</strong> Water Development<br />
Board, 156 p.<br />
TWDB (<strong>Texas</strong> Water Development Board), 2007, Water for <strong>Texas</strong>, Volume II: <strong>Texas</strong><br />
Water Development Board, 392 p.<br />
Thomas, S.H., 1999, Interpretation <strong>of</strong> seismic amplitude attributes in <strong>the</strong> updip Yegua<br />
trend <strong>of</strong> South <strong>Texas</strong>: College Station, Tex., <strong>Texas</strong> A&M University, Master’s <strong>the</strong>sis,<br />
83 p.<br />
Thompson, G.L., 1966, Ground-water resources <strong>of</strong> Lee County, <strong>Texas</strong>: <strong>Texas</strong> Water<br />
Development Board <strong>Report</strong> 20, 131 p.<br />
Tyler, N., and Finley, R.J., 1991, Architectural controls on <strong>the</strong> recovery <strong>of</strong> hydrocarbons<br />
from sandstone reservoirs, in Miall, A.D., and Tyler, N., eds., The three-dimensional<br />
facies architecture <strong>of</strong> terrigenous clastic sediments and its implications for hydrocarbon<br />
discovery and recovery: Society <strong>of</strong> Economic Paleontologists and Mineralogists,<br />
Concepts in Sedimentology and Paleontology, v. 3, p. 1–5.<br />
Van Dalen, S.C., 1981, Depositional systems and natural resources <strong>of</strong> <strong>the</strong> Middle Eocene<br />
Yegua Formation, south and central <strong>Texas</strong> <strong>Coastal</strong> Plain: Austin, Tex., University <strong>of</strong><br />
<strong>Texas</strong> at Austin, Master’s <strong>the</strong>sis, 132 p.<br />
Wesselman, J.B., 1967, Ground-water resources <strong>of</strong> Jasper and Newton counties, <strong>Texas</strong>:<br />
<strong>Texas</strong> Water Development Board <strong>Report</strong> 59, 152 p.<br />
William F. Guyton and Associates, 1970, Ground-water conditions in Angelina and<br />
Nacogdoches counties, <strong>Texas</strong>: <strong>Texas</strong> Water Development Board <strong>Report</strong> 110, 89 p.<br />
Winslow, A.G., 1950, Geology and ground-water resources <strong>of</strong> Walker County, <strong>Texas</strong>:<br />
<strong>Texas</strong> Board <strong>of</strong> Water Engineers Bulletin 5003, 48 p.<br />
Yuliantoro, F., 1995, Genetic sequence stratigraphy <strong>of</strong> <strong>the</strong> Yegua Formation and <strong>the</strong><br />
Jackson Group, including <strong>the</strong> ‘Hockley’ sandstone in nor<strong>the</strong>astern Duval County<br />
and northwestern Jim Wells County, South <strong>Texas</strong>: San Antonio, Tex., University <strong>of</strong><br />
<strong>Texas</strong> at San Antonio, Master’s <strong>the</strong>sis, 210 p.<br />
<strong>Texas</strong> Water Development Board <strong>Report</strong> <strong>374</strong> 145
146 <strong>Texas</strong> Water Development Board <strong>Report</strong> <strong>374</strong><br />
This page is intentionally blank.
Chapter 7<br />
Hydrogeologic Framework and Geospatial Data<br />
Compilation for <strong>the</strong> Brazos River Alluvium Aquifer,<br />
Bosque County to Fort Bend County, <strong>Texas</strong><br />
Sachin D. Shah 1 , Natalie A. Houston 1 , Christopher L. Braun 1<br />
The Brazos River Alluvium Aquifer<br />
lies under and adjacent to <strong>the</strong> Brazos<br />
River in <strong>Texas</strong> from Bosque County<br />
to Fort Bend County. One <strong>of</strong> 21 minor<br />
aquifers in <strong>the</strong> state (TWDB, 2007), <strong>the</strong><br />
aquifer supplies water for irrigation,<br />
domestic, stock, and commercial uses.<br />
As demand for water increases statewide,<br />
<strong>the</strong> Brazos River Alluvium Aquifer<br />
likely will become more important<br />
in <strong>the</strong> future. A thorough understanding<br />
<strong>of</strong> <strong>the</strong> hydrogeology <strong>of</strong> <strong>the</strong> alluvium<br />
aquifer will be <strong>the</strong> foundation for future<br />
studies in <strong>the</strong> area. During October<br />
2006–April 2007, <strong>the</strong> U.S. Geological<br />
Survey, in cooperation with <strong>the</strong> <strong>Texas</strong><br />
Water Development Board (TWDB),<br />
conducted a study to delineate <strong>the</strong> altitude<br />
<strong>of</strong> <strong>the</strong> top, altitude <strong>of</strong> <strong>the</strong> base,<br />
and thickness <strong>of</strong> <strong>the</strong> Brazos River Alluvium<br />
Aquifer and to compile and summarize<br />
available hydraulic property<br />
data (specific capacity, transmissivity,<br />
and hydraulic conductivity). A digital<br />
elevation model was used to estimate<br />
<strong>the</strong> altitude <strong>of</strong> <strong>the</strong> top <strong>of</strong> <strong>the</strong> aquifer.<br />
The altitude <strong>of</strong> <strong>the</strong> base <strong>of</strong> <strong>the</strong> aquifer<br />
was estimated using data from wells<br />
(drillers’ logs and borehole geophysical<br />
logs). The study area encompassed<br />
<strong>the</strong> Brazos River Alluvium Aquifer in<br />
parts <strong>of</strong> Bosque, Hill, McLennan, Falls,<br />
Robertson, Milam, Brazos, Burleson,<br />
Grimes, Washington, Waller, Austin,<br />
and Fort Bend counties (Figure 7-1) and<br />
a 1.5–mile-wide lateral buffer adjacent<br />
to <strong>the</strong> aquifer. The results <strong>of</strong> this study<br />
will be used by TWDB as part <strong>of</strong> <strong>the</strong><br />
development <strong>of</strong> a groundwater availability<br />
model.<br />
7.1<br />
Previous studies<br />
Several studies involving all or parts<br />
<strong>of</strong> <strong>the</strong> Brazos River Alluvium Aquifer<br />
study area have been published.<br />
Cronin and Wilson (1967) completed<br />
<strong>the</strong> first comprehensive study <strong>of</strong> <strong>the</strong><br />
Brazos River Alluvium Aquifer from<br />
Bosque County to Fort Bend County.<br />
That report describes <strong>the</strong> extent and<br />
thickness <strong>of</strong> <strong>the</strong> aquifer, provides estimates<br />
<strong>of</strong> <strong>the</strong> amounts and distribution<br />
<strong>of</strong> withdrawals and recharge, and<br />
provides estimates <strong>of</strong> <strong>the</strong> quantity and<br />
quality <strong>of</strong> groundwater available. It also<br />
includes descriptions <strong>of</strong> <strong>the</strong> hydrologic<br />
relations between <strong>the</strong> alluvium and <strong>the</strong><br />
underlying bedrock and groundwatersurface<br />
water interaction in <strong>the</strong> Brazos<br />
River Alluvium Aquifer. As a part<br />
<strong>of</strong> <strong>the</strong> study, Cronin and Wilson (1967)<br />
obtained hydrogeologic data from test<br />
holes drilled.<br />
From 1937 to 1943, nine reports were<br />
published documenting inventoried<br />
water wells in <strong>the</strong> following counties:<br />
Austin (May, 1938); Burleson (Clark,<br />
1937a); Fort Bend (Elledge, 1937; Livingston<br />
and Turner, 1939); Grimes (Turner,<br />
1939); Milam (Clark, 1937b); Robertson<br />
(Davis, 1942); Waller (Turner and Livingston,<br />
1939); and Washington (Follett,<br />
1943). Cronin and Follett (1963) published<br />
<strong>the</strong> first reconnaissance investigation<br />
<strong>of</strong> <strong>the</strong> groundwater resources <strong>of</strong><br />
<strong>the</strong> entire Brazos River Basin in 69 counties<br />
from <strong>the</strong> New Mexico-<strong>Texas</strong> boundary<br />
to <strong>the</strong> Gulf Coast, including <strong>the</strong> 13<br />
counties <strong>of</strong> this report. Additionally,<br />
1 U.S. Geological Survey<br />
<strong>Texas</strong> Water Development Board <strong>Report</strong> <strong>374</strong> 147
97° 96°<br />
Bosque<br />
Hill<br />
McLennan<br />
Falls<br />
Brazos River<br />
CARRIZO-WILCOX<br />
QUEEN CITY<br />
Trini ty River<br />
SPARTA<br />
Robertson<br />
31°<br />
Milam<br />
YEGUA-JACKSON<br />
Brazos<br />
Burleson<br />
Grimes<br />
San Jacinto River<br />
Washington<br />
Waller<br />
30°<br />
Austin<br />
GULF COAST<br />
Colorado River<br />
Study area<br />
Lavaca River<br />
Fort Bend<br />
Albers Equal Area Projection<br />
North American Datum 1983<br />
Brazos River Alluvium Aquifer<br />
0<br />
0<br />
20<br />
10 20<br />
10<br />
40 Miles<br />
40 Kilometers<br />
Figure 7-1. Brazos River Alluvium Aquifer, Bosque County to Fort Bend County, <strong>Texas</strong>, and underlying<br />
aquifers (outcrops only) (modified from TWDB, 2007).<br />
Fluellen and Goines (1952) reported on<br />
<strong>the</strong> water resources <strong>of</strong> Waller County,<br />
and Hughes and Magee (1962) summarized<br />
<strong>the</strong> groundwater withdrawals <strong>of</strong><br />
irrigation wells in <strong>the</strong> aquifer.<br />
More recently, Naftel and o<strong>the</strong>rs<br />
(1976) documented well drillers’ logs,<br />
water level measurements, and chemical<br />
analyses <strong>of</strong> groundwater in Brazoria,<br />
Fort Bend, and Waller counties. Harlan<br />
(1990) assessed <strong>the</strong> hydrogeology <strong>of</strong> <strong>the</strong><br />
Brazos River Alluvium Aquifer from<br />
Waco to Marlin, <strong>Texas</strong>. Wrobleski (1996)<br />
characterized <strong>the</strong> Brazos River Alluvium<br />
Aquifer at a hydrogeologic field site in<br />
Burleson County using aquifer test data<br />
to estimate hydraulic conductivity. HDR<br />
Engineering, Inc. (2001) developed a<br />
groundwater flow model for <strong>the</strong> Brazos<br />
River Alluvium Aquifer, combined with<br />
148 <strong>Texas</strong> Water Development Board <strong>Report</strong> <strong>374</strong>
a conjunctive use analysis to quantify<br />
<strong>the</strong> amount <strong>of</strong> surface and groundwater<br />
along <strong>the</strong> Brazos River.<br />
7.2<br />
Description <strong>of</strong> <strong>the</strong> Brazos<br />
River Alluvium Aquifer<br />
The Brazos River Alluvium Aquifer<br />
extends along 350 river miles from<br />
sou<strong>the</strong>rn Bosque County to eastern<br />
Fort Bend County, with a width <strong>of</strong> up to<br />
7 miles (Ashworth and Hopkins, 1995,<br />
p. 35) (Figure 7-1). Alluvial sediments<br />
in <strong>the</strong> study area occur in floodplain<br />
and terrace deposits <strong>of</strong> <strong>the</strong> Brazos River<br />
(Cronin and Wilson, 1967). For this<br />
report, <strong>the</strong> Brazos River Alluvium Aquifer<br />
includes <strong>the</strong> floodplain alluvium that<br />
consists <strong>of</strong> fine to coarse sand, gravel,<br />
silt, and clay. The adjacent terrace alluvium<br />
is not an appreciable source <strong>of</strong><br />
water and, thus, not considered part <strong>of</strong><br />
<strong>the</strong> aquifer. Cronin and Wilson (1967)<br />
describe <strong>the</strong> composition <strong>of</strong> <strong>the</strong> floodplain<br />
alluvium as varying from place to<br />
place, with beds or lenses <strong>of</strong> sand and<br />
gravel that pinch out or grade laterally<br />
into vertically finer or coarser material.<br />
In general, <strong>the</strong> finer material is in <strong>the</strong><br />
upper part <strong>of</strong> <strong>the</strong> aquifer, and <strong>the</strong> coarser<br />
material is in <strong>the</strong> lower part. The aquifer<br />
is generally under water table conditions<br />
and is used mainly for irrigation (HDR<br />
Engineering, Inc., 2001). The water<br />
table generally slopes toward <strong>the</strong> Brazos<br />
River, indicating that <strong>the</strong> river is a<br />
gaining stream in most places. Recharge<br />
to <strong>the</strong> aquifer occurs primarily from<br />
rainfall on <strong>the</strong> aquifer and subsequent<br />
downward leakage to <strong>the</strong> saturated<br />
zone, which (in <strong>the</strong> late 1960s) ranged<br />
from less than 10 to nearly 50 feet below<br />
land surface (Cronin and Wilson, 1967,<br />
p. 2). Discharge from <strong>the</strong> aquifer occurs<br />
primarily through evapotranspiration,<br />
discharge to <strong>the</strong> Brazos River, and withdrawals<br />
from wells. Some wells can yield<br />
as much as 1,000 gallons per minute,<br />
but <strong>the</strong> majority <strong>of</strong> wells yield from 250<br />
to 500 gallons per minute (Ashworth<br />
and Hopkins, 1995, p. 35).<br />
The Brazos River Alluvium Aquifer<br />
in <strong>the</strong> study area is underlain by geologic<br />
units that crop out in bands roughly<br />
parallel to <strong>the</strong> coast (Shah and Houston,<br />
2007). Many <strong>of</strong> <strong>the</strong> geologic units, ei<strong>the</strong>r<br />
individually or in groups, compose major<br />
and minor aquifers in <strong>the</strong> study area (Figure<br />
7-1). Notable among <strong>the</strong> underlying<br />
aquifer units are <strong>the</strong> Carrizo-Wilcox<br />
Aquifer, <strong>the</strong> Queen City Aquifer, <strong>the</strong><br />
Sparta Aquifer, <strong>the</strong> Yegua-Jackson Aquifer,<br />
and <strong>the</strong> Gulf Coast Aquifer. These<br />
aquifers dip gently from <strong>the</strong>ir outcrops<br />
toward <strong>the</strong> coast, with dip angles slightly<br />
greater than <strong>the</strong> land-surface gradient.<br />
7.3<br />
Methods <strong>of</strong> hydrogeologic<br />
charaCTerization<br />
For <strong>the</strong> hydrogeologic characterization<br />
in this report, information was compiled<br />
and syn<strong>the</strong>sized from published<br />
reports generated by TWDB, <strong>the</strong> <strong>Texas</strong><br />
Commission on Environmental Quality,<br />
various universities, and groundwater<br />
conservation districts, and <strong>the</strong>n disseminated<br />
into <strong>the</strong> TWDB’s Groundwater<br />
Availability Model Source Data<br />
Geodatabase schema (Shah and Houston,<br />
2007).<br />
7.3.1<br />
Altitude <strong>of</strong> <strong>the</strong> top <strong>of</strong> <strong>the</strong> Brazos River<br />
Alluvium Aquifer<br />
A U.S. Geological Survey 30-meter (98-<br />
foot) digital elevation model (DEM)<br />
resampled to 0.125 mile was used to<br />
estimate <strong>the</strong> top <strong>of</strong> <strong>the</strong> Brazos River<br />
Alluvium Aquifer for <strong>the</strong> study area. A<br />
DEM is a digital file consisting <strong>of</strong> terrain<br />
altitudes for land-surface positions<br />
at regularly spaced horizontal intervals,<br />
from which an accurate depiction <strong>of</strong> surface<br />
topography can be generated. The<br />
DEMs were obtained from <strong>the</strong> U.S. Geological<br />
Survey Seamless Data Distribution<br />
System (USGS, 2007). This portal<br />
provides DEMs with various resolutions<br />
for <strong>the</strong> United States. For this study a<br />
resolution <strong>of</strong> one arc-second (about 30<br />
meters) was chosen. The models for<br />
<strong>Texas</strong> Water Development Board <strong>Report</strong> <strong>374</strong> 149
each county <strong>the</strong>n were merged to create<br />
a single DEM for <strong>the</strong> Brazos River Alluvium<br />
Aquifer study area.<br />
7.3.2<br />
Altitude <strong>of</strong> <strong>the</strong> base <strong>of</strong> <strong>the</strong> Brazos River<br />
Alluvium Aquifer<br />
The contact between <strong>the</strong> alluvium and<br />
<strong>the</strong> underlying unit was estimated, or<br />
“picked,” from drillers’ or geophysical<br />
logs or published geologic sections<br />
based on lithology where no o<strong>the</strong>r<br />
determinations could be made. Many<br />
areas lacked sufficient log data (control<br />
points) to create a continuous surface<br />
for <strong>the</strong> altitude <strong>of</strong> <strong>the</strong> base. For <strong>the</strong>se<br />
areas, <strong>the</strong> depths <strong>of</strong> wells known to be<br />
completed in <strong>the</strong> Brazos River Alluvium<br />
Aquifer without an associated driller’s<br />
or geophysical log were used as control<br />
points. From <strong>the</strong> log and well-depth<br />
control points, a surface was estimated<br />
using <strong>the</strong> topo-to-raster method in <strong>the</strong><br />
geographic information system (GIS)<br />
s<strong>of</strong>tware ArcGIS 9.2 (ESRI, 2007). Topo<br />
to raster is a spline interpolation method<br />
specifically designed for creating altitude<br />
surfaces. The method honors <strong>the</strong><br />
data without applying a smoothing algorithm<br />
and also accepts vectors as input<br />
data (ESRI, 2007).<br />
Despite <strong>the</strong> use <strong>of</strong> well-depth control<br />
points to supplement <strong>the</strong> log control<br />
points, data gaps exist in parts <strong>of</strong> <strong>the</strong> study<br />
area. For example, drillers could not or<br />
did not distinguish <strong>the</strong> alluvium from <strong>the</strong><br />
underlying unit for wells in some areas<br />
where both units were <strong>of</strong> similar lithology,<br />
which precluded identifying <strong>the</strong><br />
base <strong>of</strong> <strong>the</strong> aquifer in places. Data gaps<br />
also occur in areas where <strong>the</strong> alluvium<br />
is too thin to yield adequate amounts <strong>of</strong><br />
water, and, <strong>the</strong>refore, no wells exist in<br />
those areas.<br />
After generating a preliminary raster<br />
surface for <strong>the</strong> base, contours were<br />
generated at 10-foot intervals using GIS<br />
s<strong>of</strong>tware. The preliminary surface, contours<br />
generated from <strong>the</strong> surface, and<br />
<strong>the</strong> input control points were assessed<br />
to identify discrepancies, particularly<br />
in areas where both log and well-depth<br />
control points were used. For log control<br />
points, <strong>the</strong> base pick for each well<br />
was compared with picks for nearby<br />
wells. If <strong>the</strong> altitude was unrealistically<br />
high or low relative to altitudes from<br />
nearby wells, <strong>the</strong> log was re-examined<br />
to determine whe<strong>the</strong>r a pick more consistent<br />
with <strong>the</strong> nearby picks might be<br />
reasonable. In areas where <strong>the</strong>re was a<br />
substantial difference in altitude between<br />
log control points and well-depth control<br />
points, altitudes from log picks were<br />
used preferentially over those from well<br />
depths; well-depth control points were<br />
discarded if <strong>the</strong>re was a difference <strong>of</strong><br />
more than 5 feet. After assessment and<br />
revision, <strong>the</strong> process was repeated several<br />
times. Contours generated from ArcMap<br />
(about 500 arcs) were <strong>the</strong>n evaluated and<br />
modified manually where necessary. The<br />
final surface representing <strong>the</strong> altitude <strong>of</strong><br />
<strong>the</strong> base was generated using both points<br />
and contours concurrently and <strong>the</strong> topoto-raster<br />
interpolator. For <strong>the</strong> final map,<br />
a total <strong>of</strong> 1,364 control points were used:<br />
386 from drillers’ logs, 13 from geophysical<br />
logs, 955 from well depths, and 10<br />
from geologic sections.<br />
7.3.3<br />
Thickness <strong>of</strong> <strong>the</strong> Brazos River<br />
Alluvium Aquifer<br />
The thickness <strong>of</strong> <strong>the</strong> Brazos River Alluvium<br />
Aquifer was estimated by subtracting<br />
<strong>the</strong> raster surface <strong>of</strong> <strong>the</strong> base<br />
<strong>of</strong> <strong>the</strong> aquifer from <strong>the</strong> raster surface <strong>of</strong><br />
<strong>the</strong> top <strong>of</strong> <strong>the</strong> aquifer, using <strong>the</strong> raster<br />
calculator in Spatial Analyst in ArcGIS<br />
9.2 (ESRI, 2007). Subtracting <strong>the</strong> raster<br />
surfaces in GIS can provide an objective<br />
and unbiased rendition <strong>of</strong> differences<br />
between <strong>the</strong> two surfaces. Thicknesses<br />
in areas where <strong>the</strong> number <strong>of</strong> control<br />
points for one surface differ substantially<br />
from <strong>the</strong> o<strong>the</strong>r surface should be<br />
used with caution.<br />
150 <strong>Texas</strong> Water Development Board <strong>Report</strong> <strong>374</strong>
7.3.4<br />
Hydraulic properties<br />
Two hundred fifty-six <strong>of</strong> 358 specific<br />
capacity values (Shah and Houston,<br />
2007) were obtained from specific<br />
capacity or aquifer tests performed by<br />
<strong>the</strong> U.S. Geological Survey in 1963 and<br />
1964. The o<strong>the</strong>r 102 values were obtained<br />
from <strong>the</strong> online TWDB groundwater<br />
database Well-Site Remarks Table<br />
(TWDB, 2006).<br />
Two hundred fifty-eight <strong>of</strong> 371<br />
transmissivity values (Shah and Houston,<br />
2007) were obtained from <strong>the</strong> U.S.<br />
Geological Survey specific capacity or<br />
aquifer tests from 1963 and 1964; four<br />
were obtained from published reports;<br />
and seven were computed from hydraulic<br />
conductivity values (Wrobleski, 1996).<br />
One hundred two transmissivity values<br />
were computed from <strong>the</strong> TWDB specific<br />
capacity values noted above, using an<br />
empirical equation for unconfined aquifers<br />
developed from <strong>the</strong> modified nonequilibrium<br />
(Jacob) equation (Driscoll,<br />
1986, p. 1,021).<br />
The modified nonequilibrium equation<br />
is<br />
Q/s = T/264(log[0.3Tt/r 2 S]), (1)<br />
where Q is <strong>the</strong> yield <strong>of</strong> <strong>the</strong> well in gallons<br />
per minute, s is <strong>the</strong> drawdown in<br />
<strong>the</strong> well in feet, T is <strong>the</strong> transmissivity<br />
<strong>of</strong> <strong>the</strong> aquifer in feet squared per day, t<br />
is time, and S is <strong>the</strong> storage coefficient<br />
<strong>of</strong> <strong>the</strong> aquifer.<br />
The empirical equation is<br />
Q/s = T/1500. (2)<br />
This equation is derived by assuming<br />
“typical” values for <strong>the</strong> variables in <strong>the</strong><br />
modified nonequilibrium equation. T is<br />
assumed to be 30,000 feet squared per<br />
day, t is assumed to be 1 day, r is assumed<br />
to be 0.5 foot, and S is assumed to be<br />
0.075. The empirical equation was used<br />
because few wells with specific capacity<br />
data had values for all <strong>of</strong> <strong>the</strong> variables<br />
necessary to apply <strong>the</strong> modified nonequilibrium<br />
equation.<br />
Seven hydraulic conductivity values<br />
(Shah and Houston, 2007) were compiled<br />
for closely adjacent sites in Burleson<br />
County from <strong>the</strong> <strong>Texas</strong> A&M University<br />
Brazos River Hydrologic Field Site<br />
(Wrobleski, 1996). Transmissivity values<br />
were not computed from <strong>the</strong>se hydraulic<br />
conductivity values because saturated<br />
thickness at <strong>the</strong> sites was unknown.<br />
7.4<br />
Hydrogeologic<br />
charaCTerization<br />
7.4.1<br />
Altitude <strong>of</strong> <strong>the</strong> top <strong>of</strong> <strong>the</strong> Brazos River<br />
Alluvium Aquifer<br />
Altitudes <strong>of</strong> <strong>the</strong> top <strong>of</strong> <strong>the</strong> Brazos River<br />
Alluvium Aquifer (land surface) (Figure<br />
7-2) range from about 580 feet above<br />
North American Vertical Datum <strong>of</strong> 1988<br />
(NAVD 88) at <strong>the</strong> northwestern end in<br />
Bosque County to about 17 feet above<br />
NAVD 88 at <strong>the</strong> sou<strong>the</strong>astern end in<br />
Fort Bend County. The top <strong>of</strong> <strong>the</strong> aquifer<br />
slopes from northwest to sou<strong>the</strong>ast<br />
at a fairly consistent rate <strong>of</strong> about 2.5–3<br />
feet per mile.<br />
7.4.2<br />
Altitude <strong>of</strong> <strong>the</strong> base <strong>of</strong> <strong>the</strong> Brazos River<br />
Alluvium Aquifer<br />
The altitude <strong>of</strong> <strong>the</strong> base <strong>of</strong> <strong>the</strong> Brazos<br />
River Alluvium Aquifer (Figure 7-3)<br />
ranges from about 480 feet above NAVD<br />
88 at <strong>the</strong> northwestern end in Bosque<br />
County to about 18 feet below NAVD<br />
88 at <strong>the</strong> sou<strong>the</strong>astern end in Fort Bend<br />
County. The altitude <strong>of</strong> <strong>the</strong> base is an<br />
uneven or undulating surface that, like<br />
<strong>the</strong> altitude <strong>of</strong> <strong>the</strong> top, decreases from<br />
northwest to sou<strong>the</strong>ast but not as consistently<br />
as <strong>the</strong> altitude <strong>of</strong> <strong>the</strong> top. There<br />
are small areas, for example in Brazos<br />
County, where <strong>the</strong> altitude <strong>of</strong> <strong>the</strong> base<br />
increases or decreases about 10 feet<br />
over short (tens <strong>of</strong> feet) distances. The<br />
largest change in base altitude occurs<br />
<strong>Texas</strong> Water Development Board <strong>Report</strong> <strong>374</strong> 151
32°<br />
97°30'<br />
Hill<br />
Bosque<br />
Waco<br />
31°30'<br />
McLennan<br />
97°30'<br />
97°<br />
32°<br />
31°30'<br />
Altitude <strong>of</strong> top <strong>of</strong> Brazos River<br />
Alluvium Aquifer, in feet above NAVD 88<br />
17–100<br />
100–150<br />
150–200<br />
200–250<br />
250–300<br />
300–350<br />
350–400<br />
400–583<br />
Boundary <strong>of</strong> Brazos River Alluvium Aquifer<br />
Boundary <strong>of</strong> Brazos River Alluvium Aquifer 1.5-mile buffer<br />
0 10 20 30 40 50 Miles<br />
Falls<br />
96°30'<br />
0 10 20 30 40 50 Kilometers<br />
31°<br />
Robertson<br />
31°<br />
Milam<br />
Brazos<br />
Bryan<br />
96°<br />
97°<br />
30°30'<br />
Burleson<br />
Grimes<br />
30°30'<br />
Washington<br />
Waller<br />
30°<br />
96°30'<br />
Austin<br />
30°<br />
Sugar Land<br />
95°30'<br />
29°30'<br />
96°<br />
Fort<br />
Bend<br />
95°30'<br />
29°30'<br />
Figure 7-2. Altitude <strong>of</strong> <strong>the</strong> top <strong>of</strong> <strong>the</strong> Brazos River Alluvium Aquifer, Bosque County to Fort Bend County, <strong>Texas</strong>.<br />
NAVD=North American Vertical Datum 1988<br />
in Fort Bend County where <strong>the</strong> altitude<br />
decreases about 40 feet, although<br />
<strong>the</strong> altitude <strong>of</strong> <strong>the</strong> base is potentially<br />
less reliable in this county than o<strong>the</strong>r<br />
areas. There, drillers’ logs do not always<br />
clearly differentiate <strong>the</strong> sand and gravel<br />
<strong>of</strong> <strong>the</strong> alluvium aquifer from that <strong>of</strong> <strong>the</strong><br />
underlying Gulf Coast aquifer (Chicot,<br />
Evangeline, or Jasper aquifers locally,<br />
not shown in Figure 7-1). Because <strong>the</strong><br />
lithology <strong>of</strong> <strong>the</strong> alluvium and <strong>the</strong> Gulf<br />
Coast Aquifer is so similar, a distinct<br />
pick is not easy to make. The control<br />
points used in Fort Bend County are<br />
those for which base picks could be<br />
made with reasonable confidence.<br />
152 <strong>Texas</strong> Water Development Board <strong>Report</strong> <strong>374</strong>
32°<br />
97°30'<br />
Hill<br />
Bosque<br />
Waco<br />
31°30'<br />
McLennan<br />
97°30'<br />
97°<br />
32°<br />
31°30'<br />
Altitude <strong>of</strong> base <strong>of</strong> Brazos River<br />
Alluvium Aquifer, in feet above NAVD 88<br />
-18–50<br />
50–100<br />
100–150<br />
150–200<br />
200–250<br />
250–300<br />
300–350<br />
350–483<br />
Boundary <strong>of</strong> Brazos River Alluvium Aquifer 1.5-mile buffer<br />
0 10 20 30 40 50 Miles<br />
Falls<br />
96°30'<br />
0 10 20 30 40 50 Kilometers<br />
31°<br />
Robertson<br />
31°<br />
Milam<br />
Brazos<br />
Bryan<br />
96°<br />
97°<br />
30°30'<br />
Burleson<br />
Grimes<br />
30°30'<br />
Washington<br />
Waller<br />
30°<br />
96°30'<br />
Austin<br />
30°<br />
Sugar Land<br />
95°30'<br />
29°30'<br />
96°<br />
Fort<br />
Bend<br />
95°30'<br />
29°30'<br />
Figure 7-3. Altitude <strong>of</strong> <strong>the</strong> base <strong>of</strong> <strong>the</strong> Brazos River Alluvium Aquifer, Bosque County to Fort Bend County, <strong>Texas</strong>.<br />
NAVD=North American Vertical Datum 1988<br />
7.4.3<br />
Thickness <strong>of</strong> <strong>the</strong> base <strong>of</strong> <strong>the</strong><br />
Brazos River Alluvium Aquifer<br />
The thickness <strong>of</strong> <strong>the</strong> Brazos River Alluvium<br />
Aquifer (Figure 7-4) ranges from<br />
negligible to 168 feet. Mapped thicknesses<br />
are less reliable in areas where few<br />
or no control points exist, such as near<br />
<strong>the</strong> aquifer boundary. Such areas occur<br />
west <strong>of</strong> <strong>the</strong> Brazos River in northwest<br />
Milam County, west <strong>of</strong> <strong>the</strong> Brazos River<br />
in northwest Burleson County, east <strong>of</strong><br />
<strong>the</strong> Brazos River in Brazos County, east<br />
<strong>of</strong> <strong>the</strong> Brazos River in Grimes County,<br />
and east <strong>of</strong> <strong>the</strong> Brazos River in Waller<br />
<strong>Texas</strong> Water Development Board <strong>Report</strong> <strong>374</strong> 153
32°<br />
97°30'<br />
Hill<br />
Bosque<br />
Waco<br />
31°30'<br />
McLennan<br />
97°30'<br />
97°<br />
32°<br />
31°30'<br />
Thickness <strong>of</strong> Brazos River Alluvium Aquifer,<br />
in feet<br />
Negligible–20<br />
21–36<br />
37–49<br />
50–59<br />
60–68<br />
69–77<br />
78–92<br />
93–168<br />
Boundary <strong>of</strong> Brazos River Alluvium Aquifer 1.5-mile buffer<br />
0 10 20 30 40 50 Miles<br />
Falls<br />
96°30'<br />
0 10 20 30 40 50 Kilometers<br />
31°<br />
Robertson<br />
31°<br />
Milam<br />
Brazos<br />
Bryan<br />
96°<br />
97°<br />
30°30'<br />
Burleson<br />
Grimes<br />
30°30'<br />
Washington<br />
Waller<br />
30°<br />
Austin<br />
30°<br />
96°30'<br />
Sugar Land<br />
95°30'<br />
29°30'<br />
96°<br />
Fort<br />
Bend<br />
95°30'<br />
29°30'<br />
Figure 7-4. Thickness <strong>of</strong> <strong>the</strong> Brazos River Alluvium Aquifer, Bosque County to Fort Bend County, <strong>Texas</strong>.<br />
County. In areas <strong>of</strong> few or no control<br />
points, such as near <strong>the</strong> aquifer boundary,<br />
thicknesses greater than about 100<br />
feet might be anomalous. As described<br />
in <strong>the</strong> previous section, ano<strong>the</strong>r area<br />
where thicknesses potentially are less<br />
reliable is Fort Bend County because <strong>of</strong><br />
<strong>the</strong> difficulty in identifying <strong>the</strong> base <strong>of</strong><br />
<strong>the</strong> aquifer from logs.<br />
7.4.4<br />
Distribution <strong>of</strong> hydraulic properties<br />
The areal distribution <strong>of</strong> hydraulic<br />
properties in <strong>the</strong> Brazos River Alluvium<br />
Aquifer (Figure 7-5) shows that most <strong>of</strong><br />
<strong>the</strong> data are concentrated in <strong>the</strong> central<br />
part <strong>of</strong> <strong>the</strong> aquifer (Milam, Robertson,<br />
Burleson, and Brazos counties); few<br />
data exist for <strong>the</strong> northwestern and<br />
154 <strong>Texas</strong> Water Development Board <strong>Report</strong> <strong>374</strong>
97°30'<br />
97°<br />
32°<br />
Hill<br />
32°<br />
Boundary <strong>of</strong> Brazos River Alluvium Aquifer 1.5-mile buffer<br />
Brazos River Alluvium Aquifer extent<br />
Bosque<br />
County boundary<br />
#*<br />
Transmissivity<br />
!(<br />
Specific capacity<br />
Waco<br />
*#<br />
")<br />
Hydraulic conductivity represents seven values<br />
31°30'<br />
97°30'<br />
McLennan<br />
!(<br />
*#<br />
*#<br />
31°30'<br />
0 10 20 30 40 50 Miles<br />
!(<br />
*#<br />
!(<br />
*#<br />
96°30'<br />
0 10 20 30 40 50 Kilometers<br />
Falls<br />
!(<br />
*#<br />
!<br />
(<br />
#<br />
*<br />
** ## !( *#<br />
*#<br />
!!<br />
(( ** ## ! ! (* # (* # !( *# !( *# !(<br />
*#<br />
31°<br />
!!! ((( ** ##<br />
*#<br />
!(<br />
*#<br />
!! (( ** ## !( *# Robertson<br />
31°<br />
Milam<br />
!( *# !( *# !! (( ** ## ! !! ! !!<br />
( (( !<br />
( ((<br />
# ! ## # ##<br />
* ** * **<br />
(#<br />
(# *<br />
* !(<br />
#*<br />
!!<br />
!<br />
! ((<br />
(<br />
!! ! ( #<br />
(( ( !! (( ## #<br />
### *<br />
# ##<br />
** *<br />
*** * **<br />
!! ! (( ( ## # ** * !!! ((( ### *** !(<br />
!(<br />
#*<br />
#*<br />
# *! ( !! (( ## ** ! ! !<br />
( ( ( #<br />
#<br />
*<br />
* !!! ((( ### *** #* !( #* !!! ((( ### *** (( !(<br />
#*<br />
Brazos<br />
96°<br />
!( #* !! (( ## ** !( #* !( #* #*<br />
!!!<br />
! !!!<br />
!!<br />
! (((<br />
!!<br />
!!<br />
!!!<br />
! ! #<br />
## ( (((<br />
###<br />
((<br />
!! !<br />
((<br />
(((<br />
( ( *<br />
** # ###<br />
## !<br />
(( (<br />
## ## # ***<br />
* ***<br />
** ## #<br />
** #<br />
** * * ## **<br />
(#<br />
** *<br />
*<br />
*((<br />
!! ## **<br />
Bryan<br />
97°<br />
30°30'<br />
Burleson<br />
! !!! !!! !<br />
( ((( (<br />
# ### (((<br />
#<br />
* *** ### *** *<br />
#*<br />
!<br />
! !! ! !<br />
(<br />
( (( ( (<br />
# ##<br />
##<br />
(! # #<br />
* **<br />
**<br />
* * *<br />
# #*")<br />
* (!<br />
# (!<br />
#*<br />
*<br />
#* (! (! #* !!<br />
! ((<br />
( #*<br />
## **<br />
(!<br />
#*<br />
Grimes<br />
30°30'<br />
(! #* (! #* (!<br />
(!<br />
# (!<br />
#<br />
#*<br />
*<br />
*<br />
(!<br />
#*<br />
((((<br />
!!!! #<br />
##<br />
*<br />
**<br />
(( !! ## **<br />
(!<br />
#*<br />
Washington<br />
Waller<br />
30°<br />
30°<br />
Austin<br />
#* 96°30'<br />
Sugar Land<br />
95°30'<br />
29°30'<br />
96°<br />
Fort<br />
Bend<br />
95°30'<br />
29°30'<br />
Figure 7-5. Areal distribution <strong>of</strong> hydraulic properties <strong>of</strong> <strong>the</strong> Brazos River Alluvium Aquifer, Bosque<br />
County to Fort Bend County, <strong>Texas</strong>. Outlined area denotes area in Burleson County where hydraulic<br />
conductivity values were taken.<br />
sou<strong>the</strong>astern parts <strong>of</strong> <strong>the</strong> aquifer. The<br />
largest and smallest specific capacities,<br />
respectively, are 134 gallons per minute<br />
per foot (Burleson County) and 1.44 gallons<br />
per minute per foot (Falls County);<br />
<strong>the</strong> median is 23.5 gallons per minute per<br />
foot (Table 7-1). A histogram <strong>of</strong> specific<br />
capacity values (Figure 7-6) shows that<br />
<strong>the</strong> most frequent range (about 82 percent<br />
<strong>of</strong> <strong>the</strong> values) is 0 to 40 gallons per<br />
minute per foot.<br />
The largest and smallest transmissivity<br />
values, respectively, are about 28,000<br />
feet squared per day (Brazos County)<br />
<strong>Texas</strong> Water Development Board <strong>Report</strong> <strong>374</strong> 155
Table 7-1. Summary statistics <strong>of</strong> hydraulic properties, Brazos River Alluvium Aquifer, Bosque County to Fort Bend County, <strong>Texas</strong>.<br />
Hydraulic property<br />
Specific capacity<br />
([gal/min]/ft)<br />
Transmissivity<br />
(ft 2 /d)<br />
Hydraulic<br />
conductivity (ft/d)<br />
Number<br />
<strong>of</strong> wells<br />
Minimum<br />
First<br />
quartile Median Mean<br />
Third<br />
quartile<br />
Maximum<br />
358 1.44 15.9 23.5 28.4 33.9 134<br />
371 289 2,980 4,550 5,590 6,800 27,800<br />
7 179 — 217 241 — 447<br />
Note: All values rounded to three significant figures.<br />
(gal/min)/ft = gallons per minute per foot; ft 2 /d = feet squared per day; ft/d = feet per day<br />
and about 300 feet squared per day (Falls<br />
County); <strong>the</strong> median is 4,550 feet squared<br />
per day (Table 7-1). A histogram <strong>of</strong> transmissivity<br />
values (Figure 7-7) shows that<br />
<strong>the</strong> most frequent range (42 percent <strong>of</strong><br />
<strong>the</strong> values) is 0–4,000 feet squared per<br />
day. Among <strong>the</strong> 7 hydraulic conductivity<br />
values in Burleson County, <strong>the</strong> largest<br />
and smallest are 447 and 179 feet per day,<br />
respectively (Table 7-1).<br />
7.5<br />
Summary<br />
As <strong>the</strong> Brazos River Alluvium Aquifer<br />
becomes more important in <strong>the</strong> future<br />
and <strong>the</strong> demand for water increases<br />
statewide, a thorough understanding <strong>of</strong><br />
<strong>the</strong> hydrogeology in <strong>the</strong> area is essential.<br />
The U.S. Geological Survey, in cooperation<br />
with TWDB, conducted a study<br />
to characterize and delineate <strong>the</strong> altitude<br />
<strong>of</strong> <strong>the</strong> top, altitude <strong>of</strong> <strong>the</strong> base, and<br />
thickness <strong>of</strong> <strong>the</strong> Brazos River Alluvium<br />
Aquifer and to compile and summarize<br />
available hydraulic property data. The<br />
study area encompasses <strong>the</strong> aquifer in<br />
parts <strong>of</strong> Bosque, Hill, McLennan, Falls,<br />
Robertson, Milam, Brazos, Burleson,<br />
Grimes, Washington, Waller, Austin,<br />
and Fort Bend Counties. A 1.5-mile-wide<br />
lateral buffer adjacent to <strong>the</strong> aquifer was<br />
used to ensure a complete characterization<br />
<strong>of</strong> <strong>the</strong> aquifer. A digital elevation<br />
model was used as <strong>the</strong> altitude <strong>of</strong> <strong>the</strong><br />
top <strong>of</strong> <strong>the</strong> aquifer. The altitude <strong>of</strong> <strong>the</strong><br />
base <strong>of</strong> <strong>the</strong> aquifer was generated using<br />
data from wells from various sources.<br />
The results <strong>of</strong> this study will be used<br />
by TWDB for input into a groundwater<br />
availability model.<br />
7.6<br />
Acknowledgments<br />
The authors would like to thank <strong>the</strong><br />
<strong>Texas</strong> Water Development Board for<br />
providing <strong>the</strong> funding for this effort.<br />
In addition, we appreciate Joe Yelderman<br />
<strong>of</strong> Baylor University and Clyde<br />
Munster <strong>of</strong> <strong>Texas</strong> A&M University for<br />
<strong>the</strong>ir assistance in providing hydrologic<br />
data for areas in McLennan and Brazos<br />
counties.<br />
156 <strong>Texas</strong> Water Development Board <strong>Report</strong> <strong>374</strong>
300<br />
292<br />
Number <strong>of</strong> occurrences<br />
Number <strong>of</strong> occurrences<br />
200<br />
300<br />
100<br />
200<br />
0<br />
100<br />
292<br />
56<br />
0 40 80 120 160<br />
Specific capacity<br />
(gallons per minute per foot)<br />
56<br />
9<br />
1<br />
Figure 7-6. Histogram <strong>of</strong> specific capacity, Brazos River Alluvium Aquifer, Bosque County to Fort Bend County, <strong>Texas</strong>.<br />
160 156<br />
9<br />
148<br />
1<br />
0<br />
0 40 80 120 160<br />
Specific capacity<br />
(gallons per minute per foot)<br />
120<br />
Number <strong>of</strong> occurrences<br />
Number <strong>of</strong> occurrences<br />
160 156<br />
80<br />
120<br />
40<br />
80<br />
0<br />
40<br />
148<br />
40<br />
13<br />
5 6<br />
0 4,000 8,000 12,000 16,000 20,000 24,000 28,000<br />
40<br />
Transmissivity<br />
(feet squared per day)<br />
3<br />
0<br />
13<br />
5 6<br />
3<br />
0 4,000 8,000 12,000 16,000 20,000 24,000 28,000<br />
Transmissivity<br />
(feet squared per day)<br />
Figure 7-7. Histogram <strong>of</strong> transmissivity, Brazos River Alluvium Aquifer, Bosque County to Fort Bend County, <strong>Texas</strong>.<br />
<strong>Texas</strong> Water Development Board <strong>Report</strong> <strong>374</strong> 157
7.7<br />
References<br />
Ashworth, J.B., and Hopkins, J., 1995, <strong>Aquifers</strong> <strong>of</strong> <strong>Texas</strong>: <strong>Texas</strong> Water Development<br />
Board <strong>Report</strong> 345, 69 p.<br />
Clark, W.I., 1937a, Records <strong>of</strong> wells and springs, drillers’ logs, water analyses, and map<br />
showing locations <strong>of</strong> wells in Burleson County, <strong>Texas</strong>: <strong>Texas</strong> Board <strong>of</strong> Water Engineers<br />
duplicated report, 46 p.<br />
Clark, W.I., 1937b, Records <strong>of</strong> wells and springs, drillers’ logs, water analyses, and map<br />
showing locations <strong>of</strong> wells in Milam County, <strong>Texas</strong>: <strong>Texas</strong> Board <strong>of</strong> Water Engineers<br />
duplicated report, 57 p.<br />
Cronin, J.G., and Follett, C.R., 1963, Reconnaissance investigation <strong>of</strong> <strong>the</strong> ground-water<br />
resources <strong>of</strong> <strong>the</strong> Brazos River Basin, <strong>Texas</strong>: <strong>Texas</strong> Water Commission Bulletin 6310,<br />
152 p.<br />
Cronin J.G., and Wilson, C.A., 1967, Ground water in <strong>the</strong> floodplain alluvium <strong>of</strong> <strong>the</strong><br />
Brazos River, Whitney Dam to vicinity <strong>of</strong> Richmond, <strong>Texas</strong>: <strong>Texas</strong> Water Development<br />
Board <strong>Report</strong> 41, 206 p.<br />
Davis, L.G., 1942, Records <strong>of</strong> wells and springs, drillers’ logs, water analyses, and map<br />
showing locations <strong>of</strong> wells and springs in Robertson County, <strong>Texas</strong>: <strong>Texas</strong> Board <strong>of</strong><br />
Water Engineers duplicated report, 61 p.<br />
Driscoll, F.G., 1986, Groundwater and wells (2d ed.): St. Paul, Minn., Johnson Filtration<br />
Systems, Inc., 1,089 p.<br />
Elledge, G.A., 1937, Records <strong>of</strong> wells, drillers’ logs, water analyses, and maps showing<br />
locations <strong>of</strong> wells in Fort Bend County, <strong>Texas</strong>: <strong>Texas</strong> Board <strong>of</strong> Engineers duplicated<br />
report, 91 p.<br />
ESRI, 2007, GIS and mapping s<strong>of</strong>tware: accessed June 10, 2007, at http://www.esri.com.<br />
Fluellen, T.R., and Goines, W.H., 1952, Water resources <strong>of</strong> Waller County, <strong>Texas</strong>: <strong>Texas</strong><br />
Board <strong>of</strong> Engineers Bulletin 5208, 57 p.<br />
Follett, C.R., 1943, Records <strong>of</strong> wells and springs, drillers’ logs, water analyses, and map<br />
showing locations <strong>of</strong> wells and springs in Washington County, <strong>Texas</strong>: <strong>Texas</strong> Board<br />
<strong>of</strong> Water Engineers duplicated report, 45 p.<br />
Harlan, S.K., 1990, Hydrogeologic assessment <strong>of</strong> <strong>the</strong> Brazos River alluvium aquifer, Waco<br />
to Marlin, <strong>Texas</strong>: Waco, Tex., Baylor University, Master’s <strong>the</strong>sis, 124 p.<br />
HDR Engineering, Inc., 2001, Brazos River alluvium groundwater model and conjunctive<br />
use analysis: HDR Engineering, Inc., File Copy 2002-0152, 27 p.<br />
Hughes, W.F., and Magee, A.C., 1962, An economic analysis <strong>of</strong> irrigated cotton production,<br />
middle Brazos River Valley, 1955–58: <strong>Texas</strong> Agricultural and Mechanical<br />
College MP–580, 12 p.<br />
Livingston, P., and Turner, S.F., 1939, Records <strong>of</strong> wells, drillers’ logs, water analyses, and<br />
map showing wells in Fort Bend County, <strong>Texas</strong>: <strong>Texas</strong> Board <strong>of</strong> Water Engineers<br />
duplicated report, 11 p.<br />
May, R.E., 1938, Records <strong>of</strong> wells and springs, drillers’ logs, water analyses, and map<br />
showing locations <strong>of</strong> wells and springs in Austin County, <strong>Texas</strong>: <strong>Texas</strong> Board <strong>of</strong> Water<br />
Engineers duplicated report, 36 p.<br />
158 <strong>Texas</strong> Water Development Board <strong>Report</strong> <strong>374</strong>
Naftel, W.L., Vaught, K., and Flemming, B., 1976, Records <strong>of</strong> wells, drillers’ logs, waterlevel<br />
measurements, and chemical analyses <strong>of</strong> ground water in Brazoria, Fort Bend,<br />
and Waller Counties, <strong>Texas</strong>, 1966–74: <strong>Texas</strong> Water Development Board <strong>Report</strong> 201,<br />
90 p.<br />
Shah, S.D., and Houston, N.A., 2007, Geologic and hydrogeologic information for a<br />
geodatabase for <strong>the</strong> Brazos River alluvium aquifer, Bosque County to Fort Bend<br />
County, <strong>Texas</strong>: U.S. Geological Survey Open-File <strong>Report</strong> 2007-1031, 10 p.<br />
TWDB (<strong>Texas</strong> Water Development Board), 2006, Well site remarks table: accessed<br />
November 1, 2006, at http://www.twdb.state.tx.us/publications/reports/<br />
GroundWater<strong>Report</strong>s/GWDatabase<strong>Report</strong>s/ GWdatabaserpt.htm.<br />
TWDB (<strong>Texas</strong> Water Development Board), 2007, Minor aquifers <strong>of</strong> <strong>Texas</strong>:<br />
<strong>Texas</strong> Water Development Board, Mapping, accessed September 6, 2007, at<br />
http://www.twdb.state.tx.us/mapping.<br />
Turner, S.F., 1939, Records <strong>of</strong> wells and springs, drillers’ logs, water analyses, and map<br />
showing locations <strong>of</strong> wells in Grimes County, <strong>Texas</strong>: <strong>Texas</strong> Board <strong>of</strong> Water Engineers<br />
duplicated report, 5 p.<br />
Turner, S.F., and Livingston, P., 1939, Records <strong>of</strong> wells and springs, drillers’ logs, water<br />
analyses, and map showing locations <strong>of</strong> wells and springs in Waller County, <strong>Texas</strong>:<br />
<strong>Texas</strong> Board <strong>of</strong> Water Engineers duplicated report, 20 p.<br />
USGS (U.S. Geological Survey), 2007, Seamless Data Distribution System:<br />
Earth Resources Observation and Science (EROS), accessed July 2007, at<br />
http://seamless.usgs.gov.<br />
Wrobleski, C.L., 1996, An aquifer characterization at <strong>the</strong> <strong>Texas</strong> A&M University Brazos<br />
River Hydrogeologic Field Site, Burleson County, <strong>Texas</strong>: College Station, Tex., <strong>Texas</strong><br />
A&M University, Master’s <strong>the</strong>sis, 127 p.<br />
<strong>Texas</strong> Water Development Board <strong>Report</strong> <strong>374</strong> 159
This page is intentionally blank.<br />
160 <strong>Texas</strong> Water Development Board <strong>Report</strong> <strong>374</strong>
Chapter 8<br />
Low-Flow Gain-Loss Study <strong>of</strong> <strong>the</strong> Colorado River in<br />
Bastrop County, <strong>Texas</strong><br />
Ge<strong>of</strong>frey P. Saunders, P.G., C.G.W.P. 1<br />
field investigation was conducted<br />
A in November 2008 as a followup<br />
to previous gain-loss studies <strong>of</strong> <strong>the</strong><br />
lower Colorado River in <strong>Texas</strong>. Previous<br />
studies conducted by <strong>the</strong> Lower<br />
Colorado River Authority (LCRA) <strong>of</strong><br />
groundwater-surface water interaction<br />
between <strong>the</strong> Carrizo-Wilcox Aquifer<br />
and <strong>the</strong> Colorado River provided valuable<br />
information, but <strong>the</strong> results were<br />
inconclusive. The 2008 LCRA study<br />
was a more detailed investigation <strong>of</strong><br />
gains and losses in river flow upstream<br />
and downstream from <strong>the</strong> outcrops <strong>of</strong><br />
two productive aquifer units: <strong>the</strong> Simsboro<br />
Sand and Carrizo Sand.<br />
8.1<br />
Study area<br />
The lower Colorado River flows through<br />
Bastrop County, <strong>Texas</strong>, in a meandering<br />
channel within a broad alluvial floodplain<br />
(Figure 8-1). Outcrops <strong>of</strong> <strong>the</strong> Simsboro<br />
Sand and Carrizo Sand are exposed<br />
along <strong>the</strong> banks <strong>of</strong> <strong>the</strong> river and underneath<br />
<strong>the</strong> alluvium associated with <strong>the</strong><br />
river. The Simsboro Sand is exposed in<br />
a 70-foot cliff at Powell Bend upstream<br />
from <strong>the</strong> town <strong>of</strong> Bastrop (Figure 8-2).<br />
The Carrizo Sand underlies <strong>the</strong> Colorado<br />
River between Bastrop and <strong>the</strong> Colovista<br />
Country Club measurement site shown<br />
on Figure 8-1. At some locations, small<br />
seeps and springs may be found along<br />
<strong>the</strong> banks <strong>of</strong> <strong>the</strong> river, but most groundwater-surface<br />
water interaction occurs<br />
through <strong>the</strong> river alluvium.<br />
8.2<br />
Previous studies<br />
Earlier low-flow investigations by <strong>the</strong><br />
U.S. Geological Survey in 1918 found<br />
that <strong>the</strong> Colorado River gained about 36<br />
cubic feet per second across <strong>the</strong> outcrop<br />
<strong>of</strong> <strong>the</strong> Carrizo-Wilcox Aquifer (TBWE,<br />
1960). A study conducted by LCRA <strong>of</strong><br />
streamflow hydrographs during lowflow<br />
conditions in 1999 found data suggesting<br />
a possible gain in river flow <strong>of</strong><br />
59 cubic feet per second between gaging<br />
stations at Bastrop and Smithville,<br />
based upon <strong>the</strong> U.S. Geological Survey<br />
streamgage readings (Saunders, 2005).<br />
A field investigation conducted by<br />
LCRA in November 2005 also produced<br />
data suggesting a possible net gain in<br />
river flow from Utley to Smithville <strong>of</strong> 50<br />
cubic feet per second (Saunders, 2006).<br />
8.3<br />
Methods<br />
This study was conducted according to<br />
<strong>the</strong> methods for low-flow investigations<br />
and gain-loss studies recommended by<br />
<strong>the</strong> U.S. Geological Survey (Riggs, 1972;<br />
Slade and o<strong>the</strong>rs, 2002). Conditions<br />
<strong>of</strong> steady river flow, dry wea<strong>the</strong>r, and<br />
minimal tributary inflows, discharges,<br />
and withdrawals were ideal for a lowflow<br />
investigation during an ongoing<br />
dry period in late November 2008.<br />
The field investigation was conducted<br />
November 24–25, 2008. Although river<br />
flow is continuously monitored at gaging<br />
stations at Bastrop and Smithville,<br />
flow measurements for this study were<br />
taken at four mainstem locations, as<br />
well as on any tributaries between Utley<br />
and Smithville in which flow was present.<br />
Streamflow was measured using<br />
acoustic Doppler velocity meters and<br />
portable cut-throat flumes. Best efforts<br />
1 Lower Colorado River Authority<br />
<strong>Texas</strong> Water Development Board <strong>Report</strong> <strong>374</strong> 161
Figure 8-1. Low-flow measurements in <strong>the</strong> reach <strong>of</strong> <strong>the</strong> Colorado River from Utley to Smithville, Bastrop County, <strong>Texas</strong>,<br />
November 24–25, 2008 (LCRA graphic).<br />
cfs = cubic feet per second<br />
were made to maximize <strong>the</strong> accuracy<br />
<strong>of</strong> streamflow measurements; however,<br />
<strong>the</strong> estimated error associated with this<br />
type <strong>of</strong> measurement is 5 percent or better<br />
(Rantz, 1982). Fur<strong>the</strong>rmore, although<br />
flow measurements were not taken<br />
continuously for <strong>the</strong> two-day period <strong>of</strong><br />
this study, <strong>the</strong> river was considered to<br />
be in a near-steady flow condition so<br />
that estimates <strong>of</strong> gains and losses could<br />
be estimated. In order to complete <strong>the</strong><br />
estimates, all known discharges and<br />
withdrawals were verified by observation<br />
and by checking with <strong>the</strong> plant<br />
operators.<br />
8.4<br />
Results<br />
Results <strong>of</strong> data collection are shown<br />
in Table 8-1. The data are arranged in<br />
162 <strong>Texas</strong> Water Development Board <strong>Report</strong> <strong>374</strong>
Figure 8-2. Outcrop <strong>of</strong> <strong>the</strong> Simsboro Sand Formation along <strong>the</strong> Colorado River at Powell Bend, Bastrop<br />
County, <strong>Texas</strong> (LCRA photo).<br />
order from upstream to downstream to<br />
indicate gain-loss relationships.<br />
River flow measurements at Utley,<br />
Bob Bryant Park upstream from Bastrop,<br />
Colovista Country Club downstream<br />
from Bastrop, and Smithville were<br />
remarkably consistent, ranging between<br />
231 and 237 cubic feet per second. There<br />
was a relatively large withdrawal <strong>of</strong><br />
water at Powell Bend to supplement<br />
Lake Bastrop (30 cubic feet per second)<br />
during <strong>the</strong> field investigation. Tributary<br />
inflows were negligible at Wilbarger<br />
Creek (0 cubic feet per second); Big<br />
Sandy Creek (1.5 cubic feet per second);<br />
Piney Creek (0 cubic feet per second);<br />
Gills Branch (0 cubic feet per second);<br />
Alum Creek (0 cubic feet per<br />
second); Cedar Creek (0.5 cubic feet<br />
per second); and Gazley Creek (0 cubic<br />
feet per second). The City <strong>of</strong> Bastrop<br />
wastewater treatment plant was<br />
discharging (1 cubic foot per second)<br />
during <strong>the</strong> field investigation.<br />
Although <strong>the</strong>re was no significant<br />
increase in river flow between <strong>the</strong> mainstem<br />
measurement sites, <strong>the</strong> relatively<br />
large withdrawal <strong>of</strong> water at Powell Bend<br />
for Lake Bastrop (30 cubic feet per second)<br />
factors into <strong>the</strong> analysis. Considering<br />
differences in measured river flow,<br />
tributary inflows, and <strong>the</strong> withdrawal<br />
at Powell Bend, <strong>the</strong> data suggests a net<br />
gain between Utley and Bastrop <strong>of</strong> 30<br />
cubic feet per second. Such a gain would<br />
most likely be attributable to groundwater<br />
contribution from <strong>the</strong> Simsboro Sand<br />
to <strong>the</strong> Colorado River.<br />
Downstream from Bastrop, <strong>the</strong> data<br />
indicate no increase in river flow nor any<br />
significant withdrawals or discharges.<br />
Therefore, <strong>the</strong>re was no apparent gain<br />
in river flow attributable to <strong>the</strong> Carrizo<br />
Sand during <strong>the</strong> field investigation.<br />
<strong>Texas</strong> Water Development Board <strong>Report</strong> <strong>374</strong> 163
Table 8-1. Results <strong>of</strong> data collection, November 24–25, 2008.<br />
Inflow (-) or<br />
Mainsteam Off-channel Type<br />
Flow<br />
(cfs)<br />
outflow (+)<br />
(cfs)<br />
Net gain-loss (cfs)<br />
Colorado River<br />
at Utley<br />
River flow 231<br />
Wilbarger Creek Tributary 0<br />
Big Sandy Creek Tributary -1.5<br />
Sim Gideon<br />
pumping station<br />
Withdrawal +30<br />
Colorado River<br />
at Bob Bryant<br />
River flow 237 (237–231) -1.5 + 30 = 34.5<br />
Park<br />
Piney Creek Tributary 0<br />
City <strong>of</strong> Bastrop<br />
WWTP<br />
Discharge -1<br />
Gills Branch Tributary 0<br />
Colorado River<br />
at Colovista<br />
River flow 234 (234–237) -1 = -4<br />
Country Club<br />
Colovista Country<br />
Club pump<br />
Withdrawal 0<br />
Cedar Creek Tributary -0.5<br />
Alum Creek Tributary 0<br />
Gazley Creek Tributary 0<br />
Colorado River<br />
at Smithville<br />
River flow 234 (234–234) - 0.5 = -.5<br />
Net gain +30<br />
cfs = cubic feet per second; WWTP = wastewater treatment plant<br />
8.5<br />
Conclusions<br />
As shown in Table 8-1, <strong>the</strong> total net gain<br />
to <strong>the</strong> Colorado River from <strong>the</strong> Carrizo-<br />
Wilcox Aquifer in Bastrop County was<br />
estimated to be 30 cubic feet per second<br />
during <strong>the</strong> November 2008 low-flow<br />
event. This compares to <strong>the</strong> U.S. Geological<br />
Survey 1918 estimate <strong>of</strong> 36 cubic<br />
feet per second and <strong>the</strong> LCRA estimate<br />
<strong>of</strong> 50 cubic feet per second in November<br />
2005.<br />
Thus, <strong>the</strong> potential groundwater contribution<br />
<strong>of</strong> flow to <strong>the</strong> Colorado River<br />
from <strong>the</strong> Carrizo-Wilcox Aquifer may<br />
be significant, particularly when compared<br />
to more well-known sources such<br />
as Barton Springs in Austin, which was<br />
flowing at 19 cubic feet per second during<br />
<strong>the</strong> field investigation in November<br />
2008. Contributions to <strong>the</strong> base flow<br />
from <strong>the</strong>se sources can be important<br />
during critical low-flow conditions.<br />
Although groundwater flow in sand<br />
aquifers is generally considered to<br />
be slow and steady, it is possible that<br />
groundwater contributions to <strong>the</strong> lower<br />
Colorado River may be variable from<br />
one time period to ano<strong>the</strong>r. However,<br />
a study <strong>of</strong> groundwater-surface water<br />
interaction prepared as part <strong>of</strong> development<br />
<strong>of</strong> <strong>the</strong> central Carrizo-Wilcox<br />
groundwater availability model indicated<br />
that base flow rates <strong>of</strong> rivers crossing <strong>the</strong><br />
aquifer outcrop have not decreased over<br />
time, and seasonal variability in base flow<br />
for perennial streams may not fluctuate<br />
significantly (Dutton and o<strong>the</strong>rs, 2003).<br />
In addition, flow from bedrock aquifers<br />
164 <strong>Texas</strong> Water Development Board <strong>Report</strong> <strong>374</strong>
through <strong>the</strong> alluvium to <strong>the</strong> river is a complicated<br />
system and requires fur<strong>the</strong>r data<br />
and analysis. As demands on groundwater<br />
resources increase with future growth<br />
in Central <strong>Texas</strong>, groundwater-surface<br />
water interactions may need to be periodically<br />
monitored to assess water availability<br />
in <strong>the</strong> decades to come.<br />
8.6<br />
References<br />
Dutton, A.R., Harden, B., Nicot, J.-P., and O’Rourke, D., 2003, Groundwater availability<br />
model for <strong>the</strong> central part <strong>of</strong> <strong>the</strong> Carrizo-Wilcox Aquifer in <strong>Texas</strong>, Appendix<br />
B—Surface water-groundwater interaction in <strong>the</strong> central Carrizo-Wilcox Aquifer,<br />
by O’Rourke, D., and Ch<strong>of</strong>fel, K.: Prepared for <strong>the</strong> <strong>Texas</strong> Water Development Board,<br />
295 p.<br />
Rantz, S.E., and o<strong>the</strong>rs, 1982, Measurement and computation <strong>of</strong> streamflow, Volume<br />
2—Computation <strong>of</strong> discharge: U.S. Geological Survey Water-Supply Paper 2175,<br />
631 p.<br />
Riggs, H.C., 1972, Low-flow investigations: U.S Geological Survey Techniques <strong>of</strong> Water-<br />
Resources Investigations, book 4, sec. B, chap. B1, 23 p.<br />
Saunders, G.P., 2005, Low flow gain-loss study, Task 1—Water year 2000 historical data<br />
analysis: LCRA interim report, 10 p.<br />
Saunders, G.P., 2006, Low flow gain-loss study <strong>of</strong> <strong>the</strong> Colorado River in <strong>Texas</strong>, in Mace,<br />
R.E., and o<strong>the</strong>rs, eds., <strong>Aquifers</strong> <strong>of</strong> <strong>the</strong> Gulf Coast <strong>of</strong> <strong>Texas</strong>: <strong>Texas</strong> Water Development<br />
Board <strong>Report</strong> 365, 312 p.<br />
Slade, Jr., R.M., Bentley, J.T., and Michaud, D., 2002, Results <strong>of</strong> streamflow gain-loss<br />
studies in <strong>Texas</strong>, with emphasis on gains from and losses to major and minor aquifers:<br />
U.S. Geological Survey Open-File <strong>Report</strong> 02-068, 136 p.<br />
TBWE (<strong>Texas</strong> Board <strong>of</strong> Water Engineers), 1960, Channel gain and loss investigations,<br />
<strong>Texas</strong> streams, 1918–1958: <strong>Texas</strong> Board <strong>of</strong> Water Engineers Bulletin 5807-D, 270 p.<br />
<strong>Texas</strong> Water Development Board <strong>Report</strong> <strong>374</strong> 165
166 <strong>Texas</strong> Water Development Board <strong>Report</strong> <strong>374</strong><br />
This page is intentionally blank.
Chapter 9<br />
Evaluation <strong>of</strong> <strong>the</strong> Brackish Groundwater Resources <strong>of</strong> <strong>the</strong><br />
Wilcox Aquifer in <strong>the</strong> San Antonio, <strong>Texas</strong>, Area<br />
Charles W. Kreitler 1 , Kevin H. Morrison 2<br />
San Antonio Water System (SAWS)<br />
and LBG-Guyton Associates have<br />
evaluated <strong>the</strong> feasibility <strong>of</strong> <strong>the</strong> longterm<br />
production <strong>of</strong> brackish groundwater<br />
for desalination from <strong>the</strong> Wilcox<br />
Aquifer in sou<strong>the</strong>rn Bexar and nor<strong>the</strong>rn<br />
Atascosa counties. Desalination <strong>of</strong><br />
brackish groundwater is an important<br />
component <strong>of</strong> SAWS’ 2009 50-Year<br />
Water Management Plan. The results<br />
<strong>of</strong> this study indicate that <strong>the</strong> production<br />
<strong>of</strong> 10–25 million gallons per day <strong>of</strong><br />
brackish groundwater is technically feasible.<br />
The Wilcox Formation in sou<strong>the</strong>rn<br />
Bexar and nor<strong>the</strong>rn Atascosa counties<br />
is brackish, with total dissolved solids<br />
values that range from about 1,200 milligrams<br />
per liter to 1,700 milligrams per<br />
liter. The Lower Wilcox contains thick<br />
sands that appear laterally continuous.<br />
A thick aquitard composed mostly <strong>of</strong><br />
shale separates <strong>the</strong> brackish Wilcox<br />
sands from <strong>the</strong> overlying fresh water<br />
Carrizo Aquifer. Test wells at three<br />
locations were pumped at rates <strong>of</strong> about<br />
1,000 gallons per minute for time periods<br />
extending up to two weeks. Based on<br />
<strong>the</strong> <strong>Texas</strong> Water Development Board’s<br />
(TWDB) sou<strong>the</strong>rn Queen City-Sparta<br />
groundwater availability model for <strong>the</strong><br />
region, production <strong>of</strong> 20 million gallons<br />
per day for 25 years will cause water<br />
levels at <strong>the</strong> well field to decline about<br />
250 feet. Current users <strong>of</strong> <strong>the</strong> Wilcox<br />
groundwater are located far updip from<br />
<strong>the</strong> proposed well field and, <strong>the</strong>refore,<br />
brackish pumping would have minimal<br />
impact to <strong>the</strong>se users. Modeling suggests<br />
water levels in <strong>the</strong> overlying Carrizo<br />
may decline about 4 feet as a result<br />
<strong>of</strong> 50 years <strong>of</strong> continuously pumping 25<br />
million gallons per day from <strong>the</strong> brackish<br />
Wilcox. Current groundwater users<br />
<strong>of</strong> <strong>the</strong> Carrizo experience seasonal water<br />
level variations far greater than <strong>the</strong><br />
modeled impacts. Carrizo groundwater<br />
users are not expected to be impacted<br />
by Wilcox pumping.<br />
These conclusions are based on 1) a<br />
regional evaluation that selected sites<br />
for detailed testing; 2) construction and<br />
hydrologic and hydrochemical testing <strong>of</strong><br />
wells at three sites, two in Bexar County<br />
and one in Atascosa County; and 3) computer<br />
modeling <strong>of</strong> estimated water level<br />
declines from long-term production<br />
from three potential fields at <strong>the</strong> test<br />
locations. This paper summarizes <strong>the</strong><br />
technical information for this groundwater<br />
study.<br />
9.1<br />
Regional evaluation <strong>of</strong><br />
brackish Wilcox Aquifer<br />
The regional extent <strong>of</strong> brackish groundwater<br />
was evaluated for <strong>the</strong> Wilcox<br />
Aquifer in sou<strong>the</strong>rn Bexar, nor<strong>the</strong>rn<br />
Atascosa, and western Wilson counties.<br />
Available electric log, water chemistry,<br />
pumping test, and water level data<br />
were reviewed. Approximately 170 electric<br />
logs were used. Lithologically, <strong>the</strong><br />
Wilcox was subdivided into two units,<br />
an <strong>Upper</strong> Wilcox and a Lower Wilcox.<br />
The <strong>Upper</strong> Wilcox was characteristically<br />
shaley, whereas <strong>the</strong> Lower Wilcox<br />
contained thick sands. Figure 9-1 is an<br />
electric log from Test Well 3 (Atascosa<br />
County) that shows <strong>the</strong> presence <strong>of</strong> <strong>the</strong><br />
1 LBG-Guyton Associates<br />
2 San Antonio Water System<br />
<strong>Texas</strong> Water Development Board <strong>Report</strong> <strong>374</strong> 167
Reklaw<br />
Formation<br />
Clean<br />
Carrizo<br />
Sand<br />
“Red” delineates<br />
<strong>Upper</strong> Wilcox mud<br />
between Carrizo Aquifer<br />
and Lower Wilcox section<br />
<strong>Upper</strong><br />
Wilcox<br />
mud<br />
Screen<br />
Lower<br />
Wilcox<br />
Sand<br />
Figure 9-1. Geophysical log (resistivity and SP) for Test Well 3 Site, Atascosa County. Log shows Carrizo,<br />
<strong>Upper</strong> Wilcox shale section, Lower Wilcox Sand section, and <strong>Upper</strong> Midway.<br />
168 <strong>Texas</strong> Water Development Board <strong>Report</strong> <strong>374</strong>
Canvasback<br />
Mitchell<br />
VICTOR<br />
BRAUNIG<br />
LAKE<br />
CALAVERAS LAKE<br />
U90 S422 S97<br />
<br />
S1604<br />
<br />
I35<br />
<br />
<br />
SOMERSET<br />
<br />
<br />
A t a s c o s a C o .<br />
S173<br />
<br />
LACKLAND AFB<br />
S13<br />
I410 SAN ANTONIO<br />
S353 S122<br />
<br />
<br />
<br />
<br />
S16<br />
<br />
<br />
<br />
<br />
POTEET<br />
Atascosa River<br />
<br />
<br />
<br />
S1604<br />
<br />
<br />
<br />
<br />
<br />
<br />
<br />
<br />
<br />
<br />
<br />
<br />
<br />
S536<br />
Medina River<br />
U281<br />
<br />
<br />
PLEASANTON<br />
<br />
<br />
<br />
<br />
<br />
<br />
<br />
1<br />
<br />
<br />
<br />
<br />
<br />
<br />
<br />
<br />
<br />
<br />
<br />
<br />
<br />
<br />
<br />
<br />
<br />
<br />
<br />
<br />
<br />
<br />
<br />
<br />
<br />
<br />
<br />
<br />
<br />
300<br />
I37<br />
<br />
<br />
<br />
<br />
<br />
<br />
<br />
<br />
<br />
<br />
<br />
<br />
U87<br />
<br />
<br />
<br />
<br />
<br />
<br />
<br />
<br />
<br />
<br />
<br />
2 U181<br />
<br />
<br />
<br />
<br />
<br />
<br />
<br />
<br />
<br />
<br />
<br />
<br />
<br />
<br />
<br />
<br />
<br />
<br />
<br />
<br />
<br />
<br />
<br />
W i l s o n C o .<br />
<br />
<br />
<br />
<br />
<br />
<br />
<br />
<br />
<br />
San Antonio River<br />
<br />
Lucas Creek<br />
3<br />
Hondo Creek<br />
<br />
<br />
<br />
<br />
400<br />
<br />
Borrego Creek<br />
<br />
<br />
<br />
<br />
4<br />
<br />
<br />
S97<br />
ST. HEDWIG<br />
<br />
<br />
FLORESVILLE<br />
200<br />
Surface geology<br />
Carrizo Sand<br />
Legend<br />
Reklaw Formation<br />
Surface Geology<br />
Wilcox Carrizo Group Sand<br />
Reklaw Formation<br />
Counties<br />
Wilcox Group<br />
Cities<br />
Counties<br />
Public Cities property<br />
Reservoir<br />
Public Property<br />
Reservoir<br />
Rivers<br />
Rivers<br />
ASR Pipeline<br />
ASR Pipeline<br />
Geophysical log Log locations Locations<br />
200 Contour showing <strong>the</strong> <strong>the</strong><br />
altitude altitude<strong>of</strong> <strong>the</strong> 10–20 - ohm-meter sand<br />
ohm-meter thickness <strong>of</strong> sand <strong>the</strong> Wilcox<br />
thickness in feet above <strong>of</strong> <strong>the</strong> (+) Wilcox or<br />
in feet below above (-) mean (+) sea or level<br />
below Contour (-) mean Interval sea is 100 level feet<br />
Contour Recommended interval Sites is 100 feet<br />
<br />
Recommended sites<br />
Miles<br />
0 0.5 1 2 3 4 5<br />
FIGURE 2<br />
Miles<br />
0 0.5 1 2 3 4 5<br />
RECOMMENDED LOCATIONS FOR<br />
ADDITIONAL TESTING OF<br />
WILCOX BRACKISH GROUND<br />
WATER RESOURCES<br />
<br />
JOURDANTON<br />
Prepared by<br />
LBG-GUYTON ASSOCIATES<br />
Figure 9-2. Isopach <strong>of</strong> sand thickness in Wilcox Aquifer in sou<strong>the</strong>rn Bexar, western Wilson, and Atascosa counties.<br />
<strong>Upper</strong> Wilcox shaley section and <strong>the</strong><br />
Lower Wilcox sandy section. Several<br />
cross sections were prepared (LBG-<br />
Guyton, 2006), and structure maps<br />
were prepared for <strong>the</strong> top and base <strong>of</strong><br />
<strong>the</strong> Wilcox. Individual sands along with<br />
<strong>the</strong>ir estimated salinities for all <strong>the</strong> logs<br />
were determined. From <strong>the</strong> electric log<br />
database, a brackish (1,000–3,000 milligrams<br />
per liter) sand thickness map for<br />
<strong>the</strong> Lower Wilcox was <strong>the</strong>n constructed<br />
(Figure 9-2). The Lower Wilcox contains<br />
some thick sands. Four thick sand fairways<br />
were identified as favorable areas<br />
for additional testing and exploration.<br />
A thick sand fairway was considered to<br />
have at least 300 feet <strong>of</strong> sand that contained<br />
brackish groundwater. Four sites<br />
for potential testing were identified: 1)<br />
<strong>the</strong> sou<strong>the</strong>ast corner <strong>of</strong> Bexar County<br />
(Site 1); 2) south <strong>of</strong> <strong>the</strong> San Antonio<br />
River along <strong>the</strong> Bexar/Wilson county<br />
line (Site 2); 3) nor<strong>the</strong>rn Atascosa<br />
County (Site 3); and 4) western Wilson<br />
County (Site 4). Of <strong>the</strong> four fairways<br />
identified, SAWS selected three sites<br />
(Sites 1, 2, and 3) for well construction<br />
and testing (Figure 9-2).<br />
Review <strong>of</strong> <strong>the</strong> geophysical logs also<br />
indicated a laterally extensive shaley<br />
<strong>Upper</strong> Wilcox with thicknesses up to 400<br />
feet (LBG-Guyton, 2008c). An <strong>Upper</strong><br />
Wilcox aquitard isopach map was constructed<br />
(Figure 9-3). This shale section<br />
is present in <strong>the</strong> eastern half <strong>of</strong> Atascosa,<br />
sou<strong>the</strong>rn Bexar, Wilson, and Gonzales<br />
counties.<br />
9.2<br />
Site-specific hydrologic<br />
and geologic data from<br />
three test sites<br />
Water wells and paired monitoring<br />
wells were constructed at Sites 1 and 2.<br />
Only a production well was constructed<br />
at Site 3 (Figure 9-2 and Table 9-1). The<br />
following testing was conducted at all<br />
three sites: 1) geophysical logging; 2)<br />
<strong>Texas</strong> Water Development Board <strong>Report</strong> <strong>374</strong> 169
lithologic (grain size) analysis; 3) water<br />
chemistry analysis; and 4) long-term<br />
aquifer testing. Aquifer test data from<br />
Sites 1, 2, and 3 indicate that groundwater<br />
from <strong>the</strong> Wilcox Aquifer can be<br />
pumped at rates <strong>of</strong> at least 850 to 1,000<br />
gallons per minute. The chemistry <strong>of</strong><br />
<strong>the</strong> water indicates <strong>the</strong> groundwater is<br />
brackish with a total dissolved solids<br />
range <strong>of</strong> about 1,200 to 1,700 milligrams<br />
per liter (LBG-Guyton, 2008a).<br />
9.2.1<br />
Site 1<br />
At Site 1 (Figure 9-2), a test/production<br />
well and a monitoring well were constructed<br />
to a total depth <strong>of</strong> about 1,800<br />
feet (Table 9-1). Test Well 1 had 364 feet<br />
<strong>of</strong> brackish sand screened. In an earlier<br />
part <strong>of</strong> this study, a regional assessment<br />
estimated 300 feet. Sand collected from<br />
<strong>the</strong> screened intervals during drilling<br />
was analyzed to determine gravel pack<br />
and screen slot size.<br />
Two aquifer tests were conducted.<br />
For <strong>the</strong> second test, <strong>the</strong> well was pumped<br />
at a rate <strong>of</strong> about 1,000 gallons per minute<br />
for 15 days with 185 feet <strong>of</strong> drawdown.<br />
The well had a 2-hour specific capacity<br />
<strong>of</strong> 8 gallons per minute per foot and a<br />
transmissivity <strong>of</strong> about 9,000 gallons per<br />
day per foot. Storativity was about 4 x<br />
10 -4 (Table 9-1).<br />
9.2.2<br />
Site 2<br />
At Site 2 (Figure 9-2), a test/production<br />
well and a monitoring well were constructed<br />
to a total depth <strong>of</strong> 1,250 feet.<br />
This well site is stratigraphically updip<br />
from Site 1 and, <strong>the</strong>refore, is screened<br />
at shallower depths. Test Well 2 had<br />
LaCoste<br />
San Antonio<br />
BEXAR<br />
Elmendorf<br />
Lytle<br />
MEDINA<br />
Somerset<br />
Floresville<br />
WILSON<br />
ATASCOSA<br />
Poteet<br />
FRIO<br />
Pleasanton<br />
0 2.5 5 10 Miles<br />
Jourdanton<br />
Log locations<br />
50-foot thickness contours<br />
Highways<br />
Counties<br />
Figure 9-3. <strong>Upper</strong> Wilcox aquitard thickness map for Atascosa, Wilson, and Bexar counties.<br />
170 <strong>Texas</strong> Water Development Board <strong>Report</strong> <strong>374</strong>
Table 9-1. Summary <strong>of</strong> pumping tests performed on Wilcox brackish wells.<br />
Tested<br />
well<br />
Total<br />
screen<br />
footage<br />
Observation<br />
well<br />
Date test<br />
started<br />
Average<br />
pumping<br />
rate<br />
(gpm)<br />
Total<br />
minutes<br />
pumped<br />
Total<br />
drawdown<br />
(feet)<br />
2-Hour<br />
specific<br />
capacity<br />
(gpm/<br />
ft)<br />
Calculated<br />
transmissivity<br />
(gpd/ft)<br />
Calculated<br />
transmissivity<br />
(gpd/ft) from<br />
observation<br />
well<br />
Storage<br />
coefficient<br />
(unitless)<br />
MW-1 176 — 11/14/06 194 970 82.6 2.4 6,460 — —<br />
TW-1 364 MW-1 4/18/07 1,074 3,600 177.4 8.0 9,150 9,840 3.7 x 10⁻⁴<br />
TW-1 364 MW-1 3/4/08 986 21,791 184.5 8.0 8,980 8,290 3.7 x 10⁻⁴<br />
MW-2 172 — 12/28/06 244 479 93.8 2.7 7,000 — —<br />
TW-2 254 MW-2 4/11/07 853 2,880 203.2 5.2 9,200 9,050 2.5 x 10⁻⁴<br />
TW-3 431 — 2/12/08 986 2,880 143.4 9.7 9,970 — —<br />
Note: Test Well 1 step tests on 4/14/07 at 804 gallons per minute, 1,130 gallons per minute, and 1,332 gallons per minute<br />
Test Well 2 step tests on 4/10/07 at 608 gallons per minute, 899 gallons per minute, and 1,148 gallons per minute<br />
Test Well 3 step tests on 2/08/08 at 800 gallons per minute, 1,000 gallons per minute and 1,000 gallons per minute estimated from orifice weir<br />
Source: LBG-Guyton Associates, 2008a<br />
MW = monitoring/observation well; TW = test well; gpm = gallon per minute; gpd = gallons per day)<br />
254 feet <strong>of</strong> brackish sand screened.<br />
The regional assessment had estimated<br />
about 300 feet. Sand collected during<br />
drilling <strong>of</strong> <strong>the</strong> screened intervals was<br />
analyzed to determine gravel pack and<br />
screen slot size. The well was pumped<br />
at a rate <strong>of</strong> 850 gallons per minute for<br />
48 hours with 203 feet <strong>of</strong> drawdown.<br />
The well had a 2-hour specific capacity<br />
<strong>of</strong> 5.2 gallons per minute per foot and a<br />
<strong>Texas</strong> Water Development Board <strong>Report</strong> <strong>374</strong> 171
Table 9-2. Hydrochemistry <strong>of</strong> brackish Wilcox test well sites—Test wells 1, 2, and 3.<br />
Field parameters<br />
Lab parameters<br />
Well<br />
ID<br />
Sample<br />
date<br />
pH Temp Conductance TDS Turbidity Calcium Magnesium Sodium Potassium Total Iron<br />
Total<br />
Alk Bicarbonate Chloride Sulfate Fluoride Silica<br />
(s.u.) (deg C) (umhos/cm) Lab (mg/L) NTU (mg/L) (mg/L) (mg/L) (mg/L) (mg/L) (mg/L) (mg/L) (mg/L) (mg/L) (mg/L) (mg/L)<br />
MW-1<br />
11/14/06 7.7 31.0 2,160 LCRA 1,410 NP 44.8 22.8 424 9.38 0.647 207 207 274 508 NP NP<br />
ELI 1,240 1.0 43.7 22.5 415 8.90 0.667 243 296 100 545 1.26 15.6<br />
TW-1<br />
4/20/07 7.5 33.0 1,970 LCRA 1,360 NP 42.8 23.4 389 8.64 0.324 236 233 230 508 NP 19.1<br />
ELI 1,324
transmissivity <strong>of</strong> 9,200 gallons per day<br />
per foot. Storativity was 2.5 x 10 -4 (LBG-<br />
Guyton, 2008a) (Table 9-1).<br />
9.2.3<br />
Site 3<br />
Test Well 3 (Figure 9-2) is located far<strong>the</strong>r<br />
downdip in <strong>the</strong> brackish Wilcox Aquifer<br />
in nor<strong>the</strong>rn Atascosa County. At Site 3,<br />
a test/production well was constructed<br />
to a total depth <strong>of</strong> 2,660 feet. Test Well 3<br />
had 431 feet <strong>of</strong> brackish sand screened.<br />
The regional assessment estimated<br />
more than 400 feet. Sand collected<br />
during drilling <strong>of</strong> <strong>the</strong> screened intervals<br />
was analyzed to determine gravel pack<br />
and screen slot size. The well was tested<br />
at about 1,000 gallons per minute for 48<br />
hours with 143 feet <strong>of</strong> drawdown. The<br />
well had a 2-hour specific capacity <strong>of</strong><br />
9.7 and transmissivity <strong>of</strong> about 10,000<br />
gallons per day per foot (LBG-Guyton,<br />
2008a) (Table 9-1).<br />
9.3<br />
Water chemistry data from<br />
three test sites<br />
The chemical composition <strong>of</strong> <strong>the</strong><br />
groundwater from sites 1, 2, and 3 indicates<br />
<strong>the</strong> presence <strong>of</strong> brackish groundwater<br />
(total dissolved solids range from<br />
1,000 milligrams per liter to 3,000 milligrams<br />
per liter) (Table 9-2). They are<br />
sodium chloride (Na-Cl) type waters,<br />
some <strong>of</strong> which also contain high concentrations<br />
<strong>of</strong> sulfate (SO 4) and bicarbonate<br />
(HCO 3 ). At Test Well 1, <strong>the</strong> total<br />
dissolved solids were about 1,380 milligrams<br />
per liter. On a molar basis, <strong>the</strong><br />
cations are dominated by Na and for <strong>the</strong><br />
anions, Cl, SO 4 , and HCO 3 have almost<br />
equal molar concentrations. The water<br />
is chemically classified as a Na-Cl-SO 4 -<br />
HCO 3 type water. At Test Well 2, <strong>the</strong><br />
total dissolved solids were about 1,300<br />
milligrams per liter. On a molar basis,<br />
<strong>the</strong> cations are dominated by Na, and<br />
for <strong>the</strong> anions, <strong>the</strong> Cl is greater than <strong>the</strong><br />
SO 4 , which is greater than <strong>the</strong> HCO 3 .<br />
The water is chemically classified as a<br />
Na-Cl-SO 4 type water. Total dissolved<br />
solids at Test Well 3 were about 1,600<br />
milligrams per liter. On a molar basis,<br />
<strong>the</strong> cations are dominated by Na; <strong>the</strong><br />
anions are dominated by Cl; <strong>the</strong> concentrations<br />
<strong>of</strong> SO 4 are lower than in<br />
Test Well 1; and <strong>the</strong> HCO 3 concentrations<br />
are higher than in Test Well 1. The<br />
water is chemically classified as a Na-Cl<br />
type (LBG-Guyton, 2008c). The presence<br />
<strong>of</strong> dissolved iron in <strong>the</strong> water from<br />
<strong>the</strong> wells indicates a reducing environment<br />
in <strong>the</strong> aquifer. Computer chemical<br />
<strong>the</strong>rmodynamic modeling <strong>of</strong> <strong>the</strong> waters<br />
from <strong>the</strong> three wells indicates that <strong>the</strong><br />
waters are under-saturated with respect<br />
to amorphous silica, at about saturation<br />
with respect to calcite, and over-saturated<br />
with respect to ferric hydroxide<br />
(Southwest Groundwater Consulting,<br />
2008).<br />
Water chemistry consistency is an<br />
important consideration in designing a<br />
desalination plant, especially <strong>the</strong> pretreatment<br />
requirements, and <strong>the</strong> longevity<br />
<strong>of</strong> reverse-osmosis membranes. The<br />
salinity <strong>of</strong> <strong>the</strong> brackish Wilcox Aquifer is<br />
similar across <strong>the</strong> study area in sou<strong>the</strong>rn<br />
Bexar and nor<strong>the</strong>rn Atascosa counties.<br />
Produced groundwater from potential<br />
well fields is not expected to vary chemically<br />
during long-term production. This<br />
is based on three lines <strong>of</strong> evidence:<br />
(1) The geophysical logs used in <strong>the</strong><br />
construction <strong>of</strong> <strong>the</strong> regional cross<br />
section and brackish Wilcox sand<br />
thickness map indicate that <strong>the</strong><br />
salinities calculated from <strong>the</strong><br />
resistivity curves are consistently<br />
<strong>Texas</strong> Water Development Board <strong>Report</strong> <strong>374</strong> 173
within a range <strong>of</strong> 1,000–3,000<br />
total dissolved solids across <strong>the</strong><br />
area <strong>of</strong> investigation and do not<br />
show evidence <strong>of</strong> any source <strong>of</strong><br />
highly saline water in <strong>the</strong> aquifer.<br />
(2) The total dissolved solids between<br />
<strong>the</strong> three test wells are within<br />
a range considered acceptable<br />
by project engineers. There is<br />
a total dissolved solids range<br />
<strong>of</strong> 400 milligrams per liter.<br />
Downdip, concentrations <strong>of</strong> Na,<br />
Cl, and HCO 3 increase, and <strong>the</strong><br />
concentration <strong>of</strong> SO 4 decreases<br />
(Table 9-2). As groundwater<br />
flows downdip from <strong>the</strong> outcrop,<br />
dissolved sulfate may be<br />
reduced, and organic material<br />
in <strong>the</strong> Wilcox sediments may be<br />
oxidized. This would explain<br />
<strong>the</strong> inverse relationship in<br />
concentrations <strong>of</strong> HCO 3 and SO 4 .<br />
(3) Significant chemical changes in<br />
<strong>the</strong> brackish groundwater are<br />
not anticipated during <strong>the</strong> longterm<br />
pumping <strong>of</strong> future well<br />
fields. Significant water chemistry<br />
changes were not observed during<br />
<strong>the</strong> sampling <strong>of</strong> individual test<br />
wells at different times. Water<br />
chemistry at Test Well 1 did not<br />
change from initial sampling in<br />
May 2007 to March 2008 (almost<br />
one year later). Nor were changes<br />
in water chemistry observed for<br />
water samples collected over<br />
time from <strong>the</strong> 15-day pump test at<br />
Test Well 1. The sample collected<br />
on March 4, 2008, had a very<br />
similar chemical composition<br />
to <strong>the</strong> sample collected 14 days<br />
later on March 18, 2008, after<br />
continuously pumping at a rate<br />
<strong>of</strong> about 1,000 gallons per minute<br />
(LBG-Guyton, 2008a) (Table 9-2).<br />
Long-term monitoring is needed<br />
to confirm <strong>the</strong>se observations.<br />
Major water chemistry changes are<br />
not expected for an individual well or<br />
well field over <strong>the</strong> life <strong>of</strong> <strong>the</strong> project. The<br />
electric logs indicate that salinity values<br />
are regionally consistent. There are no<br />
localized areas with significantly different<br />
resistivities. Conversely, <strong>the</strong> capture area<br />
for an individual pumping well is small<br />
in comparison to <strong>the</strong> regional extent <strong>of</strong><br />
<strong>the</strong> brackish Wilcox Aquifer. Because <strong>of</strong><br />
<strong>the</strong> very large volume <strong>of</strong> groundwater<br />
in a porous aquifer such as <strong>the</strong> Wilcox,<br />
<strong>the</strong> radial distance from which a pumping<br />
well pulls water is very limited. For<br />
example, after 50 years <strong>of</strong> hypo<strong>the</strong>tically<br />
pumping <strong>of</strong> Test Well 3 at 1,000 gallons<br />
per minute, a water molecule would have<br />
moved to <strong>the</strong> well from a maximum distance<br />
<strong>of</strong> about 3,500 feet away. In o<strong>the</strong>r<br />
words, after 50 years <strong>of</strong> pumping, <strong>the</strong><br />
source <strong>of</strong> water at Test Well 3 will come<br />
from a “cylinder” in <strong>the</strong> Wilcox with a<br />
radius <strong>of</strong> only about 3,500 feet.<br />
9.4<br />
Groundwater modeling<br />
The amount <strong>of</strong> water level decline from<br />
brackish Wilcox production was evaluated<br />
for different pumping rates and<br />
different time periods (LBG-Guyton,<br />
2008b). Water level changes were simulated<br />
with <strong>the</strong> TWDB Queen City-<br />
Sparta groundwater availability model,<br />
which supercedes <strong>the</strong> Carrizo-Wilcox<br />
(sou<strong>the</strong>rn part) groundwater availability<br />
model (Kelly and o<strong>the</strong>rs, 2004). With<br />
<strong>the</strong> Queen City-Sparta model, water<br />
level declines in <strong>the</strong> Carrizo and Wilcox<br />
aquifers can be simulated. A comparison<br />
<strong>of</strong> field data (for example, transmissivity)<br />
from <strong>the</strong> three test wells to<br />
hydraulic parameters in <strong>the</strong> model show<br />
<strong>the</strong>y are similar; <strong>the</strong>refore, <strong>the</strong> <strong>of</strong>ficial<br />
TWDB groundwater availability model<br />
was used without modification. A well<br />
field was located in <strong>the</strong> general area <strong>of</strong><br />
each <strong>of</strong> <strong>the</strong> three test sites, and production<br />
was distributed between three<br />
well fields. The simulated production<br />
came primarily from <strong>the</strong> Lower Wilcox<br />
layer <strong>of</strong> <strong>the</strong> model. Total pumping rates<br />
were varied from 10 to 12.5 million gallons<br />
per day to 20 million gallons per<br />
day to 25 million gallons per day. The<br />
174 <strong>Texas</strong> Water Development Board <strong>Report</strong> <strong>374</strong>
150<br />
50<br />
52,800 feet<br />
50<br />
100<br />
50<br />
100<br />
100<br />
50<br />
Figure 9-4. Simulated water level decline map, Lower Wilcox Aquifer, for a pumping rate <strong>of</strong> 20 million gallons per day<br />
after 25 years. Simulation made with <strong>the</strong> TWDB Queen City-Sparta groundwater availability model.<br />
time periods for pumping were 5, 10,<br />
25, and 53 years. The time period <strong>of</strong> 53<br />
years (ending in 2060) was included<br />
since it represents <strong>the</strong> maximum water<br />
planning period being considered in<br />
<strong>the</strong> State <strong>of</strong> <strong>Texas</strong> regional water planning<br />
process. The Queen City-Sparta<br />
groundwater availability model divides<br />
<strong>the</strong> Carrizo-Wilcox Aquifer into Carrizo,<br />
<strong>Upper</strong> Wilcox, Middle Wilcox,<br />
and Lower Wilcox layers. Water level<br />
declines within <strong>the</strong> Lower Wilcox, Middle<br />
Wilcox, <strong>Upper</strong> Wilcox, and Carrizo<br />
were simulated.<br />
With a production rate <strong>of</strong> 20 million<br />
gallons per day for 25 years, water levels<br />
declined nearly 250 feet in <strong>the</strong> Lower<br />
Wilcox in sou<strong>the</strong>ast Bexar County (Figure<br />
9-4). Maximum simulated water level<br />
decline in <strong>the</strong> overlying Carrizo for <strong>the</strong><br />
same pumping rate and duration (20 million<br />
gallons per day in <strong>the</strong> Lower Wilcox<br />
for 25 years) was about 4 feet (Figure 9-5).<br />
This is far less than is seasonally observed<br />
in <strong>the</strong> historic record <strong>of</strong> Carrizo water<br />
levels (Figure 9-6), which has varied on<br />
<strong>the</strong> order <strong>of</strong> about 60 feet. Only minor<br />
simulated water level declines occur in<br />
<strong>the</strong> Carrizo because <strong>the</strong> overlying <strong>Upper</strong><br />
Wilcox muddy aquitard restricts flow<br />
between <strong>the</strong> Carrizo and <strong>the</strong> deep production<br />
zone in <strong>the</strong> Lower Wilcox (LBG-<br />
Guyton, 2008b).<br />
The model predicts that most <strong>of</strong> <strong>the</strong><br />
water level declines in <strong>the</strong> Wilcox will<br />
occur early, within <strong>the</strong> first five years <strong>of</strong><br />
production; later (from 5 to 50 years),<br />
water level declines will slow and stabilize<br />
(equilibrate). This permits an early<br />
evaluation <strong>of</strong> <strong>the</strong> expected drawdown<br />
in <strong>the</strong> well field and whe<strong>the</strong>r <strong>the</strong> model<br />
has accurately predicted future conditions<br />
in <strong>the</strong> brackish Wilcox and Carrizo<br />
aquifers.<br />
<strong>Texas</strong> Water Development Board <strong>Report</strong> <strong>374</strong> 175
4<br />
4<br />
2<br />
52,800 feet<br />
2<br />
2<br />
2<br />
Figure 9-5. Simulated water level decline map, Carrizo Aquifer, for a pumping rate in <strong>the</strong> Lower Wilcox Aquifer <strong>of</strong> 20 million<br />
gallons per day after 25 years. Simulation made with <strong>the</strong> TWDB Queen City-Sparta groundwater availability model.<br />
60<br />
80<br />
Depth (feet) below land surface<br />
100<br />
120<br />
140<br />
160<br />
180<br />
09/19/91 06/15/94 03/11/97 12/06/99 09/01/02 05/28/05<br />
Figure 9-6. Seasonal historical water level declines in Carrizo Aquifer, Atascosa County, Well Number 68-60-912.<br />
176 <strong>Texas</strong> Water Development Board <strong>Report</strong> <strong>374</strong>
Table 9-3. Hydrogeologic characteristics <strong>of</strong> brackish Wilcox test well sites—Test wells 1, 2, and 3.<br />
Site number<br />
Characteristic<br />
Site 1 (TW-1) Site 2 (TW-2) Site 3 (TW-3)<br />
Well yield (gpm) 986 853 986<br />
2-Hour specific capacity (gpm/ft) 8.0 5.2 9.7<br />
Transmissivity (gpd/ft) 8,980 9,200 9,970<br />
Total drawdown (ft)<br />
(after “x” minutes)<br />
185 (21,791) 203 (2,880) 143 (2,880)<br />
Well depth (ft) (bls) 1,804 1,250 2,660<br />
Top <strong>of</strong> screen (ft) (bls) 1,226 752 1,965<br />
Screened interval (ft) 364 254 431<br />
Total dissolved solids (mg/l) No.<br />
samples<br />
1,324–1,427<br />
(6 samples)<br />
1,310–1,437<br />
(2 samples)<br />
1,380–1,700<br />
(5 samples)<br />
Presence <strong>of</strong> <strong>Upper</strong> Wilcox aquitard Yes Yes Yes<br />
Source: LBG-Guyton Associates, 2008a.<br />
gpm = gallons per minute; gpm/ft = gallons per minute per foot; gpd/ft = gallons per foot per day; bls = below land surface; ft = feet;<br />
mg/l = milligrams per liter<br />
9.5<br />
Summary<br />
From a technical perspective, <strong>the</strong> longterm<br />
production <strong>of</strong> brackish groundwater<br />
from <strong>the</strong> Wilcox Aquifer in sou<strong>the</strong>rn<br />
Bexar and nor<strong>the</strong>rn Atascosa counties<br />
appears feasible. The test wells were<br />
capable <strong>of</strong> producing at high capacities<br />
(up to 1,000 gallons per minute), and<br />
<strong>the</strong> quality <strong>of</strong> groundwater is acceptable<br />
for desalination. Table 9-3 provides a<br />
comparison <strong>of</strong> <strong>the</strong> hydrogeologic characteristics<br />
<strong>of</strong> <strong>the</strong> three test wells. All<br />
three test sites have relatively similar<br />
hydrogeologic characteristics. Based<br />
on Table 9-3, no well field location was<br />
considered significantly better than <strong>the</strong><br />
o<strong>the</strong>r two.<br />
9.6<br />
References<br />
Kelly, V.A., Deeds, N.E., Fryar, D.G., and Nicot, J.-P., 2004, Groundwater availability<br />
models for <strong>the</strong> Queen City and Sparta aquifers: Prepared for <strong>the</strong> <strong>Texas</strong> Water Development<br />
Board.<br />
LBG-Guyton Associates, 2006, Site selection for San Antonio Water System’s brackish<br />
groundwater resources in <strong>the</strong> Wilcox and Edwards aquifers in <strong>the</strong> vicinity <strong>of</strong><br />
San Antonio, <strong>Texas</strong>: Prepared for San Antonio Water System, 24 p., plus tables and<br />
figures.<br />
LBG-Guyton Associates, 2008a, Evaluation <strong>of</strong> well spacing (well field geometry) and<br />
pumping rates to estimate long-term drawdown for <strong>the</strong> SAWS brackish groundwater<br />
Wilcox project: Prepared for San Antonio Water System, 7 p., plus tables and<br />
figures.<br />
LBG-Guyton Associates, 2008b, Data from test wells for SAWS brackish Wilcox groundwater<br />
investigation, sou<strong>the</strong>rn Bexar and nor<strong>the</strong>rn Atascosa counties, <strong>Texas</strong>: Prepared<br />
for San Antonio Water System, 16 p., plus tables and figures.<br />
<strong>Texas</strong> Water Development Board <strong>Report</strong> <strong>374</strong> 177
LBG-Guyton Associates, 2008c, Evaluation <strong>of</strong> <strong>the</strong> brackish groundwater resources <strong>of</strong><br />
<strong>the</strong> Wilcox Aquifer, sou<strong>the</strong>rn Bexar and nor<strong>the</strong>rn Atascosa counties, <strong>Texas</strong>: Prepared<br />
for R.W. Beck and San Antonio Water System, 10 p.<br />
Southwest Groundwater Consulting, May 2008, Modeled results <strong>of</strong> mixing ground water<br />
from three test wells, San Antonio brackish water project: Prepared for LBG-Guyton<br />
Associates, 4 p., plus tables and figures.<br />
178 <strong>Texas</strong> Water Development Board <strong>Report</strong> <strong>374</strong>
Chapter 10<br />
SAWS: Twin Oaks Aquifer Storage and Recovery Project<br />
Roberto Macias 1<br />
The San Antonio Water System’s<br />
(SAWS) Twin Oaks Aquifer Storage<br />
and Recovery facility is a key component<br />
<strong>of</strong> SAWS’ 50-year water supply<br />
plan, adopted in 1988 and updated in<br />
2005. The plan addresses <strong>the</strong> critical<br />
need to develop and manage water<br />
resources for a growing population<br />
while protecting regional environments<br />
and maintaining affordability.<br />
10.1<br />
Exactly what is aquifer<br />
storage and recovery?<br />
Aquifer storage and recovery is an<br />
environmentally friendly way <strong>of</strong> pumping<br />
groundwater from <strong>the</strong> Edwards<br />
Aquifer (limestone), <strong>the</strong>n storing and<br />
later recovering <strong>the</strong> water from <strong>the</strong><br />
Carrizo-Wilcox Aquifer (sand). Storage<br />
operations are conducted during <strong>the</strong><br />
cool, rainy season, and recovery operations<br />
are conducted during <strong>the</strong> dry, hot<br />
months. As a result, aquifer storage and<br />
recovery maximizes <strong>the</strong> use <strong>of</strong> pumping<br />
allocations from <strong>the</strong> Edwards Aquifer<br />
throughout <strong>the</strong> year.<br />
10.2<br />
Why did we need an aquifer<br />
storage and recovery plant<br />
in San Antonio?<br />
Groundwater pumping from <strong>the</strong> Edwards<br />
Aquifer is limited by legislation.<br />
1 San Antonio Water System<br />
Precipitation<br />
Outcrop<br />
Queen City Aquifer<br />
Reklaw Aquifer<br />
Carrizo Aquifer<br />
Figure 10-1. Aquifer storage and recovery—injection mode.<br />
<strong>Texas</strong> Water Development Board <strong>Report</strong> <strong>374</strong> 179
During wet periods, allocations were<br />
being lost through nonuse, as <strong>the</strong>re was<br />
no method to store water.<br />
10.3<br />
Saving for a sunny day<br />
During wet years, up to 30,000 acrefeet<br />
<strong>of</strong> excess Edwards Aquifer water is<br />
diverted into storage in <strong>the</strong> Carrizo-Wilcox<br />
Aquifer (Figure 10-1). A great benefit<br />
<strong>of</strong> injecting into this type <strong>of</strong> aquifer<br />
is that <strong>the</strong> water, for <strong>the</strong> most part, stays<br />
right where you put it.<br />
During <strong>the</strong> summer, this stored<br />
water is withdrawn during dry periods<br />
(recovery mode) and sent back into town.<br />
This helps maintain spring flows in New<br />
Braunfels and San Marcos to ensure protection<br />
<strong>of</strong> endangered species habitats.<br />
Phase I <strong>of</strong> <strong>the</strong> project, completed in<br />
2004, includes a 30 million-gallon-perday<br />
treatment facility, 16 wells, a highservice<br />
pump station, a 3 million-gallon<br />
storage tank, and 30 miles <strong>of</strong> main to<br />
convey water to <strong>the</strong> Artesia and Seale<br />
pumping stations.<br />
10.4<br />
Treatment process<br />
The native Carrizo-Wilcox water is<br />
usually higher in manganese and iron<br />
but has a lower pH and hardness than<br />
<strong>the</strong> Edwards water. During production<br />
mode, up to 6,400 acre-feet <strong>of</strong> <strong>the</strong> available<br />
native Carrizo-Wilcox water goes<br />
through a three-step process to make<br />
<strong>the</strong> water compatible with Edwards<br />
water already in <strong>the</strong> distribution system<br />
(Figures 10-2, 10-3, and 10-4).<br />
Carbon dioxide and/or lime may<br />
be added during this process to adjust<br />
pH, alkalinity, and hardness. This aeration<br />
also helps to oxidize <strong>the</strong> iron and<br />
increases dissolved oxygen.<br />
Polymers, potassium permanganate,<br />
and/or chlorine can be added in <strong>the</strong> solid<br />
contact units to aid in settling out manganese<br />
and o<strong>the</strong>r suspended solids.<br />
Dual media filters are used to remove<br />
any <strong>of</strong> <strong>the</strong> remaining particles <strong>of</strong> solids.<br />
All backwash flows and settled solids go<br />
to a backwash clarifier and <strong>the</strong>n to three<br />
storage lagoons.<br />
Figure 10-2. Cascade aeration, first step <strong>of</strong> treatment process.<br />
180 <strong>Texas</strong> Water Development Board <strong>Report</strong> <strong>374</strong>
Figure 10-3. Clarification, second step <strong>of</strong> treatment process.<br />
Figure 10-4. Filtration, third step <strong>of</strong> treatment process.<br />
<strong>Texas</strong> Water Development Board <strong>Report</strong> <strong>374</strong> 181
10.5<br />
Finished water goals<br />
The finished water goals for <strong>the</strong> Twin<br />
Oaks Aquifer Storage and Recovery<br />
water treatment facility are shown below<br />
(Table 10-1). These goals were arrived at<br />
by evaluating several factors, including<br />
<strong>the</strong> following:<br />
• Meet or exceed all regulatory<br />
requirements <strong>of</strong> <strong>the</strong> <strong>Texas</strong><br />
Commission on Environmental<br />
Quality, including all primary and<br />
secondary maximum contaminant<br />
levels.<br />
• Condition <strong>the</strong> water in such a way as<br />
to avoid water quality problems in<br />
<strong>the</strong> distribution system.<br />
• Meet or exceed <strong>the</strong> aes<strong>the</strong>tic quality<br />
expected by SAWS customers.<br />
During recovery mode (Figure 10-5)<br />
<strong>of</strong> <strong>the</strong> stored Edwards Aquifer water,<br />
<strong>the</strong>re is virtually no treatment required.<br />
This water can be sent back into <strong>the</strong> system<br />
after only <strong>the</strong> addition <strong>of</strong> chlorine for<br />
disinfection purposes.<br />
10.6<br />
Summary <strong>of</strong> aquifer storage<br />
and recovery benefits<br />
This process allows for more flexibility<br />
in managing and storing valuable water<br />
resources throughout <strong>the</strong> year. Storing<br />
water underground results in no evaporation;<br />
it also renders <strong>the</strong> water less vulnerable<br />
to possible contamination. This<br />
is an enormous advantage over surface<br />
storage. Almost all <strong>of</strong> <strong>the</strong> 3,200 acres<br />
SAWS leased directly above <strong>the</strong> aquifer<br />
storage and recovery site continues its<br />
previous use. The land was leased back<br />
to its original owners.<br />
10.7<br />
The future <strong>of</strong> <strong>the</strong> Twin<br />
Oaks Aquifer Storage and<br />
Recovery facility<br />
Phase I was constructed in 21 months<br />
at a cost <strong>of</strong> $185 million. Although it<br />
is not required by state law, a mitigation<br />
program has been implemented<br />
to assist area well owners impacted by<br />
drawdown.<br />
Precipitation<br />
Outcrop<br />
Queen City Aquifer<br />
Reklaw Aquifer<br />
Carrizo Aquifer<br />
Figure 10-5. Aquifer storage and recovery—recovery mode.<br />
182 <strong>Texas</strong> Water Development Board <strong>Report</strong> <strong>374</strong>
Table 10-1. Finished water goals.<br />
Contaminant Units Raw water design MCL Finished water goal<br />
Primary drinking water contaminant levels<br />
Radium-226 & 228, total pCi/l 4.50 5.00
184 <strong>Texas</strong> Water Development Board <strong>Report</strong> <strong>374</strong><br />
This page is intentionally blank.
Chapter 11<br />
Groundwater Recharge in <strong>the</strong> Carrizo-Wilcox Aquifer<br />
Robert C. Reedy 1 , Jean-Philippe Nicot 1 , Bridget R. Scanlon 1 , Neil E. Deeds 2 ,<br />
Van Kelley 2 , and Robert E. Mace 3<br />
Groundwater recharge is a critical<br />
parameter for managing water<br />
resources <strong>of</strong> aquifers. However, recharge<br />
is not static and varies with many<br />
parameters, including aquifer development.<br />
The objective <strong>of</strong> this study was to<br />
estimate groundwater recharge to a dipping<br />
confined aquifer and to evaluate<br />
recharge dynamics relative to aquifer<br />
development and technical assessment<br />
<strong>of</strong> water availability. The study was conducted<br />
in <strong>the</strong> Carrizo-Wilcox Aquifer in<br />
<strong>Texas</strong>. A variety <strong>of</strong> approaches were used<br />
to estimate recharge, including chloride<br />
mass balance applied to <strong>the</strong> unsaturated<br />
zone and to groundwater, groundwater<br />
tritium, and unsaturated zone and<br />
groundwater modeling. Recharge rates<br />
based on groundwater chloride range<br />
from 0.4 inches per year (2 percent <strong>of</strong><br />
precipitation) in <strong>the</strong> semiarid sou<strong>the</strong>rn<br />
part to 4.0 inches per year (8 percent<br />
<strong>of</strong> precipitation) in <strong>the</strong> humid nor<strong>the</strong>rn<br />
part <strong>of</strong> <strong>the</strong> aquifer. Point recharge<br />
rates based on unsaturated zone chloride<br />
data in <strong>the</strong> central Carrizo-Wilcox<br />
Aquifer are spatially variable (0.7–1.6<br />
inches per year) but generally consistent<br />
with those based on groundwater chloride.<br />
The presence <strong>of</strong> tritium (0.76–3.57<br />
tritium units) in <strong>the</strong> unconfined section<br />
<strong>of</strong> <strong>the</strong> central Carrizo-Wilcox Aquifer<br />
indicates young (post 1950) ages.<br />
<strong>Upper</strong> bounds on deep recharge to <strong>the</strong><br />
confined part <strong>of</strong> <strong>the</strong> sou<strong>the</strong>rn Carrizo-<br />
Wilcox Aquifer range from 0.1 to 0.4<br />
inches per year based on carbon-14<br />
transects in Atascosa County. Recharge<br />
rates based on unsaturated zone modeling<br />
results range from 0.4 inches per<br />
year (2 percent <strong>of</strong> precipitation) in <strong>the</strong><br />
sou<strong>the</strong>rn part to 5.1 inches per year (10<br />
percent <strong>of</strong> precipitation) in <strong>the</strong> nor<strong>the</strong>rn<br />
part <strong>of</strong> <strong>the</strong> aquifer. Under steady-state<br />
conditions, recharge equals discharge,<br />
and simulated recharge using groundwater<br />
models ranges from 0.75 inches<br />
per year in <strong>the</strong> sou<strong>the</strong>rn part to 1.1<br />
inches per year in both <strong>the</strong> central and<br />
nor<strong>the</strong>rn parts <strong>of</strong> <strong>the</strong> Carrizo-Wilcox<br />
Aquifer models. Water availability for<br />
pumpage will depend on recharge and<br />
how much discharge through streams,<br />
evapotranspiration, and cross-formational<br />
flow can be captured by pumping<br />
during transient development. Transient<br />
simulations indicate that irrigation<br />
pumpage in <strong>the</strong> sou<strong>the</strong>rn part <strong>of</strong> <strong>the</strong><br />
aquifer in 1999 is still derived primarily<br />
from groundwater storage changes<br />
(65 percent), with lesser amounts from<br />
induced recharge from cross-formational<br />
flow to <strong>the</strong> overlying Queen City<br />
Aquifer (20 percent) and increased deep<br />
recharge from <strong>the</strong> outcrop (16 percent).<br />
Groundwater pumpage in <strong>the</strong> nor<strong>the</strong>rn<br />
Carrizo-Wilcox Aquifer in 1999 is also<br />
derived from groundwater storage (40<br />
percent), deep recharge (34 percent),<br />
and cross-formational flow (29 percent).<br />
Understanding impacts <strong>of</strong> groundwater<br />
development on aquifer recharge is<br />
essential for assessing water availability<br />
in <strong>the</strong> aquifer.<br />
Groundwater recharge is an important<br />
parameter for managing water<br />
resources in an aquifer. Recharge is generally<br />
defined as addition <strong>of</strong> water to an<br />
aquifer, mostly derived from <strong>the</strong> land<br />
surface. Many papers have discussed<br />
<strong>the</strong> relationship between recharge and<br />
1 Bureau <strong>of</strong> Economic Geology, Jackson School <strong>of</strong><br />
Geosciences, The University <strong>of</strong> <strong>Texas</strong> at Austin<br />
2 INTERA, Inc.<br />
3 <strong>Texas</strong> Water Development Board<br />
<strong>Texas</strong> Water Development Board <strong>Report</strong> <strong>374</strong> 185
aquifer sustainability with respect to<br />
groundwater development. Under predevelopment<br />
conditions in an aquifer,<br />
<strong>the</strong> natural recharge (R 0 ) is equal to <strong>the</strong><br />
natural discharge (D 0 ) when averaged<br />
over a long time:<br />
(1)<br />
Some hydrologists believe that <strong>the</strong><br />
predevelopment recharge rate should<br />
determine <strong>the</strong> sustainable pumpage<br />
rate (Pu) by taking natural discharge<br />
into account<br />
(2)<br />
where D is discharge that is not captured<br />
by pumpage. This has been termed <strong>the</strong><br />
“water budget myth” (Bredehoeft, 2002;<br />
Devlin and Sophocleous, 2005). Equation<br />
2 makes three assumptions: (1)<br />
pumpage does not affect recharge; (2)<br />
steady-state conditions apply (that is,<br />
no change in groundwater storage); and<br />
(3) pumpage equals change in discharge<br />
(Devlin and Sophocleous, 2005). A<br />
more comprehensive equation describing<br />
conditions after development is<br />
(3)<br />
where ∆R 0 and ∆D 0 are changes in<br />
recharge and discharge caused by pumpage,<br />
respectively, and dV/dt is change in<br />
volume <strong>of</strong> groundwater storage. Combining<br />
Equations 1 and 3 (Sophocleous,<br />
1998) yields <strong>the</strong> following equation:<br />
(4)<br />
If a new steady state is established<br />
under pumping conditions, <strong>the</strong>re is no<br />
fur<strong>the</strong>r change in groundwater storage<br />
and dV/dt = 0. In that case, groundwater<br />
pumpage is derived from an increase in<br />
recharge or a decrease in discharge, which<br />
is termed capture (Sophocleous, 1998).<br />
Water can be captured in an unconfined<br />
aquifer by intercepting groundwater<br />
discharge to streams, changing streams<br />
from gaining to losing, and/or reducing<br />
groundwater evapotranspiration from<br />
riparian zones near streams. In a confined<br />
aquifer, water can be captured by<br />
increasing deep recharge from an overlying<br />
unconfined aquifer through crossformational<br />
flow—this will correspond<br />
to capture from <strong>the</strong> unconfined aquifer<br />
as described above and can result in a<br />
reversal <strong>of</strong> <strong>the</strong> flow direction if water in<br />
<strong>the</strong> confined aquifer was previously flowing<br />
to <strong>the</strong> unconfined aquifer.<br />
Although Equation 4 indicates that<br />
initial recharge and discharge rates are<br />
not used to estimate pumpage, Sophocleous<br />
and Devlin (2004) point out that<br />
large initial recharge and discharge rates<br />
support large changes in <strong>the</strong>se parameters.<br />
Therefore, initial or predevelopment<br />
recharge and discharge rates are<br />
important for assessing water resource<br />
sustainability.<br />
The general concepts related to<br />
impacts <strong>of</strong> pumpage on groundwater<br />
systems were applied to aquifers in <strong>the</strong><br />
United States by Johnston (1997). Predevelopment<br />
recharge and discharge<br />
estimates for various aquifers within <strong>the</strong><br />
United States were evaluated, including<br />
unconfined aquifers, such as <strong>the</strong> Ogallala<br />
(High <strong>Plains</strong>) Aquifer, and dipping<br />
confined aquifers, such as <strong>the</strong> Gulf Coast<br />
Aquifer. In <strong>the</strong> Ogallala Aquifer, predevelopment<br />
recharge to and discharge<br />
from <strong>the</strong> entire Ogallala Aquifer are<br />
very low (0.2 million acre-feet per year).<br />
Pumpage (7.0 million acre-feet per year),<br />
mostly for irrigation, is derived primarily<br />
from irrigation return flow (42 percent)<br />
and change in groundwater storage (40<br />
percent), with only 16 percent attributed<br />
to induced recharge and 2 percent<br />
to reduced discharge. The Gulf Coast<br />
Aquifer, extending from <strong>Texas</strong> to Mississippi,<br />
has much higher predevelopment<br />
recharge (3.3 million acre feet per<br />
year). Pumpage (9.8 million acre feet per<br />
year) is derived primarily from induced<br />
downward percolation and leakage from<br />
overlying aquifers (66 percent), reduction<br />
in natural discharge (21 percent),<br />
186 <strong>Texas</strong> Water Development Board <strong>Report</strong> <strong>374</strong>
and decreased groundwater storage<br />
(13 percent) (Williamson and Grubb,<br />
2001).<br />
The objective <strong>of</strong> this study was to<br />
evaluate water resources sustainability<br />
issues, focusing on groundwater<br />
recharge, under current and projected<br />
future pumpage scenarios in a dipping<br />
confined aquifer. The Carrizo-Wilcox<br />
Aquifer provides an excellent example<br />
<strong>of</strong> such an aquifer system, which differs<br />
substantially from unconfined aquifer<br />
systems. Recharge to <strong>the</strong> outcrop zone<br />
<strong>of</strong> <strong>the</strong> aquifer can be termed “total<br />
recharge” to <strong>the</strong> system (Figure 11-1).<br />
Total recharge does not include shortterm<br />
infiltration that is taken up almost<br />
immediately as evapotranspiration and<br />
never reaches <strong>the</strong> water table. Much <strong>of</strong><br />
<strong>the</strong> total recharge water discharges to<br />
springs and streams and as groundwater<br />
evapotranspiration mostly along streams.<br />
Only a fraction <strong>of</strong> total recharge moves<br />
into <strong>the</strong> confined part <strong>of</strong> <strong>the</strong> aquifer and<br />
is sometimes termed “deep recharge.”<br />
Interesting aspects <strong>of</strong> <strong>the</strong> Carrizo-Wilcox<br />
Aquifer are <strong>the</strong> range in climatic forcing<br />
across <strong>the</strong> aquifer, from semiarid in <strong>the</strong><br />
south to humid in <strong>the</strong> north; <strong>the</strong> range<br />
in pumpage stresses, including irrigation<br />
pumpage in <strong>the</strong> south and mostly<br />
municipal and domestic pumpage in <strong>the</strong><br />
north; and <strong>the</strong> large number <strong>of</strong> hydraulically<br />
connected rivers that cross <strong>the</strong> outcrop<br />
zone <strong>of</strong> <strong>the</strong> aquifer. The dynamics<br />
<strong>of</strong> <strong>the</strong> flow system are also interesting.<br />
As groundwater pumpage in <strong>the</strong> confined<br />
part <strong>of</strong> <strong>the</strong> aquifer increases, <strong>the</strong><br />
hydraulic head gradient should increase,<br />
drawing more water from <strong>the</strong> unconfined<br />
part <strong>of</strong> <strong>the</strong> aquifer. There is limited<br />
previous information on groundwater<br />
recharge and movement <strong>of</strong> water from<br />
unconfined to confined portions <strong>of</strong> <strong>the</strong><br />
aquifer (Pearson and White, 1967; Castro<br />
and Goblet, 2003). Unique aspects <strong>of</strong><br />
this study include application <strong>of</strong> different<br />
approaches for quantifying recharge<br />
to <strong>the</strong> unconfined aquifer and linkage<br />
between recharge data and groundwater<br />
modeling analyses. Recharge estimation<br />
techniques include chloride mass balance<br />
and tritium in groundwater, chloride<br />
mass balance in <strong>the</strong> unsaturated<br />
zone, and unsaturated zone modeling.<br />
11.1<br />
Previous studies<br />
Variations in recharge caused by pumpage<br />
during postdevelopment have been<br />
described in many previous studies, as<br />
reviewed in Kelley and o<strong>the</strong>rs, 2004.<br />
In <strong>the</strong> sou<strong>the</strong>rn Carrizo-Wilcox Aquifer,<br />
under predevelopment conditions<br />
prior to 1900, western streams such as<br />
<strong>the</strong> Nueces and Frio rivers were likely<br />
gaining streams based upon <strong>the</strong> historical<br />
occurrence <strong>of</strong> flowing wells. By<br />
1904, <strong>the</strong>re were 30 artesian wells in<br />
<strong>the</strong> Carrizo Springs area alone, with<br />
average flows from 40–300 gallons per<br />
minute. The Dimmit County area was<br />
famous for spring-fed creeks that supported<br />
travelers and wildlife from early<br />
times. Within 40 years <strong>of</strong> drilling <strong>the</strong><br />
first well, virtually all <strong>of</strong> <strong>the</strong> springs<br />
and creeks <strong>the</strong>y fed were dry. By 1910,<br />
farmers in some areas had to pump<br />
<strong>the</strong>ir wells (http://www.historicdistrict.<br />
com/Genealogy/Dimmit/dimmit.htm).<br />
Hamlin (1988) reports that prior to significant<br />
production (before 1900), Carrizo<br />
wells flowed at elevations up to 700<br />
feet above mean sea level. By <strong>the</strong> 1930s,<br />
flowing wells were limited to elevations<br />
below 500 feet above mean sea level,<br />
and by 1972 only certain wells flowed at<br />
elevations below 360 feet above mean<br />
sea level. In <strong>the</strong> eastern portion <strong>of</strong> <strong>the</strong><br />
sou<strong>the</strong>rn Carrizo-Wilcox Aquifer, flowing<br />
wells still exist in areas such as Gonzales<br />
County.<br />
A transient groundwater model developed<br />
by LBG-Guyton and HDR (1998)<br />
was used to evaluate impacts <strong>of</strong> groundwater<br />
development on <strong>the</strong> flow system<br />
from 1942 through 1994. The simulation<br />
results showed gain/loss for each major<br />
river in <strong>the</strong> model study area from 1942<br />
through 1994 on a 10-year moving average<br />
basis. Simulation results indicate that<br />
<strong>the</strong> San Marcos and Guadalupe rivers<br />
<strong>Texas</strong> Water Development Board <strong>Report</strong> <strong>374</strong> 187
were gaining streams from 1942 through<br />
1994, gaining less than 100 acre-feet<br />
per year per mile <strong>of</strong> outcrop from 1980<br />
through 1994. The San Antonio River<br />
changed from strongly gaining (over 400<br />
acre-feet per year per mile) in <strong>the</strong> 1960s<br />
to losing more than 400 acre-feet per<br />
year per mile <strong>of</strong> outcrop by 1990. The<br />
change from gaining to losing occurred<br />
in <strong>the</strong> late 1960s. The Atascosa River<br />
changed from gaining to losing in <strong>the</strong><br />
early 1970s to becoming slightly losing<br />
(less than 50 acre-feet per year per mile)<br />
from 1980 through 1994. Cibolo Creek<br />
changed from gaining 200 acre-feet per<br />
year per mile in <strong>the</strong> 1940s to losing up<br />
to 100 acre-feet per year per mile in <strong>the</strong><br />
late 1970s through 1994. The analysis by<br />
LBG-Guyton and HDR predicted that<br />
San Miguel Creek, <strong>the</strong> Nueces River,<br />
and <strong>the</strong> Frio River were losing streams<br />
throughout <strong>the</strong>ir analysis period (1942–<br />
1994). Their results predicted that <strong>the</strong><br />
Nueces and Frio rivers lose, on average,<br />
approximately 500 acre-feet per year per<br />
mile <strong>of</strong> outcrop.<br />
The model simulation results are supported<br />
by gain/loss studies conducted in<br />
various streams and reviewed by Slade<br />
and o<strong>the</strong>rs (2002). Gain/loss studies indicated<br />
that <strong>the</strong> Nueces River was losing<br />
based on studies conducted from 1925 to<br />
1933 and in 1940. Cibolo Creek was found<br />
to be gaining along a 62-mile length in<br />
September 1949, with a rate <strong>of</strong> 163 acrefeet<br />
per year per mile. Medina Creek was<br />
found to be losing in May 1925, with a<br />
rate <strong>of</strong> 42 acre-feet per year per mile.<br />
11.2<br />
Materials and methods<br />
11.2.1<br />
Site description<br />
The Carrizo-Wilcox Aquifer is typical <strong>of</strong><br />
coastal plain dipping aquifers that have<br />
a generally narrow, unconfined outcrop<br />
section and a large, confined section<br />
(Figure 11-1). The aquifer extends from<br />
<strong>the</strong> Rio Grande in South <strong>Texas</strong> to East<br />
<strong>Texas</strong> (Figure 11-1). For groundwater<br />
modeling purposes, <strong>the</strong> Carrizo-Wilcox<br />
Aquifer has been subdivided into<br />
sou<strong>the</strong>rn (Rio Grande to <strong>the</strong> surface<br />
water divide between Guadalupe and<br />
Colorado rivers); central (San Antonio<br />
River to part <strong>of</strong> <strong>the</strong> East <strong>Texas</strong> Basin);<br />
and nor<strong>the</strong>rn (surface water divide<br />
between <strong>the</strong> Trinity and Brazos rivers<br />
to <strong>the</strong> Red River in Louisiana and<br />
Arkansas) sections. The geology <strong>of</strong> <strong>the</strong><br />
Carrizo-Wilcox Aquifer is described<br />
in detail in Deeds and o<strong>the</strong>rs (this volume)<br />
and George (this volume). In <strong>the</strong><br />
Central Carrizo-Wilcox Aquifer, <strong>the</strong><br />
geology consists <strong>of</strong> <strong>the</strong> following formations,<br />
from oldest to youngest: Hooper,<br />
Simsboro, Calvert Bluff, and Carrizo.<br />
The Hooper and Calvert Bluff formations<br />
are semi-confining units, and<br />
<strong>the</strong> Simsboro and Carrizo formations<br />
are aquifers. In most <strong>of</strong> <strong>the</strong> footprint<br />
<strong>of</strong> <strong>the</strong> sou<strong>the</strong>rn and nor<strong>the</strong>rn models,<br />
<strong>the</strong> Simsboro Formation cannot be distinguished,<br />
and <strong>the</strong> Wilcox Formation<br />
is subdivided into <strong>the</strong> Lower, Middle,<br />
and <strong>Upper</strong> Wilcox. The Carrizo-Wilcox<br />
Aquifer is overlain by <strong>the</strong> Queen City<br />
Aquifer, separated by <strong>the</strong> Reklaw Formation,<br />
which is a confining unit.<br />
Previous studies indicate that <strong>the</strong>re<br />
is more recharge through <strong>the</strong> predominantly<br />
sandy Simsboro Formation and<br />
o<strong>the</strong>r sandy sections <strong>of</strong> <strong>the</strong> Carrizo and<br />
Wilcox formations than through <strong>the</strong> clayrich<br />
Hooper, Calvert Bluff, and Reklaw<br />
formations. Hydrologic properties <strong>of</strong><br />
<strong>the</strong> soils developed on <strong>the</strong>se formations<br />
reflect <strong>the</strong> dominant texture <strong>of</strong> <strong>the</strong><br />
underlying formations (Figure 11-2).<br />
Land use/land cover varies widely in<br />
<strong>the</strong> outcrop areas (Figure 11-3). Natural<br />
vegetation, open water, and wetlands<br />
combined constitute from 48 percent<br />
to 78 percent <strong>of</strong> <strong>the</strong> land surface. From<br />
<strong>the</strong> south to <strong>the</strong> north, natural vegetation<br />
generally transitions from predominantly<br />
shrublands and grasslands (57 percent)<br />
to forests (43 percent), and <strong>the</strong> percentage<br />
<strong>of</strong> open water and wetland areas<br />
increases greatly (Table 11-1). The dominant<br />
agricultural land use in all areas is<br />
188 <strong>Texas</strong> Water Development Board <strong>Report</strong> <strong>374</strong>
a)<br />
b)<br />
Figure 11-1. Conceptual diagrams <strong>of</strong> groundwater flow components under a) natural (predevelopment)<br />
and b) postdevelopment conditions in <strong>the</strong> Carrizo-Wilcox Aquifer.<br />
pasture or hay, which generally increases<br />
from <strong>the</strong> south to <strong>the</strong> north. Cultivated<br />
croplands occupy only a minor percentage<br />
<strong>of</strong> outcrop areas.<br />
Mean annual precipitation from <strong>the</strong><br />
PRISM (Parameter-elevation Regressions<br />
on Independent Slopes Model)<br />
precipitation data set shows precipitation<br />
increasing from a low <strong>of</strong> 20.7 inches<br />
in <strong>the</strong> far south to a high <strong>of</strong> 55.9 inches<br />
in <strong>the</strong> Sabine Uplift area, based upon<br />
1971–2000 data (SCAS, 2004). The mean<br />
annual net pan evaporation depth in<br />
<strong>the</strong> study area ranges from a low <strong>of</strong> 38.3<br />
inches per year in <strong>the</strong> north portion <strong>of</strong><br />
<strong>the</strong> study area to a high <strong>of</strong> 65.9 inches<br />
per year in <strong>the</strong> south <strong>of</strong> <strong>the</strong> study area.<br />
In general, pan evaporation rate exceeds<br />
mean annual precipitation, except in<br />
<strong>the</strong> far north portion <strong>of</strong> <strong>the</strong> aquifer. The<br />
greatest rainfall deficit with regard to<br />
pan evaporation rate occurs in <strong>the</strong> south<br />
portion <strong>of</strong> <strong>the</strong> study area and equals ~48<br />
inches per year.<br />
11.2.2<br />
Recharge estimation methods<br />
A variety <strong>of</strong> approaches were used to<br />
estimate groundwater recharge. The<br />
chloride mass balance approach was<br />
<strong>Texas</strong> Water Development Board <strong>Report</strong> <strong>374</strong> 189
Miguel Cr.<br />
San<br />
Antonio R.<br />
Sulphur R.<br />
Wilcox<br />
"<br />
"<br />
Carrizo<br />
Sabine R.<br />
"<br />
Wilcox<br />
Hooper<br />
Carrizo-Wilcox Aquifer<br />
outcrop area soil<br />
clay content (%)<br />
Simsboro<br />
"<br />
"<br />
"<br />
Trinity R.<br />
Neches R.<br />
Carrizo<br />
Navasota R.<br />
< 15<br />
15–25<br />
25–35<br />
Calvert Bluff<br />
"<br />
Brazos R.<br />
35–45<br />
45–66<br />
Confined area<br />
S. Marcos R.<br />
Colorado R.<br />
Medina R.<br />
Wilcox<br />
"<br />
Cibolo Cr.<br />
Guadalupe R.<br />
"<br />
Carrizo<br />
Atascosa R.<br />
Leona R.<br />
San<br />
Frio R.<br />
Nueces R.<br />
0 50 100<br />
Nueces R.<br />
Rio Grande<br />
Figure 11-2. Soil clay content in <strong>the</strong> Carrizo-Wilcox Aquifer outcrop areas and extent <strong>of</strong> <strong>the</strong> aquifer confined zone.<br />
Formation names are indicated for <strong>the</strong> south, central, and nor<strong>the</strong>rn areas. Major rivers and reservoirs are also shown.<br />
Soil clay content derived from <strong>the</strong> State Soil Geographic (STATSGO) database (USDA, 1994).<br />
Miles<br />
applied to unsaturated zone soil water<br />
samples from <strong>the</strong> central Carrizo-Wilcox<br />
Aquifer and to groundwater chloride<br />
data from <strong>the</strong> <strong>Texas</strong> Water Development<br />
Board (TWDB) database (www.<br />
twdb.state.tx.us) from <strong>the</strong> entire aquifer.<br />
Tritium was also measured in groundwater<br />
samples in <strong>the</strong> central Carrizo-<br />
Wilcox Aquifer as a qualitative indicator<br />
<strong>of</strong> recharge. Carbon-14 data from previous<br />
studies (Pearson and White, 1967;<br />
Castro and Goblet, 2003) were also<br />
used to estimate deep recharge from<br />
<strong>the</strong> unconfined to <strong>the</strong> confined portion<br />
<strong>of</strong> <strong>the</strong> aquifer. Unsaturated zone and<br />
groundwater modeling was also used<br />
to assess groundwater recharge in <strong>the</strong><br />
aquifer.<br />
190 <strong>Texas</strong> Water Development Board <strong>Report</strong> <strong>374</strong>
Ft. Worth<br />
Dallas<br />
Land cover<br />
3<br />
4 5<br />
Water<br />
Urban<br />
Forest<br />
Shrub<br />
Grass<br />
Pasture<br />
Crops<br />
Wetlands<br />
Austin 1<br />
2<br />
6<br />
7<br />
Houston<br />
San Antonio<br />
0 50 100<br />
Miles<br />
Figure 11-3. Land cover map and unsaturated zone borehole locations (NLCD, 2001; USGS, 2007). The outcrop area <strong>of</strong> <strong>the</strong><br />
Carrizo-Wilcox Aquifer is delineated.<br />
11.2.2.1<br />
Chloride mass balance approach<br />
A total <strong>of</strong> seven boreholes were drilled<br />
in <strong>the</strong> outcrop area <strong>of</strong> <strong>the</strong> Simsboro Formation<br />
in <strong>the</strong> central Carrizo-Wilcox<br />
Aquifer in <strong>the</strong>se counties: Bastrop, Lee,<br />
Robertson, and Freestone (Figure 11-3).<br />
Soil samples from <strong>the</strong>se boreholes were<br />
analyzed for water-extractable chloride<br />
concentrations, and groundwater was<br />
analyzed for tritium. Cores were collected<br />
using a hollow-stem auger with a<br />
CME Mobile 75 drilling rig. Cores were<br />
taken continuously with depth until<br />
auger refusal or until <strong>the</strong> water table was<br />
encountered. To avoid contamination <strong>of</strong><br />
samples, no drilling fluid was used.<br />
Soil samples were leached by adding<br />
double deionized water to oven-dried<br />
<strong>Texas</strong> Water Development Board <strong>Report</strong> <strong>374</strong> 191
sediments samples in a 1:1 ratio by weight.<br />
Samples were <strong>the</strong>n placed on a reciprocal<br />
shaker for 4 hours and centrifuged<br />
at 7,000 rpm for 20 minutes and filtered<br />
through a 0.45 micrometer filter, and<br />
<strong>the</strong> supernatant was extracted. Waterextractable<br />
concentrations <strong>of</strong> chloride<br />
were measured by ion chromatography<br />
at <strong>the</strong> New Mexico Bureau <strong>of</strong> Mines.<br />
Water-extractable chloride concentrations<br />
are expressed on a mass basis as<br />
milligrams ion per kilogram <strong>of</strong> dry soil<br />
and were calculated by multiplying ion<br />
concentrations in <strong>the</strong> supernatant by <strong>the</strong><br />
extraction ratio (grams <strong>of</strong> water/gram<br />
<strong>of</strong> soil). Ion concentrations expressed<br />
as milligrams ion per liter <strong>of</strong> soil pore<br />
water were calculated by dividing concentrations<br />
in milligrams/kilograms by<br />
gravimetric water content and multiplying<br />
by water density. Gravimetric water<br />
content was measured in <strong>the</strong> laboratory<br />
at <strong>the</strong> Bureau <strong>of</strong> Economic Geology by<br />
oven drying samples at 105°C for 24 to<br />
72 hours. Groundwater samples were<br />
collected from all seven test holes for<br />
tritium, which were analyzed using gas<br />
proportional counting with enrichment<br />
at <strong>the</strong> University <strong>of</strong> Miami Tritium Laboratory<br />
(http://www.rsmas.miami.edu/<br />
groups/tritium/).<br />
Total recharge was estimated using a<br />
mass balance approach based on chloride<br />
(chloride mass balance, CMB) (Allison<br />
and Hughes, 1983). According to <strong>the</strong><br />
mass balance approach, chloride input<br />
from precipitation (P) balances chloride<br />
output in recharge:<br />
where Cl P , Cl UZ, and Cl GW are chloride<br />
concentrations in precipitation, unsaturated<br />
zone pore water, and groundwater,<br />
respectively, and R is recharge rate. Concentrations<br />
<strong>of</strong> chloride in precipitation<br />
were obtained from <strong>the</strong> National Atmospheric<br />
Deposition Program (http://<br />
nadp.sws.uiuc.edu/). Chloride concentrations<br />
in precipitation were doubled<br />
to account for dry fallout, which is consistent<br />
with total chloride fallout based<br />
on pre-bomb 36 Cl/Cl ratios at Amarillo<br />
(Scanlon and Goldsmith, 1997).<br />
Recharge was estimated using chloride<br />
concentrations in soil water from<br />
samples for each borehole, and depthweighted<br />
average recharge rates were<br />
calculated. Regional recharge was also<br />
estimated using groundwater chloride<br />
concentrations for 1,128 sampled wells<br />
from <strong>the</strong> TWDB database (www.twdb.<br />
(4)<br />
Table 11-1. General land use by region in <strong>the</strong> Carrizo-Wilcox outcrop areas.<br />
Region<br />
South <strong>of</strong><br />
Colorado<br />
River<br />
Colorado<br />
to Trinity<br />
Rivers<br />
North <strong>of</strong><br />
Trinity<br />
River<br />
Sabine<br />
Uplift<br />
Area<br />
(mi 2 )<br />
Urban/<br />
Developed<br />
(percent)<br />
Crops<br />
(percent)<br />
Pasture/<br />
Hay<br />
(percent)<br />
Shrubland/<br />
Grassland<br />
(percent)<br />
Forest<br />
(percent)<br />
Water/<br />
Wetlands<br />
(percent)<br />
2,815 6 5 14 57 15 3<br />
2,468 6 3 32 22 26 11<br />
2,631 8 3 40 6 24 18<br />
3,332 6 0 16 14 43 22<br />
Combined 11,247 6 3 25 25 28 14<br />
Note: Percentages are rounded.<br />
Source: National Land Cover Database (NLCD, 2001; USGS 2007)<br />
mi 2 = square miles<br />
192 <strong>Texas</strong> Water Development Board <strong>Report</strong> <strong>374</strong>
state.tx.us). The wells used are completed<br />
solely in <strong>the</strong> Carrizo-Wilcox<br />
Aquifer and are located ei<strong>the</strong>r in <strong>the</strong><br />
outcrop or within 5 miles downdip <strong>of</strong><br />
<strong>the</strong> outcrop. The wells were grouped<br />
into nine zones representing <strong>the</strong> range<br />
<strong>of</strong> climatic conditions across <strong>the</strong> outcrop<br />
<strong>of</strong> <strong>the</strong> aquifer. Because it is difficult to<br />
envision any large-scale process o<strong>the</strong>r<br />
than recharge that would reduce groundwater<br />
chloride concentrations and several<br />
processes can add chloride to <strong>the</strong><br />
system (for example, land use change,<br />
contamination, and cross-formational<br />
flow), <strong>the</strong> 25 th percentile groundwater<br />
chloride concentrations for each zone<br />
were used to estimate regional recharge<br />
rates.<br />
The time required to accumulate<br />
chloride in <strong>the</strong> unsaturated zone was calculated<br />
by dividing <strong>the</strong> cumulative total<br />
mass <strong>of</strong> chloride from <strong>the</strong> land surface<br />
or <strong>the</strong> base <strong>of</strong> <strong>the</strong> root zone to <strong>the</strong> depth<br />
<strong>of</strong> interest by <strong>the</strong> chloride input<br />
(6)<br />
where θ is mean water content in <strong>the</strong><br />
unsaturated zone and dz is depth interval.<br />
Deep recharge was also calculated<br />
from a transect <strong>of</strong> carbon-14 ages in<br />
Atascosa County (Pearson and White,<br />
1967). The carbon-14 ages (age) along<br />
<strong>the</strong> flow path were used to calculate<br />
water velocities based on distance from<br />
outcrop (L). The velocities (v) were <strong>the</strong>n<br />
used with an assumed unit width perpendicular<br />
to <strong>the</strong> flow direction and<br />
an estimated average porosity (n) and<br />
average aquifer thickness (b) to calculate<br />
average water flux into <strong>the</strong> confined<br />
aquifer. These recharge estimates are<br />
considered upper bounds on recharge<br />
from <strong>the</strong> outcrop because cumulative<br />
cross-formational loss/gain <strong>of</strong> water<br />
from overlying and underlying aquifers<br />
is ignored. Deep recharge (R d ) can <strong>the</strong>n<br />
be expressed in terms <strong>of</strong> outcrop unit<br />
area by distributing <strong>the</strong> annual water<br />
flux over <strong>the</strong> width <strong>of</strong> <strong>the</strong> outcrop zone<br />
(w), which is equivalent to <strong>the</strong> recharge<br />
zone:<br />
11.2.2.2<br />
Unsaturated zone modeling<br />
(7)<br />
Regional recharge was also estimated<br />
using <strong>the</strong> relationship between recharge<br />
and precipitation developed from<br />
unsaturated zone modeling by Keese<br />
and o<strong>the</strong>rs (2005). These recharge estimates<br />
were developed for various scenarios,<br />
including sandy nonvegetated<br />
soils and vegetated, texturally variable<br />
soils. Power law expressions were developed<br />
for <strong>the</strong>se different conditions:<br />
(bare, sandy soil) (8)<br />
(vegetated, texturally variable soil) (9)<br />
The bare sandy soil provides an estimate<br />
<strong>of</strong> <strong>the</strong> maximum recharge as a function<br />
<strong>of</strong> precipitation, whereas <strong>the</strong> vegetated,<br />
texturally variable soil provides <strong>the</strong><br />
most realistic scenario that should represent<br />
current conditions. The relationship<br />
was developed using mean annual<br />
precipitation from 1961 to 1990.<br />
11.2.2.3<br />
Groundwater modeling<br />
Groundwater models can be used to<br />
evaluate partitioning <strong>of</strong> total recharge<br />
into evapotranspiration, stream and<br />
spring discharge, and deep recharge<br />
into <strong>the</strong> confined portion <strong>of</strong> <strong>the</strong> aquifer.<br />
Prior to aquifer development (predevelopment),<br />
flow in <strong>the</strong> aquifer is at steady<br />
state, and aquifer recharge is equal to<br />
aquifer discharge. The steady-state<br />
flow model provides information on<br />
<strong>the</strong> water balance prior to aquifer development.<br />
After aquifer development,<br />
<strong>Texas</strong> Water Development Board <strong>Report</strong> <strong>374</strong> 193
groundwater pumpage provides an<br />
additional discharge mechanism that<br />
needs to be considered. The transient<br />
postdevelopment groundwater model<br />
is useful for assessing sources <strong>of</strong> water<br />
for pumpage, including changes in<br />
groundwater storage; reduced groundwater<br />
discharge (flow to streams in <strong>the</strong><br />
unconfined zone or cross-formational<br />
flow to overlying aquifers in confined<br />
zone); and/or increased recharge from<br />
<strong>the</strong> outcrop. The natural recharge and<br />
discharge data from <strong>the</strong> steady-state<br />
water balance model can be used to estimate<br />
<strong>the</strong> discharge that can potentially<br />
be captured by aquifer pumpage.<br />
The most recent regional models <strong>of</strong><br />
<strong>the</strong> Carrizo-Wilcox Aquifer are described<br />
in four groundwater availability model<br />
reports. Deeds and o<strong>the</strong>rs (2003), Dutton<br />
and o<strong>the</strong>rs (2003), and Fryar and o<strong>the</strong>rs<br />
(2003) developed spatially overlapping<br />
models covering <strong>the</strong> sou<strong>the</strong>rn, central,<br />
and nor<strong>the</strong>rn portions <strong>of</strong> <strong>the</strong> aquifer,<br />
respectively. In <strong>the</strong> fourth model, Kelley<br />
and o<strong>the</strong>rs (2004) linked <strong>the</strong> three Carrizo-Wilcox<br />
models with <strong>the</strong> overlying<br />
Queen City and Sparta aquifers. Lateral<br />
boundaries <strong>of</strong> <strong>the</strong> three models are generally<br />
no flow (along surface water divides),<br />
but transitions between models include<br />
large overlaps between <strong>the</strong> models (to<br />
avoid boundary effects in any single location<br />
<strong>of</strong> <strong>the</strong> study area). The conceptual<br />
flow model <strong>of</strong> this dipping confined aquifer<br />
system includes recharge in <strong>the</strong> outcrop<br />
areas <strong>of</strong> <strong>the</strong> shallow-dipping sandy<br />
layers <strong>of</strong> <strong>the</strong> Carrizo-Wilcox Aquifer<br />
from precipitation and losing streams<br />
and possibly cross-formational flow from<br />
overlying aquifers in <strong>the</strong> confined section<br />
<strong>of</strong> <strong>the</strong> aquifer. The model also includes<br />
discharge as evapotranspiration adjacent<br />
to streams, base flow to streams and flow<br />
to springs, and slow upward flow from<br />
<strong>the</strong> confined sections through aquitards<br />
to overlying aquifers.<br />
This paper analyzes results from <strong>the</strong><br />
bottom four layers (three Wilcox layers<br />
and one Carrizo layer) <strong>of</strong> <strong>the</strong> eight-layer<br />
model <strong>of</strong> Kelley and o<strong>the</strong>rs (2004). The<br />
downdip boundary is also a no-flow<br />
boundary and corresponds to <strong>the</strong> upper<br />
limit <strong>of</strong> <strong>the</strong> geopressured zone and/or <strong>of</strong><br />
<strong>the</strong> Wilcox growth-fault zone. The bottom<br />
boundary is specified as no flow,<br />
whereas <strong>the</strong> top boundary outside <strong>of</strong> <strong>the</strong><br />
outcrop areas is a general head boundary<br />
on top <strong>of</strong> <strong>the</strong> overlying Sparta Aquifer.<br />
Grid cells are square and uniformly<br />
1 mile across. The three models have a<br />
total <strong>of</strong> ~445,000 active cells, including<br />
~263,000 for <strong>the</strong> bottom four layers.<br />
The model simulations include predevelopment<br />
steady-state and transient<br />
simulations, with annual stress periods<br />
from 1980 through 1999. Although <strong>the</strong>re<br />
is diffuse pumping in <strong>the</strong> outcrop area<br />
and shallow confined sections, <strong>the</strong>re are<br />
only a few large pumping centers: irrigation<br />
pumpage from <strong>the</strong> Winter Garden<br />
area in <strong>the</strong> sou<strong>the</strong>rn Carrizo-Wilcox<br />
model, municipal pumpage for Bryan<br />
and College Station from <strong>the</strong> Simsboro<br />
Formation in <strong>the</strong> central Carrizo-Wilcox<br />
model, and municipal pumpage for <strong>the</strong><br />
city <strong>of</strong> Lufkin from <strong>the</strong> Wilcox in both<br />
<strong>the</strong> central and nor<strong>the</strong>rn Carrizo-Wilcox<br />
models. Calibration <strong>of</strong> <strong>the</strong> steady-state<br />
model used head measurements from<br />
<strong>the</strong> earliest period <strong>of</strong> record from <strong>the</strong><br />
TWDB database, whereas calibration <strong>of</strong><br />
<strong>the</strong> transient model used more numerous<br />
recent head measurements.<br />
Recharge is spatially distributed<br />
in <strong>the</strong> model based on functions that<br />
describe relationships between recharge<br />
and precipitation, topography, soil type,<br />
and geology (Kelley and o<strong>the</strong>rs, 2004).<br />
Recharge is also varied temporally as a<br />
function <strong>of</strong> annual precipitation; however,<br />
this relationship does not account<br />
for <strong>the</strong> time lag between drainage below<br />
<strong>the</strong> root zone and recharge at <strong>the</strong> water<br />
table. Recharge from losing streams,<br />
lakes, and reservoirs (focused recharge)<br />
is simulated using specific MODFLOW<br />
packages. Variations in recharge with<br />
topography are based on <strong>the</strong> assumption<br />
that more recharge occurs in upland<br />
areas and on hill slopes than in valley<br />
floors adjacent to streams where <strong>the</strong>y<br />
194 <strong>Texas</strong> Water Development Board <strong>Report</strong> <strong>374</strong>
act as discharge zones. Higher recharge<br />
is applied to sandy soil zones and aquifer<br />
units than to more clayey soil zones and<br />
confining units.<br />
The recharge input for <strong>the</strong> model<br />
is <strong>the</strong> so-called total recharge from<br />
which <strong>the</strong> numerical model subtracts<br />
groundwater evapotranspiration as it<br />
is done conventionally in MODFLOW.<br />
Groundwater evapotranspiration is a<br />
linearly decreasing function with depth<br />
from lake evapotranspiration at a zero<br />
depth (ground surface) to zero groundwater<br />
evapotranspiration at <strong>the</strong> extinction<br />
depth. If <strong>the</strong> water table is deeper<br />
than <strong>the</strong> extinction depth, <strong>the</strong>re is no<br />
groundwater evapotranspiration. Total<br />
recharge is input into <strong>the</strong> recharge package.<br />
Computing deep recharge requires<br />
output processing. Deep recharge can<br />
be computed from <strong>the</strong> model by summing<br />
up <strong>the</strong> fluxes across <strong>the</strong> first cells<br />
downdip <strong>of</strong> <strong>the</strong> outcrop cells (Method<br />
1). Recharge can also be computed by<br />
summing up fluxes through <strong>the</strong> upper<br />
boundary (cross-formational flow)<br />
for <strong>the</strong> confined section <strong>of</strong> <strong>the</strong> aquifer<br />
(Method 2). However, this approach is<br />
valid only if <strong>the</strong>re are no large sinks or<br />
discharge points in <strong>the</strong> confined portion<br />
<strong>of</strong> <strong>the</strong> aquifer. It follows that it can be<br />
applied only when <strong>the</strong>re is negligible flow<br />
through <strong>the</strong> side and bottom boundaries<br />
and under predevelopment conditions.<br />
11.3<br />
Results and discussion<br />
11.3.1<br />
Recharge estimates using <strong>the</strong> chloride<br />
mass balance approach<br />
The groundwater chloride data yield<br />
estimates <strong>of</strong> regional total recharge<br />
rates that range from 0.4 inches per year<br />
in <strong>the</strong> south to 4.0 inches per year in<br />
<strong>the</strong> north (Figure 11-4; Table 11-2). The<br />
25 th percentile <strong>of</strong> groundwater chloride<br />
concentrations was used in <strong>the</strong> recharge<br />
estimation, and <strong>the</strong>se chloride concentrations<br />
range from 49 milligrams per<br />
liter in <strong>the</strong> south to ~ 8 milligrams per<br />
liter in <strong>the</strong> north. Mean annual precipitation<br />
ranges from 24 inches per year<br />
in <strong>the</strong> south to 51 inches per year in <strong>the</strong><br />
north. Recharge rates range from 2 percent<br />
to 9 percent <strong>of</strong> mean annual precipitation.<br />
These recharge estimates are<br />
considered representative <strong>of</strong> <strong>the</strong> aquifer<br />
units ra<strong>the</strong>r than <strong>the</strong> confining units.<br />
Recharge rates were also estimated<br />
from soil water chloride concentrations<br />
in <strong>the</strong> central Carrizo-Wilcox Aquifer<br />
region (Figure 11-4; Table 11-3). Recharge<br />
rates range from 0.7 to 1.6 inches per<br />
year, representing 2–5 percent <strong>of</strong> mean<br />
annual precipitation. The recharge rates<br />
from <strong>the</strong>se field studies are generally<br />
consistent with regional recharge rates<br />
from groundwater chloride data. There is<br />
no systematic variation in recharge rates<br />
within this region. The lowest recharge<br />
was calculated for a site in a forest (borehole<br />
5), which has a bulge-shaped pr<strong>of</strong>ile<br />
<strong>of</strong> chloride concentration with depth,<br />
with a peak chloride concentration <strong>of</strong> 120<br />
milligrams per liter at 1.8-meter depth.<br />
However, <strong>the</strong>re may be no recharge in<br />
this setting as chloride is accumulating.<br />
This is <strong>the</strong> only borehole drilled in a<br />
forest setting; all o<strong>the</strong>r boreholes were<br />
drilled in pasture settings. Some boreholes<br />
show vertical variations in chloride<br />
concentrations and corresponding<br />
recharge rates. For example, recharge<br />
in <strong>the</strong> upper 12 meters <strong>of</strong> <strong>the</strong> borehole<br />
1 pr<strong>of</strong>ile is 1.4 inches per year, whereas<br />
below this zone recharge is much less<br />
(0.4 inches per year). These variations<br />
with depth may be related to land use<br />
changes; however, detailed information<br />
on land use history is not available for<br />
<strong>the</strong>se sites. The chloride accumulation<br />
times represented by <strong>the</strong> chloride data<br />
based on Equation 6 range from 32 to<br />
78 years, with <strong>the</strong> exception <strong>of</strong> borehole<br />
1, which has an accumulation time <strong>of</strong><br />
245 years.<br />
Groundwater tritium concentrations<br />
range from 0.76 to 3.6 TU (Table 11-3).<br />
Tritium levels were greater than <strong>the</strong><br />
detection limit (~ 0.2 TU) and indicate<br />
that a component <strong>of</strong> water was recharged<br />
<strong>Texas</strong> Water Development Board <strong>Report</strong> <strong>374</strong> 195
Groundwater chloride<br />
(milligrams per liter)<br />
! < 10<br />
! 10–25<br />
! 25–50<br />
! 50–100<br />
! 100–250<br />
! > 250<br />
Zone 3<br />
1.5 in/yr<br />
Zone 2<br />
! ! !<br />
! !<br />
1.1 in/yr<br />
! !<br />
!<br />
Zone 1<br />
! !<br />
! ! !<br />
0.5 in/yr<br />
!!! !<br />
!<br />
!!<br />
! !<br />
! !!! !!! !! ! ! !<br />
! ! !!<br />
! !! !<br />
!<br />
!! !! !!<br />
!<br />
!! !!<br />
! ! ! ! ! !<br />
!<br />
!!<br />
!!! ! !<br />
!!! ! !<br />
!<br />
!! ! !! !<br />
!<br />
!!! !!<br />
!<br />
! ! ! ! !<br />
!<br />
!<br />
! !<br />
!<br />
! !!<br />
!<br />
! !<br />
!<br />
!!<br />
! !<br />
! !<br />
!! !<br />
!!!<br />
! !!!<br />
! !<br />
!<br />
!<br />
! ! !<br />
!<br />
!<br />
! !! ! !<br />
Zone 7<br />
!<br />
! ! ! ! !<br />
! Titus ! ! !<br />
3.1 in/yr<br />
!!!<br />
!<br />
!<br />
! ! !<br />
! !!! ! !<br />
!<br />
!<br />
! !<br />
!<br />
! !<br />
!<br />
!<br />
! ! ! !<br />
!<br />
!! ! ! !<br />
!<br />
! !! ! !<br />
!!<br />
! ! ! !<br />
! ! !!! !! !<br />
!<br />
!! !<br />
!!<br />
!<br />
!!<br />
!! ! !<br />
! ! !!<br />
Zone 6 Van !<br />
! ! Zandt !<br />
!<br />
!!<br />
!! !<br />
! !!<br />
!<br />
! !!<br />
! ! !! ! ! !<br />
!<br />
!<br />
4.3 in/yr<br />
!<br />
!<br />
! !<br />
!!! !!! !! !!! !!!<br />
!<br />
!<br />
!<br />
! !! ! ! ! ! !<br />
! ! ! !<br />
!<br />
!! !<br />
! ! !!<br />
!! ! ! !<br />
!!<br />
!<br />
! !! !<br />
!!<br />
! !!<br />
! !! ! !<br />
! ! !<br />
!!<br />
! !<br />
! ! !! !<br />
!<br />
!<br />
!<br />
! ! ! !<br />
!<br />
!<br />
!!<br />
!!<br />
! ! ! ! !!! !<br />
!! !!<br />
!<br />
!!<br />
!<br />
!!<br />
!!<br />
!<br />
! !<br />
!!<br />
!! !<br />
!! ! !! !<br />
!<br />
!<br />
! ! ! ! !<br />
! !<br />
!<br />
!<br />
!<br />
!<br />
! ! ! !<br />
!<br />
! ! !! !! !! ! !<br />
! ! ! !<br />
!!!! ! ! ! ! ! !<br />
!<br />
Zone 5 !<br />
!<br />
!<br />
!<br />
!<br />
! ! !!<br />
!<br />
!! !<br />
!!<br />
! ! !<br />
!<br />
!<br />
!<br />
!!!<br />
!! !<br />
!! ! ! !<br />
!<br />
!<br />
2.3 in/yr !<br />
Zone 9<br />
!<br />
! !<br />
!!!<br />
!<br />
! !<br />
! ! 4.5 in/yr<br />
! !! !<br />
!! ! ! !<br />
!<br />
!<br />
! ! !! !<br />
!<br />
!<br />
!<br />
! ! !<br />
! !!<br />
!<br />
!<br />
!!<br />
! !<br />
!!<br />
!<br />
!!!<br />
!! !<br />
!<br />
!<br />
!!!<br />
!<br />
!<br />
! !<br />
! !<br />
!!!<br />
!<br />
! !<br />
!<br />
!<br />
! ! !<br />
!<br />
!!! !<br />
! !<br />
! ! !<br />
! ! !<br />
!! !!! ! ! ! ! ! !<br />
!<br />
! ! ! ! !<br />
!!!<br />
!<br />
! !<br />
Zone 4<br />
1.4 in/yr<br />
Zone 8<br />
3.9 in/yr<br />
0 50 100<br />
Figure 11-4. Groundwater chloride concentrations and chloride mass balance recharge rates for nine zones in <strong>the</strong> Carrizo-<br />
Wilcox outcrop area. Points represent groundwater wells located inside and within 5 miles downdip <strong>of</strong> <strong>the</strong> outcrop area.<br />
Chloride mass balance recharge rates are based on 25th percentile chloride concentrations for wells in each zone.<br />
in/yr = inches per year<br />
Miles<br />
after about 1950. However, quantitative<br />
recharge rates cannot be estimated from<br />
tritium data alone.<br />
Deep recharge to <strong>the</strong> Carrizo Aquifer<br />
was estimated from carbon-14 ages from<br />
Pearson and White (1967) and Castro and<br />
o<strong>the</strong>rs (2000) using an estimated average<br />
aquifer thickness <strong>of</strong> 100 meters, porosity<br />
<strong>of</strong> 35 percent, and outcrop width <strong>of</strong><br />
10 kilometers. Estimated deep recharge<br />
rates range from 0.1 to 0.4 inches per<br />
year (Table 11-4).<br />
11.3.2<br />
Recharge estimates from<br />
unsaturated zone results<br />
Maximum recharge rates developed<br />
using <strong>the</strong> relationships between<br />
196 <strong>Texas</strong> Water Development Board <strong>Report</strong> <strong>374</strong>
Table 11-2. Recharge rates by zones based on chloride mass balance analysis <strong>of</strong> groundwater chloride concentrations.<br />
Region<br />
South<br />
Central<br />
North<br />
Zone<br />
Number<br />
<strong>of</strong> wells<br />
Outcrop<br />
area<br />
(mi 2 )<br />
Precipitation<br />
(in/yr)<br />
Cl P<br />
(mg/L)<br />
Cl GW<br />
(mg/L)<br />
Recharge<br />
(in/yr)<br />
Recharge<br />
(af/yr)<br />
1 124 1,223 24.4 0.82 49 0.4 (2) 26,500<br />
2 73 648 30.9 1.18 37 1.0 (3) 34,300<br />
3 48 944 36.1 1.14 30 1.4 (4) 69,800<br />
4 95 812 36.3 0.98 29 1.2 (3) 52,800<br />
5 165 1,657 40.5 0.78 15 2.1 (5) 188,000<br />
6 124 936 42.8 0.68 7.9 3.7 (9) 183,000<br />
7 83 789 45.4 0.62 11 2.5 (6) 107,000<br />
8 58 906 49.6 0.60 9.0 3.3 (7) 158,000<br />
9 358 3,332 51.3 0.70 9.0 4.0 (8) 711,000<br />
Recharge<br />
(in/yr)<br />
Recharge<br />
(af/yr)<br />
0.9 (3) 131,000<br />
1.8 (5) 241,000<br />
3.6 (7) 1,160,000<br />
Note: Zones and well locations are shown in Figure 11-4. Precipitation represents 1971–2000 mean (SCAS, 2004). Precipitation chloride<br />
concentrations were multiplied by two to account for dry fallout. Groundwater chloride concentration represents <strong>the</strong> 25th percentile <strong>of</strong> zone<br />
well population. Values in paren<strong>the</strong>ses represent percentages <strong>of</strong> annual precipitation. Recharge values in (af/yr) units calculated by multiplying<br />
recharge by outcrop area. Mean area-weighted recharge rates are provided for groups <strong>of</strong> zones that approximately correspond to <strong>the</strong> modeled<br />
zones.<br />
Cl P = chloride concentration in precipitation; Cl GW = chloride concentration in groundwater; mi 2 = square miles; af/yr = acre-feet per year;<br />
in/yr = inches per year; mg/L = milligrams per year<br />
Table 11-3. Unsaturated zone borehole information and recharge rates based on chloride mass balance.<br />
Borehole<br />
Total depth<br />
(ft)<br />
Depth to water table<br />
(ft)<br />
Precipitation<br />
(in/yr)<br />
Cl P<br />
(mg/L)<br />
Cl UZ<br />
(mg/L)<br />
Recharge<br />
(in/yr)<br />
Age<br />
(yr)<br />
Tritium<br />
(TU)<br />
1 103.8 74.8 35.6 1.02 71.6 0.7 (2) 245 0.76<br />
2 53.3 43.3 35.4 1.02 42.6 1.6 (5) 70 3.25<br />
3 53.7 41.3 42.0 0.74 37.2 0.9 (2) 78 3.30<br />
4 38.8 24.8 41.8 0.74 20.5 1.6 (4) 32 3.57<br />
5 18.5 10.5 41.5 0.74 37.6 0.4 (1) 48 3.43<br />
6 48.6 37.4 38.4 0.84 27.9 1.3 (3) 64 3.05<br />
7 78.5 76.7 38.5 0.84 27.7 1.4 (4) 75 1.10<br />
Notes: Borehole locations are shown in Figure 11-3. Precipitation represents 1971–2000 mean. Precipitation chloride concentrations<br />
were multiplied by two to account for dry fallout. Values in paren<strong>the</strong>ses represent percentages <strong>of</strong> annual precipitation.<br />
Cl P = chloride concentration in precipitation; Cl GW = chloride concentration in groundwater; ft = feet; in/yr = inches per year;<br />
mg/L = milligrams per liter; TU = Tritium units.<br />
Table 11-4. Carbon-14 age, uncertainty, and recharge rate for wells in Atascosa County in <strong>the</strong> sou<strong>the</strong>rn portion <strong>of</strong> <strong>the</strong> Carrizo-Wilcox<br />
Aquifer.<br />
Sample ID<br />
Age<br />
(yr)<br />
Uncertainty<br />
(yr)<br />
Distance<br />
(mi)<br />
Velocity<br />
(ft/yr)<br />
Mean deep<br />
recharge<br />
(in/yr)<br />
Minimum<br />
deep recharge<br />
(in/yr)<br />
Maximum<br />
deep recharge<br />
(in/yr)<br />
Tx-01 a 9,500 3,000 11.9 6.6 0.28 0.21 0.40<br />
Tx-24 a 17,400 3,000 10.8 3.3 0.14 0.12 0.17<br />
Tx-92 b 3,750 700 2.0 2.8 0.12 0.03 0.06<br />
Tx-93 b 6,300 1150 11.0 9.2 0.39 0.35 0.44<br />
Tx-94 b 14,000 1,050 18.0 6.8 0.29 0.27 0.31<br />
Note: Sample ID values from original references. Average recharge rates are based on carbon-14 ages. Minimum and maximum recharge rates<br />
are based on carbon-14 age uncertainty.<br />
a Castro and o<strong>the</strong>rs (2000)<br />
b Pearson and White (1967)<br />
ft/yr = feet per year; in/yr = inches per year<br />
<strong>Texas</strong> Water Development Board <strong>Report</strong> <strong>374</strong> 197
precipitation and recharge for bare<br />
sandy soils from unsaturated zone modeling<br />
(Equation 8) range from 11 inches<br />
per year (44 percent <strong>of</strong> mean annual<br />
precipitation) in <strong>the</strong> sou<strong>the</strong>rn part <strong>of</strong><br />
<strong>the</strong> aquifer to 32 inches per year (63 percent<br />
<strong>of</strong> mean annual precipitation) in<br />
<strong>the</strong> nor<strong>the</strong>rn part. These rates represent<br />
<strong>the</strong> maximum, diffuse recharge rates as<br />
a function <strong>of</strong> climate forcing because<br />
vegetation evapotranspiration and soil<br />
textural variability are not included; however,<br />
<strong>the</strong> rates are so high that <strong>the</strong>y do<br />
little to constrain actual recharge rates.<br />
Recharge rates for vegetated, texturally<br />
variable soils (Equation 9) were much<br />
lower than those based on bare sandy<br />
soils (0.4 to 5.1 inches per year) representing<br />
2 percent to 10 percent <strong>of</strong> mean<br />
annual precipitation. These recharge<br />
rates compare favorably with regional<br />
recharge estimates based on groundwater<br />
chloride data (Figure 11-4).<br />
11.3.3<br />
Recharge estimates from<br />
groundwater models<br />
11.3.3.1<br />
Steady-state predevelopment model<br />
The steady-state predevelopment model<br />
provides valuable information on aquifer<br />
recharge and discharge that can potentially<br />
be captured by pumpage during<br />
postdevelopment. The water budget for<br />
each <strong>of</strong> <strong>the</strong> three models was obtained<br />
from Kelley and o<strong>the</strong>rs (2004), and <strong>the</strong><br />
combined budget for <strong>the</strong> entire aquifer<br />
was obtained from Deeds and o<strong>the</strong>rs<br />
(this volume). The budget for <strong>the</strong> entire<br />
aquifer differs from that <strong>of</strong> <strong>the</strong> combined<br />
individual models (sou<strong>the</strong>rn, central,<br />
and nor<strong>the</strong>rn) because <strong>of</strong> <strong>the</strong> overlap<br />
in each <strong>of</strong> <strong>the</strong> individual models. Total<br />
recharge increases from 114,000 acrefeet<br />
per year in <strong>the</strong> sou<strong>the</strong>rn model to<br />
251,000 acre-feet per year in <strong>the</strong> central<br />
model and to 590,000 acre-feet per year<br />
in <strong>the</strong> nor<strong>the</strong>rn model; however, when<br />
<strong>the</strong>se recharge rates are normalized by<br />
<strong>the</strong> area <strong>of</strong> <strong>the</strong> outcrop <strong>of</strong> <strong>the</strong> aquifer, <strong>the</strong><br />
increases are not as marked (0.75 inches<br />
per year, sou<strong>the</strong>rn model and 1.1 inches<br />
per year in both <strong>the</strong> central and nor<strong>the</strong>rn<br />
models) (Table 11-5). Most (54–66<br />
percent) <strong>of</strong> <strong>the</strong> recharge discharges as<br />
streams and springs. The ratio <strong>of</strong> losing<br />
stream inflow to gaining stream outflow<br />
decreases from <strong>the</strong> sou<strong>the</strong>rn to nor<strong>the</strong>rn<br />
models (16 percent, 10 percent, and<br />
2 percent, respectively), consistent with<br />
<strong>the</strong> observation <strong>of</strong> some losing sections<br />
but still overall gaining streams<br />
in <strong>the</strong> sou<strong>the</strong>rn area and entirely gaining<br />
streams in <strong>the</strong> nor<strong>the</strong>rn area. The<br />
proportion <strong>of</strong> total recharge that discharges<br />
as evapotranspiration increases<br />
from 6 percent in <strong>the</strong> sou<strong>the</strong>rn, 27 percent<br />
in <strong>the</strong> central, and 46 percent in<br />
<strong>the</strong> nor<strong>the</strong>rn aquifer models. Subtracting<br />
discharge in <strong>the</strong> outcrop (streams,<br />
springs, evapotranspiration) from total<br />
recharge results in deep recharge that<br />
ranges from 34 percent in <strong>the</strong> sou<strong>the</strong>rn,<br />
6 percent in <strong>the</strong> central, and 0 percent<br />
in <strong>the</strong> nor<strong>the</strong>rn aquifer models.<br />
Therefore, although total volumetric<br />
recharge increases from <strong>the</strong> sou<strong>the</strong>rn<br />
to <strong>the</strong> nor<strong>the</strong>rn aquifer models, deep<br />
recharge decreases from <strong>the</strong> sou<strong>the</strong>rn<br />
to <strong>the</strong> nor<strong>the</strong>rn aquifer models.<br />
The relatively low quantity <strong>of</strong> deep<br />
recharge in <strong>the</strong> nor<strong>the</strong>rn model is attributed<br />
to shallower water tables and largescale<br />
discharge to perennial streams that<br />
serve to reject much <strong>of</strong> <strong>the</strong> increased<br />
recharge in <strong>the</strong> more humid climate in<br />
this region (Kelley and o<strong>the</strong>rs, this volume).<br />
Deep recharge is balanced by slow<br />
upward, cross-formational flow, cumulatively<br />
accounting for all deep recharge<br />
and upward flow from underlying aquifers.<br />
The far downdip boundary is for<br />
<strong>the</strong> most part closed, although Dutton<br />
and o<strong>the</strong>rs (2006) have shown that <strong>the</strong>re<br />
may be a small updip component <strong>of</strong> flow<br />
from <strong>the</strong> geopressured zone. The models<br />
provide regional average water budgets<br />
for <strong>the</strong> different aquifers and may deviate<br />
markedly from averages at <strong>the</strong> county or<br />
finer scale. In summary, predevelopment<br />
198 <strong>Texas</strong> Water Development Board <strong>Report</strong> <strong>374</strong>
conditions are characterized by discharge<br />
mostly as streams (~60 percent) and a<br />
combination <strong>of</strong> groundwater evapotranspiration<br />
(more significant in <strong>the</strong> north,<br />
46 percent) and cross-formational flow<br />
(more important in <strong>the</strong> south, 34 percent)<br />
(Table 11-5).<br />
The simulated water balance for predevelopment<br />
provides information on<br />
<strong>the</strong> amount <strong>of</strong> water that can be captured<br />
by well pumpage in <strong>the</strong> postdevelopment<br />
stage. The simulated total discharge provides<br />
an upper bound on <strong>the</strong> volume <strong>of</strong><br />
groundwater that can be pumped from<br />
<strong>the</strong> system during aquifer development;<br />
however, pumping at such a level would<br />
eliminate base flow to streams and possibly<br />
groundwater evapotranspiration,<br />
which would not be desirable. An understanding<br />
<strong>of</strong> <strong>the</strong> water requirements for<br />
instream flows (NRC, 2005) and for<br />
riparian evapotranspiration could be<br />
used to constrain <strong>the</strong> permissible pumpage<br />
levels during postdevelopment.<br />
The predevelopment model is calibrated<br />
using hydraulic head data and<br />
base flow discharge to streams. The<br />
solution <strong>of</strong> <strong>the</strong> model calibration is<br />
not unique. Similar calibration results<br />
could be obtained with higher recharge<br />
as long as groundwater evapotranspiration<br />
is also increased. Although <strong>the</strong><br />
differences between such models may<br />
not be important for steady-state calibration,<br />
<strong>the</strong>y can substantially impact<br />
transient simulations. Higher recharge<br />
and evapotranspiration will result in<br />
more water being available for pumpage<br />
during transient simulations because<br />
groundwater evapotranspiration can be<br />
captured by pumpage.<br />
11.3.3.2<br />
Transient model<br />
The transient model provides information<br />
on impacts <strong>of</strong> groundwater pumpage<br />
on <strong>the</strong> water budget for <strong>the</strong> aquifer<br />
(Table 11-6). Model calibration is based<br />
on matching simulated and measured<br />
groundwater level hydrographs over <strong>the</strong><br />
transient simulation period. The transient<br />
simulation results indicate that by<br />
1999 groundwater abstractions through<br />
pumpage represent increasing fractions<br />
<strong>of</strong> total recharge from nor<strong>the</strong>rn (33 percent),<br />
central (54 percent), and sou<strong>the</strong>rn<br />
(91 percent) parts <strong>of</strong> <strong>the</strong> aquifer. Pumpage<br />
in <strong>the</strong> sou<strong>the</strong>rn part <strong>of</strong> <strong>the</strong> aquifer<br />
is primarily for irrigation in <strong>the</strong> Winter<br />
Garden region, whereas pumpage in<br />
<strong>the</strong> central and nor<strong>the</strong>rn parts <strong>of</strong> <strong>the</strong><br />
aquifer is primarily for municipal purposes.<br />
The remaining outflows from<br />
<strong>the</strong> system include discharge to streams<br />
and springs and groundwater evapotranspiration,<br />
both <strong>of</strong> which increase in<br />
percent <strong>of</strong> total outflow from south to<br />
north. The water budget for <strong>the</strong> transient<br />
simulation is balanced by change<br />
in groundwater storage, recharge, and<br />
cross-formational flow.<br />
Groundwater pumpage during postdevelopment<br />
alters <strong>the</strong> equilibrium established<br />
between recharge and discharge<br />
during <strong>the</strong> steady-state predevelopment<br />
Table 11-5. Steady-state simulation results for <strong>the</strong> south, central, north, and combined model regions.<br />
Region<br />
Component and volume or depth<br />
Recharge Streams Evapotranspiration Deep recharge<br />
(af/yr) (in/yr) (af/yr) (in/yr) (af/yr) (in/yr) (af/yr) (in/yr)<br />
South 114,000 0.75 68,000 0.45 (60) 6,600 0.04 (6) 39,100 0.26 (34)<br />
Central 251,000 1.1 166,000 0.70 (66) 68,000 0.29 (27) 16,300 0.07 (6)<br />
North 590,000 1.1 317,000 0.59 (54) 275,000 0.51 (46)
period. The water abstracted from <strong>the</strong><br />
aquifer can be derived from groundwater<br />
storage, increased recharge, and/or<br />
decreased discharge. Initially, most <strong>of</strong><br />
<strong>the</strong> water abstracted through pumpage is<br />
derived from groundwater storage. With<br />
continued pumpage, water is derived<br />
less and less from groundwater storage<br />
but comes from o<strong>the</strong>r processes, such<br />
as increased recharge and/or decreased<br />
discharge. Transient simulations are used<br />
to quantify <strong>the</strong> amount and timing <strong>of</strong><br />
<strong>the</strong>se transitions. The initial decline in<br />
groundwater storage caused by pumpage<br />
generates a vertical head gradient, ultimately<br />
reversing cross-formational flow,<br />
and capturing this discharge mechanism<br />
and possibly draining water from overlying<br />
adjacent aquifers. Pumpage from <strong>the</strong><br />
Carrizo Aquifer impacts <strong>the</strong> overlying<br />
Queen City Aquifer and will ultimately<br />
impact <strong>the</strong> Queen City recharge zone<br />
also. Groundwater from <strong>the</strong> Queen City<br />
Aquifer is slowly drawn into <strong>the</strong> Reklaw<br />
aquitard, while some groundwater from<br />
<strong>the</strong> aquitard moves into <strong>the</strong> Carrizo<br />
Aquifer. At <strong>the</strong> same time, increased<br />
hydraulic gradients downdip from <strong>the</strong><br />
Carrizo-Wilcox outcrop zone increase<br />
<strong>the</strong> fraction <strong>of</strong> deep recharge resulting<br />
from a combination <strong>of</strong> decreased discharge,<br />
decreased groundwater storage<br />
in both <strong>the</strong> unconfined and confined<br />
zones, and migration <strong>of</strong> <strong>the</strong> unconfined/<br />
confined boundary.<br />
The water balance terms for <strong>the</strong> transient<br />
simulation were rearranged to show<br />
<strong>the</strong> source <strong>of</strong> well pumpage (Table 11-7).<br />
Most <strong>of</strong> <strong>the</strong> pumpage is in <strong>the</strong> confined<br />
portion <strong>of</strong> <strong>the</strong> aquifer. These results indicate<br />
that after decades <strong>of</strong> development<br />
(1999) and increasing pumpage, 40–95<br />
percent <strong>of</strong> well pumpage is still derived<br />
from reductions in groundwater storage,<br />
9–29 percent is derived from crossformational<br />
flow, and up to 34 percent<br />
is derived from increased deep recharge<br />
(Table 11-7). The change in groundwater<br />
storage (that is, decline in water<br />
table and piezometric head) represents<br />
a significant fraction <strong>of</strong> total pumpage.<br />
Ultimately, this fraction should tend to<br />
zero; however, currently, <strong>the</strong> aquifer cannot<br />
reach a new steady state (that is, no<br />
Table 11-6. Transient simulation results for <strong>the</strong> south, central, north, and combined model regions.<br />
Region<br />
Total<br />
recharge<br />
Deep<br />
recharge<br />
Total<br />
flow<br />
Component and volume (acre-feet per yr/1,000)<br />
Streamflow<br />
Groundwater<br />
ET<br />
Lateral<br />
flow<br />
Pumpage<br />
Storage<br />
change<br />
Cross-formational<br />
flow<br />
South 69 45 -306 -22 (7) -2 (1) -3 (1) -279 (91) 181 57<br />
Central 157 -8 -362 -126 (35) -39 (11) 0 (0) -197 (54) 187 18<br />
North 357 53 -463 -219 (47) -85 (18) -4 (1) -154 (33) 61 45<br />
Combined 558 120 -911 -337 (37) -101 (11) 0 (0) -473 (52) 251 95<br />
Note: Values in paren<strong>the</strong>ses represent percentages <strong>of</strong> total recharge.<br />
ET = evapotranspiration<br />
Table 11-7. Transient model simulation results for source <strong>of</strong> well pumpage.<br />
Component and volume (acre-feet/1,000)<br />
Region Pumpage Storage change Cross-formational flow Deep recharge Lateral flow<br />
South -279 181 (65) 57 (20) 45 (16) -3 (-1)<br />
Central -197 187 (95) 1 (9) -8 (-4) 0.3 (0)<br />
North -154 61 (40) 45 (29) 53 (34) -4 (-3)<br />
Combined -473 251 (53) 95 (20) 120 (25) 0 (0)<br />
Note: Values in paren<strong>the</strong>ses represent percentages <strong>of</strong> pumpage<br />
200 <strong>Texas</strong> Water Development Board <strong>Report</strong> <strong>374</strong>
change in groundwater storage), because<br />
pumping continues to increase. Crossformational<br />
flow is reversed from <strong>the</strong><br />
overlying Queen City-Sparta aquifers.<br />
However, locally, some water moves<br />
upward through <strong>the</strong> confining layer, but<br />
it is more than balanced by water being<br />
drawn into cones <strong>of</strong> depression caused<br />
by pumpage.<br />
11.4<br />
Summary<br />
Total recharge rates based on groundwater<br />
chloride range from 0.4 inches<br />
per year (2 percent <strong>of</strong> precipitation) in<br />
<strong>the</strong> semiarid sou<strong>the</strong>rn part to 4.0 inches<br />
per year (8 percent <strong>of</strong> precipitation) in<br />
<strong>the</strong> humid nor<strong>the</strong>rn part <strong>of</strong> <strong>the</strong> aquifer.<br />
Point recharge rates based on unsaturated<br />
zone chloride data in <strong>the</strong> central<br />
Carrizo-Wilcox Aquifer are spatially<br />
variable (0.7–1.6 inches per year) but<br />
generally consistent with those based<br />
on groundwater chloride. The presence<br />
<strong>of</strong> tritium (0.76–3.57 TU) in <strong>the</strong> central<br />
Carrizo-Wilcox Aquifer outcrop area<br />
indicates young (post 1950) ages and<br />
provides evidence for recent recharge.<br />
<strong>Upper</strong> bounds on deep recharge to <strong>the</strong><br />
confined part <strong>of</strong> <strong>the</strong> sou<strong>the</strong>rn Carrizo-<br />
Wilcox Aquifer range from 0.1 to 0.4<br />
inches per year based on carbon-14<br />
transects in Atascosa County. Total<br />
recharge rates based on unsaturated<br />
zone modeling results range from 0.4<br />
inches per year (2 percent <strong>of</strong> precipitation)<br />
in <strong>the</strong> sou<strong>the</strong>rn part to 5.1 inches<br />
per year (10 percent <strong>of</strong> precipitation) in<br />
<strong>the</strong> nor<strong>the</strong>rn part <strong>of</strong> <strong>the</strong> aquifer. Under<br />
steady-state conditions, recharge equals<br />
discharge, and model results indicate<br />
that recharge ranges from 0.75 inches<br />
per year in <strong>the</strong> sou<strong>the</strong>rn part and 1.1<br />
inches per year in both <strong>the</strong> central and<br />
nor<strong>the</strong>rn parts <strong>of</strong> <strong>the</strong> Carrizo-Wilcox<br />
Aquifer. Transient simulations indicate<br />
that irrigation pumpage in <strong>the</strong> sou<strong>the</strong>rn<br />
part is derived primarily from groundwater<br />
storage changes (65 percent),<br />
with lesser amounts from cross-formational<br />
flow (20 percent) and increased<br />
deep recharge (16 percent) based on<br />
results for <strong>the</strong> year 1999. Groundwater<br />
pumpage in <strong>the</strong> nor<strong>the</strong>rn Carrizo-<br />
Wilcox Aquifer is derived mostly from<br />
groundwater storage (40 percent), deep<br />
recharge (34 percent), and cross-formational<br />
flow (29 percent). Understanding<br />
groundwater recharge changes in<br />
response to pumpage is essential for<br />
assessing future water availability in <strong>the</strong><br />
aquifer.<br />
<strong>Texas</strong> Water Development Board <strong>Report</strong> <strong>374</strong> 201
11.5<br />
References<br />
Allison, G.B., and Hughes, M.W., 1983, The use <strong>of</strong> natural tracers as indicators <strong>of</strong> soilwater<br />
movement in a temperate semi-arid region: Journal <strong>of</strong> Hydrology, v. 60, p.<br />
157–173.<br />
Bredehoeft, J.D., 2002, The water budget myth revisited—Why hydrogeologists model:<br />
Ground Water, v. 40, no. 4, p. 340–345.<br />
Castro, M.C., and Goblet, P., 2003, Calibration <strong>of</strong> regional groundwater flow models—<br />
Working toward a better understanding <strong>of</strong> site-specific systems: Water Resources<br />
Research, v. 39, no. 6, art. no. 1172.<br />
Castro, M.C., Stute, M., and Schlosser, P., 2000, Comparison <strong>of</strong> He-4 ages and C-14<br />
ages in simple aquifer systems—Implications for groundwater flow and chronologies:<br />
Applied Geochemistry, v. 15, no. 8, p. 1137–1167.<br />
Deeds, N., Kelley, V., Fryar, D., Jones, T., Whellan, A.J., and Dean, K.E., 2003, Groundwater<br />
availability model for <strong>the</strong> Sou<strong>the</strong>rn Carrizo-Wilcox Aquifer: Prepared for <strong>the</strong><br />
<strong>Texas</strong> Water Development Board, 452 p.<br />
Deeds, N., Fryar, D., Dutton, A.R., and Nicot, J.-P., 2009, Hydrogeology <strong>of</strong> <strong>the</strong> Carrizo-<br />
Wilcox Aquifer, this volume.<br />
Devlin, J.F., and Sophocleous, M., 2005, The persistence <strong>of</strong> <strong>the</strong> water budget myth and<br />
its relationship to sustainability: Hydrogeology Journal, v. 13, no. 4, p. 549–554.<br />
Dutton, A.R., Harden, B., Nicot, J.-P., and O’Rourke, D., 2003, Groundwater availability<br />
model for <strong>the</strong> central part <strong>of</strong> <strong>the</strong> Carrizo-Wilcox aquifer in <strong>Texas</strong>, Contract report:<br />
Prepared for <strong>the</strong> <strong>Texas</strong> Water Development Board, 295 p.<br />
Dutton, A.R., Nicot, J.-P., and Kier, K.S., 2006, Hydrologic convergence <strong>of</strong> hydropressured<br />
and geopressured zones, Central <strong>Texas</strong>, Gulf <strong>of</strong> Mexico Basin, USA: Hydrogeology<br />
Journal, v. 14, p. 859–867.<br />
Fryar, D.G., Senger, R., Deeds, N., Pickens, J.F., Whellan, A., and Dean, K., 2003, Groundwater<br />
availability model for <strong>the</strong> Nor<strong>the</strong>rn Carrizo-Wilcox Aquifer: Prepared for <strong>the</strong><br />
<strong>Texas</strong> Water Development Board, 529 p.<br />
George, P.G., 2009, Geology <strong>of</strong> <strong>the</strong> Carrizo-Wilcox Aquifer, this volume.<br />
Hamlin, S., 1988, Depositional and ground-water flow systems <strong>of</strong> <strong>the</strong> Carrizo-<strong>Upper</strong><br />
Wilcox, South <strong>Texas</strong>: University <strong>of</strong> <strong>Texas</strong> at Austin, Bureau <strong>of</strong> Economic Geology<br />
<strong>Report</strong> <strong>of</strong> Investigations 173, 61 p.<br />
Homer, C., Dewitz, J., Fry, J., Coan, M., Hossain, N., Larson, C., Herold, N., McKerrow,<br />
A., VanDriel, J.N., and Wickham, J., 2007, Completion <strong>of</strong> <strong>the</strong> 2001 National Land<br />
Cover Database for <strong>the</strong> conterminous United States, photogrammetric engineering<br />
and remote sensing, v. 73, no. 4, p. 337–341.<br />
Johnston, R.H., 1997, Sources <strong>of</strong> water supplying pumpage from regional aquifer systems<br />
<strong>of</strong> <strong>the</strong> United States: Hydrogeology Journal, v. 5, no. 2, p. 54–63.<br />
Keese, K.E., Scanlon, B.R., and Reedy, R.C., 2005, Assessing controls on diffuse groundwater<br />
recharge using unsaturated flow modeling: Water Resources Research, v. 41,<br />
W06010, doi:06010.01029/02004WR003841.<br />
202 <strong>Texas</strong> Water Development Board <strong>Report</strong> <strong>374</strong>
Kelley, V., Fryar, D.G., and Deeds, N., 2009, Hydrogeology <strong>of</strong> <strong>the</strong> Queen City and Sparta<br />
<strong>Aquifers</strong> with an emphasis on regional mechanisms <strong>of</strong> discharge, this volume.<br />
Kelley, V.A., Deeds, N.E., Fryar, D.G., and Nicot, J.-P., 2004, Groundwater availability<br />
model for <strong>the</strong> Queen City and Sparta aquifers: Prepared for <strong>the</strong> <strong>Texas</strong> Water Development<br />
Board.<br />
LBG-Guyton Assoc. and HDR Engineering, Inc., 1998, Interaction between ground<br />
water and surface water in <strong>the</strong> Carrizo-Wilcox Aquifer, [variously paged].<br />
NRC (National Research Council), 2005, The science <strong>of</strong> instream flows—A review <strong>of</strong><br />
<strong>the</strong> <strong>Texas</strong> Instream Flow Program: National Research Council, 150 p.<br />
Pearson, F.J.J., and White, D.E., 1967, Carbon 14 ages and flow rates <strong>of</strong> water in Carrizo<br />
Sand, Atascosa County, <strong>Texas</strong>, Water Resources Research, v. 3, p. 251–261.<br />
Scanlon, B.R., and Goldsmith, R.S., 1997, Field study <strong>of</strong> spatial variability in unsaturated<br />
flow beneath and adjacent to playas: Water Resources Research, v. 33, p.<br />
2239–2252.<br />
SCAS (Spatial Climate Analysis Service), 2004, Near-real-time monthly high-resolution<br />
precipitation climate data set for <strong>the</strong> conterminous United States (2.5-arc minute<br />
1971–2000 mean monthly precipitation grids for <strong>the</strong> conterminous United States):<br />
Corvallis, OR, Spatial Climate Analysis Service, Oregon State University, Arc grid<br />
file, www.ocs.oregonstate.edu/prism, accessed March 2006.<br />
Slade, R.M.J., Bentley, J.T., Michaud, D., 2002, Results <strong>of</strong> streamflow gain-loss studies in<br />
<strong>Texas</strong>, with emphasis on gains from and losses to major and minor aquifers, <strong>Texas</strong>,<br />
2000: U.S. Geological Survey Open File <strong>Report</strong> 02-068, 136 p.<br />
Sophocleous, M., 1998, Perspectives on sustainable development <strong>of</strong> water resources in<br />
Kansas: Kansas Geological Survey Bulletin, v. 239, 239 p.<br />
Sophocleous, M., and Devlin, J.F., 2004, Discussion <strong>of</strong> <strong>the</strong> water budget myth revisited—<br />
Why hydrogeologists model, Bredehoeft, J.D., ed.: Ground Water, v. 42, no. 4, p.<br />
618.<br />
USDA (U.S. Department <strong>of</strong> Agriculture), 1994, State soil geographic (STATSGO) data<br />
base: National Resources Conservation Services Miscellaneous Publication No.<br />
1492, [variously paged].<br />
Williamson, A.K., and Grubb, H.F., 2001, Ground-water flow in <strong>the</strong> Gulf Coast aquifer<br />
systems, south-central United States: U.S. Geological Survey Pr<strong>of</strong>essional Paper<br />
1416-F, 173 p.<br />
<strong>Texas</strong> Water Development Board <strong>Report</strong> <strong>374</strong> 203
This page is intentionally blank.<br />
204 <strong>Texas</strong> Water Development Board <strong>Report</strong> <strong>374</strong>