Desalination Database Updates for Texas - Texas Water ...
Desalination Database Updates for Texas - Texas Water ...
Desalination Database Updates for Texas - Texas Water ...

Create successful ePaper yourself
Turn your PDF publications into a flip-book with our unique Google optimized e-Paper software.
<strong>Desalination</strong> <strong>Database</strong> <strong>Updates</strong> <strong>for</strong> <strong>Texas</strong><br />
Saqib Shirazi and Jorge Arroyo<br />
Innovative <strong>Water</strong> Technologies<br />
<strong>Texas</strong> <strong>Water</strong> Development Board<br />
Austin, TX 78701<br />
Abstract<br />
The <strong>Texas</strong> <strong>Water</strong> Development Board (TWDB) in collaboration with the Bureau of Economic Geology<br />
developed a desalination database <strong>for</strong> <strong>Texas</strong> in 2005 to provide support <strong>for</strong> desalination supply<br />
alternatives in the state. Recently, TWDB updated the database by collecting in<strong>for</strong>mation on<br />
desalination facilities from the <strong>Texas</strong> Commission on Environmental Quality, South Central Membrane<br />
Association, International <strong>Desalination</strong> Association, and by conducting a survey of desalination facilities<br />
in <strong>Texas</strong>.<br />
In the past five years, total brackish water desalination capacity in <strong>Texas</strong> (including blending) increased<br />
from 75 million gallons per day (MGD) to 120 million gallons per day. The updated database contains<br />
in<strong>for</strong>mation on 44 desalination facilities; 12 of these facilities use surface water as the feed water<br />
source, 32 other facilities use groundwater as the feed water source. The Kay Bailey Hutchison<br />
<strong>Desalination</strong> Plant is the largest desalination facility in the state with a design capacity of 27.5 MGD.<br />
The desalination database will be updated periodically in the future to provide utilities, water planners,<br />
policy makers, and other interested stakeholders a resource <strong>for</strong> obtaining in<strong>for</strong>mation on desalination<br />
facilities in <strong>Texas</strong>.
1.0 Introduction<br />
<strong>Desalination</strong> is the process of removing total dissolved solids (TDS) from raw water (or source water) to<br />
produce water that is suitable <strong>for</strong> its intended purposes (Henthorne, 2009; American <strong>Water</strong> Works<br />
Association, 2007). Desalting devices generally use either evaporation or membrane filtration to remove<br />
salts from water.<br />
Although every desalination project is unique, four primary components are common to all desalination<br />
facilities (Figure 1-1); the pumping and delivery of source water, the treatment facility where the source<br />
water is desalted, the disposal of concentrate, and the delivery of the potable water to customers<br />
(TWDB, 2008).<br />
Figure 1-1: Primary components of a desalination facility<br />
<strong>Desalination</strong> is not a new technology in <strong>Texas</strong>. One of the first seawater desalination demonstration<br />
plants of the United States was built at the Dow Chemical Complex in Free port, <strong>Texas</strong> (The Dow Texan,<br />
1961). Twenty years later, in 1981, Haciendas del Notre <strong>Water</strong> Improvement District first built a fullscale<br />
brackish water desalination plant <strong>for</strong> public water supply in <strong>Texas</strong>. Since then a number of<br />
desalination plants of various sizes were built in <strong>Texas</strong>.<br />
To inventory the desalination facilities in <strong>Texas</strong>, and to provide support <strong>for</strong> water desalination supply<br />
alternatives in the state, the <strong>Texas</strong> <strong>Water</strong> Development Board (TWDB) in collaboration with the Bureau<br />
of Economic Geology developed a desalination database <strong>for</strong> <strong>Texas</strong> in 2005. The database is thought to
e the first at the state level to include all public water supplies with a desalination design capacity of<br />
greater than 25,000 gallons per day (TWDB, 2005). However, it has not been updated since it was first<br />
developed.<br />
In the past few years, several full-scale desalination plants were commissioned in <strong>Texas</strong>, and several<br />
more are in the process of being commissioned. Some of the desalination plants that were in operation<br />
five years ago have been decommissioned in the mean time. To incorporate these changes into the<br />
desalination database, an amendment of the database was made.<br />
During the process of updating the database, the TWDB collected in<strong>for</strong>mation on various sequences of<br />
desalination that include feed water source, pretreatment, membrane process, post-treatment, and<br />
concentrate disposal. We also collected in<strong>for</strong>mation on the production cost of desalinated water.<br />
The primary objective of this report is to provide an analysis of the data obtained from various<br />
desalination facilities in <strong>Texas</strong>.<br />
2.0 Methods<br />
In the first step of the process, the 2005 desalination database was reviewed. In the second step,<br />
desalination facilities with a design capacity of greater than 25,000 gallons of water per day were<br />
identified. In the third step, facility operators or managers of each of the selected desalination facilities<br />
were contacted and requested to fill out a survey <strong>for</strong>m. In the final step, in<strong>for</strong>mation obtained from the<br />
facility managers/operators were entered into a Microsoft Access <strong>Database</strong>, which was ultimately<br />
imported into a SQL server database.<br />
2.1 Sources of In<strong>for</strong>mation<br />
Several sources were used to collect in<strong>for</strong>mation on desalination facilities in <strong>Texas</strong>. A detailed discussion<br />
on the sources that were used to collect in<strong>for</strong>mation is provided below.<br />
a. One of the primary sources of in<strong>for</strong>mation was <strong>Texas</strong> Commission on Environmental Quality’s<br />
(TCEQ) <strong>Water</strong> Utility <strong>Database</strong> (WUD). One of the major limitations of the WUD database is that<br />
the database is updated by TCEQ field inspections. There<strong>for</strong>e, more recent facilities not yet<br />
inspected are not included in the WUD.<br />
b. Several other sources were used to collect in<strong>for</strong>mation on facilities that are not present in the<br />
WUD. These sources include<br />
TWDB’s drinking water “State Revolving Loan Program’s Priority List”
Number of Facilities<br />
Global <strong>Water</strong> Intelligence’s Desal <strong>Database</strong><br />
American Membrane Technology Association’s database<br />
Personal contacts<br />
2.2 Collection of In<strong>for</strong>mation<br />
The primary method of collecting in<strong>for</strong>mation on desalination facilities was to interview facility<br />
operators and to request them to fill out a survey <strong>for</strong>m. The survey <strong>for</strong>m included a number of<br />
questionnaires <strong>for</strong> the facility operators/managers, which include in<strong>for</strong>mation on plant’s name and<br />
address, plant’s design and production capacities, raw water supply source, pretreatment, posttreatment,<br />
concentrate management, and production cost of desalinated water. A sample survey <strong>for</strong>m<br />
is attached in Appendix A of this report.<br />
Analysis of the survey revealed that a total of 10 desalination facilities that provided in<strong>for</strong>mation on<br />
their plants in 2005, did not respond to the latest survey. In<strong>for</strong>mation <strong>for</strong> these desalination facilities<br />
remains unchanged in the desalination database.<br />
3.0 Results<br />
3.1 Reasons <strong>for</strong> Building <strong>Desalination</strong> Facilities<br />
The survey identified that the primary reason <strong>for</strong> building desalination facilities in <strong>Texas</strong> is to remove<br />
dissolved solids from water. Other reasons <strong>for</strong> which desalination plants in <strong>Texas</strong> were built include the<br />
removal of high concentration of nitrate, arsenic, fluoride, and perchlorate from water (Figure 3-1).<br />
30<br />
25<br />
20<br />
15<br />
10<br />
5<br />
0<br />
Reasons<br />
Figure 3-1: Reasons <strong>for</strong> building desalination facilities in <strong>Texas</strong>
Period<br />
3.2 <strong>Desalination</strong> Facilities<br />
The survey identified that <strong>Texas</strong> currently has 44 desalination facilities. Most of these facilities were built<br />
between 1996 and 2010 (Figure 3-2). The survey also identified that three facilities (the City of Electra,<br />
Haciendas Del Notre <strong>Water</strong> Improvement District, and the City of Primera) decommissioned their<br />
desalination plants in the past five years. Total design capacities of these three facilities were about 3<br />
MGD.<br />
2006-10<br />
2001-05<br />
1996-2000<br />
1991-95<br />
1986-90<br />
1981-85<br />
0 2 4 6 8 10 12 14<br />
Number of Facilities<br />
Figure 3-2: Start-up year <strong>for</strong> desalination facilities in <strong>Texas</strong><br />
3.3 <strong>Desalination</strong> Capacities<br />
Depending on the source, desalination is divided into two major categories; seawater desalination (total<br />
dissolved solids concentration is greater than 25,000 mg/L) and brackish water desalination (total<br />
dissolved solids concentration varies from 1,000 – 10,000 mg/L). Brackish water source is further divided<br />
into two sub categories; brackish surface water and brackish groundwater.<br />
Currently, <strong>Texas</strong> does not have any full-scale seawater desalination facility. There are 44 brackish water<br />
desalination facilities in <strong>Texas</strong>, with a design capacity of approximately 120 MGD (including blending).<br />
Four of these facilities are currently sitting idle (City of Granbury, City of Los Ybanez, Veolia <strong>Water</strong>, and<br />
Windermere <strong>Water</strong> System). Table 3-1 provides a list of the desalination facilities in <strong>Texas</strong> that have the<br />
capacity of producing more than 25,000 gallons of water per day.<br />
Twelve of <strong>for</strong>ty four facilities use surface water as a source of raw water, which accounts <strong>for</strong> design<br />
capacity of 50 MGD. Thirty two facilities use groundwater as a raw water source, which accounts <strong>for</strong> the<br />
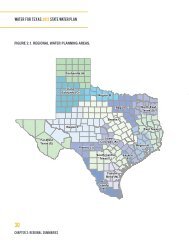
design capacity of 70 MGD. Figure 3-3 shows the location of brackish surface water and brackish
groundwater desalination facilities in <strong>Texas</strong>. El Paso <strong>Water</strong> Utility’s Kay Bailey Hutchison <strong>Desalination</strong><br />
facility has the highest design capacity in the State (27.5 MGD).<br />
Table 3-1: Summary of desalination facilities in <strong>Texas</strong> (with a design capacity of greater than 25,000<br />
gallon per day)<br />
Facility Name<br />
Status<br />
<strong>Desalination</strong><br />
Facility Start Up<br />
Year<br />
Source<br />
<strong>Water</strong><br />
Big Bend Motor Inn Operating 1989 GW RO<br />
City of Abilene<br />
(Hargesheimer Treatment<br />
Plant)<br />
Operating 2003 SW RO<br />
City of Bardwell Operating 1990 GW RO<br />
City of Bayside Operating 1990 GW RO<br />
City of Beckville Operating 2004 GW RO<br />
City of Brady Operating 2005 SW RO<br />
City of Clarksville City Operating 2006 GW RO<br />
City of Evant Operating 2010 GW RO<br />
City of Fort Stockton Operating 1996 GW RO<br />
City of Granbury<br />
Idle<br />
Original EDR Plant<br />
was built in 1984;<br />
in 2007 RO Plant SW RO<br />
was mounted in<br />
trailer<br />
City of Hubbard Operating 2002 GW RO<br />
City of Kenedy Operating 1995 GW RO<br />
City of Laredo Operating 1996 GW RO<br />
City of Los Ybanez Idle 1991 GW RO<br />
City of Robinson Operating 1994 SW RO<br />
City of Seadrift Operating 1998 GW RO<br />
City of Seymour Operating 2000 GW RO<br />
Process<br />
City of Sherman Operating 1993 SW EDR<br />
City of Tatum Operating 1999 GW RO<br />
Cypress <strong>Water</strong> Treatment<br />
Plant<br />
Operating 2008 SW RO<br />
Dell City Operating 1997 GW EDR<br />
DS <strong>Water</strong>s of America, LP Operating 1997 GW RO<br />
Esperanza Fresh <strong>Water</strong><br />
Supply<br />
Operating 1990 GW RO<br />
Holiday Beach WSC Operating 2002 GW RO
Facility Name<br />
Status<br />
<strong>Desalination</strong><br />
Facility Start Up<br />
Year<br />
Source<br />
<strong>Water</strong><br />
Process<br />
Horizon Regional MUD Operating 2001 GW RO<br />
Kay Bailey Hutchison<br />
<strong>Desalination</strong> Plant<br />
Operating 2007 GW RO<br />
Lake Granbury Surface<br />
<strong>Water</strong> Advanced<br />
Operating 2003 SW RO<br />
Treatment System<br />
Longhorn Ranch Motel Operating 1990 GW RO<br />
Midland Country Club -<br />
fairways & greens<br />
Operating 2004 GW RO<br />
North Alamo <strong>Water</strong><br />
Supply Corporation Operating 2005 GW RO<br />
(Lasara)<br />
North Alamo <strong>Water</strong><br />
Supply Corporation Operating 2008 GW RO<br />
(Owassa)<br />
North Alamo (Doolittle) Operating 2008 GW RO<br />
North Cameron Regional<br />
<strong>Water</strong> Supply Corporation<br />
Operating 2006 GW RO<br />
Oak Trail Shores<br />
Operating<br />
EDR was installed<br />
in 1998; RO<br />
replaced EDR in<br />
SW RO<br />
2007<br />
Possum Kingdom <strong>Water</strong><br />
Supply Corporation<br />
Operating 2003 SW RO<br />
River Oaks Ranch Operating 1987 GW RO<br />
Southmost Regional<br />
<strong>Water</strong> Authority<br />
Operating 2004 GW RO<br />
Sportsmans World MUD Operating 1984 SW RO<br />
Study Butte Terlingua<br />
<strong>Water</strong> System<br />
Operating 2000 GW RO<br />
The Cliffs (Double<br />
Diamond Utilities)<br />
Operating 1991 SW RO<br />
Valley MUD #2 Operating 2000 GW RO<br />
Veolia <strong>Water</strong> Treatment<br />
Plant<br />
Idle 1992 SW RO<br />
<strong>Water</strong> Runner, Inc. Operating 2001 GW RO<br />
Windermere <strong>Water</strong><br />
System<br />
Idle 2003 GW RO<br />
NOTE:<br />
EDR: Electrodialysis reversal<br />
RO: Reverse osmosis<br />
GW: Groundwater<br />
SW: Surface water<br />
MUD: Municipal Utility District<br />
WSC: <strong>Water</strong> Supply Corporation
Figure 3-3: Locations of desalination facilities in <strong>Texas</strong><br />
3.4 <strong>Desalination</strong> Operation and Maintenance<br />
The survey asked various operational and maintenance questions to the facility operators and<br />
managers. These questions include feed water source and quality, desalination treatment method,<br />
membrane scaling type, membrane cleaning frequency, membrane replacement frequency, product<br />
water post-treatment, concentrate post-treatment, and concentrate disposal. A summary of the<br />
outcome of the survey is provided below.<br />
a) Feed <strong>Water</strong> Quality: Feed water quality is a critical design criterion <strong>for</strong> desalination. Low TDS<br />
concentration in feed water requires less energy <strong>for</strong> treatment compared to high TDS in feed water.<br />
Additionally, low TDS allows <strong>for</strong> higher conversion rates and the plant can operate with less dosing of<br />
antiscalant chemicals.<br />
In <strong>Texas</strong>, total dissolved solids concentration in desalination facilities varies from less than 1,000 mg/L to<br />
greater than 3,000 mg/L (Figure 3-4).
Number of Facilities<br />
14<br />
12<br />
10<br />
8<br />
12<br />
6<br />
4<br />
2<br />
6<br />
4<br />
7<br />
3<br />
8<br />
4<br />
0<br />
Feed <strong>Water</strong> TDS Concentration (mg/L)<br />
Figure 3-4: Total dissolved solids concentration in feed water<br />
b) Treatment Method: Two major types of desalination technologies are available worldwide;<br />
membrane based and thermal. In <strong>Texas</strong>, the vast majority of desalination facilities rely on reverse<br />
osmosis. Only two facilities (City of Sherman and Dell City) use electrodialysis reversal <strong>for</strong> desalting<br />
water. Design capacities <strong>for</strong> electrodialysis reversal and reverse osmosis in <strong>Texas</strong> are 11.1 and 108.9<br />
MGD, respectively. Two facilities (City of Granbury and Oak Trail Shores) shifted the treatment method<br />
from EDR to RO in the past few years.<br />
c) Membrane Fouling: Membrane fouling, caused by the deposition of dissolved materials on the<br />
membrane surface, is one of the major limitations of reverse osmosis technology. Membrane fouling<br />
increases feed pressure, decreases water production, and shortens membrane life.<br />
<strong>Desalination</strong> facilities in <strong>Texas</strong> reported various types of membrane fouling including inorganic, organic,<br />
colloidal, silica, and biological fouling. Among them, inorganic scaling is the most predominant. 15 of 44<br />
desalination facilities reported inorganic scaling as one of the major operational problems (Figure 3-5).
Number of Facilities<br />
18<br />
16<br />
14<br />
12<br />
15<br />
10<br />
8<br />
6<br />
4<br />
2<br />
0<br />
Inorganic Silica Metal<br />
Oxide<br />
2<br />
4<br />
9<br />
5<br />
4<br />
Colloidal Biological Other<br />
Fouling Type<br />
Figure 3-5: Membrane fouling in desalination facilities of <strong>Texas</strong><br />
d) Membrane Cleaning: Cleaning is the process of removing mineral scale, organic matter,<br />
biological growth, colloidal particles, or insoluble constituents which build up on the surface of the<br />
membrane. The optimum cleaning procedure restores the membrane production back to its original or<br />
near original state. A number of factors affect membrane cleaning including raw water quality, type of<br />
foulants, and type of membrane.<br />
Generally, membrane cleaning frequency may vary from once a month to once a year. Most of the<br />
desalination facility operators in <strong>Texas</strong> reported that they clean membranes as needed (Figure 3-6).
Number of Facilities<br />
Cleaning Frequency<br />
Not Responded<br />
4<br />
As Needed<br />
13<br />
Other<br />
7<br />
Bi-Anually<br />
1<br />
Anually<br />
6<br />
Semi-Anually<br />
6<br />
Quarterly<br />
5<br />
Monthly<br />
2<br />
0 2 4 6 8 10 12 14<br />
Number of Facilities<br />
Figure 3-6: Membrane cleaning frequency in desalination facilities of <strong>Texas</strong><br />
e) Membrane Replacement: After several years of operation, membranes’ water production and<br />
salt rejection capacities decrease, and they need to be replaced with new ones. Generally, the life span<br />
of a membrane varies from 6 to 9 years. Because many desalination facilities in <strong>Texas</strong> were built in the<br />
past fifteen years, a large number of these facilities have not changed membranes since they started<br />
their operation (Figure 3-7).<br />
20<br />
18<br />
16<br />
14<br />
12<br />
10<br />
8<br />
6<br />
4<br />
2<br />
0<br />
18<br />
3 4<br />
9<br />
5<br />
3<br />
2<br />
Membrane Replacement Frequency<br />
Figure 3-7: Membrane replacement frequency in desalination facilities of <strong>Texas</strong>
Post-Treatment Options<br />
f) Concentrate Management and Disposal: All desalination processes generate a concentrated salt<br />
solution or brine by-product that must be managed in an environmentally sound manner. Concentrate<br />
management options include volume minimization, post- treatment, beneficial reuse, and concentrate<br />
disposal.<br />
Most of the desalination facilities in <strong>Texas</strong> do not treat concentrate prior to disposal (Figure 3-8). They<br />
use one or more methods <strong>for</strong> concentrate disposal. These methods include discharge in the sanitary<br />
sewer or in the surface water body, evaporation, land application, deep well injection and zero<br />
discharge desalination. Most of the desalination facilities in <strong>Texas</strong> use only one method; however, some<br />
facilities use more than one method <strong>for</strong> concentrate disposal.<br />
A majority of the desalination facilities in <strong>Texas</strong> discharge their concentrate either in the sanitary sewer<br />
or in the surface water body. Thirteen facilities use desalination concentrate <strong>for</strong> land application, seven<br />
facilities use evaporation ponds to treat desalination concentrate, one facility (Veolia <strong>Water</strong> System) use<br />
zero discharge desalination and one facility (Kay Bailey Hutchison <strong>Desalination</strong> Plant) use injection well<br />
to discharge the concentrate underground (Figure 3-9).<br />
Not Responded<br />
3<br />
Blending<br />
9<br />
pH Adjustment<br />
3<br />
No Post-Treatment<br />
31<br />
0 5 10 15 20 25 30 35<br />
Number of Facilities<br />
Figure 3-8: Post-treatment of concentrate
7<br />
1<br />
1<br />
15<br />
Disposal Well<br />
Surface <strong>Water</strong> Body<br />
8<br />
Sanitary Sewer<br />
5<br />
14<br />
Land Application<br />
Land Application <strong>for</strong><br />
Irrigation <strong>Water</strong><br />
Evapopration<br />
Figure 3-9: Concentrate disposal methods in desalination facilities of <strong>Texas</strong><br />
4.0 Cost of <strong>Desalination</strong><br />
Historically, the high cost of desalination has been a limiting factor <strong>for</strong> its broader use. However, over<br />
the past two decades, increased efficiency and lower cost of reverse osmosis membranes have lowered<br />
the cost of desalination to competitive levels. A recent TWDB review of desalination costs in <strong>Texas</strong><br />
indicated that the cost of brackish groundwater desalination ranges between $410 per acre-foot and<br />
$847 per acre-foot (TWDB, 2009)<br />
The cost of desalination depends on various factors including the source water type and quality, pretreatment<br />
requirement, post-treatment requirement of product water, post-treatment of concentrate,<br />
and concentrate disposal.<br />
<strong>Water</strong> production cost depends on the capital cost as well as the operation and maintenance cost of a<br />
plant. The survey collected in<strong>for</strong>mation from 27 facilities on the capital cost of desalination plants when<br />
they were built. The capital cost data of these plants is shown in Table 4-1. Data <strong>for</strong> operation costs are<br />
too disparate <strong>for</strong> a statistical study to be undertaken; there<strong>for</strong>e, operation costs are not shown in the<br />
Table.
Table 4-1: Capital cost of desalination facilities of <strong>Texas</strong> (when they were built)<br />
<strong>Desalination</strong> Facility<br />
Facility Start Up Year<br />
Capital Cost When<br />
the Facility was Built<br />
($)<br />
Big Bend Motor Inn 1989 26,000 0.057<br />
City of Abilene<br />
(Hargesheimer<br />
Treatment Plant) 2003 NA 7.95<br />
City of Bardwell 1990 100,000 0.252<br />
City of Bayside<br />
The original unit was<br />
installed in 1990. In<br />
2010, the City has<br />
replaced the old unit<br />
with the new one. NA 0.045<br />
City of Beckville 2004 400,000 0.216<br />
City of Brady 2005 9,000,000 3<br />
City of Clarksville City 2006 1,539,000,000 0.288<br />
City of Evant 2010 250,000 0.1<br />
City of Fort Stockton<br />
Osmosis/<strong>Desalination</strong><br />
Facility 1996 6,000,000 6.5<br />
City of Granbury<br />
1984 Original EDR<br />
Plant, 2007 - RO<br />
Plant mounted in<br />
trailer 600,000 0.462<br />
City of Hubbard 2002 NA 0.648<br />
City of Kenedy 1995 NA 2.858<br />
City of Laredo Santa<br />
Isabel R.O. 1996 NA 0.1<br />
City of Los Ybanez 1991 300,000<br />
City of Robinson 1994 6,000,000 2.3<br />
City of Seadrift 1998 1,200,000 0.61<br />
City of Seymour 2000 4,500,000 3<br />
City of Sherman 1993 NA 11<br />
City of Tatum 1999 NA 0.324<br />
Cypress <strong>Water</strong><br />
Treatment Plant 2008 NA 10<br />
Dell City 1997 NA 0.1<br />
DS <strong>Water</strong>s of America,<br />
LP 1997 NA 0.09<br />
Esperanza Fresh<br />
<strong>Water</strong> Supply 1990 NA 0.023<br />
Holiday Beach WSC 2002 450,000 0.15<br />
Plant Design Capacity<br />
(including blending)<br />
MGD
<strong>Desalination</strong> Facility<br />
Facility Start Up Year<br />
Capital Cost When<br />
the Facility was Built<br />
($)<br />
Horizon Regional MUD 2001 6,800,000 6<br />
Kay Bailey Hutchison<br />
<strong>Desalination</strong> Plant 2007 87,000,000 27.5<br />
Lake Granbury Surface<br />
<strong>Water</strong> Advanced<br />
Treatment System 2003 36,600,000 12.5<br />
Longhorn Ranch<br />
Motel 1990 34,149 0.023<br />
Midland Country Club<br />
- fairways & greens 2004 90,000 0.023<br />
North Alamo <strong>Water</strong><br />
Supply Corporation<br />
(Lasara) 2005 2,000,000 1.2<br />
North Alamo <strong>Water</strong><br />
Supply Corporation<br />
(Owassa) 2008 8,000,000 1.5<br />
North Alamo <strong>Water</strong><br />
Supply Corporation<br />
(Doolittle) 2008 NA 3.75<br />
North Cameron<br />
Regional <strong>Water</strong> Supply<br />
Corporation 2006 1,783,651 2.5<br />
Oak Trail Shores 1998 NA 1.584<br />
Possum Kingdom<br />
<strong>Water</strong> Supply<br />
Corporation 2003 NA 1<br />
River Oaks Ranch 1987 NA 0.14<br />
Southmost Regional<br />
<strong>Water</strong> Authority 2004 13,090,000 7.5<br />
Sportsmans World<br />
MUD 1984 3,500,000 0.083<br />
Study Butte Terlingua<br />
<strong>Water</strong> System 2000 1,348,000 0.14<br />
The Cliffs NA 0.25<br />
Valley MUD #2 2000 800,000 1<br />
Veolia <strong>Water</strong><br />
Treatment Plant 1992 NA 0.245<br />
<strong>Water</strong> Runner, Inc. 2001 NA 0.028<br />
Windermere <strong>Water</strong><br />
System 2003 1,500,000 2.88<br />
NOTE:<br />
NA: Not available<br />
Plant Design Capacity<br />
(including blending)<br />
MGD
5.0 Future <strong>Desalination</strong> Facilities<br />
<strong>Texas</strong> has significant future needs <strong>for</strong> additional water, a portion of which could be met through<br />
desalination. The regional water planning groups have been active in evaluating opportunities <strong>for</strong> both<br />
seawater and brackish water desalination. In the course of this study we in<strong>for</strong>mally collected<br />
in<strong>for</strong>mation about future desalination facilities in <strong>Texas</strong>. A list of these facilities is presented in Table 5-1.<br />
Table 5-1: Future desalination facilities in <strong>Texas</strong><br />
Name of the Future Facility<br />
North Alamo <strong>Water</strong> Supply<br />
Corporation (Donna) [under<br />
construction]<br />
Central <strong>Texas</strong> <strong>Water</strong> Supply<br />
Corporation<br />
Fort Hancock <strong>Water</strong> Control and<br />
Improvement District<br />
Sylvester-McCaulley <strong>Water</strong><br />
Supply Corporation<br />
Location<br />
Donna, TX<br />
Bell, TX<br />
Hudspeth, TX<br />
Fisher, TX<br />
6.0 Conclusion<br />
The desalination database was updated to keep track of the growth of desalination industry in <strong>Texas</strong>. In<br />
the past five years, brackish water desalination design capacity increased from 75 MGD to 120 MGD in<br />
the state. This staggering growth is a combined result of increased need <strong>for</strong> new water supplies, growing<br />
scarcity of freshwater sources, and the significant advances in membrane desalination technology that<br />
have resulted in lower costs to desalt water. In the future, the database will be updated periodically to<br />
monitor the progress of desalination capacities in <strong>Texas</strong>.<br />
7.0 References<br />
American Membrane Technology Association’s Membrane <strong>Water</strong> Treatment Facilities <strong>Database</strong>.<br />
Retrieved in 2010 from web site http://www.membranes-amta.org/map.html<br />
American <strong>Water</strong> Works Association (2007). Reverse osmosis and nanofiltration, manual of water supply<br />
practices M 46.<br />
Global <strong>Water</strong> Intelligence (2010). Desal Data. Retrieved in 2010 from web site<br />
http://www.desaldata.com
Lisa Henthorne (2009). <strong>Desalination</strong> – a critical element of water solutions <strong>for</strong> the 21st century. In<br />
"Drinking <strong>Water</strong> - Sources, Sanitation and Safeguarding”, published by The Swedish Research Council<br />
Formas. http://www.idadesal.org/PDF/desalination%20chapter_final.pdf<br />
<strong>Texas</strong> Commission on Environmental Quality’s <strong>Water</strong> Utility <strong>Database</strong>. Retrieved in 2010 from web site<br />
http://www10.tceq.state.tx.us/iwud<br />
<strong>Texas</strong> <strong>Water</strong> Development Board (2005). A <strong>Desalination</strong> <strong>Database</strong> <strong>for</strong> <strong>Texas</strong>. A report prepared under<br />
Contract No. 2004-483-021.<br />
<strong>Texas</strong> <strong>Water</strong> Development Board (2008) Guidance manual <strong>for</strong> brackish groundwater desalination in<br />
<strong>Texas</strong>. A report prepared under Contract No. 0604830581.<br />
<strong>Texas</strong> <strong>Water</strong> Development Board (2009). Cost of water desalination in <strong>Texas</strong>. A white paper prepared by<br />
the Innovative <strong>Water</strong> Technologies, TWDB.<br />
http://www.twdb.state.tx.us/innovativewater/desal/doc/Cost_of_<strong>Desalination</strong>_in_<strong>Texas</strong>.pdf<br />
The Dow Texan (1961, July 5). Beutel terms phone call a shocker.<br />
8.0 Acknowledgements<br />
The authors gratefully acknowledge the help from Marlo Berg of TCEQ <strong>for</strong> retrieving data from the<br />
<strong>Water</strong> Utility <strong>Database</strong> of TCEQ. The authors would also like to thank the desalination facility operators<br />
and managers who spent their valuable time <strong>for</strong> filling out the survey <strong>for</strong>ms.
(Use one <strong>for</strong>m <strong>for</strong> each plant)<br />
Appendix A: SURVEY FORM FOR DESALINATION FACILITIES<br />
Data entered on: ________________<br />
1- GENERAL INFORMATION:<br />
Plant Name and Address:<br />
Official Name:_________________________________________________________________<br />
Address: ______________________________________________________________________<br />
_____________________________________________________________________________________<br />
_______________________________________________________________________<br />
County:_______________________________________________________________________<br />
<strong>Water</strong>/Ground <strong>Water</strong> Conservation District (if applicable): ______________________________<br />
Public <strong>Water</strong> System No (if applicable): _____________________________________________<br />
Contact Name: _________________________________________________________________<br />
Contact Title: __________________________________________________________________<br />
Phone: _______________________________________________________________________<br />
Fax: _________________________________________________________________________<br />
Email: ________________________________________________________________________<br />
Web site: _____________________________________________________________________<br />
Plant Designer: _________________________________________________________________<br />
______________________________________________________________________________<br />
Contact_______________________________________________________________________<br />
Plant Owner: __________________________________________________________________<br />
______________________________________________________________________________<br />
Plant Operator: _________________________________________________________________
______________________________________________________________________________<br />
2- PLANT INFORMATION:<br />
Plant status in the past few months: Operating; Idle since ______; Closed since _______<br />
Year of plant start-up:__________________<br />
Is desalination unit start-up year different? No Yes :______________<br />
Cost of desalination plant when it was built:________________<br />
Plant Category (check all that applies):<br />
Drinking water production; Waste water treatment; Landfill leachate treatment<br />
Industrial: Power; Electronics; Beverage; Pharma.; Chemical; Other:______<br />
Other:_________________________________________________________________<br />
Plant Capacity<br />
Design plant capacity including bypass (MGD): _________________________________<br />
Permitted plant production including bypass (MGD): _____________________________<br />
Average plant production including bypass (MGD): ______________________________<br />
Strong seasonal variation in production (>25%)?: No Yes<br />
Process Type (check all that applies):<br />
RO (Reverse Osmosis) EDR (Electrodialysis Reversal) ED (Electrodialysis)<br />
NF (Nanofiltration)<br />
ME (Multi-effect Evaporation)<br />
MSF (Multi-Stage Flash) VC (Vapor Compression) Other:_________________<br />
<strong>Desalination</strong> Unit Capacity<br />
Same as plant capacity, there is no blending<br />
Blend water source: same as membrane feed water; other:________________<br />
Design production (MGD): _________________________________________
Permitted production (MGD): _______________________________________<br />
Average production (MGD): ____________________________________<br />
Average concentrate production (MGD): ______________________________________<br />
Power Source: Grid; Collocation; Generated on site; Other:________________________<br />
Reasons <strong>for</strong> building desalination plant (check all that apply):<br />
High TDS<br />
High hardness High alkalinity High chloride<br />
High sodium High sulfate High nitrate High arsenic<br />
High radionuclides High fluoride High Fe/Mn Other:__________<br />
Is an expansion of the plant being considered? No Yes<br />
3- RAW WATER SUPPLY SOURCE:<br />
Ground water; Surface water; Reclaimed water; Seawater; Other:__________<br />
Average/Range of TDS of the membrane feed water:_____________<br />
Is turbidity an operational problem? No Yes: ___NTU;____SDI<br />
Are the following operational problems present?<br />
Fe/Mn H 2 S Organic matter/TOC Variability in raw water composition<br />
Distance from supply source to plant:_______________________________________________<br />
If ground water:<br />
Well field location:_____________ Withdrawal zone:______________________<br />
Screened interval: ________ ft to ________ft below land surface<br />
If surface/sea water, intake location: ___________<br />
If reclaimed water, water source___________<br />
4- PRETREATMENT OF DESALINATION UNIT FEED<br />
Filtration (check all that apply):
Gravity filter Media filter Bag filter<br />
Cartridge filter. Manufacturer if applicable:___________________________________<br />
Membrane (MF/UF). Manufacturer if applicable:_______________________________<br />
Other___________<br />
Coagulation/flocculation: No Yes<br />
Alum Ferric chloride Ferric sulfate Polymer Other:_____________<br />
Clarification: No Yes<br />
Oxidation: No Yes Why?______________________________________________________<br />
Aeration; K permanganate; Green sand; same as disinfection; Other__________<br />
Softening: No Yes<br />
Lime addition Membrane (NF)<br />
Ion exchange<br />
<br />
<br />
<br />
<br />
Disinfection: No Yes<br />
Chlorination/chloramination Ozonation UV Other<br />
Dechlorination: No Yes<br />
Activated carbon: No Yes: to remove______________<br />
pH adjustement: No Yes<br />
Acidification: what pH?:__ Addition of caustic?: what pH?:___<br />
Scaling control: No Yes.<br />
5- MEMBRANE INFORMATION:<br />
No membrane, go to Section 6<br />
Manufacturer/Model of membrane elements:__________________________________________<br />
Years in service: _____________years<br />
Feed pressure: _________________psi<br />
Membrane recovery: _____________%<br />
Target TDS of the final permeate:___________________mg/L<br />
Problems encountered:
Scaling: calcite; gypsum; silica; Metal oxide/sulphides;<br />
colloidal fouling:<br />
other:_________________<br />
don’t know nature of scales<br />
biological fouling<br />
Membrane replacement frequency:<br />
never been changed<br />
> 2 and ≤ 4 years<br />
> 6 years:____________<br />
≤ 2 years<br />
> 4 and ≤ 6 years<br />
Other:___________<br />
<br />
<br />
<br />
Current membrane cleaning frequency:<br />
monthly; bimonthly; quarterly; semi-annually; annually<br />
every 2 years; other:______________<br />
Membrane cleaning triggered by:<br />
Decreased production; Increased pressure; Time elapsed: _________hours<br />
Disposal method of cleaning waste:<br />
Mixed with concentrate<br />
Hauled from the site<br />
Sewer, Waste water treatment plant<br />
other:______________<br />
Average TDS of the concentrate:________________<br />
<br />
<br />
<br />
<br />
6- POSTTREATMENT OF THROUGHPUT<br />
No posttreatment be<strong>for</strong>e distribution, go to Section 7<br />
Activated carbon Adjustment of pH Adjustment of alkalinity Aeration<br />
Blending Corrosion control Disinfection Fluoridation<br />
Gas removal Ion exchange Other:___________________<br />
7- POSTTREATMENT OF CONCENTRATE<br />
No posttreatment of concentrate, go to Section 8
Adjustment of pH Aeration Blending Corrosion control Dechlorination<br />
Disinfection Gas removal Scaling control Other:_________________<br />
8- CONCENTRATE DISPOSAL<br />
Co-disposal with neighboring facility No Yes<br />
Disposal well:<br />
Distance to well:____________________________<br />
Permit type: Class I Class II Class V<br />
Surface water body:_____________<br />
Permit type: TPDES<br />
Distance to water body_______________________<br />
Other: ___________<br />
Land application: on-site waste water (i.e., septic) irrigation water<br />
Sanitary sewer, waste water treatment plant name:____________________________________<br />
Evaporation pond. Ultimate fate of dry residue:______________________________________<br />
Zero-discharge<br />
9- PROBLEMS<br />
Chemicals: ___________________________________________________________________<br />
______________________________________________________________________________<br />
Disposal of concentrate: ________________________________________________________<br />
______________________________________________________________________________<br />
Electronics: __________________________________________________________________<br />
______________________________________________________________________________<br />
Feed water: __________________________________________________________________<br />
______________________________________________________________________________<br />
Membrane: __________________________________________________________________<br />
______________________________________________________________________________<br />
Operating costs: ______________________________________________________________
______________________________________________________________________________<br />
Permitting: ___________________________________________________________________<br />
______________________________________________________________________________<br />
Posttreatment of concentrate: ____________________________________________________<br />
______________________________________________________________________________<br />
Posttreatment of permeate: ______________________________________________________<br />
______________________________________________________________________________<br />
Pretreatment: _________________________________________________________________<br />
______________________________________________________________________________<br />
Pump/Valves: ________________________________________________________________<br />
______________________________________________________________________________<br />
Well/Intake: __________________________________________________________________<br />
______________________________________________________________________________<br />
10- COST ISSUES<br />
Average rate/cost of power as of 2008 if applicable:<br />
Not available 1¢ and ≤3¢ /kWh<br />
>3¢ and ≤5¢ /kWh >5¢ and ≤10¢ /kWh >10¢ /kWh<br />
Average cost of water production:__________________________________________________<br />
Average cost of desalinated water production:_________________________________________<br />
Operation and Maintenance costs:<br />
Not available<br />
Feed water cost __________________________________________________________<br />
Labor cost _______________________________________________________________<br />
Membrane replacement cost ________________________________________________
Chemical cost ____________________________________________________________<br />
Energy cost ______________________________________________________________<br />
Concentrate disposal cost ___________________________________________________