Download - APEDA Agriexchange
Download - APEDA Agriexchange
Download - APEDA Agriexchange

You also want an ePaper? Increase the reach of your titles
YUMPU automatically turns print PDFs into web optimized ePapers that Google loves.
Chapter - VI<br />
INDIAN PRODUCTION, TRADE SCENARIO<br />
AND<br />
EXPORT POTENTIAL<br />
The trade in fruits and vegetables has become increasingly globalize. This has been<br />
possible because of advanced technology, changing consumer preferences and year<br />
round supply. As a result, large volumes of fruits and vegetables move from one continent<br />
to another, reducing seasonality of produce markets. Also multiple, regional and bilateral<br />
trade agreements and reduction of tariff barriers as a result of WTO negotiations, have<br />
further boosted the trade and access to markets, thus providing consumers with an<br />
expanding array of fruits and vegetables.<br />
This chapter speaks of the extent of production of specific crops/products, pattern of trade,<br />
availability against demand, future production potential and export opportunities along with<br />
global scenario.<br />
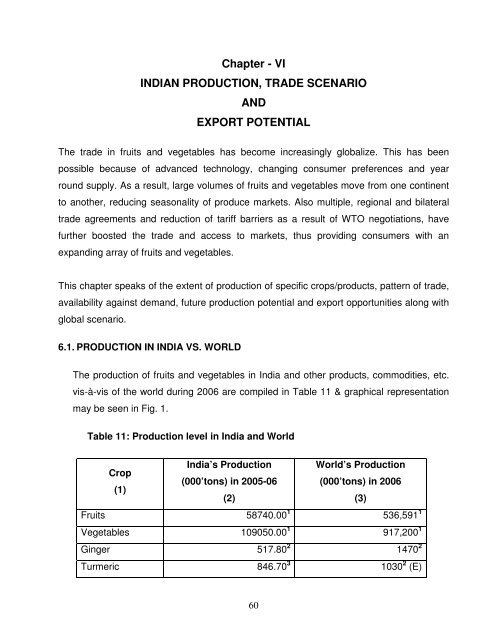
6.1. PRODUCTION IN INDIA VS. WORLD<br />
The production of fruits and vegetables in India and other products, commodities, etc.<br />
vis-à-vis of the world during 2006 are compiled in Table 11 & graphical representation<br />
may be seen in Fig. 1.<br />
Table 11: Production level in India and World<br />
India’s Production World’s Production<br />
Crop<br />
(000’tons) in 2005-06 (000’tons) in 2006<br />
(1)<br />
(2)<br />
(3)<br />
Fruits 58740.00 1 536,591 1<br />
Vegetables 109050.00 1 917,200 1<br />
Ginger 517.80 2 1470 2<br />
Turmeric 846.70 3 1030 2 (E)<br />
60
(1) (2) (3)<br />
Sesame 641.00 2 3380 2<br />
Soyameal 5280.00 4 145862 4<br />
Cotton 4148.05 5 24750 5<br />
Total 179,223.60 1630,283<br />
E = Estimate<br />
1 Production in India & World –NHB database<br />
2<br />
Production www.faostat.fao.org<br />
3 Production www.indianspices.com<br />
4 SOPA, Indore www.sopa.org data for 2006-07<br />
5 CCI, Mumbai.<br />
Total production in India during 2005-06 is 179,223 thousand tons compared to world<br />
production of 1,630,283 thousand tons in 2006. The production in India of above<br />
crops/products is 10.9% of total world production.<br />
Production Status of India in comparison to World<br />
1000000<br />
Production Quantity (000'<br />
tons)<br />
900000<br />
800000<br />
700000<br />
600000<br />
500000<br />
400000<br />
300000<br />
200000<br />
100000<br />
0<br />
Fruits<br />
Vegetables<br />
Ginger<br />
Turmeric<br />
Sesame<br />
Soyameal<br />
Cotton<br />
INDIA<br />
WORLD<br />
Fig. 1<br />
61
6.2. TRADING PATTERN IN INDIA COMPARED TO WORLD<br />
Values of export of crops and products during 2006-07 from India and from world<br />
during 2006 are presented in Table 12. This table shows that India exports worth 2.855<br />
billion US dollars compared to world export value of 113.9 billion US dollars. The<br />
exports from India are only 2.5% of total world export value. This is quite low as India<br />
produces 10.9% of total world production of fruits, vegetables and other products. This<br />
is not at all encouraging as India is the maximum producer of ginger, turmeric and<br />
sesame seeds in the world, second largest producer of fruits, vegetables and cotton. A<br />
graphical comparison of export in India to that of the World is depicted in Fig. 2<br />
Table 12: Indian exports compared to world (Year 2006-07)<br />
India’s Export (Value) World’s Export<br />
Crop Value in Lakh Value in (Value 6 in thousand $<br />
Rupees thousand $ US<br />
US)<br />
Fruits 70028 1 155617.77 1 52399634<br />
Vegetables 159323 1 354051.11 1 38095130<br />
Ginger 3975 2 8833.33 2 256575<br />
Turmeric 16480 2 36622.22 2 54122<br />
Sesame 93271 3 207268.88 3 900536<br />
Soyameal 407012 4 904471.11 4 11390150<br />
Cotton 535109 5 1189131.11 5 10849910<br />
Total<br />
1285198 2855995.42<br />
(or 2.855<br />
billion $ US)<br />
113941051<br />
(or 113.9 billion $ US)<br />
1 <strong>APEDA</strong> database<br />
2 Export www.indianspices.com<br />
3<br />
Export www.trademap.com<br />
4 SOPA, Indore www.sopa.org<br />
5 CCI, Mumbai<br />
6 www.comtrade.org<br />
62
Export of India in comparision to World<br />
60000000<br />
Export in Value (000'US $)<br />
50000000<br />
40000000<br />
30000000<br />
20000000<br />
10000000<br />
0<br />
Fruits<br />
Vegetables<br />
Ginger<br />
Turmeric<br />
Sesame<br />
Soyameal<br />
Cotton<br />
WORLD<br />
INDIA<br />
Fig. 2<br />
6.3. AVAILABILITY OF VARIOUS COMMODITIES FOR DOMESTIC CONSUMPTION<br />
AGAINST DEMAND<br />
The availability of soyameal, sesame and cotton in India is in surplus quantities and<br />
that is why the exports are substantial of these commodities amounting to 79%, 36%<br />
and 24% respectively of production. However, in case of fruits and vegetables, with<br />
total production of 58.7 and 109 million tons respectively during 2005-06, only 98 gms<br />
of fruits and 201 gms of vegetables per day per person are available against norms of<br />
ICMR of 120 gms of fruits and 280 gms of vegetables.<br />
6.4. PROJECTION OF PRODUCTION OF FRUITS AND VEGETABLES AT<br />
THE END OF XI PLAN<br />
Taking serious concern of shortfall in production of fruits and vegetables, Govt. of India<br />
launched Technology Mission for Integrated Development of Horticulture in North East<br />
and Himalayan states and National Horticulture Mission for all other states. The main<br />
63
objective is to double the production of fruits from a level of 43 million tons in 2001-02<br />
to 85 million tons in 2011-12 and vegetables from a level of 88 million tons in 2001-02<br />
to 160.0 million tons in 2011-12. This is expected to be achieved with expansion of area<br />
with better varieties, better cultivation practices and increasing productivity of existing<br />
area under fruits and vegetables.<br />
With the envisaged production of 85 million tons of fruits and 160 million tons of<br />
vegetables at the end of XI plan (i.e 2011-12); it will be possible to provide minimum<br />
recommended quantities of fruits (120 gms) and vegetables (280 gms) per person per<br />
day. These minimum domestic requirements are achievable even with 15-20% of<br />
production as post harvest losses and enough provision for export.<br />
6.5. EXPORT POTENTIAL<br />
With the anticipated production of 85 million tons of fruits and 160 million tons of<br />
vegetables, it is estimated that there will be surplus to the tune of approx 3-4 million<br />
tons of fruits and approximately 7-8 million tons of vegetables at the end of 2011-12,<br />
India has exported only 0.32 million tons of fruits and 1.6 million tons of vegetables<br />
during 2006-07.This shows there is an ample scope of accelerating the exports of fruits<br />
and vegetables.<br />
It is also expected that as a result of special measures taken up like, Technology<br />
Mission for cotton and integrated development programmes for soyabean, oilseeds,<br />
etc. the production of crops like spices, sesame, soyabean and cotton, is expected to<br />
increase to a level of 9.5 to10 million tons in case of spices, 0.85 to 0.9 million tons in<br />
case of sesame, 8.7 to 9.0 million tons of soyameal and 5.0 to 5.5 million tons of cotton<br />
at the end of 2011-12. With the rise in production of fruits, vegetables and other<br />
products, there is a great scope/opportunity for exporting the above commodities in<br />
larger quantities.<br />
The export potential of various crops/commodities has been analyzed is based on<br />
report on International Market Research conducted in importing countries i.e. EU, GCC,<br />
64
ASEAN, Australia, Korea, China, U.S.A, etc., import analysis comprising export data of<br />
countries competing with India, prices realized by other exporting countries, etc. As far<br />
as exports from India are concerned information from <strong>APEDA</strong> database has been used.<br />
Export potential of the commodities analyzed is discussed at length in the following<br />
pages:<br />
A. MANGO<br />
India is the largest producer of mango in the world. The production of mango during<br />
2005-06 was reported to be 12,537.9 thousand tons (Details are given in crop<br />
profiles, Volume – II Domestic Market Research, Chapter 2).<br />
♦ Export trend<br />
Export of mango has shown a phenomenal growth as its export amount has<br />
increased from 38,003 tons in 2002-2003 to 79,060 tons 2006-2007 indicating a rise<br />
of 107% in the last five years. (Table 13 & Fig. 3).<br />
As per <strong>APEDA</strong> database of 2006-2007, major portion of exports (50,942 tons) is to<br />
SAARC countries and only 24,545 tons have been exported to GCC countries. For<br />
EU countries only 2658 tons has been exported. India has all the facilities to meet<br />
the requirements of various importing countries.<br />
Table 13: Export of mango for last five years<br />
Year Quantity(tons) Value (in Rs. Lakh )<br />
2002-2003 38003 8419.4<br />
2003-2004 60551 11051.9<br />
2004-2005 53480 8961.0<br />
2005-2006 69606 12811.1<br />
2006-2007 79060 14193.9<br />
65
Export of mango for last five years<br />
80000<br />
70000<br />
Quantity in tons<br />
60000<br />
50000<br />
40000<br />
30000<br />
20000<br />
10000<br />
0<br />
2002-2003<br />
2003-2004<br />
2004-2005<br />
2005-2006<br />
2006-2007<br />
Years<br />
Fig. 3<br />
Looking in to the Global demand the potential of exports is much higher. The details of<br />
existing level of export and opportunities of exports in different regions are discussed<br />
as below:<br />
(i) GCC Countries<br />
GCC countries imported 1, 44,042 tons during 2006 and there is 15% increase in<br />
demand from the year 2003 (Comtrade database). India exported only 24,545 tons<br />
to GCC countries as per <strong>APEDA</strong> data during 2006-2007. However, there is<br />
tremendous scope for expanding exports to these countries, as India produces<br />
finest quality mangoes.<br />
As per data given in Table 14, imports of mango by GCC countries are substantial;<br />
however, our contribution in Saudi Arabia, Oman, Kuwait and other markets in GCC<br />
is negligible and there is need to accelerate the process.<br />
66
Table 14: Import/Export of mangoes in GCC countries (year 2006)<br />
S.No. Countries Total Import<br />
(in tons)<br />
Export by India<br />
(in tons)<br />
1 UAE 63519 22045<br />
2 Saudi Arabia 48330 1323<br />
3 Oman 16438 170<br />
4 Kuwait 8900 428<br />
5 Bahrain 3617 489<br />
6 Qatar 3238 90<br />
Source: Comtrade Database, 2006 & <strong>APEDA</strong><br />
India's exports reduce significantly during May onwards because of competition<br />
from Pakistan. Efforts are required to increase production & productivity to explore<br />
better opportunities to export. Further facilities like reefer containers, growing of<br />
demand based varieties like Kesar and other popular types will improve the export<br />
scenario in India.<br />
(ii) EU countries<br />
EU countries import mangoes varying from 2, 50,000 tons to 3, 00,000 tons every<br />
year. There is 31% increase in demand from the year 2003. However, during 2006-<br />
07, only 2519 tons were exported from India. Out of this amount, maximum quantity<br />
was exported to UK (1883 tons). India is not able to penetrate other EU countries in<br />
a significant way. The growth of export to EU countries is almost negligible. The<br />
main reason for the absence of upsurge of export of mangoes to EU is the supply of<br />
mangoes by countries like Brazil, Peru, and Israel at cheaper rates. The EU markets<br />
also prefer coloured mangoes. Consumers at times pay higher price for these<br />
coloured mangoes. Even superior edible quality of Indian mangoes does not get<br />
much attention in the presence of coloured mangoes like Tommy Atkins, Kent and<br />
Haden.<br />
67
Therefore, India must explore production and export of coloured mangoes like Arka<br />
Anmol, Arka Puneet, Pusa Arunima, Ambika, etc.<br />
(iii) ASEAN countries<br />
ASEAN countries are importing mangoes to the tune of 50,327tons (2006).<br />
However, exports from India to ASEAN countries are very little which may be seen<br />
from Table 15. Thailand is supplying mangoes at much cheaper price to Malaysia<br />
and Singapore for which it has captured a larger share.<br />
Table 15: Import/Export of mangoes in ASEAN countries (year 2006)<br />
S.No. Countries Total Import<br />
(in tons)<br />
Export by India<br />
(in tons)<br />
1 ASEAN 50327 582<br />
2 Malaysia 23521 332<br />
3 Singapore 16027 230<br />
4 Vietnam 7212 20<br />
Source: Comtrade Database, 2006 & <strong>APEDA</strong><br />
Therefore, the strategy for India should be to make available much cheaper<br />
mangoes like Totapuri (Banglora) in Malaysian market on one hand and campaign<br />
for quality and having red blush varieties like Suvarnrekha, Kesar and Alphonso<br />
varieties on the other hand for Singapore market. For competing with Thailand,<br />
Totapuri (Banglora) variety requires to be exported from Eastern Port of Andhra<br />
Pradesh to save logistic costs. Simultaneously India must reduce the cost of<br />
production by increasing the productivity by high density plantations, group farming,<br />
etc.<br />
(iv)<br />
Hong Kong<br />
Hong Kong is an established centre for trade for fruits and vegetables. It imported<br />
up to 42,422 tons and exported 19,988 tons of mangoes during the year 2006. The<br />
68
prices prevailing in Hong Kong market are also quite high. However, India has<br />
exported only 49 tons during 2006.Therefore; concerted campaign needs to be<br />
launched for our quality mangoes in this market.<br />
(v) Pacific Rim countries and China<br />
Pacific Rim countries comprise Australia, Japan, Korea, etc. and potential for<br />
exports of mangoes to these countries is given below:<br />
(a) Australia<br />
Australia imported only 810 tons during 2006. However, Australia has very strict<br />
regulations for entry of Indian mangoes in their country.<br />
Australia has put mangoes from India under Import Risk Analysis (IRA). By this,<br />
Australia is to identify and classify potential quarantine risks and develop policies<br />
to manage them. Provisional IRA has been released, but still, one cannot export<br />
mangoes to Australia, till it is totally finalized.<br />
At present Indo-Australian agreement is under negotiation, and export of<br />
mangoes is expected to be covered in the agreement. As India has already<br />
standardized irradiation treatment of mango before shipping for eliminating fruit<br />
fly, the risk has been minimized to a great extent to fulfill the import requirements.<br />
(b) South Korea<br />
South Korea has imported 1235 tons of mangoes during 2006. At present South<br />
Korea has high duties on imported mangoes, however, India is likely to finalize<br />
Free Trade Agreement with Korea soon and it is expected that export of mangoes<br />
to South Korea may commence thereafter.<br />
(c) Japan<br />
According to comtrade database, Japan imported 12,586 tons of mangoes in<br />
2006. Japan has a requirement of Vapour Heat Treatment (VHT) for eliminating<br />
fruit fly. India has already established facilities for VHT treatment and exported 74<br />
69
tons during 2006. There is still good opportunity for accelerating export of<br />
mangoes to Japan.<br />
(d) China<br />
China has imposed moderate import duties on import of mangoes under Asia<br />
Pacific Trade Agreement. Some amount of mangoes has already been exported<br />
to China. There is good scope of exporting mangoes to China, as it imported to<br />
the tune of 23,763 tons during 2006 (Comtrade database).<br />
(e) U.S.A and Canada<br />
According to Comtrade database, USA imported 2, 98,088 tons of mangoes and<br />
Canada imported 42,161 tons during the year 2006. There was no export of<br />
mangoes to U.S.A during 2006 from India and only 75 tons were exported to<br />
Canada during the year 2006.<br />
Now India has signed MOU with USA for export of mangoes since India has<br />
created irradiation facilities at a number of locations. Both U.S.A. and Canada<br />
require irradiation of mangoes before export.<br />
B. GRAPES<br />
Production of grapes in India during 2005-06 is 1630.7 thousand tons (Details are<br />
available in crop profile, Volume – II Domestic Market Research, Chapter 3).<br />
♦<br />
Export trend<br />
There is a phenomenal rise in export of grapes from India. As per the data published<br />
by <strong>APEDA</strong>, India has exported only 25,567 tons during 2002-2003 which has<br />
increased to 85,562 tons in 2006-2007.This, increase has been observed mainly in<br />
the last 2-3 years, because India was able to minimize the pesticide residues in the<br />
grapes to meet the requirements of EU countries.<br />
(Table 16 & Fig .4)<br />
70
Table 16: Exports of grapes from India<br />
Years Quantity (tons) Value (in Rs. Lakh)<br />
2002-2003 25567 10867.1<br />
2003-2004 26469 10368.3<br />
2004-2005 38898 12643.7<br />
2005-2006 53908 21382.8<br />
2006-2007 85562 30058.4<br />
Export of grapes for last five years<br />
90000<br />
80000<br />
Quantity (tons)<br />
70000<br />
60000<br />
50000<br />
40000<br />
30000<br />
20000<br />
10000<br />
0<br />
2002-2003<br />
2003-2004<br />
2004-2005<br />
2005-2006<br />
2006-2007<br />
Years<br />
Fig. 4<br />
Export potential of grapes to different countries/regions is discussed below:<br />
(i) GCC Countries<br />
As per <strong>APEDA</strong> database, the export of grapes from India to various countries is<br />
shown below in Table 17.<br />
71
Table 17: Import/Export of grapes in GCC countries (year 2006)<br />
S.No. Countries Total Import<br />
(in tons)<br />
Export by India<br />
(in tons)<br />
1 GCC 64170 9677<br />
2 UAE 21240 8140<br />
3 Saudi Arabia 31853 1115<br />
Source: Comtrade database, 2006 & <strong>APEDA</strong><br />
The data shows that our exports of grapes to various countries were negligible.<br />
Main competition of India is with South Africa and Chile. The quality of Indian<br />
grapes is good and by offering at competitive prices, it should not be difficult to<br />
accelerate exports of grapes to the tune of 40,000 to 50,000 tons to GCC countries<br />
in next 4-5 years.<br />
(ii) European Union<br />
Exports of grapes from India were maximum to European Union during 2006-2007.<br />
As much as 34,186 tons were exported during the year. Largest importers were<br />
Netherlands (19,020 tons) and UK (13,579 tons). India produces grapes mainly<br />
during January to April months, where as countries like U.S.A, Argentina, Italy,<br />
Spain, etc. produce grapes during September to December months. Our<br />
competition is mainly with countries like South Africa, Chile and Israel who also<br />
supply grapes in the same period. These countries have exported up to 3, 42,896<br />
tons during 2006 to the countries namely U.K, Netherlands, France, Belgium, Italy<br />
and Spain.<br />
Since India is meeting quality requirements including pesticide residue levels of all<br />
the importing countries in EU and supplying grapes at competitive prices. There is<br />
every possibility to penetrate in the markets of Belgium, Germany, Spain,<br />
Netherlands and UK targeting export of 60,000 to 70,000 tons in the next 4-5 years.<br />
72
(iii) Russia and Ukraine<br />
India should also explore the possibility of export of grapes to Russian Federation<br />
and Ukraine which import as much as 3, 20,677 tons and 55,168 tons respectively.<br />
Concerted attention needs to be paid for exporting grapes to these countries.<br />
(iv) ASEAN countries<br />
ASEAN countries import grapes to the tune of 1, 05,000 tons. The demand for<br />
grapes has increased by 50% from the year 2003. The main importers are<br />
Indonesia (26,366 tons), Philippines (14,748 tons), Singapore (12,166 tons) and<br />
Vietnam (11,025 tons).<br />
Main competitors with India for export of grapes to these countries are U.S.A,<br />
Australia, China and South Africa. Out of total quantity of 1,05,000 tons, approx<br />
40,000-50,000 tons are supplied by U.S.A , 17,000 - 20,000 tons by Australia and<br />
10,000- 11,000 tons by China and South Africa each. However, supplies from U.S.A<br />
and China are during September to December months and thus India’s competition<br />
is with South Africa and Australia. India can easily compete with these countries, as<br />
location wise India is closer to ASEAN countries compared to South Africa.<br />
Moreover, India is supplying grapes at competitive prices.<br />
India has exported only 196 tons to Malaysia, 93 tons to Singapore, 78 tons to<br />
Thailand, 34 tons to Indonesia and 13 tons Vietnam during 2006. These export<br />
volumes are negligible compared to the existing potential. Moreover because of free<br />
trade agreements with Thailand and Singapore, exports of grapes are likely to<br />
accelerate. Export can be boosted in Malaysia, Philippines and Indonesia as well as<br />
the import duties are only of the order of 5-7% in these countries. Thus, in next 4-5<br />
years time, India may aim to achieve a target of export of 10,000-15,000 tons<br />
considering the quality production and meeting of International standards. India<br />
needs to devise a proper marketing strategy and campaign aggressively to nurture<br />
these markets.<br />
73
(v) Hong Kong<br />
Hong Kong is a trade hub and imported up to 91,517 tons and exported up to<br />
46,868 tons during 2006. However, India exported only 156 tons during 2006.There<br />
is excellent potential and strategies need to be worked out to capture a larger share<br />
in this market.<br />
(vi) Pacific Rim countries and China<br />
Pacific Rim countries comprising South Korea, Japan and Australia are also<br />
importing grapes to the extent of 17,291, 9949 and 4759 tons, respectively. At<br />
present India is not exporting any quantity of grapes to these countries.<br />
It is expected that while finalizing Free Trade Agreement with South Korea, export of<br />
grapes will also be included. The export of grape to China should be explored as<br />
China has imported 46,021 tons of grapes during 2006. India and China are<br />
participants in Asia Pacific Trade Agreement which gives a scope for such<br />
opportunities.<br />
C. POMEGRANATE<br />
India produces pomegranates to the tune of 849 thousand tons a year (see details in<br />
crop profile, Volume – II Domestic Market Research, Chapter 4).<br />
♦ Export Trend<br />
India is largest producer of pomegranates in the world and produces finest edible<br />
quality pomegranates which are available almost throughout the year.<br />
Although export of pomegranate from India has upsurge by more than 300% from 6303<br />
tons in 2002-2003 to 21,670 tons in 2006-2007 (Table18 & Fig. 5), yet there is still<br />
tremendous potential for exports of pomegranate. This is evident from the fact that<br />
Spain exports about 75% of its estimated production of 1, 20,000 tons, Iran exports<br />
about 20% of its estimated production of 1,20,000 tons whereas India exports only<br />
2.55% (21,670 tons) of its total production of 8,49,100 tons<br />
74
Table 18: Export of pomegranates in the last five years<br />
Years Quantity (tons) Value (in Rs. Lakh)<br />
2002-2003 6303 1434.5<br />
2003-2004 10315 2109.0<br />
2004-2005 14039 2988.7<br />
2005-2006 19652 5670.0<br />
2006-2007 21670 7957.3<br />
Export of pomegranates in last five years<br />
25000<br />
Quantity in tons<br />
20000<br />
15000<br />
10000<br />
5000<br />
0<br />
2002-2003<br />
2003-2004<br />
2004-2005<br />
2005-2006<br />
2006-2007<br />
Year<br />
♦<br />
Export Potential<br />
Fig. 5<br />
There is great opportunity for increasing the export of pomegranates to different<br />
countries as discussed below:<br />
(i) GCC Countries<br />
India exported only 11,924 tons of pomegranates to Gulf countries during 2006-<br />
2007. Although, no data is available on exact quantity of imports from other<br />
75
countries like Spain and Iran, however, because of nearness, Iran and Lebanon are<br />
the main suppliers of pomegranates to Gulf countries. Supplies from Iran and<br />
Lebanon are from September to December and start declining from January<br />
onwards. However, in India, production of pomegranate is at peak from December<br />
to March and continues up to April - June with the production of Hast Bahar and<br />
Ambe Bahar crops. Thus, India can further explore the opportunity of exporting<br />
pomegranate to Gulf countries from January to June with least competition from Iran<br />
and other countries.<br />
(ii) European Union<br />
Export of pomegranate from India to EU including Russia was 4011 tons during<br />
2005-2006 and 6342 tons during 2006-2007 as per <strong>APEDA</strong> database. In EU<br />
countries, Spain is the main supplier of pomegranate during September to<br />
December which starts tapering from January onwards.<br />
India with the arrival of Hast Bahar and Ambe Bahar crops can supply from<br />
January onwards to July and can dominate the market without much competition<br />
from Chile, Peru, etc. whose production is very low as compared to India.<br />
(iii) ASEAN Countries<br />
Indian pomegranates are slowly finding market in ASEAN countries as there were<br />
exports of 125 tons to Malaysia, 89 tons to Singapore, 36 tons to Thailand and 17<br />
tons to Indonesia during 2006-07.However, aggressive campaign about its<br />
therapeutical properties needs to be made by holding fruit shows/exhibitions in<br />
these countries and signing of Trade Agreements.<br />
(iv) Pacific Rim countries and China<br />
Exports to these countries are very negligible as only 40 tons were exported to<br />
Japan and 36 tons to China during 2006-07. These countries need to be further<br />
explored. If there is requirement of irradiation for eliminating fruit fly, this can also<br />
be done; as such facilities for same have been created in India.<br />
76
(v) U.S.A. and Canada<br />
India exported 275 tons of pomegranates to Canada and 46 tons to U.S.A. during<br />
2006. Exports of pomegranates to these countries should be further explored.<br />
D. LITCHI<br />
India is the largest producer of litchi in the world. It produced 381.4 thousand tons<br />
during 2005-06. (Details are given in crop profile, Volume – II Domestic Market<br />
Research, Chapter 6).<br />
♦<br />
Export trend<br />
Export of litchi has increased from 347 tons in 2002-03 to 1661 tons in 2006-07<br />
(<strong>APEDA</strong> database). Major amount of these exports i.e 1642 tons were to SAARC<br />
countries and only 17 tons were sent to UAE. (Table 19 & Fig. 6).<br />
Table 19: Export of litchi in the last five years<br />
Years Quantity (tons) Value (in Rs. Lakh )<br />
2002-2003 347 100.2<br />
2003-2004 962 133.9<br />
2004-2005 544 70.8<br />
2005-2006 718 93.6<br />
2006-2007 1661 164.3<br />
77
Export of litchi in last five years<br />
1800<br />
1600<br />
1400<br />
Quantity in tons<br />
1200<br />
1000<br />
800<br />
600<br />
400<br />
200<br />
0<br />
2002-2003<br />
2003-2004<br />
2004-2005<br />
2005-2006<br />
2006-2007<br />
Years<br />
Fig. 6<br />
As per the data of 2005-06, virtually there were no exports to Gulf countries. For both<br />
the years, 2005-06 and 2006-07 there were no exports to European countries too.<br />
However during 2003-04, 140 tons of litchis were exported to Belgium, 64 tons to UK<br />
and 34 tons to Netherlands. This shows that the exports to EU have declined inspite of<br />
the fact that the Indian litchi is available 2-3 weeks ahead of Thai litchi and 4-5 weeks<br />
ahead of Chinese litchi.<br />
The potential for export of litchi is discussed in the following paras:<br />
(i) GCC countries<br />
Gulf countries imported litchi during 2006 up to 45,545 tons (Comtrade database). As<br />
per this database, India exported litchi to GCC countries to the tune of 16,410 tons,<br />
however <strong>APEDA</strong> database depicts no export of litchi during 2005-06 and 2006-07 to<br />
Gulf countries.<br />
Nevertheless, there is excellent potential for export of litchi to GCC countries, as India<br />
produces finest quality litchis. Litchis in India are available from 15 th April (Tripura)<br />
onwards up to third week of June (Gurdaspur, Punjab). India is supplying litchis to GCC<br />
countries at competitive prices and is also nearer to Gulf countries compared to<br />
Thailand and China.<br />
78
(ii) EU countries<br />
EU countries imported sizeable quantities of litchi during 2006. However, inspite of<br />
excellent potential for exports and even nearness to EU countries, compared to<br />
Thailand and China, India has not been able to avail visible gains. The potential needs<br />
to be exploited by aggressive marketing and supplying better quality litchi.<br />
E. PINEAPPLE<br />
Production of pineapple during 2005-06 was 1353.1 thousand tons (Details see crop<br />
profile, Volume – II Domestic Market Research, Chapter 5)<br />
♦<br />
Export trend<br />
Export of pineapples has significantly increased in last few years; however, the total<br />
quantity exported is negligible. Increase in exports has taken place from 717 tons in<br />
2002-03 to 3785 tons in 2006-07 (Table 20 & Fig. 7). However, export, has decreased<br />
from 4407 tons in 2005-06 to 3785 tons in 2006-07.<br />
Table 20: Export of pineapple for last five years<br />
Year Quantity(tons) Value(in Rs. Lakh)<br />
2002-2003 717 142.2<br />
2003-2004 1623 201.7<br />
2004-2005 1765 245.1<br />
2005-2006 4407 515.4<br />
2006-2007 3785 360.9<br />
79
Export of pineapples in last five years<br />
4500<br />
4000<br />
Quantity in tons<br />
3500<br />
3000<br />
2500<br />
2000<br />
1500<br />
1000<br />
500<br />
0<br />
2002-2003<br />
2003-2004<br />
2004-2005<br />
2005-2006<br />
2006-2007<br />
Years<br />
Fig. 7<br />
The export potential of pineapple is discussed region wise as under:<br />
(i) GCC Countries<br />
GCC countries have imported 17,888 tons of pineapples during 2006. The increase<br />
in demand is only 12% over the year 2003 (Comtrade database). Total imports by<br />
GCC countries are given below in Table 21 along with India’s exports as per<br />
<strong>APEDA</strong> database during 2006-07.<br />
Table 21: Import/Export of pineapples in GCC countries (year 2006)<br />
S.No. Countries Total Import<br />
(in tons)<br />
Export by India<br />
(in tons)<br />
1 UAE 8345 559<br />
2 Saudi Arabia 3581 107<br />
3 Oman 2758 42<br />
4 Kuwait 2054 32<br />
Source: Comtrade database, 2006 & <strong>APEDA</strong><br />
80
India’s exports of pineapples are negligible and have actually declined during 2006-<br />
07 compared to previous year. India is at advantage being nearer to GCC countries<br />
compared to Philippines and Thailand. It can easily compete with them by<br />
upgrading quality and creating infrastructure for post-harvest handling of<br />
pineapples. Philippines, especially is better organized because companies like Dole<br />
and Delmonte have large pineapple plantations to cut costs and make available at<br />
cheaper prices.<br />
(ii) EU Countries<br />
European countries imported up to 11, 87,556 tons of pineapples during 2006.<br />
There is 50% increase in demand since the year 2003. Largest importers in EU are<br />
Belgium (2, 50,885 tons), Netherlands (2, 00,454 tons), Germany (1, 55,635 tons),<br />
Italy (1, 33,464 tons) and other countries importing in large quantities are France,<br />
U.K., Spain and Portugal.<br />
Our exports were only 237 tons to Spain, 42 tons to Netherlands and 16 tons to<br />
Belgium during 2006. India has to compete with quality fruits made available at<br />
lower prices by Costa Rica, Ecuador and Panama in Central and South America. To<br />
accelerate pineapple export to these countries, India will have to improve quality of<br />
fruits and supply at competitive prices.<br />
(iii) Russia and Ukraine<br />
There is excellent scope for exporting to Russia and other nearby countries. Russia<br />
imported to the tune of 26,133 tons of pineapple during 2006. However, India will<br />
have to address reducing cost of production and improving quality.<br />
F. BANANA<br />
Production of banana is 18,702 thousand tons (2005-06). India is the largest producer<br />
of banana in the world (For details see crop profile, Volume – II Domestic Market<br />
Research, Chapter 7).<br />
81
♦<br />
Export trend<br />
Total export of Banana has increased from 8655 tons in 2002-03 to 11,475 tons during<br />
2006-07. However exports were higher during 2005-06 i.e 14,411 tons. (Table 22 & Fig.<br />
8).<br />
Table 22: Export of banana for last five years<br />
Year Quantity(tons) Value( in Rs. Lakh )<br />
2002-2003 8655 1272.3<br />
2003-2004 10876 1171.8<br />
2004-2005 12817 1342.7<br />
2005-2006 14411 2336.1<br />
2006-2007 11475 1606.7<br />
Export of banana in last five years<br />
16000<br />
14000<br />
Quantity in tons<br />
12000<br />
10000<br />
8000<br />
6000<br />
4000<br />
2000<br />
0<br />
2002-2003<br />
2003-2004<br />
2004-2005<br />
2005-2006<br />
2006-2007<br />
Years<br />
Fig. 8<br />
Export potential of banana is presented and discussed region wise as below:<br />
82
(i) GCC countries<br />
Export of banana from India has decreased to 4774 tons during 2006-07 compared to<br />
7145 tons in 2005-06. Details of exports are given below in table 23. Exports of<br />
banana from India to GCC countries are negligible compared to the total imports.<br />
Table 23: Import/Export of banana in GCC countries (year 2006)<br />
S.No. Countries Total Import<br />
(in tons)<br />
Export by India<br />
(in tons)<br />
1 GCC 491747 4774<br />
2 UAE 210419 2288<br />
3 Saudi Arabia 236284 670<br />
Source: Comtrade database, 2006 & <strong>APEDA</strong><br />
Exports of table bananas from India have stuck up because of the fact that Philippines<br />
is able to supply in large quantities at cheaper rates with the advantage that large<br />
banana plantations are owned by multinational companies and are organized in a<br />
better way. Thus, we will have to organize properly and cut down on costs for<br />
accelerating exports of banana.<br />
(ii) Iran<br />
According to Tradecom database, Iran also imported to the tune of 2, 94,080 tons of<br />
banana during 2006. It will therefore be appropriate to explore this market.<br />
(iii) EU countries<br />
EU countries imported 7,149,513 tons of bananas during 2006. Although India<br />
exported 200 tons of banana to EU including Ukraine and Russia. However, there is<br />
not much scope as large quantities of banana are exported by countries like Ecuador,<br />
Costa Rica and Colombia in Central and South America and Cameroon in Africa.<br />
Moreover, EU has special preferential agreement with African, Caribbean and Pacific<br />
83
countries. Other countries exporting to EU have to pay tariff duties and thus are not<br />
able to compete with them.<br />
(iv) Russia and Ukraine<br />
There is some scope of exporting banana to Russia and Ukraine provided we have<br />
some preferential arrangement with these countries.<br />
G. AONLA<br />
India is the largest producer of aonla in the world and produced 150.5 thousand tons<br />
during 2000 (See crop profile for details, Volume – II Domestic Market Research,<br />
Chapter 8).<br />
Although exact figures of export of Aonla as a whole fruit in dried form or its flakes are<br />
not available, but it has great potential for exports as it is used in both pharmaceutical<br />
and cosmetics. Aonla is also used in tanning industry.<br />
Aggressive campaign about its useful properties can only initiate export of Aonla in<br />
fresh form. Export of dried flakes of Aonla can be accelerated with the help of bringing<br />
awareness in foreign countries about its therepeutical uses.<br />
H. TOMATO<br />
Production of tomato during 2005-06 was 9361.8 thousand tons. India ranks fourth in<br />
production at world level. (For details, see crop profile, Volume – II Domestic Market<br />
Research, Chapter 10).<br />
♦ Export trend<br />
Export of tomatoes has increased from 12,886 tons in 2002-03 to 33,592 tons in 2006-<br />
07. A significant increase has been recorded of more than 250 %.( Table 24 & Fig. 9)<br />
84
Table 24: Export of tomatoes in last five years<br />
Year Quantity(tons) Value(in Rs. Lakh)<br />
2002-2003 12886 1185.0<br />
2003-2004 11328 685.4<br />
2004-2005 7446 589.3<br />
2005-2006 11743 1086.0<br />
2006-2007 33592 3410.1<br />
35000<br />
30000<br />
Export of tomatoes in last five years<br />
Quantity in tons<br />
25000<br />
20000<br />
15000<br />
10000<br />
5000<br />
0<br />
2002-2003<br />
2003-2004<br />
2004-2005<br />
2005-2006<br />
2006-2007<br />
Years<br />
Export potential<br />
Fig. 9<br />
Export potential of tomatoes is discussed region wise as below:<br />
(i) GCC countries<br />
During 2006-07, 10,352 tons of tomatoes were exported. This is a substantial<br />
increase from 1019 tons in 2005-06. Details of total imports compared to exports from<br />
India are given in table 25.<br />
85
Table 25: Import/Export of tomatoes in GCC countries (year 2006)<br />
S.No. Countries Total Import<br />
(in tons)<br />
Export by India<br />
(in tons)<br />
1 UAE 125821 10176<br />
2 Saudi Arabia 210199 43<br />
3 Kuwait 82475 84<br />
Source: Comtrade database, 2006 & <strong>APEDA</strong><br />
The exports from India are negligible compared to imports; however, data shows<br />
there is substantial export potential for export of tomatoes to GCC countries provided<br />
India maintains quality standards. India needs to penetrate markets of Saudi Arabia,<br />
Kuwait, Qatar, etc. by meeting their requirements. India’s competing countries are<br />
Jordan and Syria. India is able to supply tomatoes at competitive prices compared to<br />
Jordan, but Syria supplies at much lower prices and thus, India will have to provide<br />
tomatoes at competitive rates by reducing cost of production.<br />
(ii) ASEAN countries<br />
For the first time India exported 406 tons to Singapore during 2006-07. There is huge<br />
potential for exports of tomatoes to these countries. Considering the nominal import<br />
duties in Indonesia, Philippines and no tariff duties in Malaysia on imports of<br />
tomatoes, there is scope to expand the trade.<br />
The export potential can be gauged by imports of tomatoes by Singapore (24,007<br />
tons), Vietnam (12,910 tons) and Malaysia (3,589 tons).<br />
For India, the best opportunity is to export to Singapore. India should meet the<br />
requirements of Singapore market which is an important destination.<br />
(iii) Pacific Rim countries and China<br />
There is no scope of exports of tomatoes to these countries for the time being.<br />
86
(iv) EU countries<br />
EU countries imported to a level of 2,478,794 tons during 2006. Export from India are<br />
not a possibility till we improve upon our technology and can export by sea may be by<br />
using MA cartons.<br />
I. GREEN CHILLIES<br />
India produced 59.1 thousand tons of green chillies as per FAO database during 2006<br />
(See crop profile for details, Volume – II Domestic Market Research, Chapter 12).<br />
♦ Export trend<br />
There has been phenomenal increase in exports of green chillies just from 1385 tons in<br />
2002-03 to 18,187 tons in 2006-07 (Table 26 & Fig 10).<br />
Table 26: Export of green chillies in last five years<br />
Year Quantity(tons) Value(in Rs. Lakh )<br />
2002-2003 1385 284.4<br />
2003-2004 3838 898.9<br />
2004-2005 7952 909.2<br />
2005-2006 8764 1482.5<br />
2006-2007 18187 2216.3<br />
87
Export of green chillies in last five years<br />
Quantity in tons<br />
20000<br />
18000<br />
16000<br />
14000<br />
12000<br />
10000<br />
8000<br />
6000<br />
4000<br />
2000<br />
0<br />
2002-2003<br />
2003-2004<br />
2004-2005<br />
2005-2006<br />
2006-2007<br />
Years<br />
Fig. 10<br />
Export Potential<br />
Region wise export potential is discussed in following paras:<br />
(i) GCC countries<br />
Out of total exports of green chillies during 2006-07 from India, maximum amount of<br />
green chillies were exported to Gulf countries (16,674 tons).Details of exports are<br />
given below in table 27. Exports are comparatively little compared to imports by GCC<br />
countries. There is 158% increase in demand over the year 2003. There is a need to<br />
penetrate Saudi Arabia, Oman, Qatar and Kuwait markets by appropriate campaigns<br />
& negotiations. The main competition of India is with Jordan.<br />
Table 27: Import/Export of green chillies in GCC countries (year 2006)<br />
S.No. Countries Total Import Export by India<br />
(in tons)<br />
(in tons)<br />
1 GCC 56280 16674<br />
2 UAE 30457 15716<br />
3 Saudi Arabia 10343 51<br />
Source: Comtrade database, 2006 & <strong>APEDA</strong><br />
88
(ii) ASEAN countries<br />
ASEAN countries imported green chillies to the tune of 46,705 tons in 2006 Major<br />
importers in ASEAN countries were Malaysia (32,427 tons) and Singapore (13,255<br />
tons).<br />
India’s export of green chillies was very meager, as only 19 tons were exported to<br />
Singapore during 2006-07. However, during 2005-06, India exported 196 tons of<br />
green chillies to Malaysia and shows that there is a good potential for exporting to<br />
Malaysia and Singapore among ASEAN countries. But India will have to provide at<br />
competitive prices by cutting cost of production by increasing productivity.<br />
(iv) European Union<br />
European Union has imported green chillies including peppers to the extent of<br />
1,032,194 tons during 2006. India’s export of green chillies to EU comprised 70 tons<br />
to UK, 14 tons to Italy and 11 tons to France. There is some potential in exports of<br />
green chillies to EU and needs to be pursued vigorously. India should supply at<br />
competitive prices as Spain and Jordan are main competitors who supply relatively<br />
at lower prices.<br />
(v) Australia<br />
There is a good potential for exporting green chillies to Australia. Australian market is<br />
monopolized by New Zealand, however, Indian chillies are totally different from New<br />
Zealand with specific characteristics and therefore export must be explored citing the<br />
preferential qualities.<br />
J. OKRA<br />
Present production of okra is 3684 thousand tons (2005-06). India is the largest<br />
producer in the world (For details please see crop profile, Volume – II Domestic Market<br />
Research, Chapter 11).<br />
89
♦<br />
Export trend<br />
There is no separate data for export of okra, as its exports are included in mixed<br />
vegetables.<br />
The export of mixed vegetables was stagnant from 2002-03 to 2005-06, however<br />
suddenly during 2006-07, export of mixed vegetables spurted to 50,992 tons<br />
compared to 27,849 tons in 2002-03 and 22,768 tons during 2005-06.( Table 28 &<br />
Fig. 11)<br />
Table 28: Export of mixed vegetables in last five years<br />
Year Quantity(tons) Value (in Rs. Lakh )<br />
2002-2003 27849 4796.9<br />
2003-2004 18490 3724.1<br />
2004-2005 28833 4798.7<br />
2005-2006 22768 4522.8<br />
2006-2007 50992 12830.1<br />
Export of mixed vegetables in last five years<br />
60000<br />
Quantity in tons<br />
50000<br />
40000<br />
30000<br />
20000<br />
10000<br />
0<br />
2002-2003<br />
2003-2004<br />
2004-2005<br />
2005-2006<br />
2006-2007<br />
Years<br />
Fig. 11<br />
90
Since mixed vegetables comprise vegetables like okra, broccoli, capsicum, torai (ridge<br />
gourd), karela (bitter gourd) and lauki (long gourd), etc., it is estimated that about<br />
17,500 – 20,000 tons of okra are being exported at present (taking an estimate of 35-<br />
40%) out of total exports of mixed vegetables.<br />
Maximum amount of these vegetables are exported to GCC countries and largest<br />
importers are UAE, Saudi Arabia, Qatar and Kuwait. The exports to EU countries are<br />
lesser (almost 1/3 rd of GCC countries) and the largest importers are U.K, Germany,<br />
Switzerland and France.<br />
As far as ASEAN countries are concerned, exports of mixed vegetables were made<br />
only to Singapore (832 tons) and Indonesia (40 tons).Since data on imports from other<br />
countries either on Comtrade or Trademap is not available, analysis to this effect has<br />
not been carried out.<br />
K. ONION<br />
The level of production is 9248.4 thousand tons as recorded during 2005-06. India is<br />
the second largest producer of onions in the world. (See crop profile for details, Volume<br />
– II Domestic Market Research, Chapter 9).<br />
♦ Export trend<br />
Export of onions from India has increased at a faster rate in the last five years. Export<br />
has increased from 5, 88,711 tons in 2002-03 to 13, 78,373 tons in 2006-07. An<br />
increase of 133% in exports has been recorded (Table 29 & Fig. 12)<br />
Table 29: Export of onion in last five years<br />
Year Quantity(tons) Value (in Rs. Lakh)<br />
2002-2003 588711 36180.0<br />
2003-2004 859938 71586.7<br />
2004-2005 870216 64411.9<br />
2005-2006 960507 70815.8<br />
2006-2007 1378373 116330.5<br />
91
1400000<br />
Export of onions in last five years<br />
1200000<br />
Quantity in tons<br />
1000000<br />
800000<br />
600000<br />
400000<br />
200000<br />
0<br />
2002-2003<br />
2003-2004<br />
2004-2005<br />
2005-2006<br />
2006-2007<br />
Years<br />
Fig. 12<br />
Maximum exports of onions were to SAARC countries, followed by ASEAN and GCC<br />
countries.<br />
An account of region wise export potential is given below:<br />
(i)<br />
ASEAN countries<br />
ASEAN countries as per Comtrade database imported 7, 83,035 tons during 2006<br />
compared to 439,154 tons in 2003 and thus there is an increase of 78% in demand<br />
for onions in these years. Details of imports of onions by ASEAN countries and<br />
exports from India during 2006-07 as per <strong>APEDA</strong> database is given below in table<br />
30.<br />
Table 30: Import/Export of onions during 2006<br />
S.No. Countries Total Import (in tons) Export by India (in tons)<br />
1 ASEAN 783035 377103<br />
2 Malaysia 470552 319857<br />
3 Indonesia 99890 1203<br />
92
4 Philippines 75855 32894<br />
5 Singapore 43887 22960<br />
6 Vietnam 48411 189<br />
Source: Comtrade database, 2006 & <strong>APEDA</strong><br />
China is competing with India and is supplying onion at a cheaper rate under APTA<br />
to Indonesia and Thailand. Possibly with the implementation of Free Trade<br />
Agreements with ASEAN countries, export of onions will further increase.<br />
(ii) GCC countries<br />
GCC countries imported 606,866 tons of onions during 2006.There was 134%<br />
increase in demand for onions over the year 2003. Details of imports and exports<br />
from India are given in the table 31. India has not been able to penetrate Saudi<br />
Arabian market. Efforts are to be made to meet the requirements of Saudi Arabia in<br />
near future so that a boost to onion exports can be given. India will have to compete<br />
with Egypt, Turkey and Iran by supplying onions at competitive prices.<br />
Table 31: Import/Export of onions in GCC countries (year 2006)<br />
S.No. Countries Total Import<br />
(in tons)<br />
Export by India<br />
(in tons)<br />
1 GCC 606866 292919<br />
2 UAE 254413 235912<br />
3 Saudi Arabia 233992 7690<br />
Source: Comtrade database, 2006 & <strong>APEDA</strong><br />
(iii) European Union<br />
European Union imported onions up to 1,776,544 tons during 2006.Data on total<br />
imports and exports from India are given below in table 32.<br />
93
Table 32: Import/Export of onions in EU countries (year 2006)<br />
S.No. Countries Total Import<br />
(in tons)<br />
Export by India<br />
(in tons)<br />
1 EU 1776544 4540<br />
2 UK 316723 598<br />
3 Germany 276587 325<br />
4 Netherlands 103357 666<br />
5 Spain - 1071<br />
Source: Comtrade database & <strong>APEDA</strong><br />
The distribution of Indian onions to major countries in EU shows that acceptability of<br />
Indian onions is increasing. Further enhancement in exports of onions to EU is a<br />
great possibility if India supplies yellow onions with less pungency, along with thick<br />
and fleshy layers. A suitable variety Arad H has already been identified and export of<br />
this needs to be explored in a concerted manner.<br />
L. GINGER<br />
Present production of ginger is 517.8 thousand tons (2006). India is the largest<br />
producer in the world. (For details see crop profile, Volume – II Domestic Market<br />
Research, Chapter 13).<br />
♦ Export trend<br />
Export of ginger increased from 4696.5 tons in 2003-04 to 13889 tons in 2004-05,<br />
however, after this, it started declining as only 9411.3 tons was exported during 2005-<br />
06 and it further declined to 7500 tons in 2006-07.( Table 33 & Fig 13).<br />
Table 33: Export of ginger from India<br />
Year Quantity(tons) Value (in Rs. Lakh)<br />
2003-2004 4696.5 2275.5<br />
2004-2005 13889.9 5985.8<br />
2005-2006 9411.3 4295.5<br />
2006-2007 7500.1 3975.0<br />
94
Export of ginger from India<br />
14000<br />
12000<br />
Quantity in tons<br />
10000<br />
8000<br />
6000<br />
4000<br />
2000<br />
0<br />
2003-2004<br />
2004-2005<br />
2005-2006<br />
2006-2007<br />
Years<br />
Fig. 13<br />
Export potential of ginger is discussed region wise in the following paragraphs:<br />
(i) GCC countries<br />
India exported 1109 tons to GCC during 2006-07, of which Saudi Arabia imported 930<br />
tons and UAE imported 179 tons of ginger from India, (as per Report of Spice Board<br />
of India). Comtrade database, however shows that GCC countries imported as much<br />
as 38,630 tons during 2006.The GCC market has been dominated by ginger from<br />
China, Ethiopia and Nigeria. China supplies ginger at cheaper rates and Ethiopia and<br />
Nigeria are also able to provide cheaper ginger compared to India.<br />
India though largest producer of ginger in the world but productivity is very low. If<br />
India has to compete in world markets, it must increase productivity and lower cost of<br />
production by cultivating high yielding cultivars with better agricultural practices.<br />
(ii) Middle East and African countries<br />
Apart from GCC countries, India has exported ginger during 2006-07, to a number of<br />
Middle East and African countries comprising Yemen Arab Republic (480 tons),<br />
Morocco (281 tons) and Israel (139 tons). This suggests that there is a potential of<br />
exporting ginger to these countries also which can be further explored.<br />
95
(iii) European Union<br />
European Union imported ginger up to 43,056 tons during 2006. Largest importers<br />
were UK, Netherlands and Germany. Major export of ginger to European Union is<br />
done by China (36%) and Thailand (13%). Exports to some extent are also done by<br />
Nigeria and Brazil. These countries are also India’s competitors and supply ginger to<br />
EU at much cheaper prices. India’s exports are negligible as is shown in table 34. As<br />
stated earlier India must offer ginger at competitive prices for enhancing exports.<br />
Table 34: Imports/Exports of ginger in EU (2006)<br />
S.No. Countries Total imports (in tons) Exports by India (in tons)<br />
1 EU 43056 1384<br />
2 UK 15962 554<br />
3 Netherlands 13204 174<br />
4 Germany 4364 145<br />
5 Spain - 393<br />
Source: Comtrade database & <strong>APEDA</strong><br />
(iv) Pacific Rim countries<br />
India exported some quantities of ginger to Australia (131 tons) and Japan (73 tons)<br />
during 2006-07.<br />
Australia imported 869 tons of ginger in 2006, the imports of Australia decreased to<br />
663 tons during 2007.India’s main competition is with China and Fiji Islands who<br />
supply ginger at cheaper rates than India. India must initiate appropriate strategies to<br />
explore it further.<br />
As far as Japan is concerned, maximum imports of ginger all over the world<br />
amounting to 58,465 tons are done by Japan, but India exported only 73 tons to<br />
Japan. India needs to explore Japanese market in a better way.<br />
96
(v) U.S.A and Canada<br />
Both USA and Canada imported 32,553 tons and 8360 tons of ginger respectively<br />
during 2006. India exported 444 tons of ginger to USA and 112 tons to Canada.<br />
Looking into the potential for exporting to these countries, a concerted effort in this<br />
direction is required.<br />
M. TURMERIC<br />
India produced turmeric to the tune of 846.7 thousand tons during 2006. India is the<br />
largest producer of turmeric in the world. (For details see crop profile, Volume – II<br />
Domestic Market Research, Chapter 14).<br />
♦ Export trend<br />
India has monopoly in turmeric trade at world level. Although India is the largest<br />
producer of turmeric in the world (8,46,700 tons) but it exported only 6% of the total<br />
production. India, exported 51500 tons of turmeric during 2006-07. This is substantial<br />
compared to 37,644 tons during 2003-04. (Table 35 & Fig 14).<br />
Table 35: Export of turmeric from India<br />
Year Quantity(tons) Value (in Rs. Lakh)<br />
2003-2004 37044.3 13111.7<br />
2004-2005 43096.6 15625.0<br />
2005-2006 46404.9 15286.0<br />
2006-2007 51500.0 16480.0<br />
97
Export of turmeric from India<br />
60000<br />
Quantity in tons<br />
50000<br />
40000<br />
30000<br />
20000<br />
10000<br />
0<br />
2003-2004<br />
2004-2005<br />
2005-2006<br />
2006-2007<br />
Years<br />
Fig. 14<br />
Present exports and export potential of turmeric, region wise is discussed in the<br />
following pages:<br />
(i) GCC countries<br />
India exported 9550 tons of turmeric to GCC countries. UAE imported maximum<br />
quantity of 7823 tons, whereas Saudi Arabia imported 1406 tons and Kuwait 320<br />
tons. Export potential should be further exploited by exploring exports to Bahrain,<br />
Oman and Qatar.<br />
(ii) Middle East and African countries<br />
Exports of turmeric was made mainly to countries like Iran (6094 tons), Egypt (2057<br />
tons), Morocco (736 tons), Israel (632 tons), etc. amounting approx. to 9821 tons.<br />
India must also explore the opportunity of expanding the trade to Turkey, Algeria,<br />
Kenya, Yemen, Jordan, etc.<br />
(iii) European countries<br />
Turmeric was exported to EU countries up to 9508 tons; the largest importers were<br />
UK (2896 tons), Netherlands (1816 tons), Germany (1155 tons), France (627 tons),<br />
98
etc. Export of turmeric needs to be explored in remaining European countries as<br />
there is huge potential for export.<br />
(iv)<br />
Russia<br />
India exported 567 tons of turmeric to Russia. Export of turmeric should be further<br />
explored to Russia and other adjoining countries.<br />
(v)<br />
ASEAN countries<br />
Some amount of turmeric was also exported to ASEAN countries comprising<br />
Malaysia (2263 tons) and Singapore (622 tons). Export needs to be pursued in<br />
Philippines, also. There is no scope of exporting to Indonesia.<br />
(vi) Pacific Rim countries and China<br />
India exported 2631 tons of turmeric to Japan as per Spices Board database. There<br />
are no authentic figures about exports of Indian turmeric to South Korea and<br />
Australia, but as per Comtrade database India exported 267 tons to South Korea<br />
and 462 tons to Australia.<br />
Further exports to these countries need to be explored, but there is no potential of<br />
exporting to China, as this country is itself an exporting country.<br />
(vii) U.S.A and Canada<br />
India exported 2460 tons of turmeric to USA and 347 tons to Canada during 2006.<br />
Efforts for further enhancement of exports must be made to these countries.<br />
Since India is exporting only 6% of its total production, therefore adequate<br />
campaign needs to be launched for boosting exports of turmeric highlighting its<br />
medicinal properties. Export of turmeric needs to be further explored in Central and<br />
South American countries.<br />
N. SESAME<br />
India produced 641 thousand tons of sesame during 2005-06 and produced 670 thousand<br />
99
tons during 2007. India at present is largest producer of sesame in the world. (See crop<br />
profile for details, Volume – II Domestic Market Research, Chapter 15).<br />
♦<br />
Export trend<br />
Export data of FAO website shows that 218,970 tons of sesame seeds were exported<br />
from India during 2001-02, however it declined to 118,376 tons during 2002-03.<br />
Thereafter, there was again good upsurge in exports during 2003-04 to the tune of<br />
189,113 tons and 1, 99,808 tons during 2005-06. No data for 2006-07 is available on<br />
FAO database; however, Comtrade database shows exports of 233,345 tons during the<br />
year (Table 36 & Fig 15).This database also depicted 302,345 tons of exports during<br />
2007.<br />
Table 36: Export of sesame from India<br />
Year Quantity(tons) Value( in Rs. Lakh)<br />
2002-2003 118376 37203<br />
2003-2004 189113 70043<br />
2004-2005 156664 65067<br />
2005-2006 199808 74513<br />
2006-2007 233345 93271<br />
Export of sesame in last five years<br />
250000<br />
Quantity in tons<br />
200000<br />
150000<br />
100000<br />
50000<br />
0<br />
2002-2003<br />
2003-2004<br />
2004-2005<br />
2005-2006<br />
2006-2007<br />
Years<br />
Fig. 15<br />
100
Export potential of sesame, region wise is discussed below:<br />
(i) GCC countries<br />
As per Comtrade database, GCC countries imported 45,849 tons of sesame during<br />
2006. There is 101% increase in demand. The details of imports and India’s exports<br />
to GCC countries indicates a lower achievement compared to the existing potential<br />
(table 37).<br />
Table 37: Import/Export of sesame in GCC countries (year 2006)<br />
S.No. Countries Total Import<br />
(in tons)<br />
Export by India<br />
(in tons)<br />
1 GCC 45849 6714<br />
2 Saudi Arabia 28626 2726<br />
3 UAE 14463 3224<br />
4 Kuwait 2496 764<br />
Main competition is from Ethiopia and Sudan who are able to supply at cheaper rates,<br />
as they are near to GCC countries compared to India. Moreover, India’s productivity<br />
of sesame is 50% of the productivity of Ethiopia. Thus in order to be competitive;<br />
India must enhance the productivity in addition to improve quality standards.<br />
(ii) Middle East and African countries<br />
India is exporting to the tune of 10,467 tons to Turkey, 1665 tons to Cyprus, 1069<br />
tons to Jordan and 153 tons to Morocco. India should explore these markets<br />
including Egypt to further enhance exports. (Egypt imported 48,294 tons of sesame<br />
seeds during 2006).<br />
(iii) European Union<br />
European Union imported sesame seeds up to 1, 21,053 tons during 2006. India’s<br />
exports to EU were maximum, as 48% of the requirements were met by India and<br />
101
other exporters are Guatemala, Sudan, and Paraguay supplying only limited<br />
quantity. Largest importers of sesame from India during 2006 were Germany (14,288<br />
tons), Netherlands (11,993 tons), Greece (9748 tons), Poland (6231 tons), Italy<br />
(4671 tons), UK (3343 tons) and France (2016 tons).<br />
India must keep up the momentum and to maintain position as largest supplier/<br />
exporter to EU, must improve upon quality and cut on cost of production to be more<br />
competitive.<br />
(iv) ASEAN countries<br />
ASEAN countries imported sesame seeds up to 22,510 tons during 2006.There is a<br />
21.6% increase in demand. India is meeting 60% demand of ASEAN countries. Main<br />
importers of Indian sesame are Malaysia (7195 tons), Indonesia (3258 tons),<br />
Singapore (1876 tons) and Philippines (921 tons).<br />
Major competition with India in ASEAN region is from Myanmar, but India is able to<br />
make available sesame in these markets at competitive prices.<br />
(v) Pacific Rim countries and China<br />
Export potential in these countries is as follows:<br />
(a) South Korea<br />
South Korea imported 85,567 tons of sesame seeds during 2006. Out of this total<br />
import, 38,686 tons were exported by India and 33,081 tons by China. India<br />
supplied at much competitive price over China and thus there is a scope of<br />
increasing share in imports of South Korea.<br />
(b) Australia<br />
Australia imported 6604 tons of sesame during 2006, out of which India supplied<br />
4836 tons and rest by Mexico, Guatemala and China. However, India supplied<br />
sesame at much competitive price compared to other countries mentioned above.<br />
102
(c) China<br />
China imported 2, 63,587 tons of sesame during 2006.Major exporters to China<br />
were Ethiopia (1, 34,989 tons), Sudan (67,426 tons), and Tanzania (12,570 tons).<br />
India exported only 13,487 tons during this year. India exported sesame at much<br />
competitive rates over Ethiopia and Sudan.<br />
During 2007, China imported 1, 94,461 tons of sesame. This year Ethiopia’s<br />
share was only 75,563 tons, whereas India’s share increased to 37,214 tons<br />
compared to 13,487 tons in 2006.<br />
Since India is nearer to China compared to Ethiopia and Sudan, we have to<br />
expand the trade in China.<br />
(d) Japan<br />
Japan is second largest importer of sesame next to China in the world and<br />
imported 1, 59,110 tons during the year 2006. India did not export sesame to<br />
Japan at all.<br />
However, requirements of sesame were met by Nigeria (45,388 tons), Paraguay<br />
(21,986 tons), Tanzania (17,579 tons), China (9497 tons), Bolivia (10,439 tons)<br />
and Guatemala (7369 tons). India must explore exports to Japanese market, as<br />
India is closer to Japan compared to Guatemala, Paraguay, Nigeria, Tanzania etc<br />
and can offer competitive price over Paraguay, China, Guatemala and Bolivia.<br />
(vi) North America<br />
USA alone imported 43,316 tons of sesame during 2006. Canada also imported<br />
sizeable quantities of sesame although exact figures are not known.<br />
India exported during the year (2006), 18,436 tons of sesame seeds to U.S.A and<br />
4265 tons to Canada. Although India supplies 42% of demand of U.S.A, however still<br />
effort needs to be made to have higher share in imports of U.S.A.<br />
103
O. SOYAMEAL<br />
Present production of soyameal in India is 5280 thousand tons (2006-07). (Please see<br />
crop profile for more details, Volume – II Domestic Market Research, Chapter 16).<br />
♦ Export trend<br />
There is a significant spurt in exports of soyameal as only 615,328 tons were exported<br />
during 2004-05 but it increased to 4,196,245 tons during 2006-07.(Table 38 & Fig. 16).<br />
Table 38: Export of soyameal from India<br />
Year<br />
Quantity(tons)<br />
2004-2005 615328<br />
2005-2006 3494860<br />
2006-2007 4196295<br />
Export of soyameal from India<br />
Quantity in tons<br />
4500000<br />
4000000<br />
3500000<br />
3000000<br />
2500000<br />
2000000<br />
1500000<br />
1000000<br />
500000<br />
0<br />
2004-2005 2005-2006 2006-2007<br />
Fig. 14<br />
Years<br />
The potential for exports is discussed in the following paragraphs:<br />
(i) GCC countries<br />
GCC countries imported to the tune of 8, 01,916 tons during 2006. There is 55.5%<br />
increase in demand over the year 2003. The largest importers in GCC countries are<br />
104
Saudi Arabia (7, 20,026 tons), Kuwait (49,852 tons), UAE (21,564 tons), Oman (9672<br />
tons) and Qatar (802 tons).<br />
India in its exports is meeting almost entire requirements of UAE, Kuwait and Qatar,<br />
however, in case of Saudi Arabia which imported to the extent of 7, 20,026 tons<br />
during 2006; there was no export. The requirements of Saudi Arabia were met by<br />
Brazil (4, 49,780 tons), U.S.A (1, 06,213 tons) and Argentina (49,829 tons).<br />
India is exporting to other GCC countries at most competitive prices over Brazil,<br />
U.S.A and Argentina and moreover India is closer to GCC countries compared to<br />
above countries. India thus must make sincere efforts to penetrate the market of<br />
Saudi Arabia.<br />
(ii) ASEAN countries<br />
ASEAN countries imported up to 8,230,166 tons of soyameal during 2006. Data on<br />
imports by ASEAN countries and exports from India are given below in table 39.<br />
Table 39: Imports/Exports of soyameal in 2006<br />
S.No. Countries Total imports (in tons) India’s exports (in tons)<br />
1 ASEAN 8230166 1968767<br />
2 Thailand 2174201 288765<br />
3 Indonesia 2116058 656024<br />
4 Vietnam 1820338 892772<br />
5 Philippines 1359315 82285<br />
6 Malaysia 740572 48901<br />
7 Singapore - 222896<br />
India’s total exports during 2006 to ASEAN countries were only 1/4 th of the total<br />
demand. Main competitors with India are Argentina, Brazil and U.S.A, who inspite of<br />
the fact are quite away in distance from ASEAN countries, still are able to supply<br />
soyameal at competitive prices.<br />
105
Thus, India must increase productivity of soyabean, so that it can lower the cost of<br />
production and offer soyameal to ASEAN countries at much lower prices to increase<br />
exports to these countries.<br />
(iii) Pacific Rim countries and China<br />
During 2006, Pacific Rim countries comprising South Korea, Japan and China<br />
imported soyameal 1,709,150 tons, 1,647,492 tons and 6,74,177 tons respectively,<br />
India exported 5,35,810 tons to Japan, 6,82,104 tons to South Korea, 3,15,028 tons<br />
to China and 89,388 tons to Taiwan during this year.<br />
Main competition of India is with Argentina, Brazil and to some extent with U.S.A.<br />
India is much closer to these countries and must make sincere efforts to have larger<br />
share in imports of these countries by offering competitive prices.<br />
P. COTTON<br />
Production of cotton lint in India was 4740 thousand tons during 2006-07 and 5270<br />
thousand tons during 2007-08. (See crop profile for details, Volume – II Domestic<br />
Market Research, Chapter 17).<br />
♦ Export trend<br />
India’s export of cotton lint was insignificant up to 2004-05 and increased only during<br />
2005-06 and 2006-07. Cotton lint export from India increased from 13,306 tons in 2002-<br />
03 to 1,001,718 tons in 2006-07 (Table 40 & Fig 17).<br />
Table 40: Export of cotton lint from India<br />
Year Quantity(tons) Value(in Rs. Lakh)<br />
2002-2003 13306 6058<br />
2003-2004 201372 88114<br />
2004-2005 160600 70237<br />
2005-2006 776632 384038<br />
2006-2007 1001718 535109<br />
106
Export of cotton lint from India<br />
1200000<br />
Quantity in tons<br />
1000000<br />
800000<br />
600000<br />
400000<br />
200000<br />
0<br />
2002-2003<br />
2003-2004<br />
2004-2005<br />
2005-2006<br />
2006-2007<br />
Years<br />
Fig. 17<br />
Export potential of cotton is discussed region / areas wise in the following paras:<br />
(i) ASEAN countries<br />
ASEAN countries imported 1,059,967 tons during 2006. There is a decrease of 3% in<br />
demand over 2003. India’s exports to these countries are approx 11% of their<br />
requirements. The details of imports and exports from India are given below in the table<br />
41.<br />
Table 41: Imports/Exports of cotton lint in 2006<br />
S.No. Countries Total imports (in tons) India’s exports (in tons)<br />
1 ASEAN 1059967 118682<br />
2 Thailand 422042 44478<br />
3 Indonesia 463205 50534<br />
4 Vietnam 119021 33670<br />
Main competition for India for export of cotton is from Australia and U.S.A. India is<br />
nearer to these countries from location point of view compared to U.S.A. India is also<br />
supplying at much lower prices compared to U.S.A and Australia but still, India is not<br />
107
able to corner more than 11% share of imports. India needs to strive for higher<br />
productivity and lower cost of production on one hand and improve quality on the other<br />
for enhancing exports to these countries.<br />
(ii) South Korea<br />
Republic of Korea imported 2, 16,268 tons of cotton during 2006; however India<br />
exported only 6999 tons of cotton to it. The other exporters were U.S.A (83,944 tons),<br />
Australia (53,458 tons) and Brazil (40,091 tons).<br />
Inspite of the fact that India is supplying cotton at much competitive prices over U.S.A<br />
and Australia and India is also nearer to South Korea location wise, yet India’s export<br />
share is very less. India should make serious efforts to explore the market.<br />
(iii) China<br />
China imported 3,641,417 tons of cotton during 2006 whereas India exported only 4,<br />
65,388 tons of cotton during 2006. The major competition is from U.S.A, Uzbekistan<br />
and Australia. U.S.A is the largest exporter to China and India is second largest<br />
exporter.<br />
India location wise is closer to China and should have larger share in imports of China<br />
by offering at more competitive prices and supplying better quality cotton.<br />
(iv) Japan<br />
Japan imported cotton to the tune of 1, 35,574 tons during 2006. However, India did not<br />
export any quantity of cotton to Japan. It will be appropriate to explore the exports of<br />
Indian cotton to Japan.<br />
(v) Turkey<br />
Turkey imported total quantity of 7, 37,734 tons of raw cotton during 2006 and India<br />
exported only 89,932 tons. India should try to penetrate this market in an effective<br />
manner as there is good potential there.<br />
108
6.6. EXPORT PROJECTIONS AT THE END OF XI TH PLAN<br />
With the special measures taken up during XI th plan, total production of all crops (being<br />
studied at present) is bound to increase substantially.<br />
There is a likely production of 85 million tons of fruits and 160 million tons of vegetables<br />
at the end of XI th plan as a result of several measures taken like TMNE, NHM,<br />
ISOPOM, etc.<br />
It is estimated that the exports of all the commodities are likely to increase to a level of<br />
14.44 million tons at the end of XI th plan compared to present level of exports of 7.46<br />
million tons. An increase of 93.7% from the present level is envisaged and quite<br />
justified in next five years (Table 42). The projections have been worked out<br />
considering the previous growth pattern and other factors.<br />
There are very high prospects of fulfilling these targets because of extraordinary<br />
measures taken for creating infrastructure and other facilities required for export by<br />
<strong>APEDA</strong> and recent attempts by National Horticulture Mission especially in the areas of<br />
fruits and vegetables.<br />
Achieving these targets in fruits and vegetables as stated in Table 42 of 0.68 million<br />
tons of fruits and 3.54 million tons of vegetables is just minimal, compared to the<br />
potential that exists for exports. It all depends, how India meets the challenge of<br />
gearing up all the stake holders in the export programme.<br />
In other crops also there is worldwide demand like for sesame and soyameal and<br />
exports targeted can easily be fulfilled. Spices Board of India has special programme to<br />
take exports of spices to new heights. In cotton also, there is a boost in production due<br />
to adoption of GM varieties. In 2008-09, there is a surplus of 10 million bales of cotton<br />
(1.7 million tons) and thus there is excellent scope of export in cotton because of higher<br />
demand in China and other countries and India is now world’s favourite shopping<br />
destination for affordable good quality cotton at competitive prices.<br />
109
Table 42: Present volume of exports and projection during 2011-12<br />
Crop<br />
Present Export Volumes 1<br />
in tons during 2006-07<br />
Projected Export Volume<br />
in tons during 2011-12<br />
Fruits 324526 1 681508<br />
Vegetables 1654252 1 3540099<br />
Ginger 7500 2 15000<br />
Turmeric 51500 2 77234<br />
Sesame 233345 3 483234<br />
Soyameal 4196245 4 7500000<br />
Cotton 1001718 5 2150000<br />
Total 7469086 14447075<br />
Sources: 1 <strong>APEDA</strong> database<br />
2 Export www.indianspices.com<br />
3<br />
Export www.trademap.com<br />
4 SOPA, Indore www.sopa.org<br />
5 CCI, Mumbai<br />
8000000<br />
India's Export and Future Projections<br />
Quantity (in tons)<br />
7000000<br />
6000000<br />
5000000<br />
4000000<br />
3000000<br />
2000000<br />
1000000<br />
0<br />
Fruits<br />
Vegetables<br />
Ginger<br />
Turmeric<br />
Sesame<br />
Soyameal<br />
Cotton<br />
Present Export (2006-07) Projected Export (2011-12)<br />
Fig. 18<br />
110