Report of the Joint Study Group on the Feasibility of India-Indonesia ...
Report of the Joint Study Group on the Feasibility of India-Indonesia ...
Report of the Joint Study Group on the Feasibility of India-Indonesia ...

You also want an ePaper? Increase the reach of your titles
YUMPU automatically turns print PDFs into web optimized ePapers that Google loves.
17<br />
spacecraft, and parts <str<strong>on</strong>g>the</str<strong>on</strong>g>re<str<strong>on</strong>g>of</str<strong>on</strong>g>; Ships, boats and o<str<strong>on</strong>g>the</str<strong>on</strong>g>r floating structures; Residues, wastes <str<strong>on</strong>g>of</str<strong>on</strong>g><br />
food industry, animal fodder; Manmade staple fibres.<br />
II.5. Analysis <str<strong>on</strong>g>of</str<strong>on</strong>g> Tariff Structure vis-à-vis Imports<br />
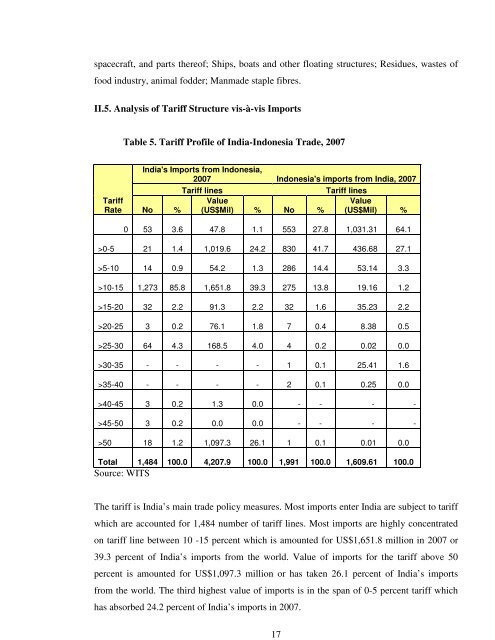
Table 5. Tariff Pr<str<strong>on</strong>g>of</str<strong>on</strong>g>ile <str<strong>on</strong>g>of</str<strong>on</strong>g> <strong>India</strong>-Ind<strong>on</strong>esia Trade, 2007<br />
Tariff<br />
Rate<br />
<strong>India</strong>'s Imports from Ind<strong>on</strong>esia,<br />
2007 Ind<strong>on</strong>esia's imports from <strong>India</strong>, 2007<br />
Tariff lines<br />
Tariff lines<br />
No %<br />
Value<br />
(US$Mil) % No %<br />
Value<br />
(US$Mil) %<br />
0 53 3.6 47.8 1.1 553 27.8 1,031.31 64.1<br />
>0-5 21 1.4 1,019.6 24.2 830 41.7 436.68 27.1<br />
>5-10 14 0.9 54.2 1.3 286 14.4 53.14 3.3<br />
>10-15 1,273 85.8 1,651.8 39.3 275 13.8 19.16 1.2<br />
>15-20 32 2.2 91.3 2.2 32 1.6 35.23 2.2<br />
>20-25 3 0.2 76.1 1.8 7 0.4 8.38 0.5<br />
>25-30 64 4.3 168.5 4.0 4 0.2 0.02 0.0<br />
>30-35 - - - - 1 0.1 25.41 1.6<br />
>35-40 - - - - 2 0.1 0.25 0.0<br />
>40-45 3 0.2 1.3 0.0 - - - -<br />
>45-50 3 0.2 0.0 0.0 - - - -<br />
>50 18 1.2 1,097.3 26.1 1 0.1 0.01 0.0<br />
Total 1,484 100.0 4,207.9 100.0 1,991 100.0 1,609.61 100.0<br />
Source: WITS<br />
The tariff is <strong>India</strong>’s main trade policy measures. Most imports enter <strong>India</strong> are subject to tariff<br />
which are accounted for 1,484 number <str<strong>on</strong>g>of</str<strong>on</strong>g> tariff lines. Most imports are highly c<strong>on</strong>centrated<br />
<strong>on</strong> tariff line between 10 -15 percent which is amounted for US$1,651.8 milli<strong>on</strong> in 2007 or<br />
39.3 percent <str<strong>on</strong>g>of</str<strong>on</strong>g> <strong>India</strong>’s imports from <str<strong>on</strong>g>the</str<strong>on</strong>g> world. Value <str<strong>on</strong>g>of</str<strong>on</strong>g> imports for <str<strong>on</strong>g>the</str<strong>on</strong>g> tariff above 50<br />
percent is amounted for US$1,097.3 milli<strong>on</strong> or has taken 26.1 percent <str<strong>on</strong>g>of</str<strong>on</strong>g> <strong>India</strong>’s imports<br />
from <str<strong>on</strong>g>the</str<strong>on</strong>g> world. The third highest value <str<strong>on</strong>g>of</str<strong>on</strong>g> imports is in <str<strong>on</strong>g>the</str<strong>on</strong>g> span <str<strong>on</strong>g>of</str<strong>on</strong>g> 0-5 percent tariff which<br />
has absorbed 24.2 percent <str<strong>on</strong>g>of</str<strong>on</strong>g> <strong>India</strong>’s imports in 2007.