Report of the Joint Study Group on the Feasibility of India-Indonesia ...
Report of the Joint Study Group on the Feasibility of India-Indonesia ...
Report of the Joint Study Group on the Feasibility of India-Indonesia ...

Create successful ePaper yourself
Turn your PDF publications into a flip-book with our unique Google optimized e-Paper software.
13<br />
1994 252.62 283.20 -30.58<br />
1995 500.69 383.67 117.02<br />
1996 569.04 578.35 -9.30<br />
1997 475.93 698.38 -222.45<br />
1998 248.45 804.73 -556.28<br />
1999 290.73 926.38 -635.65<br />
2000 385.80 922.35 -536.55<br />
2001 442.05 1159.33 -717.28<br />
2002 753.80 1294.86 -541.06<br />
2003 1053.10 1936.78 -883.68<br />
2004 1251.22 2412.06 -1160.84<br />
2005 1361.73 2854.61 -1492.88<br />
2006 1279.48 3729.87 -2450.39<br />
2007 1463.28 5438.30 -3975.02<br />
2008* 1,816.07 5,042.00 -3,225.93<br />
Note * Ap-Dec *Source : Ministry <str<strong>on</strong>g>of</str<strong>on</strong>g> Commerceand Industry, Governmet <str<strong>on</strong>g>of</str<strong>on</strong>g><br />
<strong>India</strong><br />
Source: IMF DOTS Yearbook, February 2009<br />
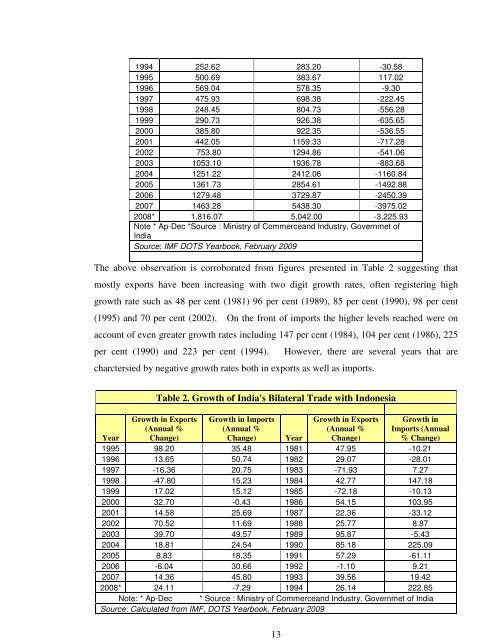
The above observati<strong>on</strong> is corroborated from figures presented in Table 2 suggesting that<br />
mostly exports have been increasing with two digit growth rates, <str<strong>on</strong>g>of</str<strong>on</strong>g>ten registering high<br />
growth rate such as 48 per cent (1981) 96 per cent (1989), 85 per cent (1990), 98 per cent<br />
(1995) and 70 per cent (2002). On <str<strong>on</strong>g>the</str<strong>on</strong>g> fr<strong>on</strong>t <str<strong>on</strong>g>of</str<strong>on</strong>g> imports <str<strong>on</strong>g>the</str<strong>on</strong>g> higher levels reached were <strong>on</strong><br />
account <str<strong>on</strong>g>of</str<strong>on</strong>g> even greater growth rates including 147 per cent (1984), 104 per cent (1986), 225<br />
per cent (1990) and 223 per cent (1994).<br />
However, <str<strong>on</strong>g>the</str<strong>on</strong>g>re are several years that are<br />
charctersied by negative growth rates both in exports as well as imports.<br />
Table 2. Growth <str<strong>on</strong>g>of</str<strong>on</strong>g> <strong>India</strong>'s Bilateral Trade with Ind<strong>on</strong>esia<br />
Growth in Exports<br />
(Annual %<br />
Change)<br />
Growth in Imports<br />
(Annual %<br />
Change)<br />
Growth in Exports<br />
(Annual %<br />
Change)<br />
Growth in<br />
Imports (Annual<br />
% Change)<br />
Year<br />
Year<br />
1995 98.20 35.48 1981 47.95 -10.21<br />
1996 13.65 50.74 1982 29.07 -28.01<br />
1997 -16.36 20.75 1983 -71.93 7.27<br />
1998 -47.80 15.23 1984 42.77 147.18<br />
1999 17.02 15.12 1985 -72.18 -10.13<br />
2000 32.70 -0.43 1986 54.15 103.95<br />
2001 14.58 25.69 1987 22.36 -33.12<br />
2002 70.52 11.69 1988 25.77 8.87<br />
2003 39.70 49.57 1989 95.87 -5.43<br />
2004 18.81 24.54 1990 85.18 225.09<br />
2005 8.83 18.35 1991 57.29 -61.11<br />
2006 -6.04 30.66 1992 -1.10 9.21<br />
2007 14.36 45.80 1993 39.56 19.42<br />
2008* 24.11 -7.29 1994 26.14 222.85<br />
Note: * Ap-Dec * Source : Ministry <str<strong>on</strong>g>of</str<strong>on</strong>g> Commerceand Industry, Governmet <str<strong>on</strong>g>of</str<strong>on</strong>g> <strong>India</strong><br />
Source: Calculated from IMF, DOTS Yearbook, February 2009