The energy benefit of stainless steel recycling - British Stainless ...
The energy benefit of stainless steel recycling - British Stainless ...
The energy benefit of stainless steel recycling - British Stainless ...

Create successful ePaper yourself
Turn your PDF publications into a flip-book with our unique Google optimized e-Paper software.
ARTICLE IN PRESS<br />
Energy Policy ] (]]]]) ]]]–]]]<br />
www.elsevier.com/locate/enpol<br />
<strong>The</strong> <strong>energy</strong> <strong>benefit</strong> <strong>of</strong> <strong>stainless</strong> <strong>steel</strong> <strong>recycling</strong><br />
Jeremiah Johnson a,b, , B.K. Reck b , T. Wang b , T.E. Graedel b<br />
a Program in Environmental Engineering, Yale University, New Haven, CT, USA<br />
b Center for Industrial Ecology, School <strong>of</strong> Forestry and Environmental Studies, Yale University, 205 Prospect Street, New Haven, CT 02140, USA<br />
Received 5 December 2006; accepted 21 August 2007<br />
Abstract<br />
<strong>The</strong> <strong>energy</strong> used to produce austenitic <strong>stainless</strong> <strong>steel</strong> was quantified throughout its entire life cycle for three scenarios: (1) current global<br />
operations, (2) 100% <strong>recycling</strong>, and (3) use <strong>of</strong> only virgin materials. Data are representative <strong>of</strong> global average operations in the early<br />
2000s. <strong>The</strong> primary <strong>energy</strong> requirements to produce 1 metric ton <strong>of</strong> austenitic <strong>stainless</strong> <strong>steel</strong> (with assumed metals concentrations <strong>of</strong> 18%<br />
Cr, 8% Ni, and 74% Fe) is (1) 53 GJ, (2) 26 GJ, and (3) 79 GJ for each scenario, with CO 2 releases totaling (1) 3.6 metric tons CO 2 , (2) 1.6<br />
metric tons CO 2 , and (3) 5.3 metric tons CO 2 . Thus, the production <strong>of</strong> 17 million metric tons <strong>of</strong> austenitic <strong>stainless</strong> <strong>steel</strong> in 2004 used<br />
approximately 9.0 10 17 J <strong>of</strong> primary <strong>energy</strong> and released 61 million metric tons <strong>of</strong> CO 2 . Current <strong>recycling</strong> operations reduce <strong>energy</strong> use<br />
by 33% (4.4 10 17 J) and CO 2 emissions by 32% (29 million tons). If austenitic <strong>stainless</strong> <strong>steel</strong> were to be produced solely from scrap,<br />
which is currently not possible on a global level due to limited availability, <strong>energy</strong> use would be 67% less than virgin-based production<br />
and CO 2 emissions would be cut by 70%. <strong>The</strong> calculation <strong>of</strong> the total <strong>energy</strong> is most sensitive to the amount and type <strong>of</strong> scrap fed into the<br />
electric arc furnace, the unit <strong>energy</strong> <strong>of</strong> the electric arc furnace, the unit <strong>energy</strong> <strong>of</strong> ferrochromium production, and the form <strong>of</strong> primary<br />
nickel.<br />
r 2007 Elsevier Ltd. All rights reserved.<br />
Keywords: <strong>Stainless</strong> <strong>steel</strong>; Energy intensity; Recycling<br />
1. Introduction<br />
<strong>Stainless</strong> <strong>steel</strong>, which contains iron, chromium, and <strong>of</strong>ten<br />
nickel, molybdenum, and other elements, is an alloy with<br />
applications ranging from household cutlery to reactor<br />
tanks for the chemical industry. Its anti-corrosion properties<br />
are among the main driving forces for the 25 million<br />
metric tons <strong>of</strong> production in 2004 (International Chromium<br />
Development Association, 2006). Ferroalloy production<br />
and the fabrication <strong>of</strong> <strong>stainless</strong> <strong>steel</strong> in electric arc<br />
furnaces are <strong>energy</strong>-intensive processes. By examining the<br />
<strong>energy</strong> requirements to produce <strong>stainless</strong> <strong>steel</strong> throughout<br />
the entire life cycle, and isolating the effect <strong>of</strong> scrap<br />
<strong>recycling</strong> on <strong>energy</strong> use, one can understand the true <strong>energy</strong><br />
needs and opportunities for conservation. <strong>The</strong> World<br />
Commission on Environment and Development (1987)<br />
Corresponding author. 20 Mead Street, Cambridge, MA 02140, USA.<br />
Tel.: +1 44 203 506 9439; fax: +1 44 203 413 6362.<br />
E-mail address: jeremiah.johnson@aya.yale.edu (J. Johnson).<br />
found that a ‘‘low <strong>energy</strong> path is the best way toward a<br />
sustainable future’’. Determining the <strong>energy</strong> intensities <strong>of</strong><br />
materials (i.e., the <strong>energy</strong> required per unit mass) under<br />
different scenarios aides in understanding and identifying<br />
this low-<strong>energy</strong> path.<br />
<strong>The</strong> goals <strong>of</strong> this study are to quantify the use <strong>of</strong> <strong>energy</strong> in<br />
the production <strong>of</strong> 1 ton <strong>of</strong> austenitic (i.e., nickel-containing)<br />
<strong>stainless</strong>-<strong>steel</strong> slab under three scenarios: (1) the base case<br />
scenario, ‘‘Current Operations,’’ examines the global average<br />
operations <strong>of</strong> the <strong>stainless</strong> <strong>steel</strong> and ferroalloy industries in<br />
the early 2000s, (2) the ‘‘Maximum Recycling’’ scenario<br />
calculates the <strong>energy</strong> used if demand is completely met from<br />
recycled material, and (3) the ‘‘Virgin Production’’ scenario<br />
examines <strong>stainless</strong>-<strong>steel</strong> production in the absence <strong>of</strong> scrap. A<br />
systems approach will be employed; the entire life cycle <strong>of</strong> the<br />
material (and the associated <strong>energy</strong> demands <strong>of</strong> its transformations)<br />
from mining and/or scrap <strong>recycling</strong> through<br />
production will be examined. By comparing the results <strong>of</strong><br />
these scenarios, one can quantify the <strong>energy</strong> that is saved by<br />
current <strong>recycling</strong> practices and the <strong>energy</strong> that could be saved<br />
0301-4215/$ - see front matter r 2007 Elsevier Ltd. All rights reserved.<br />
doi:10.1016/j.enpol.2007.08.028<br />
Please cite this article as: Johnson, J., et al., <strong>The</strong> <strong>energy</strong> <strong>benefit</strong> <strong>of</strong> <strong>stainless</strong> <strong>steel</strong> <strong>recycling</strong>. Energy Policy (2007), doi:10.1016/j.enpol.2007.08.028
2<br />
ARTICLE IN PRESS<br />
J. Johnson et al. / Energy Policy ] (]]]]) ]]]–]]]<br />
if ample scrap were available and <strong>recycling</strong> rates reached<br />
100%. <strong>The</strong> unit <strong>energy</strong> demands are also linked to CO 2<br />
emission factors, which provide a carbon intensity per unit <strong>of</strong><br />
<strong>stainless</strong> <strong>steel</strong> produced.<br />
Energy analyses can track use from numerous points <strong>of</strong><br />
reference, such as a facility, a process, or a substance. <strong>The</strong><br />
utility <strong>of</strong> <strong>energy</strong> analyses that focus on substances (such as<br />
this study) includes gaining knowledge <strong>of</strong> a material’s<br />
comprehensive <strong>energy</strong> requirements, the releases <strong>of</strong> pollutants<br />
associated with such <strong>energy</strong> use, and the <strong>energy</strong>related<br />
consequences <strong>of</strong> altering material use patterns.<br />
Norgate (2004) reviews the effect <strong>of</strong> metal <strong>recycling</strong> on lifecycle<br />
performance for a suite <strong>of</strong> metals and pays particular<br />
attention to <strong>energy</strong> requirements. He finds the gross <strong>energy</strong><br />
requirements for the production <strong>of</strong> <strong>stainless</strong> <strong>steel</strong> from<br />
primary sources to be 75 GJ/ton (note: 1 GJ ¼ 10 9 J) when<br />
ferronickel is used as the primary nickel feed source and<br />
49 GJ/ton when nickel metal is used, with ferronickel using<br />
59% <strong>of</strong> the total <strong>energy</strong> in the former case (Norgate et al.,<br />
2004). This latter study also isolated the effects <strong>of</strong> different<br />
fuel sources for electricity generation.<br />
In an extensive information circular entitled ‘‘Energy<br />
Use Patterns for Metal Recycling’’ released in 1978, Kusik<br />
and Kenahan at the US Bureau <strong>of</strong> Mines, collected data on<br />
the <strong>energy</strong> requirements for <strong>recycling</strong> a variety <strong>of</strong> metals,<br />
including aluminum, copper, iron and <strong>steel</strong>, lead, nickel,<br />
<strong>stainless</strong> <strong>steel</strong>, tin, titanium, and zinc. Worrell et al. (2001)<br />
examined historical trends in iron and <strong>steel</strong> <strong>energy</strong> use, and<br />
quantified the <strong>energy</strong> and carbon dioxide <strong>benefit</strong> <strong>of</strong><br />
implementing 47 <strong>energy</strong>-efficient technologies to the US<br />
<strong>energy</strong> sector.<br />
In 2000, Michaelis and Jackson (2000a, b) detailed the<br />
<strong>energy</strong> flows associated with the iron and <strong>steel</strong> industries in<br />
the United Kingdom. Mining, iron and <strong>steel</strong> production,<br />
<strong>steel</strong> good manufacture, <strong>steel</strong> good use, trade, <strong>recycling</strong> and<br />
scrap, and transportation were considered. Much like the<br />
study presented here, their study was grounded in a<br />
material flow analysis approach that determined the mass<br />
flows <strong>of</strong> their target substances.<br />
<strong>The</strong> International Institute for Applied Systems Analysis<br />
(IIASA) has created a model called CO2DB, based on<br />
<strong>energy</strong> chain analysis, which is comparable to life-cycle<br />
assessment (Strubegger, 2003). This model contains data<br />
for over 3000 technologies in order to enable the user to<br />
link and assess their technical, economic, and environmental<br />
characteristics.<br />
Other related research projects include <strong>energy</strong> requirements<br />
<strong>of</strong> the Indian <strong>steel</strong> industry (Bhaktavatsalam and<br />
Choudhury, 1995) and its ability for <strong>energy</strong> conservation<br />
(Choudhury and Bhaktavatsalam, 1997), and the <strong>energy</strong><br />
requirements and carbon dioxide emissions <strong>of</strong> the Indian<br />
aluminum industry (Das and Kandpal, 2000). On a<br />
broader scale, a report for the United Nations Division<br />
for Sustainable Development examined the potential for<br />
improved <strong>energy</strong> and material efficiencies for several<br />
sectors, and identified barriers to implementation and<br />
potential policy instruments (Worrell et al., 1996).<br />
2. Methodology<br />
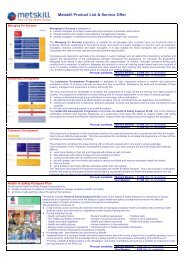
A simplified system boundary diagram, which guides<br />
and bounds this study, was created for the <strong>stainless</strong>-<strong>steel</strong><br />
cycle and is shown in Fig. 1a. It includes the major<br />
processes associated with the production <strong>of</strong> primary<br />
chromium, nickel, and iron, the preparation <strong>of</strong> scrap, the<br />
smelting <strong>of</strong> <strong>stainless</strong> <strong>steel</strong>, and the transportation <strong>of</strong> nine<br />
intermediate products. Within each <strong>of</strong> these major processes,<br />
there are numerous unit operations that utilize<br />
<strong>energy</strong> in various forms. Fig. 1b illustrates an example <strong>of</strong><br />
<strong>energy</strong> use for one <strong>of</strong> these processes: ferrochromium<br />
production. This figure is representative <strong>of</strong> Outokumpu<br />
processes and differs from the traditional, Premus, and DC<br />
arc technologies, which are also included in this study. As<br />
shown in Fig. 1b, the primary <strong>energy</strong> requirements <strong>of</strong><br />
electricity generation and the <strong>energy</strong> used to produce<br />
primary fuels (e.g., coal, petroleum, and natural gas) are<br />
included in this study’s scope. <strong>The</strong> functional unit used<br />
herein is the production <strong>of</strong> 1 metric ton <strong>of</strong> 304 grade<br />
austenitic <strong>stainless</strong> <strong>steel</strong>, assumed to contain 74% iron,<br />
18% chromium, and 8% nickel.<br />
To quantify the <strong>energy</strong> requirements <strong>of</strong> the entire life<br />
cycle in <strong>stainless</strong>-<strong>steel</strong> production, one must thoroughly<br />
understand material flows and losses. This project relies on<br />
the findings on three material flow analysis projects,<br />
conducted by the Yale Stocks and Flows research staff,<br />
for iron (Wang et al., 2007), chromium (Johnson et al.,<br />
2006), and nickel (Reck et al., 2007), in which all<br />
anthropogenic flows for each element were quantified for<br />
approximately 60 countries. <strong>The</strong> global elemental loss rates<br />
associated with each production process are given in Table<br />
1. Material flow data are representative <strong>of</strong> the year 2000<br />
and unit <strong>energy</strong> use data are those that are most recently<br />
available, generally from the early 2000s.<br />
Three scenarios were examined: (1) ‘‘Current Operations’’<br />
assumes a weighted global average <strong>of</strong> scrap <strong>recycling</strong><br />
rates; (2) ‘‘Maximum Recycling’’ assumes that all metal<br />
used in <strong>stainless</strong>-<strong>steel</strong> production comes from scrap; and<br />
(3) ‘‘Virgin Production’’ assumes that all metal used in<br />
<strong>stainless</strong>-<strong>steel</strong> production comes from virgin sources. <strong>The</strong>se<br />
scenarios differ only in the proportions <strong>of</strong> primary and<br />
secondary metals used; unit <strong>energy</strong> for such things as<br />
transportation and mining, as well as material loss rates,<br />
are held constant and varied only by the amount <strong>of</strong> mass<br />
that passes through each subprocess. Because <strong>of</strong> limited<br />
scrap availability, Maximum Recycling could not be<br />
achieved on a global level. Virgin Production is also<br />
unlikely, due to the preponderance <strong>of</strong> scrap use in the<br />
<strong>stainless</strong>-<strong>steel</strong> industry. <strong>The</strong>se two scenarios are intended to<br />
show the outer bounds <strong>of</strong> material and <strong>energy</strong> use, serving<br />
as a basis for comparing current global performance.<br />
For the Current Operations scenario, the average share<br />
<strong>of</strong> secondary material (i.e., scrap) added to the <strong>stainless</strong><strong>steel</strong><br />
melt was 42% for chromium, 43% for nickel, and<br />
67% for iron. <strong>The</strong> Maximum Recycling scenario assumes<br />
total <strong>recycling</strong> (a hypothetical situation on a global level,<br />
Please cite this article as: Johnson, J., et al., <strong>The</strong> <strong>energy</strong> <strong>benefit</strong> <strong>of</strong> <strong>stainless</strong> <strong>steel</strong> <strong>recycling</strong>. Energy Policy (2007), doi:10.1016/j.enpol.2007.08.028
ARTICLE IN PRESS<br />
J. Johnson et al. / Energy Policy ] (]]]]) ]]]–]]] 3<br />
Fig. 1. (a) System boundary diagram for the <strong>stainless</strong>-<strong>steel</strong> life cycle; (b) <strong>energy</strong> used for the production <strong>of</strong> ferrochromium, representative <strong>of</strong> Outokumpu<br />
processes.<br />
requiring adequate scrap availability), while the Virgin<br />
Production scenario assumes no scrap <strong>recycling</strong>. <strong>The</strong> scrap<br />
that is utilized in Current Operations and Maximum<br />
Recycling can be prompt scrap (internal to the process),<br />
new scrap from industrial processes, or old scrap for postconsumer<br />
discards. Any and all <strong>of</strong> these forms are used to<br />
meet scrap requirements. Although the primary units <strong>of</strong><br />
chromium are predominately in the form <strong>of</strong> ferrochromium<br />
and primary iron is assumed to come from direct reduced<br />
iron (DRI), primary nickel may come from ferronickel,<br />
refined nickel, or nickel oxide sinter. <strong>The</strong> share <strong>of</strong> primary<br />
nickel used for <strong>stainless</strong>-<strong>steel</strong> production was assumed<br />
to be 30%, 65%, and 5%, respectively, for each <strong>of</strong><br />
these forms.<br />
<strong>The</strong> indirect (or ‘‘hidden’’) <strong>energy</strong> use throughout the life<br />
cycle makes a significant contribution to total <strong>energy</strong> use.<br />
To capture as much <strong>of</strong> this indirect <strong>energy</strong> use as possible,<br />
the following factors were included in the system boundary:<br />
(1) the <strong>energy</strong> used in electricity production; (2) the<br />
<strong>energy</strong> used in the acquisition and production <strong>of</strong> fuels; and<br />
(3) intermediate good transportation by ship, rail, and<br />
truck. <strong>The</strong>re are other indirect <strong>energy</strong> use factors that, for<br />
tractability, were not included in this study. To assess the<br />
magnitude <strong>of</strong> these other factors, economic input–output<br />
life-cycle assessment (EIO-LCA) was employed. (Carnegie<br />
Mellon University Green Design Institute, 2007) <strong>The</strong><br />
categories that are included in this study (e.g., ‘‘ferroalloy<br />
and related product manufacturing’’) account for 87% <strong>of</strong><br />
Please cite this article as: Johnson, J., et al., <strong>The</strong> <strong>energy</strong> <strong>benefit</strong> <strong>of</strong> <strong>stainless</strong> <strong>steel</strong> <strong>recycling</strong>. Energy Policy (2007), doi:10.1016/j.enpol.2007.08.028
4<br />
ARTICLE IN PRESS<br />
J. Johnson et al. / Energy Policy ] (]]]]) ]]]–]]]<br />
Table 1<br />
Elemental losses <strong>of</strong> production processes associated with <strong>stainless</strong> <strong>steel</strong><br />
and its alloying elements<br />
Process Losses Source<br />
Chromite mining and separation<br />
losses<br />
17% <strong>of</strong> chromium<br />
mined<br />
Johnson et al.<br />
(2006)<br />
Ferrochromium production losses 20% <strong>of</strong> chromium Johnson et al.<br />
(2006)<br />
Nickel mining and separation losses 20% <strong>of</strong> nickel mined Reck et al.<br />
(2007)<br />
Ferronickel production losses 5% <strong>of</strong> nickel Reck et al.<br />
(2007)<br />
Nickel oxide sinter production<br />
losses<br />
5% <strong>of</strong> nickel Reck et al.<br />
(2007)<br />
Refined nickel production losses Negligible Reck et al.<br />
(2007)<br />
Iron mining and separation losses 19% <strong>of</strong> iron mined Wang et al.<br />
(2007)<br />
Direct reduced iron production<br />
losses<br />
0.43% <strong>of</strong> iron Wang et al.<br />
(2007)<br />
<strong>Stainless</strong>-<strong>steel</strong> smelting in an electric 1.4% <strong>of</strong> entering Johnson et al.<br />
arc furnace<br />
chromium (2006)<br />
0.7% <strong>of</strong> entering<br />
nickel<br />
Reck et al.<br />
(2007)<br />
1.8% <strong>of</strong> entering<br />
iron<br />
Wang et al.<br />
(2007)<br />
the <strong>energy</strong> use results <strong>of</strong> the EIO-LCA findings. <strong>The</strong><br />
remaining 13% includes such items as ‘‘water transportation,’’<br />
‘‘paper and paperboard mills,’’ and ‘‘petroleum<br />
lubricating oil and grease manufacturing,’’ which were<br />
determined to be outside the scope <strong>of</strong> this analysis. It is<br />
important to note that this study captures the first-degree<br />
<strong>energy</strong> use; it does not, for example, account for the <strong>energy</strong><br />
use to make <strong>steel</strong> that is used in the construction <strong>of</strong> the<br />
capital equipment at a <strong>stainless</strong>-<strong>steel</strong> smelter. <strong>The</strong>refore, it<br />
can be estimated that this study captures, at most, 87% <strong>of</strong><br />
the life cycle primary <strong>energy</strong> use.<br />
It is essential when quantifying <strong>energy</strong> use to consistently<br />
look at the primary <strong>energy</strong>. To do so, it was necessary to<br />
link electricity consumption with the fuel needed to<br />
generate that electricity. On a country-level basis, electricity<br />
generation data and fuel consumption rates (International<br />
Energy Agency, 2004a, b) were used to calculate the<br />
country-wide efficiency <strong>of</strong> electricity generation. <strong>The</strong><br />
International Energy Agency’s hybrid substitution method<br />
was employed, meaning that hydropower was assumed to<br />
be 100% efficient and the substitution equivalence (i.e., the<br />
efficiency <strong>of</strong> fossil fuel-based generation) was assumed for<br />
other non-fuel-based generation means. In addition, the<br />
<strong>energy</strong> required in the production, refining, and transportation<br />
<strong>of</strong> coal, petroleum, and natural gas is accounted for,<br />
using the results <strong>of</strong> three studies by the National Renewable<br />
Energy Laboratory that detailed the life-cycle impacts<br />
<strong>of</strong> these fuels (Sheehan et al., 1998; Spath et al., 1999;<br />
Spath and Mann, 2000.<br />
To quantify the <strong>energy</strong> required for mining and<br />
beneficiation processes, several data sources were used.<br />
Anecdotal evidence <strong>of</strong> mine blasting showed that approximately<br />
6 ton <strong>of</strong> explosives are required to mobilize<br />
30,000 ton <strong>of</strong> rock (Bergstrom, 2005). Assuming an <strong>energy</strong><br />
content <strong>of</strong> 2.7 MJ/kg <strong>of</strong> TNT (note: 1 MJ ¼ 10 6 J),<br />
relatively small <strong>energy</strong> expenditures result; although much<br />
power is required during the blast, it is only needed over a<br />
short period <strong>of</strong> time. Liquid fuel use for heavy equipment<br />
was estimated using data from a generic mine provided<br />
by Western Mine (2006). <strong>The</strong> data stated that 1.1 l <strong>of</strong><br />
diesel fuel was required per ton <strong>of</strong> ore, with an assumed<br />
lower heating value <strong>of</strong> 128,400 BTU/gallon, resulting in<br />
38 MJ/ton ore.<br />
For chromite beneficiation, it was found that the<br />
concentrator requires 40 kWh/ton <strong>of</strong> ore feed and the<br />
grinder uses 10 kWh/ton <strong>of</strong> mill feed (Bergstrom, 2005).<br />
Iron mining was shown to require approximately 87 MJ/<br />
ton ore, predominately in liquid fuels, and beneficiation<br />
used 12.4 MJ/ton ore in electricity (US Department <strong>of</strong><br />
Energy, 2002). Nickel mining processes differ for sulfide<br />
and laterite ores; in this model, it is assumed that refined<br />
nickel was produced from sulfide ores and ferronickel and<br />
nickel oxide sinter were produced from laterite ores. Data<br />
for diesel and electricity use during nickel mining and<br />
concentrating were taken from a study by Norgate and<br />
Rankin (2000). Although the primary data sources used in<br />
this study were from the early 1990s, nickel mining and<br />
concentrating are minor contributors to the overall <strong>energy</strong><br />
used in <strong>stainless</strong>-<strong>steel</strong> production, so this is not believed to<br />
have a significant effect on the final results. Country-level<br />
production rates for chromium, iron, and nickel, used to<br />
determine the primary fuel associated with electricity<br />
generation, were taken from the International Chromium<br />
Development Association (2006) and the United States<br />
Geological Survey (USGS) (Jorgenson and William, 2003;<br />
Kuck, 2005).<br />
Ferrochromium production involves four major production<br />
methods: traditional, Outokumpu, Premus, and DC<br />
arc. <strong>The</strong> total production share by mass <strong>of</strong> these methods<br />
was estimated to be 60%, 25%, 10%, and 5%, respectively.<br />
Electricity demands for each technology were assumed to<br />
be 4.0, 3.3, 2.4, and 4.8 MWh/ton <strong>of</strong> FeCr and reductant<br />
(e.g., coke) demands were 0.60, 0.52, 0.20, and 0 ton coke/<br />
ton <strong>of</strong> FeCr, respectively (Daavittila et al., 2004; McLaughlan,<br />
2006; Niemela¨, 2001). A lower heating value <strong>of</strong><br />
28.8 MJ/kg coke was assumed (United States Geological<br />
Survey, 2006) and country-level FeCr production data were<br />
taken from ICDA (2006).<br />
<strong>The</strong> average electricity, coal, oil, and natural gas<br />
consumption for six ferronickel producers were used<br />
(Kerfoot, 2002). To quantify the <strong>energy</strong> used to produce<br />
refined nickel, the results for matte production were added<br />
to nickel refinery data (Kerfoot, 2002). Laterite smelting<br />
unit <strong>energy</strong> was a based on a comprehensive survey <strong>of</strong><br />
global smelters (Warner et al., 2006). Data for nickel oxide<br />
sinter production were taken from a life-cycle assessment<br />
conducted by the Nickel Institute (2006) <strong>The</strong> results <strong>of</strong> this<br />
life-cycle assessment were also used to check the accuracy<br />
<strong>of</strong> the ferronickel and refined nickel calculations; the results<br />
Please cite this article as: Johnson, J., et al., <strong>The</strong> <strong>energy</strong> <strong>benefit</strong> <strong>of</strong> <strong>stainless</strong> <strong>steel</strong> <strong>recycling</strong>. Energy Policy (2007), doi:10.1016/j.enpol.2007.08.028
ARTICLE IN PRESS<br />
J. Johnson et al. / Energy Policy ] (]]]]) ]]]–]]] 5<br />
<strong>of</strong> this study were close for ferronickel and significantly<br />
lower for refined nickel. Country-level production data<br />
were obtained from the International Nickel Study Group<br />
(2004).<br />
<strong>The</strong> <strong>energy</strong> required to produce DRI was estimated from<br />
seven production methods. Based on a weighted average <strong>of</strong><br />
each method’s global plant capacity, the average reductant<br />
and electricity use were determined to be 11.3 GJ <strong>of</strong> natural<br />
gas/ton DRI and 99 kWh/ton DRI, respectively (Oeters<br />
et al., 2006). Country-level production was taken from the<br />
International Iron and Steel Institute (2005).<br />
Data for <strong>stainless</strong>-<strong>steel</strong> electric arc furnaces were taken<br />
from Outokumpu (2006), who detailed use <strong>of</strong> electricity<br />
propane, carbon monoxide, natural gas, and fuel oil.<br />
Country-level <strong>stainless</strong>-<strong>steel</strong> production was taken from<br />
ICDA (2006). Scrap is processed and prepared using<br />
presses, shears, bundlers, cutting, and crushing, with most<br />
<strong>of</strong> the <strong>energy</strong> being used in the form <strong>of</strong> electricity. An<br />
analysis <strong>of</strong> six scrap-processing facilities yielded an average<br />
electricity consumption <strong>of</strong> 6.8 kWh/ton scrap.<br />
<strong>The</strong> <strong>energy</strong> requirements for transportation <strong>of</strong> all<br />
intermediate goods were also quantified. Matrices were<br />
created that detailed the mass <strong>of</strong> each intermediate good by<br />
the exporting country and the importing country, including<br />
chromite ore and concentrate (International Chromium<br />
Development Association, 2006), ferrochromium (International<br />
Chromium Development Association, 2006),<br />
blended and concentrated nickel ore (International Nickel<br />
Study Group, 2004), ferronickel (Kuck, 2005), refined<br />
nickel (International Nickel Study Group, 2004), nickel<br />
oxide sinter (International Nickel Study Group, 2004), iron<br />
ore and concentrate (United Nations Comtrade Database,<br />
2006) and DRI (United Nations Comtrade Database,<br />
2006). While there is certainly the potential for hundreds <strong>of</strong><br />
country-to-country exchanges, it was found that 95% <strong>of</strong><br />
the traded mass could be accounted for by less than 50<br />
exchanges per material. By assuming trade routes and<br />
means <strong>of</strong> transfer, the distances between the exporters and<br />
the importers were used to create an average distance<br />
traveled by each transport method. <strong>The</strong> collection and<br />
transportation <strong>of</strong> scrap is difficult to estimate with high<br />
certainty due to the high variability <strong>of</strong> transportation<br />
distances and the lack <strong>of</strong> detailed trade data. Discussions<br />
with experts in the scrap industry and internal calculations<br />
based on the distances between major scrap-generating<br />
areas, collection areas, and <strong>stainless</strong>-<strong>steel</strong> smelters have<br />
lead to travel estimates <strong>of</strong> approximately 180 miles by<br />
truck, 160 miles by rail, and 2100 miles by ship. Using EIA<br />
<strong>energy</strong> intensities (US Department <strong>of</strong> Energy, 2006), the<br />
<strong>energy</strong> consumed per ton-mile was applied and the <strong>energy</strong><br />
use was calculated. (Note: the transportation <strong>of</strong> fabricated<br />
<strong>stainless</strong> <strong>steel</strong> is not included in this study; the end goal <strong>of</strong><br />
this study is to calculate the <strong>energy</strong> requirements to<br />
produce 1 ton <strong>of</strong> <strong>stainless</strong>-<strong>steel</strong> slab and that is where the<br />
system boundary ends.)<br />
<strong>The</strong> results <strong>of</strong> mining, alloy production, scrap preparation,<br />
<strong>stainless</strong>-<strong>steel</strong> smelting, and transportation <strong>of</strong> intermediates<br />
were aggregated to determine the total primary<br />
<strong>energy</strong> used to produce 1 ton <strong>of</strong> austenitic <strong>stainless</strong> <strong>steel</strong>.<br />
<strong>The</strong>se results were then coupled with CO 2 emission factors<br />
(Energy Information Administration, 2006), which include<br />
linking country-level electricity generation data to emissions<br />
by source.<br />
<strong>The</strong>re are many inputs to this model and all values<br />
contain a degree <strong>of</strong> uncertainty. In order to assess this<br />
uncertainty and variability, a Monte Carlo analysis was<br />
performed. A probabilistic method, such as a Monte Carlo<br />
analysis, provides more information than deterministic<br />
models, giving a range <strong>of</strong> results linked to their likelihood<br />
(McCleese and LaPuma, 2002). For each <strong>of</strong> the variables,<br />
including <strong>energy</strong> demands, material losses, transportation<br />
distances, scrap concentrations, and metal sourcing, an<br />
estimate was made <strong>of</strong> the uncertainty <strong>of</strong> the data. <strong>The</strong>se<br />
estimates were based on data variability and assumed<br />
confidence in their accuracy, with normal distributions<br />
around the weighted mean applied. Dependant variables<br />
were linked and 400 simulations were then run for each<br />
scenario to determine the range and distribution <strong>of</strong> the<br />
results.<br />
<strong>The</strong> model’s sensitivity to changes in each <strong>of</strong> these<br />
variables is also important. Forty-three <strong>of</strong> the variables<br />
included in the analysis were increased by 25% to examine<br />
the effect on the total primary <strong>energy</strong> <strong>of</strong> the Current<br />
Operations scenario.<br />
3. Results<br />
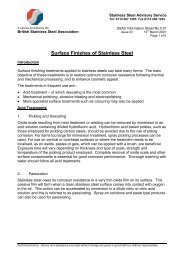
<strong>The</strong> <strong>energy</strong> used at each production process is underpinned<br />
by the amount <strong>of</strong> material that is required. Fig. 2<br />
details the material flows <strong>of</strong> chromium, nickel, and iron in<br />
the production <strong>of</strong> 1 ton <strong>of</strong> austenitic <strong>stainless</strong> <strong>steel</strong> under<br />
each <strong>of</strong> the three scenarios. <strong>The</strong> material flows shown in the<br />
figures represent the contained mass <strong>of</strong> the elements in each<br />
flow. For example, the flow into chromium mining for<br />
Current Operations (Fig. 2a) is 146 kg <strong>of</strong> contained<br />
chromium in ore; the total mass <strong>of</strong> the chromite ore is<br />
estimated to be 490 kg, a value that is not shown in this<br />
figure. It should also be noted that the iron contained in<br />
ferrochromium and ferronickel was not quantified for<br />
stages prior to alloy production (i.e., during the mining<br />
processes for chromium and nickel) and, therefore, is not<br />
shown in the figure.<br />
In order to achieve material balance for each <strong>of</strong><br />
the elements, the amount <strong>of</strong> austenitic, ferritic, and<br />
carbon <strong>steel</strong> scrap that is recycled has to correspond with<br />
<strong>recycling</strong> rates and material loss flows. In Fig. 2a, this<br />
constraint meant that only austenitic <strong>stainless</strong>-<strong>steel</strong> scrap<br />
and carbon <strong>steel</strong> scrap were included, so as to not have an<br />
overabundance <strong>of</strong> secondary chromium units that would<br />
have come with ferritic <strong>stainless</strong>-<strong>steel</strong> scrap <strong>recycling</strong>.<br />
Because it is known that ferritic scrap is included in actual<br />
production, this is a limitation <strong>of</strong> the material flow data<br />
and could be updated to improve the accuracy <strong>of</strong> this<br />
study.<br />
Please cite this article as: Johnson, J., et al., <strong>The</strong> <strong>energy</strong> <strong>benefit</strong> <strong>of</strong> <strong>stainless</strong> <strong>steel</strong> <strong>recycling</strong>. Energy Policy (2007), doi:10.1016/j.enpol.2007.08.028
6<br />
ARTICLE IN PRESS<br />
J. Johnson et al. / Energy Policy ] (]]]]) ]]]–]]]<br />
Fig. 2. Material flows <strong>of</strong> chromium, nickel, and iron required to produce 1 ton <strong>of</strong> austenitic <strong>stainless</strong> <strong>steel</strong>, ca. early 2000s, under (a) Current Operations,<br />
(b) Maximum Recycling, and (c) Virgin Production. Totals may not be additive due to rounding. DRI ¼ direct reduced iron; FeCr ¼ ferrochromium;<br />
FeNi ¼ ferronickel; and NiO ¼ nickel oxide.<br />
Please cite this article as: Johnson, J., et al., <strong>The</strong> <strong>energy</strong> <strong>benefit</strong> <strong>of</strong> <strong>stainless</strong> <strong>steel</strong> <strong>recycling</strong>. Energy Policy (2007), doi:10.1016/j.enpol.2007.08.028
ARTICLE IN PRESS<br />
J. Johnson et al. / Energy Policy ] (]]]]) ]]]–]]] 7<br />
Combining the results <strong>of</strong> the material flows with the unit<br />
<strong>energy</strong> use <strong>of</strong> each production process, the transportation<br />
matrices, and the country-level electricity generation<br />
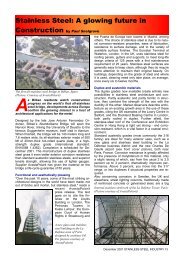
pr<strong>of</strong>iles resulted in quantification <strong>of</strong> the <strong>energy</strong> use. <strong>The</strong><br />
model produced distinct and significantly different results<br />
for each <strong>of</strong> the three scenarios. <strong>The</strong> Current Operations<br />
scenario required 53,000 MJ/ton <strong>of</strong> <strong>stainless</strong> <strong>steel</strong> produced,<br />
the Maximum Recycling scenario required<br />
26,000 MJ/ton, and the Virgin Production scenario required<br />
79,000 MJ/ton. Fig. 3 shows the resulting <strong>energy</strong><br />
requirement to produce 1 ton <strong>of</strong> austenitic <strong>stainless</strong> <strong>steel</strong>.<br />
<strong>The</strong> primary <strong>energy</strong> to produce electricity and fuels are<br />
included in the results for each process and explicitly<br />
shown.<br />
Global austenitic <strong>stainless</strong>-<strong>steel</strong> production in 2004 was<br />
approximately 17 million tons (International Chromium<br />
Development Association, 2006). Thus, under Current<br />
Operations, global production uses 9.0 10 17 J <strong>of</strong> primary<br />
<strong>energy</strong> throughout the life cycle. By comparing these<br />
results to the Virgin Production scenario, it was determined<br />
that the <strong>recycling</strong> <strong>of</strong> austenitic <strong>stainless</strong> <strong>steel</strong> saved 33%<br />
(4.4 10 17 J) <strong>of</strong> primary <strong>energy</strong>. If complete <strong>recycling</strong> were<br />
to occur (Maximum Recycling), which is not currently<br />
possible due to scrap availability, global <strong>energy</strong> use would<br />
be 67% less (9.0 10 17 J) than the Virgin Production<br />
scenario and 51% less (4.6 10 17 J) than Current Operations.<br />
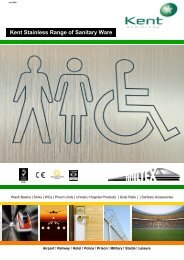
Fig. 4 subdivides these results in three different ways: by<br />
process, by material (e.g., ‘‘chromium’’ contains chromite<br />
mining, ferrochromium production, and transportation <strong>of</strong><br />
ore, concentrate, and ferrochromium), and by fuel with the<br />
electricity consumption taken back to its original fuel<br />
source. <strong>The</strong> <strong>energy</strong> required to produce and transport coal,<br />
petroleum, and natural gas accounts for approximately<br />
10% <strong>of</strong> the total <strong>energy</strong> requirements.<br />
<strong>The</strong> scenario results broken down by process (Fig. 4a)<br />
show the dominance <strong>of</strong> alloy production and <strong>stainless</strong>-<strong>steel</strong><br />
smelting in required <strong>energy</strong>. Transportation accounted for<br />
7–8% <strong>of</strong> the total primary <strong>energy</strong> for each <strong>of</strong> the scenarios,<br />
mining and beneficiation accounted for less than 3%, and<br />
scrap preparation <strong>energy</strong> use was negligible. <strong>The</strong> breakdown<br />
by material (Fig. 4b) shows that nickel is the largest<br />
user <strong>of</strong> <strong>energy</strong>, even though its mass is dwarfed by iron and<br />
chromium. This would imply that the production <strong>of</strong> ferritic<br />
<strong>stainless</strong> <strong>steel</strong>s (i.e., those containing little or no nickel)<br />
would require much less <strong>energy</strong> throughout the life cycle<br />
than does austenitic. Fig. 4c shows that coal, petroleum,<br />
and natural gas dominate the fuel inputs. Fossil fuels<br />
constitute between 81% and 88% <strong>of</strong> the total primary<br />
<strong>energy</strong> use.<br />
For each scenario, a Monte Carlo analysis was<br />
conducted, which is a probabilistic analysis used to assess<br />
the range <strong>of</strong> potential results. <strong>The</strong> 44 major factors (e.g.,<br />
unit <strong>energy</strong> used in the production <strong>of</strong> FeCr) were varied by<br />
assigned distribution ranges based on their minimum,<br />
maximum, and expected values. Four hundred simulations<br />
were run, provided the range <strong>of</strong> expected results for each<br />
scenario. <strong>The</strong> error bars on Fig. 3 show the range<br />
within which 90% <strong>of</strong> the trials fell. This range was approximately<br />
46,100–60,200 MJ/ton <strong>of</strong> <strong>stainless</strong> <strong>steel</strong> produced<br />
for Current Operations, 22,400–29,300 MJ/ton for Maximum<br />
Recycling, and 73,000–87,500 MJ/ton for Virgin<br />
Production.<br />
A recent study by Norgate et al. (2004) found that the<br />
production <strong>of</strong> <strong>stainless</strong> <strong>steel</strong> from virgin sources using<br />
ferronickel as the primary nickel source requires<br />
75,000 MJ/ton <strong>of</strong> <strong>stainless</strong> <strong>steel</strong>, with 59% <strong>of</strong> the <strong>energy</strong><br />
used in the production <strong>of</strong> ferronickel. Our study, which<br />
assumed that primary nickel came from refined nickel<br />
(65%), ferronickel (30%), and nickel oxide sinter (5%),<br />
found that Virgin Production required 79,000 MJ/ton <strong>of</strong><br />
<strong>stainless</strong> <strong>steel</strong> produced. To more accurately compare our<br />
results to Norgate et al.’s study, we ran a simulation under<br />
the Virgin Production scenario where all primary nickel<br />
was sourced from ferronickel. This resulted in <strong>energy</strong> use <strong>of</strong><br />
97,000 MJ/ton <strong>of</strong> <strong>stainless</strong> <strong>steel</strong>, with 44% <strong>of</strong> that total<br />
coming from ferronickel production and transport. We<br />
believe that inclusion <strong>of</strong> the upstream <strong>energy</strong> use for fuel<br />
production and transportation <strong>of</strong> intermediate materials, in<br />
addition to data variability, account for most <strong>of</strong> the<br />
difference between these two studies.<br />
Carbon releases were quantified by utilizing the<br />
<strong>energy</strong> use by fuel type together with CO 2 emission<br />
factors. For each ton <strong>of</strong> austenitic <strong>stainless</strong> <strong>steel</strong> produced,<br />
3.6 ton <strong>of</strong> CO 2 are generated on a global average basis<br />
(‘‘Current Operations’’). <strong>The</strong> Maximum Recycling scenario<br />
would reduce this to 1.6 ton <strong>of</strong> CO 2 , while the Virgin<br />
Production scenario would produce 5.3 ton CO 2 per ton<br />
<strong>stainless</strong> <strong>steel</strong>. Because 17 million tons <strong>of</strong> austenitic<br />
<strong>stainless</strong> <strong>steel</strong> was produced in 2004 (International Chromium<br />
Development Association, 2006), the global CO 2<br />
releases totaled 61 million tons. If no <strong>recycling</strong> occurred,<br />
CO 2 emissions would have increased to 90 million tons.<br />
Thus, austenitic <strong>stainless</strong>-<strong>steel</strong> <strong>recycling</strong> in 2004 reduced<br />
CO 2 emissions 29 million tons, or by 32%. If unlimited<br />
scrap was available and no virgin resources were used,<br />
the CO 2 releases would be 27 million tons, a reduction<br />
<strong>of</strong> 63 million tons (70%) compared with virgin-based<br />
production.<br />
For the Current Operations scenario, 43 <strong>of</strong> the variables<br />
were increased in isolation to determine the model’s<br />
sensitivity to each. Table 2 shows that there are 16 <strong>of</strong><br />
the variables that, when increased by 25%, had a greater<br />
than 1% change on the total primary <strong>energy</strong> required<br />
to produce 1 ton <strong>of</strong> austenitic <strong>stainless</strong> <strong>steel</strong>. Twentyseven<br />
<strong>of</strong> the variables had less than a 1% effect on the<br />
final results, including material loss rates <strong>of</strong> all forms,<br />
ore grades, the <strong>energy</strong> required to produce coal and<br />
petroleum, the nickel content <strong>of</strong> ferronickel, the chromium<br />
content <strong>of</strong> ferritic <strong>stainless</strong>-<strong>steel</strong> scrap, the percent<br />
<strong>of</strong> primary nickel from nickel oxide sinter, truck and<br />
rail transport <strong>energy</strong> intensities, and the unit <strong>energy</strong> used<br />
for mining, nickel oxide sinter production, and scrap<br />
preparation.<br />
Please cite this article as: Johnson, J., et al., <strong>The</strong> <strong>energy</strong> <strong>benefit</strong> <strong>of</strong> <strong>stainless</strong> <strong>steel</strong> <strong>recycling</strong>. Energy Policy (2007), doi:10.1016/j.enpol.2007.08.028
8<br />
ARTICLE IN PRESS<br />
J. Johnson et al. / Energy Policy ] (]]]]) ]]]–]]]<br />
Fig. 3. Primary <strong>energy</strong> required to produce 1 ton <strong>of</strong> austenitic <strong>stainless</strong> <strong>steel</strong>, ca. early 2000s, under (a) Current Operations, (b) Maximum Recycling, and<br />
(c) Virgin Production. Units are MJ/ton <strong>stainless</strong> <strong>steel</strong>. Totals may not be additive due to rounding. Trans ¼ transportation; DRI ¼ direct reduced iron;<br />
FeCr ¼ ferrochromium; FeNi ¼ ferronickel; and NiO ¼ nickel oxide.<br />
Please cite this article as: Johnson, J., et al., <strong>The</strong> <strong>energy</strong> <strong>benefit</strong> <strong>of</strong> <strong>stainless</strong> <strong>steel</strong> <strong>recycling</strong>. Energy Policy (2007), doi:10.1016/j.enpol.2007.08.028
ARTICLE IN PRESS<br />
J. Johnson et al. / Energy Policy ] (]]]]) ]]]–]]] 9<br />
Fig. 4. Energy required to produce 1 ton <strong>of</strong> austenitic <strong>stainless</strong> <strong>steel</strong> throughout its entire life cycle for three scenarios, subdivided by (a) process, (b)<br />
material, and (c) fuel. <strong>The</strong> error bars represent the range in which 90% <strong>of</strong> the trials in the Monte Carlo analysis fell.<br />
<strong>The</strong> most sensitive variables include those related to the<br />
amount and type <strong>of</strong> scrap fed into the electric arc furnace,<br />
the unit <strong>energy</strong> <strong>of</strong> the electric arc furnace, ferrochromium<br />
and ferronickel production, the form <strong>of</strong> primary nickel,<br />
and the nickel and chromium contents <strong>of</strong> austenitic<br />
<strong>stainless</strong>-<strong>steel</strong> scrap.<br />
Fig. 5 shows the effect on carbon intensity <strong>of</strong> two <strong>of</strong> the<br />
sensitive variables: scrap amount and scrap type. <strong>The</strong><br />
abscissa is the percent <strong>of</strong> the charge that is scrap; for<br />
example, if one-quarter <strong>of</strong> the feed into the electric arc<br />
furnace is scrap and three-quarters is primary metals, the x-<br />
coordinate would be 25%. Each line within this plot<br />
represents constant proportions <strong>of</strong> the types <strong>of</strong> scrap:<br />
carbon <strong>steel</strong> scrap, austenitic <strong>stainless</strong>-<strong>steel</strong> scrap, and<br />
ferritic <strong>stainless</strong>-<strong>steel</strong> scrap. For example, the line with<br />
square data points shows the case <strong>of</strong> half the scrap being<br />
carbon <strong>steel</strong> and the other half being ferritic <strong>stainless</strong> <strong>steel</strong>.<br />
As one moves to the right along this line, the total amount<br />
<strong>of</strong> scrap increases, but this proportion <strong>of</strong> scrap types<br />
remains constant.<br />
This figure shows that the use <strong>of</strong> austenitic <strong>stainless</strong>-<strong>steel</strong><br />
scrap has the greatest effect on CO 2 emissions, followed by<br />
the use <strong>of</strong> ferritic <strong>stainless</strong>-<strong>steel</strong> scrap, and then by carbon<br />
<strong>steel</strong> scrap. By solving the system <strong>of</strong> equations that<br />
underpins this model, which are comprised <strong>of</strong> such factors<br />
as the material loss rates, the unit <strong>energy</strong> requirements, and<br />
the emission factors for each fuel source, an equation was<br />
developed to describe the relationship between carbon<br />
dioxide releases and scrap amount and type.<br />
G ¼ 5:32 0:83 x 3:72 a 1:99 f,<br />
where G is the carbon dioxide intensity in tons <strong>of</strong> CO 2<br />
per ton <strong>of</strong> austenitic <strong>stainless</strong> <strong>steel</strong> produced, x the<br />
Please cite this article as: Johnson, J., et al., <strong>The</strong> <strong>energy</strong> <strong>benefit</strong> <strong>of</strong> <strong>stainless</strong> <strong>steel</strong> <strong>recycling</strong>. Energy Policy (2007), doi:10.1016/j.enpol.2007.08.028
10<br />
ARTICLE IN PRESS<br />
J. Johnson et al. / Energy Policy ] (]]]]) ]]]–]]]<br />
Table 2<br />
Model sensitivity to variables under the current operations scenario<br />
An increase <strong>of</strong> 25% for<br />
Results in an<br />
increase in total<br />
primary <strong>energy</strong><br />
<strong>of</strong><br />
An increase <strong>of</strong> 25% for<br />
Results in a<br />
decrease in total<br />
primary <strong>energy</strong><br />
<strong>of</strong><br />
Electric arc furnace unit <strong>energy</strong> +11% Total amount <strong>of</strong> scrap in EAF load 12%<br />
Ferrochromium unit <strong>energy</strong> +4.7% Share <strong>of</strong> EAF load that is austenitic <strong>stainless</strong>-<strong>steel</strong> scrap 11%<br />
Ferronickel unit <strong>energy</strong> +3.5% Share <strong>of</strong> primary nickel provided by refined nickel 5.1%<br />
Share <strong>of</strong> primary nickel provided by ferronickel +2.5% Nickel content in austenitic <strong>stainless</strong>-<strong>steel</strong> scrap 4.7%<br />
Transport distances +1.9% Chromium content in austenitic <strong>stainless</strong>-<strong>steel</strong> scrap 2.7%<br />
Refined nickel unit <strong>energy</strong> +1.9% Chromium content in ferrochromium 2.7%<br />
Ship transport <strong>energy</strong> intensity +1.5% Share <strong>of</strong> EAF load that is carbon <strong>steel</strong> scrap 1.3%<br />
Energy used in the production <strong>of</strong> natural gas +1.2%<br />
DRI unit <strong>energy</strong> +1.1%<br />
ferritic <strong>stainless</strong>-<strong>steel</strong> scrap, and 4.5 times greater than<br />
<strong>recycling</strong> 1% <strong>of</strong> carbon <strong>steel</strong> scrap.<br />
4. Discussion<br />
Fig. 5. CO 2 emissions per ton <strong>of</strong> austenitic <strong>stainless</strong> <strong>steel</strong> produced as a<br />
function <strong>of</strong> amount and type <strong>of</strong> scrap recycled.<br />
percent <strong>of</strong> the charge that is carbon <strong>steel</strong> scrap, a the<br />
percent <strong>of</strong> the charge that is austenitic <strong>stainless</strong>-<strong>steel</strong> scrap,<br />
and j the percent <strong>of</strong> the charge that is ferritic <strong>stainless</strong>-<strong>steel</strong><br />
scrap.<br />
And, due to material balances for each <strong>of</strong> the elements,<br />
ap0:99,<br />
a þ 0:89 fp1:00,<br />
a þ 1:14 f þ 1:32 xp1:00.<br />
For example, if austenitic <strong>stainless</strong> <strong>steel</strong> were produced<br />
using 70% scrap and 30% virgin material, and if the scrap<br />
was 50% austenitic <strong>stainless</strong> <strong>steel</strong>, 20% ferritic <strong>stainless</strong><br />
<strong>steel</strong>, and 30% carbon <strong>steel</strong>, the variables would be<br />
a ¼ 0.35, j ¼ 0.14, and x ¼ 0.21. Inserting these values<br />
into the equation, we find that the life-cycle carbon<br />
intensity <strong>of</strong> this system is 3.6 ton <strong>of</strong> CO 2 per ton <strong>of</strong><br />
austenitic <strong>stainless</strong> <strong>steel</strong> produced.<br />
In the carbon intensity equation, the coefficients on each<br />
<strong>of</strong> the scrap variables are proportional to the decrease in<br />
carbon intensity. Thus, each percent <strong>of</strong> the charge that is<br />
austenitic <strong>stainless</strong>-<strong>steel</strong> scrap has a reducing effect on<br />
carbon emissions 1.9 times greater than the use <strong>of</strong> 1% <strong>of</strong><br />
Comprehensive <strong>energy</strong> policy and system analysis must<br />
examine the <strong>energy</strong> demands by industry, and the metalproducing<br />
industries are certainly high-<strong>energy</strong> consumers.<br />
By examining the <strong>energy</strong> requirements for the entire life<br />
cycle <strong>of</strong> austenitic <strong>stainless</strong>-<strong>steel</strong> production, we were able<br />
to quantify both the <strong>energy</strong> and carbon intensity <strong>of</strong> this<br />
product. Comparing scenarios with different <strong>recycling</strong> rates<br />
determines the true impact <strong>of</strong> <strong>recycling</strong> on <strong>energy</strong> use; the<br />
<strong>energy</strong> required to produce <strong>stainless</strong> <strong>steel</strong> from scrap is less<br />
than a third <strong>of</strong> the <strong>energy</strong> used to produce <strong>stainless</strong> <strong>steel</strong><br />
from virgin sources. This finding helps support <strong>recycling</strong><br />
efforts beyond the justifications <strong>of</strong> material use and waste<br />
impacts.<br />
Scrap availability is a limiting factor in the <strong>recycling</strong> <strong>of</strong><br />
<strong>stainless</strong> <strong>steel</strong>. With <strong>stainless</strong>-<strong>steel</strong> production growth<br />
averaging 9% over the past few years (International<br />
Chromium Development Association, 2006) and the<br />
product lifetimes <strong>of</strong> some applications extending for years<br />
and even decades, scrap will not be able to meet production<br />
demand. Should <strong>stainless</strong>-<strong>steel</strong> production level <strong>of</strong>f and<br />
scrap collection continue to be high, we would anticipate<br />
increased <strong>recycling</strong> rates and, thus, lower system-wide<br />
<strong>energy</strong> use.<br />
While this study aims to <strong>of</strong>fer a comprehensive look at<br />
the entire life-cycle associated with <strong>stainless</strong>-<strong>steel</strong> production,<br />
practicality and tractability limit how far the system<br />
boundaries <strong>of</strong> this study can be extended. A more robust<br />
study could also include the <strong>energy</strong> used for the capital<br />
equipment at the mine sites and alloy plants, and have<br />
more extensive data to detail <strong>energy</strong> performance differences<br />
among plants and nations. Utilizing country-wide<br />
electricity pr<strong>of</strong>iles is also a limitation <strong>of</strong> this work; on-site<br />
electricity generation may not be well represented by<br />
country-wide statistics. Data, however, are not available to<br />
provide this added level <strong>of</strong> detail. With each material flow<br />
Please cite this article as: Johnson, J., et al., <strong>The</strong> <strong>energy</strong> <strong>benefit</strong> <strong>of</strong> <strong>stainless</strong> <strong>steel</strong> <strong>recycling</strong>. Energy Policy (2007), doi:10.1016/j.enpol.2007.08.028
ARTICLE IN PRESS<br />
J. Johnson et al. / Energy Policy ] (]]]]) ]]]–]]] 11<br />
and unit <strong>energy</strong> factor, there is a degree <strong>of</strong> uncertainty.<br />
Through the Monte Carlo analysis and the uncertainty<br />
analysis, we determined the factors that had the most<br />
influence on the final results (e.g., the amount and type <strong>of</strong><br />
scrap, the form <strong>of</strong> primary nickel) and those that had the<br />
least influence on the final results (e.g., material loss rates,<br />
ore grades).<br />
<strong>The</strong> methodology employed in this study is readily<br />
transferable to other metals. Generating such results for a<br />
wide suite <strong>of</strong> metals would allow broader analysis <strong>of</strong> the<br />
<strong>energy</strong> impacts <strong>of</strong> the mining and metallurgy industries, as<br />
well as allowing for cross-metal comparisons; the <strong>energy</strong><br />
effect <strong>of</strong> metals substitution could then be assessed. In<br />
addition, countries that import a significant share <strong>of</strong> their<br />
refined metals could analyze the effect <strong>of</strong> outsourcing such<br />
production based on <strong>energy</strong> and carbon impact, allowing<br />
for such factors to inform greenhouse gas mitigation<br />
policies.<br />
Acknowledgements<br />
This material is based upon work supported by the<br />
Nickel Institute and the US National Science Foundation<br />
under Grant nos. BES-9818788 and BES-0329470. <strong>The</strong><br />
authors would also like to acknowledge Friedrich Teroerde<br />
<strong>of</strong> ELG Haniel Metals Ltd. and the members <strong>of</strong> the<br />
International <strong>Stainless</strong> Steel Forum’s TEAM STAINLESS<br />
for continued insight and assistance.<br />
References<br />
Bergstrom, R., 2005. Personal communication, Outokumpu Oy.<br />
Bhaktavatsalam, A.K., Choudhury, R., 1995. Specific <strong>energy</strong> consumption<br />
in the <strong>steel</strong> industry. Energy 20, 1247–1250.<br />
Carnegie Mellon Green Design Institute, 2007 /www.eiolca.netS,<br />
accessed March 2007.<br />
Choudhury, R., Bhaktavatsalam, A.K., 1997. Energy inefficiency <strong>of</strong><br />
Indian <strong>steel</strong> industry—scope for <strong>energy</strong> conservation. Energy Conversion<br />
and Management 38, 167–171.<br />
Daavittila, J., Honkaniemi, M., Jokinen, P., 2004. <strong>The</strong> transformations <strong>of</strong><br />
ferrochromium smelting technologies during the last decades. In:<br />
Proceedings <strong>of</strong> the 10th International Ferro Alloys Congress.<br />
Das, A., Kandpal, T.C., 2000. Analysis <strong>of</strong> <strong>energy</strong> demand and CO 2<br />
emissions for the Indian aluminum industry using a dynamic<br />
programming model. International Journal <strong>of</strong> Energy Research 24,<br />
51–59.<br />
Energy Information Administration, 2006. Fuel and Energy Source Codes<br />
and Emission Coefficients /http://www.eia.doe.gov/oiaf/1605/factors.<br />
htmlS, last accessed June 2006.<br />
International Chromium Development Association, 2006. Statistical<br />
Bulletin. Paris, France.<br />
International Energy Agency, 2004a. Energy Balances <strong>of</strong> Non-OECD<br />
Countries: 2001–2002. Paris, France.<br />
International Energy Agency, 2004b. Energy Balances <strong>of</strong> OECD<br />
Countries, 2001–2002. Paris, France.<br />
International Iron and Steel Institute, 2005. Steel Statistical Yearbook.<br />
Brussels, Belgium.<br />
International Nickel Study Group, 2004. World Nickel Statistics, <strong>The</strong><br />
Hague, <strong>The</strong> Netherlands.<br />
Johnson, J., Schewel, L., Graedel, T.E., 2006. <strong>The</strong> contemporary<br />
anthropogenic chromium cycle. Environmental Science & Technology<br />
40, 7060–7069.<br />
Jorgenson, J.D., William, S.K., 2003. Iron ore. In: USGS Minerals<br />
Yearbook 2003. United States Geological Survey (USGS), Reston,<br />
VA.<br />
Kerfoot, D.G.E., 2002. Nickel. In: Ullmann’s Encyclopedia <strong>of</strong> Industrial<br />
Chemistry. Wiley-VCH Verlag GmbH & Co., KGaA, Weinheim.<br />
Kuck, P., 2005. United States Geological Survey Minerals Yearbook—<br />
Nickel. Reston, VA.<br />
Kusik, C., Kenahan, C., 1978. Information Circular 8781: Energy Use<br />
Patterns for Metal Recycling. United States Bureau <strong>of</strong> Mines,<br />
Washington, DC.<br />
McCleese, D.L., LaPuma, P.T., 2002. Using Monte Carlo simulation in<br />
life cycle assessment for electric and internal combustion vehicles.<br />
International Journal <strong>of</strong> Life Cycle Assessment 7, 230–236.<br />
McLaughlan, J., 2006. Challenges Facing the South African Ferrochrome<br />
Industry, CHROMIUM 2006, Cape Town, South Africa.<br />
Michaelis, P., Jackson, T., 2000a. Material and <strong>energy</strong> flow through the<br />
UK Iron and Steel Sector—Part 2: 1994–2019. Resources Conservation<br />
and Recycling 29, 209–230.<br />
Michaelis, P., Jackson, T., 2000b. Material and <strong>energy</strong> flow through the<br />
UK Iron and Steel Sector. Part 1: 1954–1994. Resources Conservation<br />
and Recycling 29, 131–156.<br />
Nickel Institute, 2006. Life Cycle Assessment /http://www.nickelinstitute.<br />
org/index.cfm/ci_id/114/la_id/1.htmS, last accessed September 20,<br />
2006.<br />
Niemelä, P., 2001. CO 2 Emissions in Production <strong>of</strong> Ferrochromium.<br />
Outokumpu Oy, Tornio, Finland.<br />
Norgate, T.E., 2004. Metal Recycling: An Assessment Using Life Cycle<br />
Energy Consumption as a Sustainability Indicator. CSIRO Minerals,<br />
DMR-2616, Victoria, Australia.<br />
Norgate, T.E., Rankin, W.J., 2000. Life cycle assessment <strong>of</strong> copper and<br />
nickel production. In: Minprex 2000, International Conference on<br />
Minerals Processing and Extractive Metallurgy.<br />
Norgate, T.E., Jahanshahi, S., Rankin, W.J., 2004. Alternative routes to<br />
<strong>stainless</strong> <strong>steel</strong> a life cycle approach. In: Tenth International Ferroalloys<br />
Congress, Cape Town, South Africa.<br />
Oeters, F., Ottow, M., Meiler, H., Lungen, H.B., Koltermann, M., Buhr,<br />
A., Yagi, J.-I., Formanek, L., Rose, F., Flickenschild, J., Hauk, R.,<br />
Steffen, R., Skroch, R., Mayer-Schwinning, G., Bunnagel, H.-L., H<strong>of</strong>f,<br />
H.-G., 2006. Iron. In: Ullmann’s Encyclopedia <strong>of</strong> Industrial Chemistry.<br />
Wiley-VCH Verlag GmbH & Co., KGaA, Weinheim.<br />
Outokumpu, 2006. Outokumpu and the Environment /http://www.<br />
outokumpu.com/33954.epibrwS, last accessed September 5, 2006.<br />
Reck, B., Mu¨ller, D.B., Rostkowski, K., Graedel, T.E., 2007. <strong>The</strong><br />
anthropogenic nickel cycle: insights into use, trade, and <strong>recycling</strong>.<br />
Environmental Science & Technology, in review.<br />
Sheehan, J., Camobreco, V., Duffield, J., Graboski, M., Shapouri, H.,<br />
1998. Life Cycle Inventory <strong>of</strong> Biodiesel and Petroleum Diesel for Use<br />
in an Urban Bus. National Renewable Energy Laboratory.<br />
Spath, P.L., Mann, M.K., 2000. Life Cycle Assessment <strong>of</strong> a Natural Gas<br />
Combined-Cycle Power Generating System. National Renewable<br />
Energy Laboratory.<br />
Spath, P.L., Mann, M.K., Kerr, D.R., 1999. Life Cycle Assessment <strong>of</strong><br />
Coal-Fired Power Production. National Renewable Energy Laboratory.<br />
Strubegger, M., 2003. Co2db S<strong>of</strong>tware: Carbon Dioxide (Technology)<br />
Database. Version 3.0. International Institute for Applied Systems<br />
Analysis, Laxenburg, Austria.<br />
US Department <strong>of</strong> Energy, 2002. Energy and Environmental Pr<strong>of</strong>ile <strong>of</strong> the<br />
US Mining Industry. Office <strong>of</strong> Energy Efficiency and Renewable<br />
Energy, Washington, DC.<br />
United Nations Comtrade Database, 2006 /http://unstats.un.org/unsd/<br />
comtrade/S, last accessed June 2006.<br />
United States Department <strong>of</strong> Energy, 2006. Indicators <strong>of</strong> Energy Intensity<br />
in the United States /http://intensityindicators.pnl.gov/total_<br />
transportation.stmS, last accessed June 2006.<br />
United States Geological Survey, 2006. Energy Resources Program<br />
/http://<strong>energy</strong>.usgs.gov/glossary.htmlS, last accessed September 5,<br />
2006.<br />
Please cite this article as: Johnson, J., et al., <strong>The</strong> <strong>energy</strong> <strong>benefit</strong> <strong>of</strong> <strong>stainless</strong> <strong>steel</strong> <strong>recycling</strong>. Energy Policy (2007), doi:10.1016/j.enpol.2007.08.028
12<br />
ARTICLE IN PRESS<br />
J. Johnson et al. / Energy Policy ] (]]]]) ]]]–]]]<br />
Wang, T., Mu¨ller, D., Graedel, T.E., 2007. Forging the anthropogenic<br />
iron cycle. Environmental Science & Technology 41,<br />
5120–5129.<br />
Warner, A.E.M., Diaz, C.M., Dalvi, A.D., Mackey, P.J., Tarasov, A.V.,<br />
2006. JOM World Nonferrous Smelter Survey, Part III: Nickel:<br />
Laterite. JOM, April 2006, pp. 11–20.<br />
Western Mine, 2006 /http://www.westernmine.comS, last accessed June<br />
10, 2006.<br />
World Commission on Environment and Development, 1987. Our<br />
Common Future. Oxford University Press, Oxford, UK.<br />
Worrell, E., Levine, M., Price, L., Martin, N., 1996. Potentials and policy<br />
implications <strong>of</strong> <strong>energy</strong> and material efficiency improvement. A Report<br />
to the United Nations, Division for Sustainable Development.<br />
Worrell, E., Price, L., Martin, N., 2001. Energy efficiency and carbon<br />
dioxide emissions reduction opportunities in the US Iron and Steel<br />
Sector. Energy 26, 513–536.<br />
Please cite this article as: Johnson, J., et al., <strong>The</strong> <strong>energy</strong> <strong>benefit</strong> <strong>of</strong> <strong>stainless</strong> <strong>steel</strong> <strong>recycling</strong>. Energy Policy (2007), doi:10.1016/j.enpol.2007.08.028