"eco-efficient" production system - Department of Primary Industries
"eco-efficient" production system - Department of Primary Industries
"eco-efficient" production system - Department of Primary Industries
You also want an ePaper? Increase the reach of your titles
YUMPU automatically turns print PDFs into web optimized ePapers that Google loves.
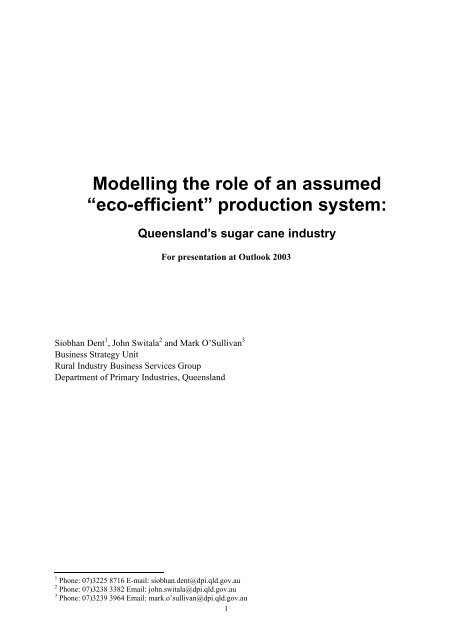
Modelling the role <strong>of</strong> an assumed<br />
“<strong>eco</strong>-efficient” <strong>production</strong> <strong>system</strong>:<br />
Queensland’s sugar cane industry<br />
For presentation at Outlook 2003<br />
Siobhan Dent 1 , John Switala 2 and Mark O’Sullivan 3<br />
Business Strategy Unit<br />
Rural Industry Business Services Group<br />
<strong>Department</strong> <strong>of</strong> <strong>Primary</strong> <strong>Industries</strong>, Queensland<br />
1 Phone: 07)3225 8716 E-mail: siobhan.dent@dpi.qld.gov.au<br />
2 Phone: 07)3238 3382 Email: john.switala@dpi.qld.gov.au<br />
3 Phone: 07)3239 3964 Email: mark.o’sullivan@dpi.qld.gov.au<br />
1
General disclaimer<br />
This publication has been prepared with care, but DPI:<br />
a) takes no responsibility for any errors, omissions or inaccuracies contained in this<br />
publication;<br />
b) does not warrant that the information contained in this publication is current or that<br />
there is not more recent or more relevant information available;<br />
c) does not accept any liability for any decisions or actions taken on the basis <strong>of</strong> this<br />
publication; and<br />
d) does not accept any liability for any loss or damage suffered directly or indirectly<br />
from the use <strong>of</strong> the information contained in this publication.<br />
© The State <strong>of</strong> Queensland, <strong>Department</strong> <strong>of</strong> <strong>Primary</strong> <strong>Industries</strong> 2002<br />
Copyright protects this publication. Except for purposes permitted by the Copyright Act,<br />
re<strong>production</strong> by whatever means is prohibited without prior written permission <strong>of</strong> the<br />
<strong>Department</strong> <strong>of</strong> <strong>Primary</strong> <strong>Industries</strong>, Queensland. Inquiries should be addressed to:<br />
Manager, DPI Publications<br />
<strong>Department</strong> <strong>of</strong> <strong>Primary</strong> <strong>Industries</strong><br />
GPO Box 46<br />
Brisbane Qld 4001<br />
2
Abstract<br />
This paper investigates the <strong>eco</strong>nomic implications <strong>of</strong> the adoption <strong>of</strong> “<strong>eco</strong>-efficient”<br />
<strong>production</strong> practices in the Queensland sugar cane industry. Eco-efficiency is a combination<br />
<strong>of</strong> <strong>eco</strong>nomic and <strong>eco</strong>logical efficiency, and is basically about ‘doing more with less’. The<br />
authors acknowledge that the definition <strong>of</strong> “<strong>eco</strong>-efficient” sugar cane <strong>production</strong> in this paper<br />
is based to a large degree on practices that have not been proven commercially, and therefore<br />
many <strong>of</strong> the proposed practices are still evolving. The understanding <strong>of</strong> “<strong>eco</strong>-efficient” sugar<br />
cane <strong>production</strong> will undoubtedly change in the future.<br />
The results <strong>of</strong> this preliminary study indicate that the proposed <strong>production</strong> <strong>system</strong> <strong>of</strong>fers<br />
potential benefits to sugar cane growers, the Queensland and national <strong>eco</strong>nomies, and the<br />
environment.<br />
A gross margin analysis between an assumed generic “traditional” sugar cane <strong>production</strong><br />
<strong>system</strong> and the proposed “<strong>eco</strong>-efficient” <strong>production</strong> <strong>system</strong> estimates that, on a per farm<br />
basis, sugar cane income will decrease by 4%, while expenses decline by 22%, resulting in a<br />
22% increase in the gross margin. It is also estimated that the “<strong>eco</strong>-efficient” <strong>production</strong><br />
<strong>system</strong> would require 30% less labour per unit <strong>of</strong> output.<br />
The Monash Multi-Regional Forecasting (MMRF) model is used to evaluate the broader<br />
<strong>eco</strong>nomic implications <strong>of</strong> the adoption <strong>of</strong> the proposed “<strong>eco</strong>-efficient” sugar cane <strong>production</strong><br />
<strong>system</strong> in Queensland. The model forecasts that the adoption <strong>of</strong> the <strong>production</strong> <strong>system</strong> would<br />
lead to an increase in the size <strong>of</strong> the Queensland and national <strong>eco</strong>nomies, and also to an<br />
improvement in the pr<strong>of</strong>itability <strong>of</strong> Queensland sugar cane growing.<br />
Acknowledgments<br />
The authors would like to acknowledge the substantial input from Neil Sing, Principal<br />
Agricultural Economist, Rural Industry Business Services, <strong>Department</strong> <strong>of</strong> <strong>Primary</strong> <strong>Industries</strong>,<br />
Queensland.<br />
A number <strong>of</strong> key external stakeholders were consulted, and provided advice, throughout the<br />
study including, Brian Roberts (Douglas Shire Council), Alan Garside (Sugar Yield Decline<br />
Joint Venture Project), and Malcolm Wegener (University <strong>of</strong> Queensland).<br />
The Office <strong>of</strong> Economic and Statistical Research, Queensland Treasury, provided valuable<br />
comments on the assumptions imposed on the MMRF model, and the interpretation <strong>of</strong> the<br />
results.<br />
Constructive comments were also received from Queensland Canegrowers Organisation<br />
Limited, particularly Jennifer Marohasy and Bernard Milford.<br />
The <strong>Department</strong> wishes to acknowledge Philip Adams from the Centre <strong>of</strong> Policy Studies,<br />
Monash University, for producing the simulation results presented in this report.<br />
3
Introduction<br />
The objective <strong>of</strong> this study is to demonstrate a modelling approach that enables us to firstly<br />
quantifying the on-farm impacts <strong>of</strong> the adoption <strong>of</strong> “<strong>eco</strong>-efficient” farming practices by the<br />
Queensland sugar cane industry, and s<strong>eco</strong>ndly quantify the likely flow-on impacts to the<br />
Queensland <strong>eco</strong>nomy.<br />
The proposed “<strong>eco</strong>-efficient” <strong>production</strong> <strong>system</strong> is based upon research conducted over the<br />
last four years through the Sugar Yield Decline Joint Venture Project by individuals from the<br />
<strong>Department</strong> <strong>of</strong> <strong>Primary</strong> <strong>Industries</strong>, Queensland, CSIRO and the Bureau <strong>of</strong> Sugar<br />
Experimental Stations, and also work undertaken by the <strong>Department</strong> <strong>of</strong> <strong>Primary</strong> <strong>Industries</strong>,<br />
Queensland, Sugar Solution project. It is important to r<strong>eco</strong>gnise that the definition <strong>of</strong> “<strong>eco</strong>efficient”<br />
<strong>production</strong> in sugar cane is still evolving, and what it involves will undoubtedly<br />
change in the future as science and research/commercial trials provide more insights. This<br />
paper <strong>of</strong>fers an <strong>eco</strong>nomic analysis <strong>of</strong> two <strong>production</strong> <strong>system</strong>s that are based upon a number <strong>of</strong><br />
fundamental <strong>production</strong> assumptions, and therefore are not reflective <strong>of</strong> actual or potential<br />
practices across the entire industry.<br />
The <strong>system</strong>s modelled as “<strong>eco</strong>-efficient” are not currently available throughout the sugar<br />
industry. They refer to <strong>system</strong>s that are still being trailed, and a number <strong>of</strong> these innovations<br />
may prove not to be suitable in some areas. 4 Conclusions on the benefits <strong>of</strong> “<strong>eco</strong>-efficient”<br />
farming should therefore be viewed as indicative only and as an illustration <strong>of</strong> the potential<br />
value <strong>of</strong> a modelling approach. Certain components <strong>of</strong> the “<strong>eco</strong>-efficient” <strong>system</strong> identified in<br />
this paper have already been promoted and implemented by a number <strong>of</strong> producers,<br />
particularly those participating in the Sugar Yield Decline Joint Venture Project.<br />
Around 95% <strong>of</strong> Australian raw sugar is produced in Queensland (Hildebrand 2002). In 2001,<br />
there was approximately 525 000 hectares <strong>of</strong> cane <strong>production</strong> area in Queensland, <strong>of</strong> which<br />
440 000 was harvested to produce 29.9 million tonnes <strong>of</strong> cane and 4.3 million tonnes <strong>of</strong> raw<br />
sugar (<strong>Department</strong> <strong>of</strong> <strong>Primary</strong> <strong>Industries</strong>, Queensland, 2002).<br />
Sugar cane is grown along the majority <strong>of</strong> the Queensland coast: from the Queensland-New<br />
South Wales border to north <strong>of</strong> Mossman.<br />
What is <strong>eco</strong>-efficient?<br />
‘Eco-efficiency is a combination <strong>of</strong> <strong>eco</strong>nomic and <strong>eco</strong>logical efficiency, and is basically<br />
about ‘doing more with less’. “Eco-efficient” means producing more goods and services with<br />
less energy and fewer natural resources. “Eco-efficient” businesses get more value out <strong>of</strong><br />
their raw materials as well as producing less waste and less pollution’ (Environment<br />
Australia, 2002). In this study we have assumed that an “<strong>eco</strong>-efficient” business would not<br />
only use less energy and fewer natural resources, but also fewer purchased inputs (e.g.<br />
chemicals).<br />
“Traditional” <strong>production</strong> <strong>of</strong> sugar cane<br />
Variations in the environment (e.g. rainfall, soil type and topography) across cane producing<br />
regions mean that <strong>production</strong> <strong>system</strong>s do differ between regions. 5 However, for the purposes<br />
<strong>of</strong> the <strong>eco</strong>nomic modelling in this study it was necessary to consider a generic <strong>production</strong><br />
<strong>system</strong> for “traditional” sugar cane <strong>production</strong> in Queensland. An overview <strong>of</strong> the assumed<br />
4 This paper does not cover all innovations that fit under “<strong>eco</strong>-efficient” <strong>production</strong>. For example, the sugar<br />
industry is implementing best practice irrigation and rat integrated pest management.<br />
5 In some regions the majority <strong>of</strong> cane is irrigated, while in others the majority <strong>of</strong> cane is rain grown. The level<br />
<strong>of</strong> pesticide use can also vary between regions.<br />
4
“traditional” <strong>production</strong> <strong>system</strong> is shown in Figure 1, which details the <strong>production</strong> <strong>system</strong> for<br />
a sugar cane farm over a 12-month period. This is a rain grown sugar cane <strong>production</strong> <strong>system</strong>,<br />
rather than an irrigated <strong>production</strong> <strong>system</strong>.<br />
Figure 1: Production map <strong>of</strong> a “traditional” Queensland sugar cane farm in 2002 (January–December)<br />
Block 1: One-year old cane (Table 1)<br />
Harvest — September to October<br />
Block 2: Ratoon 1 6 (Table 2)<br />
Harvest — June to November<br />
Block 3: Ratoon 2–(Table 3)<br />
Harvest — June to November<br />
Block 4: Ratoon 3 (Table 4)<br />
Harvest — June to November<br />
Block 5: Ratoon 4 and new plant<br />
cane (Table 5)<br />
Harvest — July<br />
Plant — August<br />
It is assumed that a “traditional” sugar cane farm in Queensland currently operates a fivestage<br />
plough out/replant 7 <strong>production</strong> <strong>system</strong>. In any one year (January to December), a sugar<br />
cane farm would have a proportion <strong>of</strong> the land under:<br />
One-year old cane (Block 1)<br />
Ratoon 1 (Block 2) (two-year old cane plant)<br />
Ratoon 2 (Block 3) (three-year old cane plant)<br />
Ratoon 3 (Block 4) (four-year old cane plant)<br />
Ratoon 4 and new plant cane (Block 5) (five-year old cane plant and new plant)<br />
A paddock under this <strong>system</strong> is harvested 8 five times and replanted every five years.<br />
This “traditional” <strong>production</strong> <strong>system</strong> is not representative <strong>of</strong> the current practices <strong>of</strong> the entire<br />
industry, and a number <strong>of</strong> sugar cane producers have already embarked on modifying<br />
agronomic practices as outlined in the “Eco-efficient” <strong>production</strong> and sugar cane section <strong>of</strong><br />
this paper.<br />
The <strong>production</strong> requirements <strong>of</strong> new plant cane, one-year old cane and ratoon cane are<br />
different. The yield expectations from one-year old cane and ratoon cane are also different.<br />
The gross margins 9 for the assumed “traditional” <strong>production</strong> <strong>system</strong> are shown in Table 1 to<br />
Table 6. These gross margins detail the income and expenses for each stage <strong>of</strong> <strong>production</strong>,<br />
and identify levels <strong>of</strong> input usage. The chemicals listed in the gross margins may not be the<br />
optimal choices for use in all sugar cane growing regions in Queensland.<br />
6 Cane harvesting involves the cutting <strong>of</strong> plant shoots (stems and leaves), which therefore allows the plant to<br />
regenerate as a ratoon crop the following season.<br />
7 Ploughout-replant is the practice <strong>of</strong> ploughing out cane after harvest and immediately replanting sugar cane.<br />
The ploughout-replant <strong>system</strong> is more common in some sugar cane districts than others.<br />
8 “Traditional” and “<strong>eco</strong>-efficient” <strong>system</strong>s are assumed to harvest sugar cane green and use green trash<br />
blanketing and this varies significantly between regions, with much less in irrigated areas like the Burdekin.<br />
9 Expenses in the gross margins include the variable costs <strong>of</strong> machinery and implement operations, chemicals<br />
costs (fertiliser, insecticides and herbicides), contract costs (sugar cane planting and harvesting) and grower<br />
levies. A more detailed description <strong>of</strong> the cost calculations will be in the upcoming technical paper or can be<br />
obtained by contacting the authors.<br />
5
Table 1: Gross margin <strong>of</strong> a “traditional” Queensland sugar cane farm in 2002 — one-year old cane<br />
Activity Machinery/equipment Applications Rate Unit cost $/ha<br />
Income<br />
Sugar cane (t) 85 $26.20 10 $2227.00<br />
Total income $2227.00<br />
Expenses<br />
Crop care<br />
Headland slashing 60hp tractor 3 3ha/hr $8.80 $26.40<br />
Headland spraying 11 60 hp tractor 1 5ha/hr $0.62 $0.62<br />
Gramoxone (l) 1 0.2 $9.41 $1.88<br />
Diuron (kg) 1 0.2 $13.59 $2.72<br />
Spraying banks and fences Glyphosphate (l) 1 1.3 $5.68 $7.38<br />
Harvest<br />
Contract harvesting 1 85 $6.10 $518.50<br />
Grower levies 1 85 $0.39 $33.15<br />
Total expenses $590.66<br />
Gross margin $1636.34<br />
10 Raw sugar prices is assumed to be $290 per tonne<br />
11 The variable cost <strong>of</strong> headland spraying is assumed to be 20% <strong>of</strong> the variable cost <strong>of</strong> crop spraying (i.e. the<br />
headlands are assumed to be 20% <strong>of</strong> the farm area).<br />
6
Table 2: Gross margin <strong>of</strong> a “traditional” Queensland sugar cane farm in 2002 — ratoon one cane<br />
Activity Machinery/equipment Applications Rate Unit cost $/ha<br />
Income<br />
Sugar cane (t) 90 $26.20 $2358.00<br />
Total income $2358.00<br />
Expenses<br />
Crop care<br />
Spraying 60hp tractor 1 5ha/hr $3.10 $3.10<br />
Herbicide Gramoxone (l) 1 1 $9.41 $9.41<br />
Diuron (kg) 1 0.5 $13.59 $6.80<br />
2 4-D (l) 1 0.5 $5.64 $2.82<br />
Fertiliser application 100hp tractor 1 1ha/hr $15.72 $15.72<br />
60hp tractor with bag lifter 1 6ha/hr $1.65 $1.65<br />
Fertiliser Fertiliser 1 12 (t) 1 0.625 $391.50 $244.69<br />
Pre-emergent spraying 60hp tractor 1 5ha/hr $3.10 $3.10<br />
Herbicide 2 4-D (l) 1 1 $5.64 $5.64<br />
Atrazine (kg) 1 2.5 $10.33 $25.83<br />
Spot spraying - guinea grass 60hp tractor 1 4ha/hr $3.44 $3.44<br />
Gramoxone (l) 1 0.125 $9.41 $1.18<br />
Hexazinona and Diuron (kg) 1 0.5 $10.74 $5.37<br />
High-clearance spraying 60hp tractor 3 5ha/hr $3.10 $9.30<br />
Herbicide 2 4-D (l) 2 1 $5.64 $11.28<br />
Atrazine (kg) 2 2.5 $10.33 $51.65<br />
Gramoxone (l) 1 1 $9.41 $9.41<br />
Diuron (kg) 1 0.5 $13.59 $6.80<br />
Headland slashing 60hp tractor 5 3ha/hr $8.80 $44.00<br />
Headland spraying 60hp tractor 1 5ha/hr $0.62 $0.62<br />
Gramoxone (l) 1 0.2 $9.41 $1.88<br />
Diuron (kg) 1 0.2 $13.59 $2.72<br />
Spraying banks & fences Glyphosphate (l) 1 1.3 $5.68 $7.38<br />
Harvesting<br />
Contract harvesting 1 90 $6.10 $549.00<br />
Grower levies 90 $0.39 $35.10<br />
Total expenses $1057.90<br />
Gross margin $1300.10<br />
12 Fertiliser 1 makeup: Di-ammonium Phosphate (10–20%), Urea (40–50%) and Potassium Chloride (40–50%)<br />
7
Table 3: Gross margin <strong>of</strong> a “traditional” Queensland sugar cane farm in 2002 — ratoon two cane<br />
Activity Machinery/equipment Applications Rate Unit cost $/ha<br />
Income<br />
Sugar cane (t) 85 $26.20 $2227.00<br />
Total income $2227.00<br />
Expenses<br />
Crop care<br />
Spraying 60hp tractor 1 5ha/hr $3.10 $3.10<br />
Herbicide Gramoxone (l) 1 1 $9.41 $9.41<br />
Diuron (kg) 1 0.5 $13.59 $6.80<br />
2 4-D (l) 1 0.5 $5.64 $2.82<br />
Fertiliser application 100hp tractor 1 1ha/hr $15.72 $15.72<br />
60hp tractor with bag lifter 1 6ha/hr $1.65 $1.65<br />
Fertiliser Fertiliser 1 (t) 1 0.625 $391.50 $244.69<br />
Pre-emergent spraying 60hp tractor 1 5ha/hr $3.10 $3.10<br />
Herbicide 2 4-D (l) 1 1 $5.64 $5.64<br />
Atrazine (kg) 1 2.5 $10.33 $25.83<br />
Spot spraying - guinea grass 60hp tractor 1 4ha/hr $3.44 $3.44<br />
Gramoxone (l) 1 0.125 $9.41 $1.18<br />
Hexazinona and Diuron (kg) 1 0.5 $10.74 $5.37<br />
High-clearance spraying 60hp tractor 3 5ha/hr $3.10 $9.30<br />
Herbicide 2 4-D (l) 2 1 $5.64 $11.28<br />
Atrazine (kg) 2 2.5 $10.33 $51.65<br />
Gramoxone (l) 1 1 $9.41 $9.41<br />
Diuron (kg) 1 0.5 $13.59 $6.80<br />
Headland slashing 60hp tractor 5 3ha/hr $8.80 $44.00<br />
Headland spraying 60hp tractor 1 5ha/hr $0.62 $0.62<br />
Gramoxone (l) 1 0.2 $9.41 $1.88<br />
Diuron (kg) 1 0.2 $13.59 $2.72<br />
Spraying banks & fences Glyphosphate (l) 1 1.3 $5.68 $7.38<br />
Harvesting<br />
Contract harvesting 1 85 $6.10 $518.50<br />
Grower levies 85 $0.39 $33.15<br />
Total expenses $1025.45<br />
Gross margin $1201.55<br />
8
Table 4: Gross margin <strong>of</strong> a “traditional” Queensland sugar cane farm in 2002 — ratoon three cane<br />
Activity Machinery/equipment Applications Rate Unit cost $/ha<br />
Income<br />
Sugar cane (t) 80 $26.20 $2096.00<br />
Total income $2096.00<br />
Expenses<br />
Crop care<br />
Spraying 60hp tractor 1 5ha/hr $3.10 $3.10<br />
Herbicide Gramoxone (l) 1 1 $9.41 $9.41<br />
Diuron (kg) 1 0.5 $13.59 $6.80<br />
2 4-D (l) 1 0.5 $5.64 $2.82<br />
Fertiliser application 100hp tractor 1 1ha/hr $15.72 $15.72<br />
60hp tractor with bag lifter 1 6ha/hr $1.65 $1.65<br />
Fertiliser Fertiliser 1 (t) 1 0.625 $391.50 $244.69<br />
Pre-emergent spraying 60hp tractor 1 5ha/hr $3.10 $3.10<br />
Herbicide 2 4-D (l) 1 1 $5.64 $5.64<br />
Atrazine (kg) 1 2.5 $10.33 $25.83<br />
Spot spraying - guinea grass 60hp tractor 1 4ha/hr $3.44 $3.44<br />
Gramoxone (l) 1 0.125 $9.41 $1.18<br />
Hexazinona and Diuron (kg) 1 0.5 $10.74 $5.37<br />
High-clearance spraying 60hp tractor 3 5ha/hr $3.10 $9.30<br />
Herbicide 2 4-D (l) 2 1 $5.64 $11.28<br />
Atrazine (kg) 2 2.5 $10.33 $51.65<br />
Gramoxone (l) 1 1 $9.41 $9.41<br />
Diuron (kg) 1 0.5 $13.59 $6.80<br />
Headland slashing 60hp tractor 5 3ha/hr $8.80 $44.00<br />
Headland spraying 60hp tractor 1 5ha/hr $0.62 $0.62<br />
Gramoxone (l) 1 0.2 $9.41 $1.88<br />
Diuron (kg) 1 0.2 $13.59 $2.72<br />
Spraying banks & fences Glyphosphate (l) 1 1.3 $5.68 $7.38<br />
Harvesting<br />
Contract harvesting 1 80 $6.10 $488.00<br />
Grower levies 80 $0.39 $31.20<br />
Total expenses $993.00<br />
Gross margin $1103.00<br />
9
Table 5: Gross margin <strong>of</strong> a “traditional” Queensland sugar cane farm in 2002 - ratoon four and new plant cane<br />
Activity Machinery/equipment Applications Rate Unit cost $/ha<br />
Income<br />
Sugar cane (t) 75 $26.20 $1965.00<br />
Total income $1965.00<br />
Expenses<br />
Crop care<br />
Spraying 60hp tractor 1 5ha/hr $3.10 $3.10<br />
Herbicide Gramoxone (l) 1 1 $9.41 $9.41<br />
Diuron (kg) 1 0.5 $13.59 $6.80<br />
2 4-D (l) 1 0.5 $5.64 $2.82<br />
Fertiliser application 100hp tractor 1 1ha/hr $15.72 $15.72<br />
60hp tractor with baglifter 1 6ha/hr $1.65 $1.65<br />
Fertiliser Fertiliser 1 (t) 1 0.625 $391.50 $244.69<br />
Pre-emergent spraying 60hp tractor 1 5ha/hr $3.10 $3.10<br />
Herbicide 2 4-D (l) 1 1 $5.64 $5.64<br />
Atrazine (kg) 1 2.5 $10.33 $25.83<br />
Spot spraying - guinea grass 60hp tractor 1 4ha/hr $3.44 $3.44<br />
Gramoxone (l) 1 0.125 $9.41 $1.18<br />
Hexazinona and Diuron (kg) 1 0.5 $10.74 $5.37<br />
High-clearance spraying 60hp tractor 3 5ha/hr $3.10 $9.31<br />
Herbicide 2 4-D (l) 2 1 $5.64 $11.28<br />
Atrazine (kg) 2 2.5 $10.33 $51.65<br />
Gramoxone (l) 1 1 $9.41 $9.41<br />
Diuron (kg) 1 0.5 $13.59 $6.80<br />
Headland slashing 60hp tractor 5 3ha/hr $8.80 $44.01<br />
Headland spraying 60hp tractor 1 5ha/hr $0.62 $0.62<br />
Gramoxone (l) 1 0.2 $9.41 $1.88<br />
Diuron (kg) 1 0.2 $13.59 $2.72<br />
Spraying banks & fences Glyphosphate (l) 1 1.3 $5.68 $7.38<br />
Harvesting<br />
Contract harvesting 1 75 $6.10 $457.50<br />
Grower levies 75 $0.39 $29.25<br />
Lime spreading 60hp tractor and spreader 1 $3.22 $3.22<br />
Lime (t) 1 2 $175.00 $350.00<br />
Ground preparation<br />
Incorporate trash 140hp tractor & <strong>of</strong>fset discs 3 $13.44 $40.31<br />
Ripping both ways 115hp tractor 2 $16.08 $32.17<br />
Rotary hoeing 115hp tractor 1 $18.80 $18.80<br />
Marking out 60hp tractor with 3 tynes 1 $4.78 $4.78<br />
Pre-emergent herbicide 60hp tractor 1 2ha/hr $3.10 $3.10<br />
Diuron (kg) 1 1.5 $13.59 $20.39<br />
Atrazine (kg) 1 1.5 $10.33 $15.50<br />
Planting<br />
Contract planting 1 $300.00 $300.00<br />
Billet cane 1 8 $26.20 $209.60<br />
Fertiliser Fertiliser 2 13 (t) 1 0.375 $452.20 $169.58<br />
Fungicide - pineapple disease Shirtan (bottle) 1 2.5 $8.50 $21.25<br />
13 Fertiliser 2 makeup: Di-ammonium Phosphate (60–70%) and Potassium Chloride (30–40%)<br />
10
Insecticide - wire worm Chlorpyrifos (l) 1 1 $10.57 $10.57<br />
- cane grub suSCon(20kg) 1 1 $254.50 $254.50<br />
Press drills 60hp tractor & roller 1 1 $4.78 $4.78<br />
Row pr<strong>of</strong>ile shaping 60hp tractor & cotton king 1 1 $7.09 $7.09<br />
Crop care<br />
Spraying 60hp tractor 1 5ha/hr $3.10 $3.10<br />
Herbicide Gramoxone (l) 1 1 $9.41 $9.41<br />
Diuron (kg) 1 0.5 $13.59 $6.80<br />
2 4-D (l) 1 0.5 $5.64 $2.82<br />
Cultivation 100hp tractor with grubber tynes 3 1ha/hr $15.72 $47.15<br />
Fertilising with 1 cultivation pass Urea (t) 1 0.1875 $350.00 $65.63<br />
Hilling up 100hp tractor 1 1ha/hr $20.86 $20.86<br />
High-clearance spraying 60hp tractor 3 5ha/hr $3.10 $9.31<br />
Herbicide 2 4-D (l) 2 1 $5.64 $11.28<br />
Atrazine (kg) 2 2.5 $10.33 $51.65<br />
Gramoxone (l) 1 1 $9.41 $9.41<br />
Diuron (kg) 1 0.5 $13.59 $6.80<br />
Headland slashing 60hp tractor 2 3ha/hr $8.80 $17.60<br />
Total expenses $2687.99<br />
Gross margin -$722.99<br />
Under the “traditional” <strong>production</strong> <strong>system</strong>, over the whole crop cycle, a 30ha cane farm will<br />
achieve a gross margin <strong>of</strong> $27,108 (see Table 6).<br />
Table 6: Summary gross margin <strong>of</strong> a “traditional” Queensland sugar cane farm in 2002 - whole crop cycle for a<br />
hypothetical 30 ha operation 14<br />
Crop cycle Income ($/farm) Expenses ($/farm) Gross margin ($/farm)<br />
One-year old cane $13,362 $3,544 $9,818<br />
Ratoon 1 $14,148 $6,347 $7,801<br />
Ratoon 2 $13,362 $6,153 $7,209<br />
Ratoon 3 $12,576 $5,958 $6,618<br />
Ratoon 4 and new plant cane $11,790 $16,128 -$-4338<br />
Total crop cycle $65,238 $38,130 $27,108<br />
Why change <strong>production</strong> practices?<br />
Recent reports have potentially linked agricultural activities within the Great Barrier Reef<br />
catchment area, with water quality problems in the Great Barrier Reef lagoon. 15<br />
In line with the precautionary principal, many features proposed below under the “<strong>eco</strong>efficient”<br />
<strong>production</strong> <strong>system</strong> (e.g. reduced chemical application, and reduced cultivations)<br />
will further reduce any potential sediment and pollutants that run <strong>of</strong>f from sugar cane<br />
<strong>production</strong> areas.<br />
A variety <strong>of</strong> factors (e.g. low world sugar price, disease problems and drought) have<br />
negatively impacted on the financial returns Queensland cane producers have recently been<br />
receiving. An “<strong>eco</strong>-efficient” <strong>production</strong> <strong>system</strong> may also <strong>of</strong>fer substantial financial benefits<br />
as indicated below for cane producers.<br />
14 Based on a farm with 5 paddocks, each <strong>of</strong> which is 6 ha in size. This farm size is not representative <strong>of</strong> the<br />
industry average.<br />
15 Productivity Commission (2003) and Baker (2003)<br />
11
“Eco-efficient” <strong>production</strong> and sugar cane<br />
“Eco-efficient” <strong>production</strong> has been defined as ‘doing more with less’. Table 7 highlights<br />
some possible actions that could reduce the amount <strong>of</strong> inputs used by Queensland sugar cane<br />
producers, while maintaining, or increasing, yields per unit area. The proposed “<strong>eco</strong>efficient”<br />
<strong>production</strong> <strong>system</strong> is based upon research conducted over the last four years<br />
through the Sugar Yield Decline Joint Venture Project, and by the <strong>Department</strong> <strong>of</strong> <strong>Primary</strong><br />
<strong>Industries</strong>, Queensland, Sugar Solutions project. The definition <strong>of</strong> “<strong>eco</strong>-efficient” <strong>production</strong><br />
<strong>of</strong> sugar cane is still evolving, and what it involves will undoubtedly change in the future as<br />
science and research/commercial trials provide more insights.<br />
For “<strong>eco</strong>-efficient” <strong>production</strong> <strong>system</strong>s to have positive impacts on the environment they<br />
must be ‘<strong>eco</strong>-effective’. In the instance <strong>of</strong> sugar cane, this may mean a reduction <strong>of</strong> inputs<br />
such as fertiliser, fuel and pesticides, but also a reduction in the amount <strong>of</strong> land used (i.e. land<br />
that is close to waterways or has a steep slope). 16 On the other hand “<strong>eco</strong>-effective” land use<br />
may also result in more land being brought into <strong>production</strong>, especially if different uses for<br />
sugarcane (e.g. biomass ) are introduced.<br />
Table 7: Possible actions to “<strong>eco</strong>-efficient” <strong>production</strong> <strong>of</strong> sugar cane assumed in the proposed “<strong>eco</strong>-efficient”<br />
<strong>system</strong><br />
Action Production effect Economic effect<br />
Crop rotation<br />
Soybean fallow<br />
Planting<br />
Zero-till planting and control traffic<br />
Fertiliser (mainly P and K, with<br />
reasonably low levels <strong>of</strong> N)<br />
Replace Shirtan fungicide with<br />
Bumpa fungicide<br />
Replace Chlorpyrifos insecticide<br />
with Fipronil insecticide<br />
Reduced need to use suSCon (i.e.<br />
every s<strong>eco</strong>nd planting)<br />
Crop Care<br />
Shrouded sprayer<br />
Provides N (in a slow release form),<br />
increases organic matter in the soil<br />
and improves soil health.<br />
Eliminate soil preparation<br />
operations.<br />
Soybean fallow allows a fertiliser<br />
low in N to be used, and at lower<br />
rates.<br />
Bumpa does not contain mercuric<br />
compounds.<br />
Fipronil is not an organophosphate.<br />
Increased levels <strong>of</strong> organic matter in<br />
the soil increase the population <strong>of</strong><br />
beneficial insects with subsequent<br />
impacts on cane grub populations.<br />
Enables joint use <strong>of</strong> Glyphosphate<br />
and Gramoxone for weed control<br />
rather than Atrazine and Diuron.<br />
Reduces need for in-crop<br />
cultivations.<br />
There are costs to grow soybean<br />
crop.<br />
Research trials suggest increase in<br />
sugar cane yield between 10–30%<br />
Reduced tractor and implement<br />
repairs and maintenance and fuel<br />
use and reduced tractor sizes.<br />
Reduced N costs for new plant<br />
cane.<br />
Reduced fungicide costs.<br />
Increased insecticide cost.<br />
Reduced insecticide cost.<br />
Increased sprayer operation cost.<br />
Reduced herbicide cost. Reduced<br />
cultivation operation cost.<br />
It is assumed that a typical “<strong>eco</strong>-efficient” sugar cane farm in Queensland would operate a<br />
six-block <strong>production</strong> <strong>system</strong> that incorporates a legume rotation. 17 In any one year, an “<strong>eco</strong>efficient”<br />
sugar cane farm would have a proportion <strong>of</strong> the land under:<br />
16 The transfer <strong>of</strong> land out <strong>of</strong> cane <strong>production</strong> for environmental purposes has not been factored into this analysis<br />
but does need to be considered in the future.<br />
17 Soybeans have been used as the legume rotation crop in this study, however it is possible to use other legumes<br />
as the rotation crop (e.g. navy beans and peanuts).<br />
12
New plant (Block 1)<br />
One-year old cane (Block 2)<br />
Ratoon 1 (Block 3) (two-year old cane plant)<br />
Ratoon 2 (Block 4) (three-year old cane plant)<br />
Ratoon 3 (Block 5) (four-year old cane plant)<br />
Ratoon 4 (Block 6) (five-year old cane plant)<br />
Figure 2: Production map <strong>of</strong> a hypothetical “<strong>eco</strong>-efficient” sugar cane farm in 2002 (January–December)<br />
Block 1: New plant cane (Table 8)<br />
Plant cane — May to June<br />
Block 3: Ratoon 1 (Table 10)<br />
Harvest — June to November<br />
Block 5: Ratoon 3 (Table 12)<br />
Harvest — June to November<br />
Block 2: One-year old cane (Table 9)<br />
Harvest — June to November<br />
Block 4: Ratoon 2 (Table 11)<br />
Harvest — June to November<br />
Block 6: Ratoon 4 (Table 13 and<br />
Table 14)<br />
Harvest — October to November<br />
Zero-till plant soybeans — November<br />
to December<br />
For the purpose <strong>of</strong> this study, the authors have assumed this hypothetical farm is a rain grown<br />
sugar cane <strong>production</strong> <strong>system</strong>, rather than an irrigated <strong>production</strong> <strong>system</strong>. Each paddock<br />
under this <strong>production</strong> <strong>system</strong> is harvested five years out <strong>of</strong> every six years. As with<br />
“traditional” sugar cane <strong>production</strong>, the <strong>production</strong> requirements <strong>of</strong> new plant cane, one-year<br />
old and ratoon cane are different under an “<strong>eco</strong>-efficient” <strong>production</strong> <strong>system</strong>. The yield<br />
expectations between one-year old cane and ratoon crops are also different. The gross<br />
margins for the assumed “<strong>eco</strong>-efficient” <strong>production</strong> <strong>system</strong> are shown below in Table 8<br />
through to Table 15. The chemicals listed in the gross margins may not be the optimal<br />
choices for all sugar cane growing regions in Queensland.<br />
It is assumed that under this <strong>system</strong>, sugar cane yields per hectare increase by 15%. 18<br />
However, due to the incorporation <strong>of</strong> a rotation crop, every year sugar cane is not harvested<br />
from one <strong>of</strong> the six blocks (new plant cane). The resulting reduction in income is largely<br />
compensated for by an increase in yields in the blocks harvested.<br />
18 The assumed increase in sugar cane yields is based upon experimental results from the Sugar Yield Decline<br />
Joint Venture Project.<br />
13
Table 8: Gross margin <strong>of</strong> an “<strong>eco</strong>-efficient” Queensland sugar cane farm in 2002 — new plant cane<br />
Activity Machinery/equipment Applications Rate Unit cost $/ha<br />
Income<br />
Sugar cane (t) 0 $26.20 $0<br />
Total income $0<br />
Expenses<br />
Planting<br />
Contract billet planting 1 $300.00 $300.00<br />
Billet cane 1 2.5 19 $26.20 $65.50<br />
Fertiliser Fertiliser 3 20 (t) 1 0.25 $445.00 $111.25<br />
Fungicide - pineapple disease Bumpa (l) 1 0.15 $85.45 $12.82<br />
Insecticide - wire worm Fipronil (l) 1 0.075 $330.00 $24.75<br />
- cane grub suScon (20kg) 21 1 0.5 $254.50 $127.25<br />
Crop care<br />
Spraying Shrouded sprayer 3 3ha/hr $6.32 $18.95<br />
Herbicide Gramoxone (l) 3 1 $9.41 $28.23<br />
Glyphosphate (l) 2 2 $5.68 $22.72<br />
Headland slashing 60hp tractor 2 3ha/hr $8.80 $17.60<br />
Total expenses $729.07<br />
Gross margin -$729.07<br />
Table 9: Gross margin for an “<strong>eco</strong>-efficient” Queensland sugar cane farm in 2002 — 1-year old cane<br />
Activity Machinery/equipment Applications Rate Unit cost $/ha<br />
Income<br />
Sugar cane (t) 97.75 $26.20 $2561.05<br />
Total income $2561.05<br />
Expenses<br />
Crop care<br />
Headland slashing 60hp tractor 3 3ha/hr $8.80 $26.40<br />
Headland spraying 22 60hp tractor 1 5ha/hr3 $0.62 $0.62<br />
Gramoxone (l) 1 0.2 $9.41 $1.88<br />
Diuron 1 0.2 $13.59 $2.72<br />
Spraying banks and fences Glyphosphate (l) 1 1.3 $5.68 $7.38<br />
Harvesting<br />
Contract harvesting 1 97.75 $6.10 $596.28<br />
Grower levies 1 97.75 $0.39 $38.12<br />
Total expenses $673.41<br />
Gross margin $1887.64<br />
19 “Eco-efficient” <strong>production</strong> <strong>system</strong> uses fewer billets (2.5t/ha versus 8t/ha) because it is assumed that a state<strong>of</strong>-the-art<br />
planter is used that more precisely measures out cane billets.<br />
20 Fertiliser 3 makeup: Di-ammonium Phosphate (40–50%) and Potassium Chloride (50–60%).<br />
21 The industry currently has a widely developed and acknowledge Integrated Pest Management (IPM) program<br />
in place. The suggestion in the paper that this use <strong>of</strong> suSCon for cane grub control be reduced to one in every<br />
s<strong>eco</strong>nd planting is a contentious and unproven assumption, as it relies on predictable, but unquantified, benefits<br />
<strong>of</strong> higher levels <strong>of</strong> organic matter. It does r<strong>eco</strong>gnise that regardless <strong>of</strong> what annual management strategies are<br />
used, cyclical cane grub populations will still need to be controlled. The need for IPM cane grub control will<br />
vary between regions based on location, soil type, level <strong>of</strong> organic matter in the soil, cane grub species and level<br />
<strong>of</strong> natural pests and predators to the cane grub.<br />
22 The variable cost <strong>of</strong> headland spraying is assumed to be 20% <strong>of</strong> the variable cost <strong>of</strong> crop spraying (i.e. the<br />
headlands are assumed to be 20% <strong>of</strong> the farm area).<br />
14
Table 10: Gross margin <strong>of</strong> an “<strong>eco</strong>-efficient” Queensland sugar cane farm in 2002 — ratoon one cane<br />
Activity Machinery/equipment Applications Rate Unit cost $/ha<br />
Income<br />
Sugar cane (t) 102.75 $26.20 $2692.05<br />
Total income $2692.05<br />
Expenses<br />
Crop care<br />
Spraying Shrouded sprayer 2 3ha/hr $6.32 $12.63<br />
Herbicide Gramoxone (l) 2 1 $9.41 $18.82<br />
Glyphosphate (l) 2 2 $5.68 $22.72<br />
Fertiliser application 85hp tractor 1 1ha/hr $14.09 $14.09<br />
60hp tractor with bag lifter 1 6ha/hr $1.65 $1.65<br />
Fertiliser Fertiliser 1 (t) 1 0.625 $391.50 $244.69<br />
Spot spraying - guinea grass 60hp tractor 1 4ha/hr $3.44 $3.44<br />
Gramoxone (l) 1 0.25 $9.41 $2.35<br />
Hexazinona and Diuron (kg) 1 0.5 $10.74 $5.37<br />
Headland slashing 60hp tractor 5 3ha/hr $8.80 $44.01<br />
Spraying 60hp tractor 1 5ha/hr $0.62 $0.62<br />
Headland spraying Gramoxone (l) 1 0.2 $9.41 $1.88<br />
Diuron (kg) 1 0.2 $13.59 $2.72<br />
Spraying banks & fences Glyphosphate (l) 1 1.3 $5.68 $7.38<br />
Harvesting<br />
Contract harvesting 1 102.75 $6.10 $626.78<br />
Grower levies 102.75 $0.39 $40.07<br />
Total expenses $1049.22<br />
Gross margin – ratoon 1 $1642.83<br />
15
Table 11: Gross margin <strong>of</strong> an “<strong>eco</strong>-efficient” Queensland sugar cane farm in 2002 — ratoon two cane<br />
Activity Machinery/equipment Applications Rate Unit cost $/ha<br />
Income<br />
Sugar cane (t) 97.75 $26.20 $2561.05<br />
Total income $2561.05<br />
Expenses<br />
Crop care<br />
Spraying Shrouded sprayer 2 3ha/hr $6.32 $12.63<br />
Herbicide Gramoxone (l) 2 1 $9.41 $18.82<br />
Glyphosphate (l) 2 2 $5.68 $22.72<br />
Fertiliser application 85hp tractor 1 1ha/hr $14.09 $14.09<br />
60hp tractor with bag lifter 1 6ha/hr $1.65 $1.65<br />
Fertiliser Fertiliser 1 (t) 1 0.625 $391.50 $244.69<br />
Spot spraying - guinea grass 60hp tractor 1 2ha/hr $3.44 $3.44<br />
Gramoxone (l) 1 0.25 $9.41 $2.35<br />
Hexazinona and Diuron (kg) 1 0.5 $10.74 $5.37<br />
Headland slashing 60hp tractor 5 3ha/hr $8.80 $44.01<br />
Headland spraying 60hp tractor 1 5ha/hr $0.62 $0.62<br />
Gramoxone (l) 1 0.2 $9.41 $1.88<br />
Diuron (kg) 1 0.2 $13.59 $2.72<br />
Spraying banks & fences Glyphosphate (l) 1 1.3 $5.68 $7.38<br />
Harvesting<br />
Contract harvesting 1 97.75 $6.10 $596.28<br />
Grower levies 97.75 $0.39 $38.12<br />
Total expenses $1016.77<br />
Gross margin $1544.28<br />
16
Table 12: Gross margin <strong>of</strong> an “<strong>eco</strong>-efficient” Queensland sugar cane farm in 2002 — ratoon three cane<br />
Activity Machinery/equipment Applications Rate Unit cost $/ha<br />
Income<br />
Sugar cane (t) 92.75 $26.20 $2430.05<br />
Total income $2430.05<br />
Expenses<br />
Crop care<br />
Spraying Shrouded sprayer 2 3ha/hr $6.32 $12.63<br />
Herbicide Gramoxone (l) 2 1 $9.41 $18.82<br />
Glyphosphate (l) 2 2 $5.68 $22.72<br />
Fertiliser application 85hp tractor 1 1ha/hr $14.09 $14.09<br />
60hp tractor with bag lifter 1 6ha/hr $1.65 $1.65<br />
Fertiliser Fertiliser 1 (t) 1 0.625 $391.50 $244.69<br />
Spot spraying - guinea grass 60hp tractor 1 4ha/hr $3.44 $3.44<br />
Gramoxone (l) 1 0.25 $9.41 $2.35<br />
Hexazinona and Diuron (kg) 1 0.5 $10.74 $5.37<br />
Headland slashing 60hp tractor 5 3ha/hr $8.80 $44.01<br />
Spraying 60hp tractor 1 5ha/hr $0.62 $0.62<br />
Headland spraying Gramoxone (l) 1 0.2 $9.41 $1.88<br />
Diuron (kg) 1 0.2 $13.59 $2.72<br />
Spraying banks & fences Glyphosphate (l) 1 1.3 $5.68 $7.38<br />
Harvesting<br />
Contract harvesting 1 92.75 $6.10 $565.78<br />
Grower levies 92.75 $0.39 $36.17<br />
Total expenses $984.32<br />
Gross margin $1445.73<br />
17
Table 13: Gross Margin <strong>of</strong> an “<strong>eco</strong>-efficient” Queensland sugar cane farm in 2002 — ratoon four cane<br />
Activity Machinery/equipment Applications Rate Unit cost $/ha<br />
Income<br />
Sugar cane (t) 87.75 $26.20 $2299.05<br />
Total income $2299.05<br />
Expenses<br />
Crop care<br />
Spraying Shrouded sprayer 2 3ha/hr $6.32 $12.63<br />
Herbicide Gramoxone (l) 2 1 $9.41 $18.82<br />
Glyphosphate (l) 2 2 $5.68 $22.72<br />
2 4-D (l) 1 0.5 $5.64 $2.82<br />
Fertiliser application 85hp tractor 1 1ha/hr $14.09 $14.09<br />
60hp tractor with bag lifter 1 6ha/hr $1.65 $1.65<br />
Fertiliser Fertiliser 1 (t) 1 0.625 $391.50 $244.69<br />
Spot spraying - guinea grass 60hp tractor 1 4ha/hr $3.44 $3.44<br />
Gramoxone (l) 1 0.25 $9.41 $2.35<br />
Hexazinona and Diuron (kg) 1 0.5 $10.74 $5.37<br />
Headland slashing 60hp tractor 5 3ha/hr $8.80 $44.01<br />
Headland spraying 60hp tractor 1 5ha/hr $0.62 $0.62<br />
Gramoxone (l) 1 0.2 $9.41 $1.88<br />
Diuron 1 0.2 $13.59 $2.72<br />
Spraying banks & fences Glyphosphate (l) 1 1.3 $5.68 $7.38<br />
Harvesting<br />
Contract harvesting 1 87.75 $6.10 $535.28<br />
Grower levies 87.75 $0.39 $34.22<br />
Lime spreading) 60hp tractor and spreader 1 $3.22 $3.22<br />
Lime (t) 1 2 $175 $350.00<br />
Total expenses $1307.92<br />
Gross margin $991.13<br />
18
Table 14: Gross margin <strong>of</strong> an “<strong>eco</strong>-efficient” Queensland sugar cane farm in 2002 — soybean fallow<br />
Activity Machinery/equipment Applications Rate Unit cost $/ha<br />
Income<br />
Total income $0<br />
Expenses<br />
Ground preparation<br />
Spray out cane 60hp tractor 1 5ha/hr $3.10 $3.10<br />
Glyphosphate (l) 1 7 $5.68 $39.76<br />
Planting<br />
Planter Covington 4-row 1 1ha/hr $21.90 $21.90<br />
Seed Leichhardt (kg) 1 50 $1.36 $68.00<br />
Inoculant (pkt) 1 0.3 $6.00 $1.80<br />
Crop care<br />
Spraying 60hp tractor 1 5ha/hr $3.10 $3.10<br />
Herbicide Gramoxone (l) 1 1 $9.41 $9.41<br />
Spray out soybeans 60hp tractor 1 5ha/hr $3.10 $3.10<br />
Glyphosphate (l) 1 2 $5.68 $11.36<br />
24D (l) 1 1 $5.64 $5.64<br />
Total expenses $167.18<br />
Gross margin -$167.18<br />
Table 15: Gross margin <strong>of</strong> an “<strong>eco</strong>-efficient” Queensland sugar cane farm in 2010 – whole crop cycle <strong>of</strong> a<br />
hypothetical 30 ha operation 23<br />
Crop cycle Income ($/farm) Expenses ($/farm) Gross margin ($/farm)<br />
New plant 24 $0 $3,645 -$3,645<br />
1 year old cane $12,805 $3,367 $9,438<br />
Ratoon 1 $13,460 $5,246 $8,214<br />
Ratoon 2 $12,805 $5,084 $7,721<br />
Ratoon 3 $12,150 $4,922 $7,228<br />
Ratoon 4 and soybean rotation $11,495 $7,376 $4,119<br />
Total crop cycle $62,715 $29,640 $33,075<br />
Under the “<strong>eco</strong>-efficient” <strong>production</strong> <strong>system</strong>, over the whole crop cycle a 30ha farming<br />
operation would achieve a gross margin <strong>of</strong> $33,075 (see Table 15). In this <strong>system</strong>, it is<br />
assumed that the soybean crop is slashed without being harvested. The returns from the “<strong>eco</strong>efficient”<br />
<strong>production</strong> <strong>system</strong> would be improved if the soybean crop was harvested rather<br />
than just slashed. This would reduce the amount <strong>of</strong> nitrogen returned into the <strong>system</strong>,<br />
however research undertaken by the Sugar Yield Decline Joint Venture project indicates that<br />
the additional income can be obtained without sacrificing the rotation benefits <strong>of</strong> reduced<br />
pathogens, increased yields and reduced nitrogen fertiliser in the plant crop. It should be<br />
noted that seasonal wet weather conditions might prevent seed harvesting in some cane<br />
producing regions in Queensland (i.e. Townsville north).<br />
23 Based on a farm with 6 paddocks, each <strong>of</strong> which is 5 ha in size. This is not representative <strong>of</strong> the industry<br />
average.<br />
24 The costs associated with the soybean crop have been incorporated, in this instance, with the new plant gross<br />
margin. However, some expenses (e.g. planting) would actually occur within the ratoon 4 year.<br />
19
Comparison <strong>of</strong> “traditional” and “<strong>eco</strong>-efficient” <strong>production</strong> <strong>system</strong>s<br />
Table 16: Gross margin comparison between “traditional” and “<strong>eco</strong>-efficient” sugar cane <strong>production</strong> <strong>system</strong>s<br />
over a 30ha land area (on an annual basis)<br />
Production <strong>system</strong> Income ($/farm) Expenses ($/farm) Gross margin ($/farm)<br />
Traditional $65,238 $38,130 $27,108<br />
Eco-efficient $62,715 $29,640 $33,075<br />
Difference (% change) -4% -22% 22% 25<br />
A comparison between the assumed “traditional” and “<strong>eco</strong>-efficient” <strong>production</strong> <strong>system</strong>s<br />
reveals that under the “<strong>eco</strong>-efficient” <strong>system</strong>:<br />
Sugar cane income per farm decreases by 4%<br />
Total expenses per farm decline by 22%<br />
The gross margin per farm increases by 22%<br />
The lower sugar cane income under the “<strong>eco</strong>-efficient” <strong>production</strong> <strong>system</strong> reflects that, there<br />
is one stage (new plant cane) without sugar cane income. The lower expenses reflect the<br />
assumed reduction in machinery operations, sugar cane billets and chemical (fertiliser,<br />
herbicides and pesticides) use. The reduction in these costs is slightly <strong>of</strong>fset by costs <strong>of</strong> the<br />
soybean rotation crop, and higher harvesting costs and grower levies (due to bigger yields).<br />
The lower expenses and slightly lower income translate into a 22% increase in the gross<br />
margin.<br />
Methodology<br />
This study uses the Monash Multi-Regional Forecasting (MMRF) model to produce an<br />
alternative forecast for the Queensland sugar cane farming industry, based on the adoption, as<br />
discussed earlier, <strong>of</strong> the proposed “<strong>eco</strong>-efficient” <strong>production</strong> <strong>system</strong> by the industry. The<br />
study quantifies the likely impact the adoption <strong>of</strong> “<strong>eco</strong>-efficient” <strong>production</strong> in the sugar cane<br />
industry has on other sectors, and the Queensland and national <strong>eco</strong>nomies.<br />
Economic Model<br />
MMRF is a multi-sector dynamic model <strong>of</strong> the Australian <strong>eco</strong>nomy covering the six states<br />
and two territories. It models each state as an <strong>eco</strong>nomy in its own right, with state-specific<br />
prices, state specific-consumers and state-specific industries. Since MMRF is dynamic it is<br />
able to produce sequences <strong>of</strong> annual solutions connected by dynamic relationships. The<br />
model also includes enhanced capabilities for environmental analysis, and a regional<br />
disaggregation facility that allows results for the six states to be disaggregated down to 56<br />
sub-states regions (Statistical Divisions).<br />
The strength <strong>of</strong> the MMRF model is in tracing the regional effects <strong>of</strong> reforms or events that<br />
are regional specific. It has already been used to address a wide range <strong>of</strong> issues, including the<br />
<strong>eco</strong>nomic impacts <strong>of</strong> a foot-and-mouth disease outbreak in Queensland, the effects <strong>of</strong> global<br />
trading in greenhouse emission permits, and the effects <strong>of</strong> changes in state and federal taxes.<br />
25 Expenses in the gross margins include the variable costs <strong>of</strong> machinery and implement operations, chemicals<br />
costs (fertiliser, insecticides and herbicides), contract costs (sugar cane planting and harvesting) and grower<br />
levies.<br />
20
Assumptions<br />
Intermediate inputs<br />
The adoption <strong>of</strong> “<strong>eco</strong>-efficient” <strong>production</strong> methods by the Queensland sugar cane farming<br />
industry is assumed to change the amount <strong>of</strong> intermediate inputs used by the industry. The<br />
industry will use less <strong>of</strong> some inputs and more <strong>of</strong> others. The assumed changes in input usage<br />
are calculated by using the gross margins <strong>of</strong> “traditional” and “<strong>eco</strong>-efficient” sugar<br />
<strong>production</strong> (Table 1to Table 15) as a basis. 26<br />
To model the adoption <strong>of</strong> “<strong>eco</strong>-efficient” <strong>production</strong> by the Queensland sugar cane industry<br />
we alter the input usage <strong>of</strong> Queensland sugar cane farming. In Table 17 are the assumed total<br />
percentage changes in input usage over a ten-year period (2003–12), and the associated total<br />
absolute ($m) changes. It is assumed that these changes will occur linearly over the ten years.<br />
Table 17: Assumed changes in input usage by the Queensland sugar cane growing industry as a result <strong>of</strong> the<br />
adoption <strong>of</strong> ”<strong>eco</strong>-efficient” <strong>production</strong> (changes from basecase)<br />
Input<br />
Total change over the ten years 2003 to<br />
2012: percentage<br />
Other crops (Soybean seed) 690.0 6.0<br />
Petroleum refining -33.0 -16.8<br />
Chemicals -23.0 -74.8<br />
Repairs -26.0 -11.4<br />
Labour -30.0 -217.3<br />
Total -314.3<br />
Total change over the ten years 2003 to<br />
2012: $m*<br />
* Derived by applying the total percentage change to the dollar cost <strong>of</strong> the input in 2003 taken from the basecase simulation.<br />
Labour<br />
The “<strong>eco</strong>-efficient” <strong>production</strong> <strong>system</strong> also requires less labour per unit <strong>of</strong> output. It is<br />
estimated that, under the modelling assumptions, the elimination <strong>of</strong> ground preparation<br />
before planting and fewer in-crop sprays will reduce the amount <strong>of</strong> labour per unit <strong>of</strong> output<br />
by 30%. It is assumed that the surplus labour will be utilised elsewhere in the <strong>eco</strong>nomy.<br />
Sugar cane <strong>production</strong><br />
It is assumed that the adoption <strong>of</strong> “<strong>eco</strong>-efficient” farming practices will increase sugar cane<br />
yields by 15% (see Table 7). However, under an “<strong>eco</strong>-efficient” <strong>production</strong> <strong>system</strong>, 1/6 <strong>of</strong><br />
land is not harvested each year. Therefore, we have assumed that the increase in yield largely<br />
<strong>of</strong>fsets the reduction in the area harvested each year. 27<br />
The adoption <strong>of</strong> an “<strong>eco</strong>-efficient” <strong>production</strong> <strong>system</strong> by the Queensland sugar cane farming<br />
industry is modelled as a technological change in the industry. The <strong>production</strong> assumptions<br />
imply that there is a technological improvement in the industry.<br />
26 The percentage changes indicated in Table 17 for petroleum refining, chemicals and repairs are highly<br />
conservative.<br />
27 We have assumed that the area <strong>of</strong> land harvested declines annually by 15% and that this is accompanied by a<br />
15% increase in land productivity.<br />
21
Results<br />
National macro<strong>eco</strong>nomic effects<br />
Figure 3: National real GDP and factor inputs<br />
Capital stock Employment Real GDP<br />
0.040<br />
0.035<br />
0.030<br />
0.025<br />
0.020<br />
0.015<br />
0.010<br />
0.005<br />
0.000<br />
2003<br />
2004<br />
2005<br />
2006<br />
2007<br />
2008<br />
2009<br />
2010<br />
2011<br />
2012<br />
2013<br />
2014<br />
2015<br />
2016<br />
2017<br />
2018<br />
2019<br />
2020<br />
Deviation from basecase (%)<br />
The adoption <strong>of</strong> “<strong>eco</strong>-efficient” sugar cane <strong>production</strong> in Queensland is forecast to increase<br />
real Gross Domestic Product (GDP) above basecase values. The increase in real GDP is<br />
predominantly driven by the direct effect <strong>of</strong> the assumed technological improvements. A<br />
forecast increase in capital stock also contributes to the increase in real GDP. 28 In total, real<br />
GDP is forecast to be 0.034% or $426m above the basecase in 2020.<br />
It is an assumption in the model that real wages adjust so that the effect <strong>of</strong> an external shock<br />
on employment in Queensland and the rest <strong>of</strong> Australia, moves in line with the basecase in all<br />
years <strong>of</strong> the projection period. Therefore, by assumption, national employment does not<br />
deviate from the basecase. Over this period, real wages are forecast to fall below the basecase<br />
in order to induce other industries to absorb the surplus employment. 29<br />
Queensland effects<br />
Adoption <strong>of</strong> the proposed “<strong>eco</strong>-efficient” sugar cane <strong>production</strong> in Queensland is forecast to<br />
increase real Gross State Product (GSP) in Queensland by 0.195% or $399m in 2020. This<br />
represents 94% <strong>of</strong> the forecast national GDP gain. The majority <strong>of</strong> the gain from the adoption<br />
<strong>of</strong> <strong>eco</strong>-efficient sugar cane <strong>production</strong> is forecast to occur in Queensland because the<br />
assumed technological improvements are occurring in a Queensland industry and it is<br />
assumed that this initial loss <strong>of</strong> employment in the sugar cane industry is <strong>of</strong>fset by expanded<br />
employment in other Queensland industries. 30<br />
28 In the long-term, the rates <strong>of</strong> returns to fixed factors (e.g. land and labour) are forecast to increase relative to<br />
the rates <strong>of</strong> returns to capital (variable factor), which leads to some substitution <strong>of</strong> capital for fixed factors<br />
In this modelling, we assumed that real consumption moves in line with real income. Private consumption is<br />
forecast to increase above the basecase by 0.023% in 2020, reflecting an increase in factor income (caused by<br />
assumed cost savings and increase in capital). The increase in private consumption is forecast to be less than the<br />
increase in real GDP, this is caused by a reduction in purchasing power caused by a small reduction in the terms<br />
<strong>of</strong> trade. Investment is forecast to be 0.034% above the basecase in 2020, reflecting the substitution <strong>of</strong> capital<br />
for fixed factors in the long-term.<br />
29 It is assumed that there will be a 30% reduction in the labour required per unit <strong>of</strong> sugar cane industry output.<br />
Because the output <strong>of</strong> the industry is assumed to be relatively unchanged, the assumed reduction in labour<br />
requirements results in a fall <strong>of</strong> approximately 30% in sugar cane farming employment.<br />
30 The real wage rate in Queensland is forecast to decline below basecase, which facilitates the absorption <strong>of</strong><br />
surplus labour by other Queensland industries.<br />
22
Figure 4: Queensland GSP<br />
0.25<br />
0.20<br />
0.15<br />
0.10<br />
0.05<br />
0.00<br />
2003<br />
2004<br />
2005<br />
2006<br />
2007<br />
2008<br />
2009<br />
2010<br />
2011<br />
2012<br />
Deviation from basecase (%)<br />
2013<br />
2014<br />
2015<br />
2016<br />
2017<br />
2018<br />
2019<br />
2020<br />
Regional effects<br />
The MMRF model is capable <strong>of</strong> modelling the impact that the adoption <strong>of</strong> “<strong>eco</strong>-efficient”<br />
<strong>production</strong> has on Queensland sub-state regions (i.e. statistical divisions). These impacts have<br />
not been reported in this paper, but will be included in a technical paper that is to be released<br />
later this year.<br />
Industry effects<br />
According to the MMRF 1996–97 31 database, Queensland’s sugar cane farming industry<br />
<strong>production</strong> was $1120m, all <strong>of</strong> which was supplied to the sugar milling industry.<br />
Output from the Queensland sugar cane farming industry is assumed to be relatively<br />
unchanged. This is achieved through various assumptions, including that the effective input<br />
<strong>of</strong> land for sugar cane farming does not change from basecase values, and that the changes in<br />
technology have no impact <strong>of</strong> the quantity <strong>of</strong> productive capital. Because output, land and<br />
capital are assumed fixed, effective labour is also fixed.<br />
Figure 5: Sugar cane pr<strong>of</strong>itability<br />
Deviation from basecase (%)<br />
35<br />
30<br />
25<br />
20<br />
15<br />
10<br />
5<br />
0<br />
2003<br />
2004<br />
2005<br />
2006<br />
2007<br />
2008<br />
2009<br />
2010<br />
2011<br />
2012<br />
2013<br />
2014<br />
2015<br />
2016<br />
2017<br />
2018<br />
2019<br />
2020<br />
31 The Centre <strong>of</strong> Policy Studies begins with a 1996–97 database and uses the MMRF model to project the<br />
basecase forward to 2020.<br />
23
Because it is assumed that output from Queensland sugar cane industry is relatively<br />
unchanged there is little change in the price received by sugar cane producers. Because the<br />
change in the price <strong>of</strong> sugar cane is very small, the cost reductions resulting from the<br />
technological improvements result in a significant increase in the unit cost <strong>of</strong> capital (unit<br />
pr<strong>of</strong>it or pr<strong>of</strong>itability). Therefore the assumed technological improvements do not lead to an<br />
increase in sugar cane <strong>production</strong>, but rather an increase in the pr<strong>of</strong>itability <strong>of</strong> sugar cane<br />
<strong>production</strong>. In 2020, the pr<strong>of</strong>itability <strong>of</strong> the Queensland sugar cane industry is 33.1% above<br />
the basecase.<br />
The adoption <strong>of</strong> “<strong>eco</strong>-efficient” sugar cane <strong>production</strong> in Queensland is forecast to have a<br />
very small impact on the Queensland sugar manufacturing/refining industry. This is because:<br />
1. output from the sugar cane industry is assumed to be relatively unchanged<br />
2. the price <strong>of</strong> sugar is not greatly affected<br />
The Queensland other crops industry is forecast to benefit from the adoption <strong>of</strong> the “<strong>eco</strong>efficient”<br />
<strong>production</strong> <strong>system</strong>. Output from other crops is forecast to increase by 0.089% or<br />
$4.1m in 2020. This industry produces soybean seeds and the increase in the industry’s<br />
output reflects the assumed increase in the use <strong>of</strong> soybean seeds by the Queensland sugar<br />
cane growing industry.<br />
Conclusions<br />
To the authors’ knowledge, this is the first study to examine, under the modelling<br />
assumptions, the broader <strong>eco</strong>nomic implications <strong>of</strong> the adoption <strong>of</strong> “<strong>eco</strong>-efficient” sugar cane<br />
<strong>production</strong> in Queensland. The results <strong>of</strong> this study indicate that the proposed “<strong>eco</strong>-efficient”<br />
<strong>production</strong> <strong>system</strong> has the potential to benefit sugar cane growers and the Queensland and<br />
national <strong>eco</strong>nomies.<br />
A gross margin analysis between the assumed generic “traditional” sugar cane <strong>production</strong><br />
<strong>system</strong> and the proposed “<strong>eco</strong>-efficient” <strong>production</strong> <strong>system</strong> estimates that, sugar cane income<br />
could decrease by 4% and expenses could decline by 22%, resulting in a 22% increase in the<br />
gross margin. It is also estimated that the <strong>eco</strong>-efficient <strong>production</strong> <strong>system</strong> would require 30%<br />
less labour per unit <strong>of</strong> output.<br />
The MMRF model is used to evaluate the broader <strong>eco</strong>nomic implications <strong>of</strong> the adoption <strong>of</strong><br />
“<strong>eco</strong>-efficient” sugar cane <strong>production</strong> in Queensland. It is forecast that the adoption <strong>of</strong> the<br />
<strong>production</strong> <strong>system</strong> will lead to a $426m increase in the size <strong>of</strong> the national <strong>eco</strong>nomy in 2020<br />
(the final year <strong>of</strong> the simulation) and a $399m increase in the size <strong>of</strong> the Queensland<br />
<strong>eco</strong>nomy. The pr<strong>of</strong>itability <strong>of</strong> Queensland sugar cane growing is forecast to increase by 33%<br />
in 2020.<br />
The MMRF model is an accepted tool that can be used to analyse complex issues, providing<br />
its limitations are understood. This model allows you to evaluate a number <strong>of</strong> issues, and<br />
could be used to evaluate the impact <strong>of</strong> price differences that could be achieved in the market<br />
place for <strong>eco</strong>-efficient sugar.<br />
There are many other issues that could to be considered, which have not been covered in this<br />
paper. For instance, yield increases have been documented at between 20–30% (Garside<br />
2003) and there maybe potential increases in Commercial Cane Sugar (CCS). In relation to<br />
farm capital requirements, this paper has not dealt with issues associated with machinery<br />
sales or purchases.<br />
There are many social and <strong>eco</strong>logical issues that also need to be addressed in further research.<br />
24
References<br />
Azzopardi, M., Marohasy, J., Christiansen, I. & Dawson, D. 2001, Environmental<br />
Commitment <strong>of</strong> the Queensland Sugar Industry, Brisbane<br />
Baker, J. 2003, A Report on the Study <strong>of</strong> Land-Sourced Pollutants and their Impacts on Water<br />
Quality in and Adjacent to the Great Barrier Reef, Brisbane<br />
<strong>Department</strong> <strong>of</strong> <strong>Primary</strong> <strong>Industries</strong>, Queensland 2002, Queensland Sugar Industry Pr<strong>of</strong>ile,<br />
Brisbane<br />
Environment Australia 2002 (www.ea.gov.au/industry/eecp; accessed 12/09/2002), Canberra<br />
Garside, A.L. 2003, Sustainable Sugar Cane Farming Systems: Developments to Date, Paper<br />
presented at Outlook 2003, Canberra, 4–5 March 2003<br />
Hildebrand, C. 2002, Independent Assessment <strong>of</strong> the Sugar Industry 2002, Canberra<br />
Productivity Commission 2003, <strong>Industries</strong>, Land Use and Water Quality in the Great Barrier<br />
Reef Catchment, Productivity Commission Research Report, Canberra<br />
25


