CHAPTER 14 - Iskandar Malaysia
CHAPTER 14 - Iskandar Malaysia
CHAPTER 14 - Iskandar Malaysia

Create successful ePaper yourself
Turn your PDF publications into a flip-book with our unique Google optimized e-Paper software.
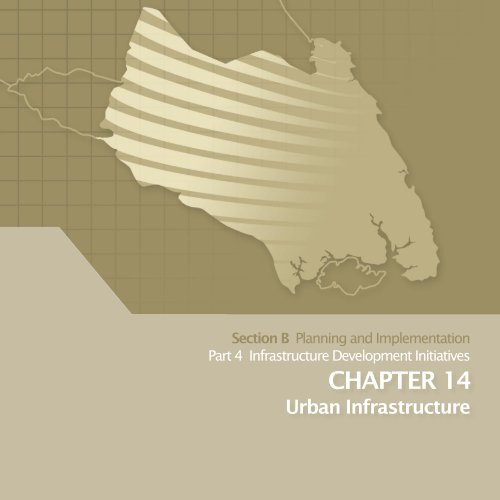
Section B Planning and Implementation<br />
Part 4 Infrastructure Development Initiatives<br />
<strong>CHAPTER</strong> <strong>14</strong><br />
Urban Infrastructure
Urban Infrastructure<br />
chapter<br />
<strong>14</strong><br />
<strong>14</strong>.1 Introduction<br />
Infrastructure plays a pivotal role in supporting the quality of life and<br />
with this in mind, SJER needs to provide the highest standard and<br />
quality of infrastructure and utility services.<br />
In line with these goals, planning for urban infrastructure needs to take<br />
into consideration the following:<br />
■ Projections for population growth – predict growth and distribution<br />
of population and employment to ensure urban infrastructure is<br />
delivered on time.<br />
As its urban areas continue to expand and develop, there is an<br />
immediate need to improve the infrastructure to support new<br />
development projects. Such infrastructure and utility services need to<br />
be efficient and to be geared towards supporting a clean and high<br />
quality living environment.<br />
<strong>14</strong>.2 Goals<br />
■ Planning for demand –infrastructure planning needs to be based<br />
on realistic demand projections to optimise the use and efficiency<br />
of the infrastructure.<br />
■ Innovation – seek to implement innovative practices that will<br />
improve service delivery.<br />
The objectives with regard to provision of infrastructure are as follows:-<br />
URBAN INFRASTRUCTURE GOALS:<br />
• To optimise use of existing infrastructure.<br />
• To integrate common aspects of infrastructure needs and<br />
requirements to ensure planning for sustainable and affordable<br />
development to meet the growth of SJER.<br />
The services should be efficient, reliable and integrated, making use of<br />
common facilities and service corridors. The public will be encouraged<br />
to participate in conservation and waste minimisation activities, whilst<br />
the latest technology will be used to ensure minimal environmental<br />
impact.<br />
• To utilize modern and innovative technology in infrastructure<br />
provision to improve service levels and to attain a high quality<br />
environment within SJER.<br />
• To control and coordinate all infrastructure and utilities service<br />
providers and to set targets for quality waste, water and energy<br />
resources within SJER.<br />
<strong>14</strong> - 1
SECTION B<br />
PLANNING AND IMPLEMENTATION<br />
<strong>14</strong>.3 Power Supply<br />
The provision of sufficient and uninterrupted electric power is essential to<br />
support urban growth. With this in mind, the generation and distribution<br />
of power needs to be properly planned, making use of the latest<br />
technology as required.<br />
B. Current Main Substation and Capacity<br />
The present supply of electric power in the study area is sufficient. Based<br />
on Table <strong>14</strong>.2, the capacity of 23 main intake substations could meet<br />
the demand of SJER and produce 2040 MVA with a maximum capacity<br />
of 994MV. Figure <strong>14</strong>.1 shows the location of the intake substations in the<br />
study areas.<br />
UI 1:<br />
UI 2:<br />
KEY DIRECTION<br />
Ensure sufficient supply of power to cater for the growth of<br />
SJER and to support its objective of becoming a world class<br />
sustainable conurbation.<br />
To ensure that the reliability of power within SJER meets the<br />
standards set for MSC Cybercities and Cybercentres.<br />
Table <strong>14</strong>.2: List of Sub-station (PMU) and Demand (MVA) in SJER, 2003<br />
Local<br />
Authority<br />
Majlis<br />
Bandaraya<br />
Johor Bahru<br />
(MBJB)<br />
PMU<br />
Capacity<br />
(MVA)<br />
Voltage<br />
(kV)<br />
Supply<br />
(MVA)<br />
Maximum<br />
Demand<br />
(MW MD)<br />
Kangkar 2X60 132/22 120.00 65.00<br />
Tebrau 2X60 132/22 120.00 70.00<br />
Stulang<br />
Darat<br />
2X45 132/22 90.00 60.00<br />
A. Enhance the Reliability of Power Supply<br />
The following proposed targets will be set for SJER i.e.:<br />
■ Improve System Average Interruption Duration Index (SAIDI) from<br />
the current 105 minutes/customer/year (2004) 1 to less than 20<br />
minutes/customer/year; and<br />
■ System Average Interruption Frequency Indexes (SAIFI) from 1.11<br />
(2004) to less than 0.5<br />
Table <strong>14</strong>.1: Performance Of The Electricity Supply Services<br />
Name of Cities<br />
Johor Bahru<br />
Kuala Lumpur<br />
Putrajaya<br />
Performance<br />
Index : SAIDI<br />
105<br />
99<br />
2<br />
Name of Cities<br />
Johor Bahru<br />
Kuala Lumpur<br />
Putrajaya<br />
Performance<br />
Index : SAIFI<br />
1.11<br />
0.84<br />
0.01<br />
Majlis Perbandaran<br />
Johor Bahru<br />
Tengah<br />
(MPJBT)<br />
Majlis Daerah<br />
Kulai<br />
(MDK)<br />
Majidee 2X60 132/22 120.00 80.00<br />
Tampoi Ind. 2X60 132/22 120.00 60.00<br />
Tebrau<br />
Central<br />
2X60 132/22 120.00 60.00<br />
Kempas 2X60 132/22 120.00 60.00<br />
Sub total 810.00 455.00<br />
Tg. Kupang 2X60 132/22 120.00 60.00<br />
Ulu Tiram 2X60 132/22 120.00 60.00<br />
Skudai 2X60 132/22 120.00 70.00<br />
Sub Total 360.00 190.00<br />
Saleng 2X30 132/11 60.00 20.00<br />
Seelong 2X30 132/11 60.00 15.00<br />
Singapore<br />
15<br />
Singapore<br />
0.10<br />
Bukit Batu 2X30 132/11 60.00 12.00<br />
France<br />
USA<br />
52<br />
88<br />
Michigan<br />
London<br />
1.35<br />
0.40<br />
Johor<br />
Tengah ITC<br />
2X30 132/11 60.00<br />
11.00<br />
Japan<br />
New York<br />
0.02<br />
0.99<br />
Senai Hitec 2X30 132/11 60.00 15.00<br />
Sub Total 300.00 73.00<br />
Source: Report on The Performance Of The Electricity Supply Services In<br />
<strong>Malaysia</strong>, Interim Report 1st Half 2004<br />
1 Report on The Performance Of The Electricity Supply Services In<br />
<strong>Malaysia</strong>, Interim Report 1st Half 2004<br />
<strong>14</strong> - 2
URBAN INFRASTRUCTURE <strong>CHAPTER</strong> <strong>14</strong> | PART 4<br />
Local<br />
Authority<br />
PMU<br />
Capacity<br />
(MVA)<br />
Voltage<br />
(kV)<br />
Supply<br />
(MVA)<br />
Maximum<br />
Demand<br />
(MW MD)<br />
PBT Pasir<br />
Gudang<br />
(PBTPG)<br />
PGIE 3 x 60 132/22 180 96.63<br />
Tg. Langsat 2 x 60 132/22 120 24.38<br />
PGDT 2 x 60 132/22 120 65.00<br />
Cahaya Baru 2 x 60 132/22 120 48.75<br />
PGPS 1 x 30 132/22 30 <strong>14</strong>.63<br />
Titan P.<br />
Gudang<br />
Titan Tg.<br />
Langsat<br />
Antara Steel<br />
Mill<br />
– 132 – 15.50<br />
– 132 – 22.27<br />
– 132 – 54.82<br />
Sub Total 570 341.98<br />
GRAND TOTAL 2040.00 994.98<br />
Main Sub Station (PMU) 132/22 kV Kangkar Tebrau<br />
C. Projected Demand for Power<br />
Demand for power is projected based on future projections for<br />
economic growth as well as the physical development growth within<br />
the SJER area.<br />
Source : Regional Load Forecast and Load Desegregation Report, 1997-2009<br />
As illustrated, the current supply outstrips demand. The capacity from all<br />
the intake substations in SJER in the year 2003 is 1249.50MW compared<br />
to the actual total demand of 653 MW.<br />
Table <strong>14</strong>.3: Demand of Power Supply Compared to The Capacity<br />
D. Meeting Demand for Power<br />
Consumption of electricity within SJER will increase from 1,334 MW<br />
in 2005 to 2,819 MW by the year 2025. The increase is in line with<br />
the physical development of the area. The Table <strong>14</strong>.4 illustrates the<br />
projected growth in demand for power from different user bases<br />
(housing, commercial, industry and street lightings).<br />
Usage 2003<br />
Capacity (MW) 1249.50<br />
Demand (MW) 653.00<br />
TNB’s coverage should extend to 100% of SJER and be sufficient to meet<br />
demand. The reserve margin needs to be maintained at a minimum of<br />
25%.<br />
Source: SJER CDP 2025<br />
Balance (MW) 596.50<br />
<strong>14</strong> - 3
SECTION B<br />
PLANNING AND IMPLEMENTATION<br />
Table <strong>14</strong>.4: Projection of Power Supply Demand for SJER, 2000-2025<br />
MBJB<br />
Sector 2005 2010 2015 2020 2025<br />
Domestic 221.70 236.77 284.84 350.35 438.64<br />
Commercial 133.02 <strong>14</strong>2.06 170.90 210.21 263.18<br />
Industry 66.51 71.03 85.45 105.10 131.59<br />
Sub Total 421.22 449.87 541.19 665.66 833.41<br />
Street Lighting<br />
(5%)<br />
22.17 23.68 28.48 35.03 43.86<br />
Total (MW) 443.39 473.54 569.67 700.70 877.27<br />
MPJBT<br />
Sector 2005 2010 2015 2020 2025<br />
Domestic 154.17 186.09 245.08 321.79 402.87<br />
Commercial 92.50 111.65 <strong>14</strong>7.05 193.07 241.72<br />
Industry 46.25 55.83 73.52 96.54 120.86<br />
Sub Total 292.93 353.56 465.64 611.39 765.46<br />
Street Lighting<br />
(5%)<br />
15.42 18.61 24.51 32.18 40.29<br />
Total (MW) 308.35 372.17 490.15 643.57 805.75<br />
MDK<br />
Sector 2005 2010 2015 2020 2025<br />
Domestic 57.13 61.82 74.74 92.45 115.56<br />
Commercial 34.28 37.09 44.84 55.47 69.34<br />
Industry 17.<strong>14</strong> 18.55 22.42 27.73 34.67<br />
Sub Total 108.55 117.45 <strong>14</strong>2.00 175.65 219.57<br />
Street Lighting<br />
(5%)<br />
5.71 6.18 7.47 9.24 11.56<br />
PBPTDJB (con’t)<br />
Industry <strong>14</strong>.45 15.72 18.22 22.34 27.92<br />
Sub Total 91.51 99.56 115.39 <strong>14</strong>1.47 176.83<br />
Street Lighting<br />
(5%)<br />
4.82 5.24 6.07 7.45 9.3 1<br />
Total (MW) 96.32 104.80 121.46 <strong>14</strong>8.91 186.<strong>14</strong><br />
PBTPG<br />
Sector 2005 2010 2015 2020 2025<br />
Domestic 186.21 202.59 234.81 287.87 359.84<br />
Commercial 111.72 121.56 <strong>14</strong>0.88 172.72 215.90<br />
Industry 55.86 60.78 70.44 86.36 107.95<br />
Sub Total 353.80 384.93 446.13 546.96 683.70<br />
Street Lighting<br />
(5%)<br />
18.62 20.26 23.48 28.79 35.98<br />
Total (MW) 372.42 405.19 469.61 575.75 719.68<br />
OVERALL<br />
Sector 2005 2010 2015 2020 2025<br />
Domestic 667.37 739.67 900.19 1,126.91 1,409.98<br />
Commercial 400.42 443.80 540.11 676.15 845.99<br />
Industry 200.21 221.90 270.06 338.07 423.00<br />
Sub Total 1,268.00 1,405.37 1,710.35 2,<strong>14</strong>1.13 2,678.97<br />
Street Lighting<br />
(5%)<br />
66.74 73.97 90.02 112.69 <strong>14</strong>1.00<br />
Total (MW) 1,334.74 1,479.34 1,800.37 2,253.82 2,819.97<br />
Source: SJER CDP 2025<br />
Total (MW) 1<strong>14</strong>.26 123.63 <strong>14</strong>9.47 184.90 231.12<br />
PBPTDJB<br />
Sector 2005 2010 2015 2020 2025<br />
Domestic 48.16 52.40 60.73 74.46 93.07<br />
Commercial 28.90 31.44 36.44 44.67 55.84<br />
<strong>14</strong> - 4
URBAN INFRASTRUCTURE <strong>CHAPTER</strong> <strong>14</strong> | PART 4<br />
E. Main substation Intake (PMU)<br />
TNB will need to increase the capacity of the main intake to meet the<br />
increase in demand expected up to 2025. The plans for upgrade within<br />
the SJER area are illustrated on the following page.<br />
Table <strong>14</strong>.5: Committed Sub-station (PMU) in SJER<br />
Study Area<br />
Majlis<br />
Bandaraya<br />
Johor Bahru<br />
(MBJB)<br />
Majlis<br />
Perbandaran<br />
Johor Bahru<br />
Tengah<br />
(MPJBT)<br />
Majlis<br />
Daerah Kulai<br />
(MDK)<br />
Main Substation<br />
Intake (PMU)<br />
Rate<br />
(MVA)<br />
Voltan<br />
(kV)<br />
Capacity<br />
(MVA)<br />
Max.<br />
Target Year<br />
Demand<br />
Completion<br />
(MW<br />
MD)<br />
UDA 2 x 60 132/22 120.00 - 2006<br />
Kempas No.2 2 x 60 132/22 120.00 - 2007<br />
Bukit Cagar 2 x 60 132/22 120.00 - 2008<br />
Bakar Batu 2 x 60 132/22 120.00 - 2010<br />
Desa<br />
Cemerlang<br />
Sub Total 480.00 -<br />
2 x 60 132/22 120.00 - 2008<br />
Casa Saujana 2 x 60 132/22 120.00 - 2010<br />
Taman Sutera 2 x 60 132/22 120.00 - 2010<br />
Sg. Tiram 2 x 60 132/22 120.00 - 2010<br />
Sub Total 480.00 -<br />
Asiatic No. 3 2 x 30 132/11 60.00 - 2006<br />
Sri Puteri 2 x 30 132/11 60.00 - 2008<br />
Ladang Swee<br />
Lam<br />
2 x 30 132/11 60.00 - 2010<br />
Asiatic No. 4 2 x 30 132/11 60.00 - 2010<br />
Sedenak 2 x 30 132/11 60.00 - 2010<br />
<strong>14</strong>.4 Development Option/ Program<br />
Common Trenching<br />
It is proposed that common trenching or utility tunnels be adopted<br />
in the SJER. A special committee headed by a utility service provider<br />
should be formed to coordinate this. Detailed utility reserves should be<br />
identified and implemented to ensure future maintenance or capacity<br />
expansion can be carried out without road digging. This should be<br />
implemented as soon as possible, particularly within the central business<br />
district and new mega development areas.<br />
<strong>14</strong>.5 Renewable Energy/Alternative Power Source<br />
SJER will promote the use of renewable energy/ alternative power<br />
sources, in line with <strong>Malaysia</strong>’s energy policy i.e. the 5th Fuel Policy:<br />
“..:To supplement the conventional supply of energy, new sources<br />
such as renewable energy will be encouraged. In this regards the fuel<br />
diversification policy which comprises oil, gas, hydro and coal will be<br />
extended to include renewable energy as the fifth fuel, particularly<br />
biomass, biogas, municipal waste, mini-hydro and solar. Of these,<br />
biomass resources such as palm oil and wood waste as well rice husks,<br />
will be used on a wider basis, mainly for electrical generation. Other<br />
potential sources of energy will include palm diesel and hydrogen fuel.”<br />
KEY DIRECTION<br />
PBT Pasir<br />
Gudang<br />
(PBTPG)<br />
Sub Total 300.00 -<br />
PGIE T3 1 x 60 132/22 60.00 - 2002<br />
Tg. Langsat 1 2 x 90 132/33 180.00 - 2003<br />
Johor Port<br />
Pasir Putih<br />
Tg. Langsat 2<br />
2 x 90<br />
2 x 30<br />
2 x 90<br />
2 x 30<br />
2 x 90<br />
2 x 30<br />
132/33<br />
132/11<br />
132/33<br />
132/11<br />
132/33<br />
132/11<br />
180.00<br />
60.00<br />
180.00<br />
60.00<br />
180.00<br />
60.00<br />
Sub Total 940.00 -<br />
Grand Total 2,200.00 -<br />
-<br />
-<br />
-<br />
-<br />
-<br />
-<br />
2003<br />
2003<br />
2010<br />
2010<br />
2012<br />
2012<br />
UI 3 : SJER will promote the use of Renewable Energy in all new<br />
development projects especially large townships and office<br />
and commercial buildings within the SEC.<br />
New, environmental-friendly methods of generating electricity such<br />
as utilisation of bio-fuels and solar power should be explored. While<br />
SJER has sufficient power till 2025, there should be a move towards<br />
renewable energy sources given the obvious benefits.<br />
Source: SJER CDP 2025<br />
<strong>14</strong> - 5
SECTION B<br />
PLANNING AND IMPLEMENTATION<br />
<strong>14</strong>.6 Water Supply<br />
Table <strong>14</strong>.7: Existing SJER Water Supply<br />
A. Introduction<br />
Treatment Plant<br />
Water Supply (mld)<br />
The current supply of water is adequate in meeting the needs of SJER,<br />
with a reserve of about 100%.<br />
Heavy industries in Pasir Gudang, new industries in Nusajaya and other<br />
industrial areas, as well as the associated population increase will<br />
require that the water supply system (comprising the source, headworks,<br />
transmission, and storage and distribution network) be augmented<br />
significantly.<br />
Layang 182.0<br />
Layang Extension 136.0<br />
Sg. Johor - Stage 2 159.0<br />
Lower Pulai Treatment Plant 82.0<br />
Sg. Johor - Stage 3 159.0<br />
Sayong Treatment Plant <strong>14</strong>0.0<br />
TOTAL 858.0<br />
Source: SJER CDP 2025<br />
KEY DIRECTION<br />
UI 4 : Ensure a reliable source of high quality water and preserve<br />
existing water catchments areas that serve SJER.<br />
B. Water Demand<br />
Demand for water within the SJER in the year 2005 was in the region of<br />
537 million litres per day, as illustrated below.<br />
Table <strong>14</strong>.6: Existing SJER Water Demand<br />
City Council<br />
Water Demand (mld)<br />
MBJB 182.0<br />
MPJBT 175.1<br />
MPKu 51.0<br />
PDJB 69.1<br />
PBTPG 59.8<br />
SJER 537.0<br />
Source: SJER CDP 2025<br />
D. Non-Revenue Water (NRW)<br />
Within SJER, Non Revenue Water (NRW) is very significant. NRW is the<br />
difference between the total volume produced by water treatment<br />
plants and total volume of water legally used. This difference in volume<br />
is generally due to the following:<br />
■ Leakage in distribution pipes, faulty valves and water wastage<br />
due to improper pipe fittings, as well as burst pipes;<br />
■ Operation of fire hydrants and flushing of main pipes;<br />
■ Illegal pipe connection, for instance, tapping illegally from fire<br />
hydrant; and<br />
■ Meter vandalism.<br />
In relation to the above, SAJH has taken various steps to improve<br />
security by putting up fences. SAJH has implemented various programs<br />
to upgrade the old pipes since 1995 and reduced NRW from 47% in<br />
1992 to 27% in year 2000. SAJH has forecast that NRW in the region will<br />
reduce to between 25%-20% in 2010.<br />
C. Water Resources<br />
Syarikat Air Johor Holdings Berhad (SAJH) is the body responsible for the<br />
supply of treated water in SJER. There are six treatment plants, which<br />
supply 858 million litres of treated water per day to consumers in SJER.<br />
Raw water is sourced from three rivers namely Sungai Layang, Sungai<br />
Johor and Sungai Pulai.<br />
E. Existing Water Requirements<br />
From the analysis shown, there is a surplus of water of <strong>14</strong>9.9 million litre<br />
per day. to cater for immediate needs and development pressure.<br />
<strong>14</strong> - 6
URBAN INFRASTRUCTURE <strong>CHAPTER</strong> <strong>14</strong> | PART 4<br />
Table <strong>14</strong>.8: Current Supply and Demand<br />
Table <strong>14</strong>.10: Existing and Proposed Water Treatment Plant<br />
Item<br />
Water Supply (mld)<br />
Water Supply 858.0<br />
Treatment Plant<br />
Existing:<br />
2003 2005 2010 2015 2020 2025<br />
Less NRW 20%<br />
Water Demand 537.0<br />
Balance <strong>14</strong>9.9<br />
Source: SJER CDP 2025<br />
F. Future Water Demand<br />
However based on projected population growth, the demand for water<br />
in SJER will reach 1376.7 million litres per day by the year 2025.<br />
Layang 182.0 182.0 182.0 182.0 182.0 182.0<br />
Layang Extension 136.0 136.0 136.0 136.0 136.0 136.0<br />
PUB Skudai 75.0 0.0 0.0 0.0 0.0 0.0<br />
Sg. Johor – Stage 2 159.0 159.0 159.0 159.0 159.0 159.0<br />
Lower Pulai Treatment<br />
Plant<br />
82.0 82.0 82.0 82.0 82.0 82.0<br />
Sg. Johor – Stage 3 159.0 159.0 159.0 159.0 159.0 159.0<br />
Sayong Treatment Plant 0.0 <strong>14</strong>0.0 <strong>14</strong>0.0 <strong>14</strong>0.0 <strong>14</strong>0.0 <strong>14</strong>0.0<br />
Total 793.0 858.0 858.0 858.0 858.0 858.0<br />
Table <strong>14</strong>.9: Total Water Demand for SJER, 2000-2025<br />
Proposed By SAJH: 2003 2005 2010 2015 2020 2025<br />
City Council<br />
Water Demand Forecast (mld)<br />
2003 2005 2010 2015 2020 2025<br />
MBJB <strong>14</strong>7.6 181.5 199.0 245.5 310.2 415.6<br />
MPJBT 136.3 175.1 217.0 293.2 396.1 530.4<br />
MPKu 42.3 51.0 56.6 70.2 89.2 119.4<br />
Johor Bahru Treatment<br />
Plant (Sg. Johor)<br />
Sedili Besar Treatment<br />
Plant - Stage 1A<br />
Sedili Besar Treatment<br />
Plant - Stage 1B<br />
0.0 0.0 <strong>14</strong>0.0 <strong>14</strong>0.0 <strong>14</strong>0.0 <strong>14</strong>0.0<br />
0.0 0.0 0.0 0.0 210.0 210.0<br />
0.0 0.0 0.0 0.0 0.0 210.0<br />
PDJB 58.2 69.1 77.2 91.8 115.7 154.9<br />
PBTPG 16.1 59.8 76.4 97.4 116.8 156.4<br />
SJER 400.5 536.5 626.2 798.1 1,028.0 1,376.7<br />
Total 0.0 0.0 <strong>14</strong>0.0 <strong>14</strong>0.0 350.0 560.0<br />
Grand Total 793.0 858.0 998.0 998.0 1208.0 <strong>14</strong>18.0<br />
Source: SJER CDP 2025<br />
Source: SJER CDP 2025<br />
As illustrated, SJER is expected to face water shortages after 2025. Hence,<br />
G. Future Water Resources<br />
By the year 2025 the estimated consumption is <strong>14</strong>18 million litre per day,<br />
an increase of 44% compared to the consumption in the year 2005.<br />
Table <strong>14</strong>.10 shows the projected rate of water consumption till 2025.<br />
a new source of water needs to be identified and new water treatment<br />
plants must be planned to meet the demand (refer Table <strong>14</strong>.11)<br />
Table <strong>14</strong>.11: Difference of Total Demand and Supply<br />
Item 2003 2005 2010 2015 2020 2025<br />
Water<br />
Supply<br />
Total Supply 793.0 858.0 998.0 998.0 1,208.0 1,418.0<br />
Less NRW 158.6 171.6 <strong>14</strong>9.7 99.8 120.8 <strong>14</strong>1.8<br />
Actual Supply 634.4 686.4 848.3 898.2 1,087.2 1,276.2<br />
Demand 400.6 536.5 626.2 798.1 1,028.0 1,376.7<br />
Balance 233.8 <strong>14</strong>9.9 222.1 100.1 59.2 (100.5)<br />
Source: SJER CDP 2025<br />
It is thus recommended that a Water Resource Study be undertaken<br />
to identify new sources of water and the feasibility of constructing new<br />
treatment plants.<br />
<strong>14</strong> - 7
SECTION B<br />
PLANNING AND IMPLEMENTATION<br />
H. Water Supply Master Plan<br />
▼ Development Option<br />
To overcome the projected water shortage, new sources need to be<br />
found and new treatment plants need to be developed. Based on the<br />
projected increase in demand, a treatment plant with a capacity of<br />
100 million litres per day should be built to meet demand for water in<br />
2025. Other alternatives such as rainwater harvesting and exploitation of<br />
underground water resources should be explored.<br />
<strong>14</strong>.7 Water Resource Management and Alternative Sources<br />
SJER will adopt an integrated water management system where water<br />
supply and use will be viewed as an integrated cycle. Sources of water,<br />
which include underground water sources, rivers, water catchments<br />
area, lakes and rainwater, are to be is conserved whilst wastewater<br />
from sewerage treatment plants and drainage systems is to be recycled<br />
for suitable purposes.<br />
Figure<strong>14</strong>.1: Concept of Integrated Water Management<br />
KEY DIRECTION<br />
UI 5 : Sustainable use of water resources i.e implementing<br />
measures for more efficient use of water and by encouraging<br />
water recycling and rainwater harvesting<br />
A. Water Sources<br />
Apart from conventional water supply for domestic use from public<br />
distribution system by relevant agency, other potential sources of<br />
water need to be exploited, in particular, rainwater. Guidelines for<br />
incorporation of rainwater harvesting in individual buildings have been<br />
formulated.<br />
B. Rainwater collection and water recycling<br />
Rainwater is collected from downspouts connected to the roof gutters<br />
of a building. A simple device called a roof washer diverts the initial flow<br />
of the rainfall into a storage tank.<br />
Table <strong>14</strong>.12: Projected Water Resources From Rainwater harvesting<br />
Pipe Water from<br />
Water supply<br />
Agency (SAJ)<br />
Rainwater<br />
Recycled Water/<br />
Grey Water<br />
Year 2003 2005 2010 2015 2020 2025<br />
Rainwater<br />
Harvesting<br />
(mld)<br />
18.7 23.0 26.2 32.5 40.7 51.0<br />
Source: SJER CDP 2025<br />
DOMESTIC USE<br />
Drinking Water<br />
Kitchen Use<br />
Bathing<br />
Washing<br />
DOMESTIC USE<br />
Bathing<br />
Washing<br />
Toilet FLushing<br />
NON-DOMESTIC USE<br />
Gardening<br />
Municipal<br />
Landscaping<br />
Car Washing<br />
DOMESTIC USE<br />
Toilet Flushing<br />
NON-DOMESTIC USE<br />
Gardening<br />
Municipal<br />
Landscaping<br />
Car Washing<br />
Water<br />
Use<br />
Water<br />
Sources<br />
Waste<br />
Water<br />
Sewerage<br />
Treatment Plant<br />
Drains, Retention<br />
Ponds and<br />
Canal System<br />
River System<br />
Figure <strong>14</strong>.2: Use of Gutter for Rainwater Collection in<br />
Residential Building<br />
Gutter to to collect collect rainwater<br />
rainwater<br />
Gutter to collect<br />
rainwater<br />
Gutter to collect<br />
rainwater<br />
Source: SJER CDP 2025<br />
Source: SJER CDP 2025<br />
<strong>14</strong> - 8
URBAN INFRASTRUCTURE <strong>CHAPTER</strong> <strong>14</strong> | PART 4<br />
Figure <strong>14</strong>.3: Concept of Rainwater Harvesting For Residential Building<br />
Location Usage Q Depth (m)<br />
IKBN Skudai D 10.00 75.00<br />
Gutter to collect<br />
rainwater<br />
Rainwater distribution pipe<br />
for non-drinking use such as<br />
gardening and toilet<br />
flushing.<br />
Water main for domestic use from<br />
water authority reticulation system<br />
Source: SJER CDP 2025<br />
Water tank for<br />
domestic water<br />
supply from water<br />
authority<br />
Collection pipe from<br />
gutter to rainwater<br />
storage tank<br />
Rainwater storage<br />
tank<br />
Kg. Seri G. Pulai D 10.00 104.00<br />
Kelab Golf DiRaja D 1.00 30.00<br />
Kg. Sg. Tiram D 5.00 90.00<br />
Kg. Pulai D 5.00 35.00<br />
Kg. Ulu Choh D 5.00 130.00<br />
TOTAL 123<br />
Source: SJER CDP 2025<br />
D. Wastewater<br />
The drainage system and the sewerage treatment plant are two sources<br />
of wastewater. Surface run-offs and treated effluent from sewerage<br />
treatment plants shall be disposed in the river systems of the SJER and<br />
can be used as a water source particularly for non-domestic uses such<br />
as municipal landscaping and gardening.<br />
C. Ground Water<br />
Within the study area ground water is projected to represent only 0.2%<br />
of total water supply in the year 2025. Nevertheless, it is important,<br />
particularly for the drinking water industry, Table below shows the<br />
location and capacity of ground water.<br />
Table <strong>14</strong>.13: List of Tube Well in SJER<br />
Location Usage Q Depth (m)<br />
Kulai Besar Oil Mill D 10.00 8.00<br />
Kulai Besar Oil Mill D 10.00 8.00<br />
As such, it is paramount that treated effluent discharge into the river<br />
system is properly managed and water quality of rivers are maintained<br />
to the required standards.<br />
E. Construction Cost<br />
Estimates of the cost of developing the water supply system are<br />
based on current year, 2006. The cost in Zone 1, MBJB is expected<br />
to be higher than that of other zones. The cost of the water supply<br />
infrastructure is summarised in the Table <strong>14</strong>.<strong>14</strong>.<br />
Kulai Besar Oil Mill D 10.00 7.80<br />
Larkin Industrial I 10.00 163.00<br />
Larkin Industrial I 10.00 160.00<br />
Kulai Evegreen MW 5.00 200.00<br />
Ocean, U. Tiram MW 6.00 115.82<br />
Ocean, U. Tiram MW 1.00 30.4<br />
Kg. Murni Jaya D 5.00 104.00<br />
Kg. Kuala Kabung D 5.00 124.00<br />
Kg. Air Manis D 5.00 110.00<br />
SM Senai D 10.00 93.00<br />
<strong>14</strong> - 9
SECTION B<br />
PLANNING AND IMPLEMENTATION<br />
Table <strong>14</strong>.<strong>14</strong>: Estimated Water Supply Infrastructure Cost<br />
Zone 1 – MBJB<br />
Bil. Project Project Cost (RM) Proposed Agency<br />
1 Constructed of reinforcement concrete water tank 156,122,482 SAJH/Developer<br />
2 Constructed of common trenching 34,335,000 SAJH<br />
3 Constructed new pipelines 1,260,000 SAJH<br />
4 Replace the old pipelines. 37,800,000 SAJH<br />
Total 229,517,482<br />
Zone 2 – MPJBT<br />
Bil. Project Project Cost (RM) Proposed Agency<br />
1 Constructed of reinforcement concrete water tank <strong>14</strong>9,160,052 SAJH/Developer<br />
2 Constructed of common trenching 16,000,000 SAJH<br />
3 Constructed new pipelines 1,260,000 SAJH<br />
4 Replace the old pipelines. 18,900,000 SAJH<br />
Total 185,320,052<br />
Zone 3 – MPKu<br />
Bil. Project Project Cost (RM) Proposed Agency<br />
1 Constructed of reinforcement concrete water tank 62,063,176 SAJH/Developer<br />
2 Constructed of common trenching 6,300,000 SAJH<br />
4 Replace the old pipelines. 18,900,000 SAJH<br />
Total 87,263,176<br />
Zone 4 – PBTDJB<br />
Bil. Project Project Cost Proposed Agency<br />
1 Constructed of reinforcement concrete water tank 155,623,580 SAJH/Developer<br />
Total 155,623,580<br />
Zone 5 - PBT Pasir Gudang<br />
Bil. Project Project Cost (RM) Proposed Agency<br />
1 Constructed of reinforcement concrete water tank 95,000,000 SAJH/Developer<br />
2 Constructed of common trenching 7,000,000 SAJH<br />
4 Replace the old pipelines. 10,000,000 SAJH<br />
Total 112,000,000<br />
Grand Total for Water Supply 769,724,291<br />
Source: SJER CDP 2025<br />
<strong>14</strong> - 10
URBAN INFRASTRUCTURE <strong>CHAPTER</strong> <strong>14</strong> | PART 4<br />
<strong>14</strong>.8 Sustainable Drainage System<br />
Sustainable drainage is a way of dealing with surface run-off which<br />
avoids the problems associated with conventional drainage practices.<br />
Conventional drainage is not only more expensive to install and<br />
maintain but it is also designed to move rainwater as rapidly as<br />
possible from the point at which it has fallen to a discharge point,<br />
either a watercourse or a soak way. This would increase risk of flooding<br />
downstream due to sudden increase in water levels from hard standing<br />
areas.<br />
SJER will advocate sustainable drainage systems which will offer more<br />
cost effective solutions that are easy to manage, attractive and resilient<br />
to use. Sustainable drainage systems can be used in both urban and<br />
rural areas. The ‘Manual Saliran Mesra Alam’ or MASMA prepared<br />
by the Drainage and Irrigation Department (JPS) contains a detailed<br />
guide to sustainable drainage; however it is not widely implemented in<br />
<strong>Malaysia</strong>. Hence, for SJER its key objective is:-<br />
KEY DIRECTION<br />
UI 6: To enforce the use of MASMA guidelines and advocate<br />
use of sustainable drainage system to achieve long term<br />
environmental goals for SJER.<br />
A. The River<br />
There are eight major rivers within the district of Johor Bahru as<br />
registered under ‘National Register of River Basins’. These rivers include<br />
Sungai Skudai, Sg Tebrau, Sungai Kempas and Sungai Johor as shown<br />
Table <strong>14</strong>.15 and form a major drainage system, as well as a source of<br />
water for households, industries and agriculture.<br />
Table <strong>14</strong>.15: Main Rivers in the SJER<br />
Catchments Area<br />
Length<br />
Bil.<br />
Name<br />
(ha)<br />
(Km)<br />
1 Sungai Segget - -<br />
2 Sungai Pontian Kecil - -<br />
Bil.<br />
Name<br />
Catchments Area<br />
Length<br />
(ha)<br />
(Km)<br />
5 Sungai Danga 3,000 16<br />
6 Sungai Skudai 39,000 49<br />
7 Sungai Tebrau 39,000 39<br />
8 Sungai Johor 270,000 125<br />
TOTAL 380,000 276<br />
Sources: National Register of River Basins<br />
B. Flooding<br />
There are still many areas subject to floods in the Johor Bahru area and<br />
most are within the river basins of Sungai Tebrau, Sungai Masai, Sungai<br />
Skudai and Sungai Plentong. Based on reports from the Department of<br />
Drainage, almost 8,500 people may typically be displaced during floods.<br />
Some of the flood prone areas are shown in the following table.<br />
Table <strong>14</strong>.16: Flood Areas in The River Catchments<br />
No River Location Affected Flooding<br />
people<br />
1 Sungai • Kg. Sri Aman<br />
100 -<br />
Tebrau • Kg. Tawakal<br />
• Kg. Maju Jaya<br />
2. Sungai • Kg. Sri Purnama<br />
184 -<br />
Skudai • Kg. Berembang<br />
• Kg. Lembah Jaya<br />
• Kg. Laut Bt. 10<br />
• Kg. Jaya Sepakat<br />
• Taman. Tan Yoke Fong<br />
• Kg. Pertanian Kulai<br />
• Kg. Separa<br />
• Tanah Rezab KTM Bt. 19<br />
• Kg. Tasar Senai<br />
• Kg. Jaya Sepakat<br />
• Kg. Pasir Senai<br />
• Kg. Sri Maju<br />
3,452<br />
1,502<br />
1,992<br />
3. Sungai<br />
Masai<br />
• Kg. Sepakat<br />
• Kg. Masjid<br />
• Kg. Sentosa Damai<br />
• Kg. Cahaya Baru<br />
1,116 -<br />
3 Sungai Pontian Besar 29,000 47<br />
4 Sungai Kempas - -<br />
<strong>14</strong> - 11
SECTION B<br />
PLANNING AND IMPLEMENTATION<br />
No River Location Affected Flooding<br />
people<br />
4. Sungai<br />
Plentong<br />
• Kg. Plentong Baru 120 -<br />
D. Application of MASMA<br />
The MASMA Manual for run-off design promotes environmentally friendly<br />
solutions and should be made applicable to any development in Johor<br />
Bahru.<br />
5. Others • Kg. Oren<br />
• Jalan Air Molek<br />
• Kg. Mohd. Amin<br />
• Rumah Murah Melati,<br />
Ulu Tiram<br />
500 Every 2<br />
years<br />
TOTAL 8,966<br />
Sources: Laporan Banjir Disember 2001, JPS Johor & Media<br />
E. Rehabilitation of Major River and Straits of Johor<br />
Major rehabilitation of rivers such as Sungai Skudai and Sungai Tebrau<br />
should be carried out to prevent erosion and siltation caused by the<br />
construction of major embankment work, to improve water quality.<br />
This work should also be carried out along the coastal areas of SJER<br />
stretching from east to west.<br />
The main reason of flooding in this area is due to insufficient capacity to<br />
receive the additional discharge. Some of the rivers meander and as a<br />
result, siltation easily occurs at the river mouth, causing flood. The situation<br />
become worse when there is heavy rain and high spring tide. The rapid<br />
pace of development within the district of Johor Bahru also contributes<br />
to the flooding at the river basin area, as insufficient drainage causes<br />
blockages and flash flood.<br />
Illegal Squatters Within The Reserve<br />
of Sungai Skudai<br />
Example of an Embankment Work<br />
The presence of illegal squatters within the river reserve areas, especially<br />
at Sungai Skudai and Sungai Tebrau, can also contribute to flooding, as it<br />
impedes maintenance work by the drainage department. In addition this<br />
results in unpleasant views along the rivers and poor water quality due to<br />
the disposal of domestic waste by the illegal squatters.<br />
Figure <strong>14</strong>.4: Application of Sustainable Drainage<br />
Grass area<br />
Absorbs rain water<br />
into the ground<br />
C. New Target of Projection and Commitment<br />
The rate of land conversion in SJER is quite high. As sites cleared for<br />
development, this may result in an increase in surface run off and peak<br />
flows that can easily cause flooding; especially at the river estuary. Many<br />
rivers have been narrowed due to land development and subsequent<br />
Rain water<br />
harvesting<br />
Gravel<br />
Trench’<br />
Soakaway<br />
Pit’<br />
Porous road<br />
surface<br />
Swale<br />
Gross pollutant<br />
Trap<br />
(GPT)<br />
Traps waste<br />
Retention<br />
Pond and<br />
‘Wetland’<br />
Retain surface<br />
run-off water<br />
water<br />
earthworks, and may need to be widened and maintained. In relation<br />
to this there must be sufficient river reserve to ensure effective river<br />
management. The reserve could be used for recreational purposes and<br />
Source: SJER CDP 2025<br />
to provide more green areas.<br />
<strong>14</strong> - 12
URBAN INFRASTRUCTURE <strong>CHAPTER</strong> <strong>14</strong> | PART 4<br />
F. Retention and Detention Pond<br />
The application of MASMA standards in SJER will result in a greater<br />
emphasis on providing retention and detention ponds or lakes to<br />
improve water quality, minimize flooding and improve the quality of the<br />
environment. The water in the ponds or lakes can be used to dilute rivers<br />
especially during dry season.<br />
G. Installation of Silt Traps<br />
UI 7 :<br />
UI 8 :<br />
UI 9 :<br />
KEY DIRECTION<br />
The need for sustainable sewerage system in SJER.<br />
All new housing development to be connected to the ecofriendly<br />
centralized sewerage system (CSS).<br />
All land made available for Sewerage Treatment Plants must<br />
be primarily reserved and designated for public purposes.<br />
Silt traps should also be constructed in many tributaries especially at the<br />
new development areas.<br />
H. Guidelines for Sustainable Storm Water Drainage & Flood Mitigation<br />
• Install trash racks or screens to trap debris/litter;<br />
• Allow for buffer strips and grass swales to protect water source<br />
from contamination by nearby development precinct.;<br />
A. Existing Sewerage System<br />
Sewerage waste in the District of Johor Bahru comes from both public<br />
and private sewerage plants, individual septic tanks (IST), primitive<br />
systems (villages and illegal squatters) and untreated discharge<br />
from households. As Indah Water Konsortium is only responsible for<br />
maintaining public treatment plants, many other forms of treatment<br />
plants are currently not properly maintained.<br />
• Install GPT and oil/grease traps in major drains at strategic<br />
locations;<br />
• Install series of bio-retention /infiltration porous systems for storm<br />
water to get back into the ground;<br />
• Install buried drainage pipes to cater for major storm; and<br />
• Install water collection equipment, storage and pump for recycle<br />
storm water as non-potable water.<br />
Sewerage Treatment Plant at Taman Suria Johor Bahru<br />
For land under development which has a gradient of less than 30º<br />
but greater than 25º, geo-technical analysis, analysis on contour and<br />
drainage pattern and an EIA study should be included. All hill slopes<br />
have to be closely turfed after cutting.<br />
<strong>14</strong>.9 Sewerage<br />
The Department of Sewerage Southern Region (JPP) is the government<br />
agency responsible for the management of sewerage in the District<br />
of Johor Bahru. Meanwhile operation and maintenance services is<br />
carried out by a concession company, Indah Water Konsortium (IWK).<br />
The process of taking over maintenance work has been carried out<br />
progressively by JPP since 1995. Untill now only the areas under the City<br />
Council of Johor Bahru and areas outside of Municipality Councils have<br />
not been taken over.<br />
<strong>14</strong> - 13
SECTION B<br />
PLANNING AND IMPLEMENTATION<br />
B. Public and Private Treatment Plants<br />
There are more than 797 treatment plants all over SJER. This is indicated<br />
in the table below:<br />
No<br />
Table <strong>14</strong>.17: Location of Treatment Plants and Population Equivalent,<br />
PE in MBJB<br />
Location<br />
Treatment Plans<br />
Category<br />
1 Flat Jln Lumba Kuda IT<br />
Nos<br />
Population<br />
Equivalent,<br />
PE<br />
2 Taman. Sentosa OP 1 11530<br />
3 Taman. Sri Tebrau IT 54 270<br />
4 Flat Stulang Laut RBC<br />
5 Taman Permas Jaya - Fasa 1 OP 2 22030<br />
6 Taman Desa Harmoni OD 1 7085<br />
7 Taman Suria OP/IT 1 5195<br />
8 Taman Perbadanan Islam IT <strong>14</strong>5 725<br />
9 Taman Gembira OP 1 2560<br />
10 Taman Delima OP 1 3545<br />
11 Taman Siantan OD 1 2800<br />
12 Taman Kempas OP 1 5365<br />
13 Taman Bukit Kempas OP 1 2065<br />
<strong>14</strong> Taman Anggerik OP 1 5160<br />
15 Kg. Dato’ Onn IT 164 820<br />
16 Taman Dato’ Onn IT 88 440<br />
17 Taman Perindustrian Tampoi Jaya IT 112 560<br />
18 Kg. Dato’ Onn Jaafar IT 47 235<br />
19 Flat Larkin FBDA<br />
20 Taman Per.Ringan Summerwell IT 171 855<br />
21 Bandar Baru Uda OD 1 10375<br />
22 Taman Kolam Air FBDA/EA 1 625<br />
23 Taman Megah Ria OD 1 17095<br />
24 Taman Kota Puteri OP 1 10430<br />
25 Taman Rinting OP 1 13285<br />
Source: Majlis Bandaraya Johor Bahru, 2003<br />
Note: PE = Population Equivalent<br />
TOTAL 797 123,050<br />
Table <strong>14</strong>.18: Location of Treatment Plants and PE in MPJBT<br />
No Location Treatment Plans Population<br />
Category No<br />
Equivalent, PE<br />
1 Taman Jaya IT 3 960<br />
2 Taman Skudai Baru OP 2 23875<br />
NPS 5 22515<br />
3 Taman Damai Jaya OP 1 1500<br />
4 Desa Skudai OP 1 2600<br />
EA 2 5580<br />
5 Taman Abadi IT 1 2082<br />
6 Taman Sri Putri OPPS 1 6735<br />
NPS 1 3810<br />
7 Impian Mas SBR 1 5725<br />
8 Taman U. Tun Aminah ITPS 13 12731<br />
IT 8 7560<br />
9 Taman Selesa Jaya AL 2 9150<br />
NPS 3 3000<br />
10 Lima Kedai CST 24 1695<br />
EA 1 1275<br />
11 Taman Timur OP 1 1580<br />
AB 1 485<br />
12 Taman Tan Sri Yaakob OD 1 5863<br />
13 Taman Melawati EA 1 2705<br />
<strong>14</strong> Taman Sri Orkid SBR 1 3520<br />
15 Taman Mutiara Rini EA 1 4375<br />
16 Taman Jaya Mas SBR 1 2201<br />
NPS 1 200<br />
17 Taman D’ Utama EA 1 755<br />
18 Taman Permata EA 1 680<br />
19 Taman Sutera AS 1 6220<br />
NPS 1 6785<br />
20 Taman Perling OPPS 1 9910<br />
NPS 1 3540<br />
21 Taman Sri Pulai OP 1 11630<br />
NPS 2 2000<br />
22 Taman Universiti OPPS 1 6590<br />
OP 3 25760<br />
NPS 2 2000<br />
<strong>14</strong> - <strong>14</strong>
URBAN INFRASTRUCTURE <strong>CHAPTER</strong> <strong>14</strong> | PART 4<br />
No Location Treatment Plans Population<br />
Equivalent, PE<br />
Category No<br />
23 Taman Teratai OPPS 1 6240<br />
24 Bandar Kangkar Pulai OD 1 <strong>14</strong>000<br />
25 Pulai EA 1 1380<br />
26 Taman Bkt. Tiram OP 1 2460<br />
27 R. Murah Kg. Oren CST 32 2856<br />
28 Taman Desa Jaya OPPS 2 13678<br />
OP 1 8190<br />
29 Taman Puteri Wangsa OD 3 31786<br />
NPS 1 3240<br />
30 Taman Bkt. Jaya UASB 1 6345<br />
31 Taman Desa Cemerlang OD 2 20120<br />
NPS 2 11670<br />
32 Taman Desa Tebrau OD 1 3261<br />
33 Taman Pelangi Indah SBR 1 27333<br />
NPS 1 875<br />
34 Taman Gaya NPS 1 870<br />
TF 1 1375<br />
35 Taman Ria ITPS 3 1300<br />
UASB 1 804<br />
36 R. Awam Plentong CST 4 615<br />
37 Bdr. Sri Alam OP 3 17318<br />
OD 1 4264<br />
NPS 4 13400<br />
EA 1 2<strong>14</strong>30<br />
38 Taman Perind. Sri Plentong EA 1 3892<br />
39 Taman Bkt. Indah EA 1 19125<br />
TOTAL 163 449,459<br />
Sources : IWK, Unit Perancangan Wilayah Selatan, 2002<br />
Note : PE = Population Equivalent<br />
Table <strong>14</strong>.19: Location of Treatment Plants and PE in MPKu<br />
Bil Location Treatment Plans Population<br />
Equivalent,<br />
Category Bil<br />
PE<br />
1 R. A. Kulai OP 1 785<br />
5 Taman Manis OD 1 5200<br />
6 Taman Sentul HK 1 790<br />
7 Taman Sri Sentosa SBR 1 600<br />
8 Taman Damai EA 1 1670<br />
9 Taman Saleng Indah EA 1 1565<br />
10 Taman Puteri Kulai OD 1 2705<br />
OP 1 1790<br />
11 Taman Ria EA 1 794<br />
12 Taman Bintang Uta.<br />
(Fasa 2A)<br />
13 Bandar Indahpura –<br />
Zon 28<br />
EA 1 1025<br />
EA 1 9905<br />
<strong>14</strong> Taman Mutiara ITPS 1 845<br />
15 Taman Angkasa EA 1 1780<br />
16 Taman Desa Kulai EA 1 1780<br />
17 Taman Muhibbah OD 1 5745<br />
NPS 2 4735<br />
18 Kaw. Perindustrian Senai 3 OD 1 2500<br />
19 Kaw. Per. Murni Senai TF 1 878<br />
20 Taman Sepakat Jaya BF 1 760<br />
21 Taman Makmur OPPS 1 2370<br />
22 Kaw. Per. Senai 3 & 4 EA 1 1185<br />
23 R. A. Kelapa Sawit CST 13 1<strong>14</strong>0<br />
TOTAL 40 60,727<br />
Sources: IWK, Unit Perancangan Wilayah Selatan, 2002<br />
Note: PE = Population Equivalent<br />
<strong>14</strong> - 15
SECTION B<br />
PLANNING AND IMPLEMENTATION<br />
C. Individual Septic Tank (IST)<br />
Table <strong>14</strong>.20: IST in the SJER, 2002<br />
Local Authority<br />
Majlis Bandaraya Johor Bahru 10,534 52,670<br />
Majlis Perbandaran Johor Bahru<br />
Tengah<br />
Bil<br />
IST<br />
PE<br />
31,693 158,465<br />
Majlis Daerah Kulai 16,211 81,055<br />
TOTAL 58,438 292,190<br />
Sources: IWK, Unit Perancangan Wilayah Selatan, 2002<br />
Note: PE = Population Equivalent<br />
D. Existing Requirements<br />
SJER lacks a modern sewerage system and most households rely on<br />
individual septic tanks in the city of Johor Bahru. This is main source of<br />
pollution for many of the rivers in SJER and measures need to be taken<br />
to resolve this issue.<br />
Table <strong>14</strong>.21: Demand of Sewerage System in the SJER<br />
Local Authority<br />
Majlis Bandaraya Johor<br />
Bahru<br />
Majlis Perbandaran Johor<br />
Bahru Tengah<br />
Population Equivalent, PE<br />
Existing Demand Balance<br />
175,720 577,413 -401,693<br />
607,924 521,354 86,570<br />
Majlis Daerah Kulai <strong>14</strong>1,782 161,326 -19,544<br />
TOTAL 925,426 1,260,093<br />
Sources: Source: SJER CDP 2025<br />
E. Projection of Land Required for Sewerage Treatment Plan<br />
The future sewerage treatment system shall be mechanical and a total<br />
land area of 195 acres will be required by the year 2025.<br />
Table <strong>14</strong>.22: Projected Land Requirements for Sewerage Treatment<br />
Plants<br />
City<br />
Council<br />
Required Land For Sewerage Treatment Plan (acres)<br />
2000 2005 2010 2015 2020 2025<br />
MBJB 26 30 32 38 47 59<br />
MPJBT 24 29 35 46 60 75<br />
MPKu 8 8 9 11 <strong>14</strong> 17<br />
PDJB 10 11 12 <strong>14</strong> 18 22<br />
PBTPG 3 10 12 15 18 22<br />
SJER 72 88 100 124 156 195<br />
Note: Land for Mechanical Sewerage Treatment Plant<br />
F. Proposal For Eco-Friendly Sewerage Treatment<br />
The proposed sewerage treatment system for SJER combines both<br />
primary and biological treatment in order to ensure effluent complies<br />
with Standard A of the Environmental Quality Regulations (Sewage<br />
and Industrial Effluent), 1979 and Class 1 of the National Water Quality<br />
Standard before being discharged into any rivers or water bodies.<br />
The Up Flow Anaerobic Sludge Blanket/Continuous Sequencing Batch<br />
Reaction (UASB/CSBR) treatment system shall be adopted for primary<br />
treatment.<br />
The UASB reactor is an anaerobic biological treatment system requiring<br />
no energy to operate. The sewage is anaerobically digested with<br />
potential Biological Oxygen Demand (BOD) reductions of 50% to 70%.<br />
Methane gas generated from the process shall be stored to be used to<br />
generate power for the plant.<br />
<strong>14</strong> - 16
URBAN INFRASTRUCTURE <strong>CHAPTER</strong> <strong>14</strong> | PART 4<br />
Figure <strong>14</strong>.5: Example of a Centralised Mechanical Sewerage System<br />
H. Proposed Sewerage Treatment and Its Cost<br />
Majidee, Bandar Nusajaya, Kulai and Tanjung Langsat have been<br />
identified for proposed centralised sewerage treatment plant. These<br />
sites are located within the various local planning authority areas and<br />
will cost a total of RM 339,575.000.<br />
Coarse<br />
Screen Fine<br />
Screen<br />
Pumping main<br />
from Vacum<br />
Station/Pumping<br />
Station<br />
Grit/<br />
Grease<br />
Removal<br />
Chamber<br />
Sludge<br />
Drying<br />
Beds<br />
air pipe<br />
Equalisation<br />
on tank<br />
Waste<br />
Activated<br />
Sludge<br />
air flow<br />
Anaerobic<br />
Upflow<br />
Sludge<br />
Blanket<br />
Reactor<br />
SBR<br />
Tank<br />
Waste<br />
Sludge<br />
Sludge<br />
Pumping<br />
Chamber<br />
By Pass Line<br />
U.V<br />
Disinfect<br />
Ion<br />
Rotary<br />
Drum<br />
Thickene<br />
R<br />
Centrifu<br />
GE<br />
Wetland for<br />
Effluent Polishing<br />
Sludge<br />
Storage<br />
Final<br />
Effluent<br />
Disposal/<br />
Reuse<br />
Table <strong>14</strong>.23: Proposed Project Cost for Sewage System<br />
Zone 1 – MBJB<br />
No. Project Location Project Cost Proposed Agency<br />
1 Proposed main<br />
sewerage pipe lines<br />
9,450,000 JPP/IWK<br />
2 Proposed manhole 4,725,000 JPP/IWK<br />
3 Proposed central<br />
mechanical<br />
sewerage treatment<br />
plan<br />
Majidee 126,000,000 JPP/IWK<br />
Total <strong>14</strong>0,175,000<br />
Zone 2 – MPJBT<br />
No. Project Location Project Cost Proposed Agency<br />
Source: SJER CDP 2025<br />
1 Proposed main<br />
sewerage pipe lines<br />
4,410,000 JPP/IWK<br />
2 Proposed manhole 2,205,000 JPP/IWK<br />
3 Proposed central<br />
mechanical<br />
sewerage treatment<br />
plan<br />
Bandar<br />
Nusajaya<br />
63,000,000 JPP/IWK<br />
Total 69,615,000<br />
Zone 3 – MPKu<br />
No. Project Location Project Cost Proposed Agency<br />
Examples of Centralised Mechanical Sewerage System<br />
G. Industrial Waste<br />
The handling of industrial sewage must also follow the set guidelines<br />
and policies. A detailed study must be conducted for all industrial<br />
facilities which discharge industrial waste. All samples from the operator<br />
or the owner of the industrial facility must be handed over to the local<br />
authorities for control purposes.<br />
1 Proposed main<br />
sewerage pipe lines<br />
1,890,000 JPP/IWK<br />
2 Proposed manhole 945,000 JPP/IWK<br />
3 Proposed central<br />
mechanical<br />
sewerage treatment<br />
plan<br />
Kulai 63,000,000 JPP/IWK<br />
Total 65,835,000<br />
Zone 5 - PBT Pasir Gudang<br />
No. Project Location Project Cost Proposed Agency<br />
1 Proposed main<br />
sewerage pipe lines<br />
900,000 JPP/IWK<br />
2 Proposed manhole 50,000 JPP/IWK<br />
<strong>14</strong> - 17
SECTION B<br />
PLANNING AND IMPLEMENTATION<br />
3 Proposed central<br />
mechanical<br />
sewerage treatment<br />
plan<br />
Tanjung<br />
Langsat<br />
Total 63,950,000<br />
Grand Total for<br />
Sewerage System<br />
63,000,000 JPP/IWK<br />
339,575,000<br />
Table <strong>14</strong>.24: Generated Solid Waste in Johor Bahru<br />
Item<br />
Solid Waste<br />
(Tone/year)<br />
Demand<br />
of Sanitary<br />
landfill<br />
(acre)<br />
Existing<br />
Sanitary<br />
land<br />
(acre)<br />
Balance<br />
Sanitary Land<br />
(acre)<br />
Domestic <strong>14</strong>6,<strong>14</strong>6 80.3 n/a n/a<br />
Source: SJER CDP 2025<br />
Industry &<br />
Commercial<br />
43,844 24.1 n/a n/a<br />
<strong>14</strong>.10 Solid Waste<br />
TOTAL 189,990 104.3 212.5 108.2<br />
Solid Waste is increasingly becoming an important urban challege.<br />
If left unchecked, solid waste could lead to severe environmental<br />
degradation. Solid waste generated in housing, commercial and<br />
industrial areas should be collected according to clear schedules to<br />
avoid unnecessary odour and pollution. It will also help to prevent<br />
open burning. Solid waste must also be managed from source and<br />
upon collection must be sorted, recycled and disposed of in a safe,<br />
environmentally sensitive manner.<br />
KEY DIRECTION<br />
UI 10 Set targets for waste reduction<br />
UI 11 Create a balanced waste-management strategy i.e. a no<br />
net/export level of solid waste by 2025.<br />
A. Existing Situation<br />
The collection and disposal of solid waste in SJER is handled by Southern<br />
Waste Management Sdn. Bhd. (SWM) except for the Pasir Gudang area<br />
which is handled by Pasir Gudang Local Authority. The collection and<br />
disposal of toxic waste is supervised by the Department of Environment<br />
and all scheduled toxic waste is send to Bukit Nenas for disposal.<br />
B. Solid Waste Disposal<br />
A total of 189.990 tonnes of solid waste is generated each year in SJER.<br />
Currently this solid waste is disposed in 212.5 acres of landfill areas within<br />
SJER. With the current waste generated, there is a balance of 108.2<br />
acres of land left at current landfill sites.<br />
Table <strong>14</strong>.25: Sanitary Landfill in Johor Bahru<br />
Sanitary Landfill<br />
Seelong Selatan, Km 23,<br />
Jalan Tiram-Kulai<br />
Area<br />
(acre)<br />
Life Span<br />
Sources: SUKJ Cawangan Kerajaan Tempatan, 2003<br />
C. Transfer Station<br />
Method of Disposal<br />
212.5 5 years (2008) Sanitary Landfill<br />
Within SJER, before waste is sent to the centralized waste disposal area<br />
at Seelong Selatan, it is kept temporarily at a transfer station in Jalan<br />
Taruka, Larkin, Johor Bahru. The waste is then transferred in large 12<br />
tonne-capacity containers to Seelong Selatan which is about 12 km<br />
away. This transfer station has the capacity to store and transfer waste<br />
of approximately 856 tonnes per day.<br />
D. Recycle<br />
In order to reduce the environmental impact of waste disposal,<br />
recycling has been introduced. This has reduced non bio-gradable<br />
waste disposed at the disposal site.<br />
There are 108 recycling centres within Johor Bahru City Council and<br />
Majlis Perbandaran Johor Bahru Tengah, each providing different<br />
containers to separate paper, tin cans and glass.<br />
<strong>14</strong> - 18
URBAN INFRASTRUCTURE <strong>CHAPTER</strong> <strong>14</strong> | PART 4<br />
Transfer Station Jalan Taruka, Larkin<br />
Table <strong>14</strong>.26: Location of Recycling Centres in Johor Bahru<br />
Local Authority<br />
Majlis Bandaraya<br />
Johor Bahru<br />
Locations<br />
1. ESSO, Jalan Kebun Teh<br />
2. Bandar baru UDA<br />
3. Bangunan D’ Stulang<br />
4. Gerai Makan Hutan Bandar<br />
5. Injaya Sdn. Bhd. – stesyen minyak<br />
6. Jabatan Lanskap MBJB<br />
7. BP Jalan Tebrau<br />
8. kompleks bebas Cukai<br />
9. Kompleks kedai Permas Jaya<br />
10. Kompleks Tun Abdul Razak<br />
11. Shell Jalan Sawmill<br />
12. Maktab Sultan Abu Bakar<br />
13. City Square<br />
<strong>14</strong>. Pejabat Kesihatan Daerah<br />
15. Pejabat MBJB<br />
16. Pejabat Penguasa MBJB<br />
17. Pejabat SUK Johor<br />
18. MOBILE Jalan Sri Pelangi<br />
19. CALTEX Jalan Tun Razak<br />
20. Pintu masuk Kompleks Kastam<br />
21. Pintu keluar Kompleks Kastam<br />
22. Plaza Angsana<br />
23. Pondok Menunggu Bas Hadapan MBJB<br />
24. Puasat Penjaja Taman Sri Tebrau<br />
25. Restoren Singgah Selalu<br />
26. RTM Johor Bahru<br />
27. Sek. Agama BBU<br />
28. Sek. Keb. Air Molek<br />
29. Sek. Keb. BBU II<br />
30. Sek. Keb. Convent JB<br />
31. Sek. Keb. Jenis (T) Jalan Yahya Awal<br />
32. Sek. Keb. Kg. Pasir<br />
Local Authority<br />
Majlis Perbandaran<br />
Johor Bahru Tengah<br />
Locations<br />
33. Sek. Keb. Khir Johari<br />
34. Sek. Keb. Kompleks UDA<br />
35. Sek. Keb. Larkin 1<br />
36. Sek. Keb. Nong Chik<br />
37. Sek. Keb. Taman Pelangi<br />
38. Sek. Keb. Taman Puteri<br />
39. Sek. Keb. Temenggung Abd. Rahman 1<br />
40. Sek. Keb. Temenggung Abd. Rahman 2<br />
41. Sek. Men. Keb. (P) Sultan Ibrahim<br />
42. Sek. Men. Keb. Aminuddin Baki<br />
43. Sek. Men. Keb. BBU<br />
44. Sek. Men. Keb. Sultan Ismail<br />
45. Sek. Men. Keb. TUTA<br />
46. Sek. Ren. Jenis Keb. (C) Foon Yeu 1<br />
47. Seng Motor Sdn. Bhd.<br />
48. Sithiam Brothers Sdn. Bhd.<br />
49. Tandas Awam Stulang Laut<br />
50. Tapak Penjaja<br />
51. XTRA Hypermarket<br />
1. Giant Cash & Carry Sdn. Bhd.<br />
2. Pengawas Pengurusan Harta MPJBT<br />
3. Pusat Beli Belah<br />
4. Sek. Agama Bandar Selesa Jaya<br />
5. Sek. Agama Sri Perling 2<br />
6. Sek. Agama TUTA<br />
7. Sek. Agama Taman Universiti 1<br />
8. Sek. Keb. Gelang Patah<br />
9. Sek. Keb. Kangkar Pulai<br />
10. Sek. Keb. Skudai Baru<br />
11. Sek. Keb. Skudai Batu 10<br />
12. Sek. Keb. Sri Perling 2<br />
13. Sek. Keb. Taman Damai Jaya<br />
<strong>14</strong>. Sek. Keb. Desa Cemerlang<br />
15. Sek. Keb. Desa Jaya<br />
16. Sek. Keb. Johor Jaya 1<br />
17. Sek. Keb. Johor Jaya 2<br />
18. Sek. Keb. Mutiara Rini<br />
19. Sek. Keb. Taman Perling<br />
20. Sek. Keb. Taman Puteri Wangsa<br />
21. Sek. Keb. Selesa Jaya<br />
22. Sek. Keb. Sri Skudai<br />
23. Sek. Keb. TUTA 1<br />
24. Sek. Keb. TUTA 2<br />
25. Sek. Keb. Taman Universiti 1<br />
26. Sek. Keb. Taman Universiti 2<br />
27. Sek. Keb. Taman Universiti 4<br />
28. Sek. Keb. Ulu Tiram<br />
29. Sek. Men. Agama Johor Jaya<br />
30. Sek. Men. Keb. Dato’ Pengawa Timur<br />
31. Sek. Men. Keb. Gelang Patah<br />
32. Sek. Men. Keb. Skudai Baru<br />
33. Sek. Men. Keb. Sri Perling 2<br />
34. Sek. Men. Keb. TUTA<br />
35. Sek. Men. Keb. Skudai<br />
36. Sek. Men. Keb. Sri Perling<br />
37. Sek. Men. Keb. Johor Jaya 1<br />
38. Sek. Men. Keb. Johor Jaya 2<br />
39. Sek. Men. Keb. Mutiara Rini<br />
40. Sek. Men. Keb. Sri Pulai<br />
41. Sek. Men. Keb. Taman Universiti<br />
42. Sek. Men. Keb. Ulu Tiram<br />
<strong>14</strong> - 19
SECTION B<br />
PLANNING AND IMPLEMENTATION<br />
Local Authority<br />
Locations<br />
(con’t)<br />
43. Sek. Ren. Jenis Keb. (C) Kuo Kuang 1<br />
44. Sek. Ren. Jenis Keb. (C) Meng Terk<br />
45. Sek. Ren. Jenis Keb. (C) Ching Yeh<br />
46. Sek. Ren. Jenis Keb. (C) Kuo Kuang 2<br />
47. Sek. Ren. Jenis Keb. (C) Masai<br />
48. Sek. Ren. Jenis Keb. (C) Pei Hua<br />
49. Sek. Ren. Jenis Keb. (C) Ping Ming<br />
50. Sek. Ren. Jenis Keb. (C) Plentong<br />
51. Sek. Ren. Jenis Keb. (C) Pu Sze<br />
52. Sek. Ren. Jenis Keb. (C) Ulu Tiram<br />
53. Sek. Ren. Jenis Keb. (T) Ladang Rini<br />
54. Sek. Ren. Jenis Keb. (T) Masai<br />
55. Sek. Ren. Jenis Keb. (T) TUTA<br />
56. Sek. Ren. Jenis Keb. (T) Kangkar Pulai<br />
57. Terminal Bas TUTA<br />
Table <strong>14</strong>.28: Projected Land Requirements for Solid Waste Disposal<br />
- Sanitary Landfill<br />
Item 2000 2005 2010 2015 2020 2025<br />
Total<br />
(acre)<br />
Domestic 65.3 80.3 91.3 113.4 <strong>14</strong>2.1 177.9 670.2<br />
Industry &<br />
Commercial<br />
19.6 24.1 27.4 34.0 42.6 53.4 201.1<br />
Total 84.8 104.3 118.6 <strong>14</strong>7.5 184.7 231.3 871.3<br />
Existing<br />
Sanitary Land<br />
n/a n/a n/a n/a n/a n/a 212.5<br />
Additional Sanitary Land until Year 2025 (658.8)<br />
Source: SJER CDP 2025<br />
Source: SJER CDP 2025<br />
Table <strong>14</strong>.29: Projected Land for Incinerator<br />
E. Projected Generation of Solid Waste<br />
Solid waste generation is expected to increase with an expanding<br />
population base and increasing economic activity. As an indication,<br />
waste generated by commercial and industrial activity generally hovers<br />
at around 30% of domestic waste generated.<br />
Item 2000 2005 2010 2015 2020 2025<br />
Total<br />
(acre)<br />
Domestic 13.1 16.1 18.3 22.7 28.4 35.6 134.0<br />
Industry &<br />
Commercial<br />
3.9 4.8 5.5 6.8 8.5 10.7 40.2<br />
Total 17.0 20.9 23.7 29.5 36.9 46.3 174.3<br />
Existing Sanitary Land 212.5<br />
Table <strong>14</strong>.27: Projected Generation of Solid Waste in SJER<br />
Item 2000 2005 2010 2015 2020 2025<br />
Domestic<br />
(tone/year)<br />
Industry &<br />
Commercial<br />
(tone/year)<br />
118,854 <strong>14</strong>6,<strong>14</strong>6 166,201 206,561 258,790 324,000<br />
35,656 43,844 49,860 61,968 77,637 97,200<br />
TOTAL 154,510 189,989 216,062 268,529 336,426 421,200<br />
Source: SJER CDP 2025<br />
Balance 38.25<br />
Source: SJER CDP 2025<br />
F. Proposal<br />
A centralised waste disposal system using waste-to-energy plants is<br />
proposed to manage solid waste disposal in SJER, to address limited<br />
land resources and to allow for extraction of energy from solid waste<br />
disposed.<br />
Recycling centres must be increased in number and should be located<br />
at convenient public places to encourage a higher rate of recycling<br />
among local communities.<br />
All industries that generate toxic waste must be licensed by the<br />
Department of Environment and by local authorities.<br />
There should be sufficient waste disposal sites and a study should be<br />
conducted to identify suitable locations.<br />
<strong>14</strong> - 20
URBAN INFRASTRUCTURE <strong>CHAPTER</strong> <strong>14</strong> | PART 4<br />
D. Solid Waste Management Project and Its Cost<br />
Sustainable waste management shall be implemented at three levels<br />
namely at the domestic/household, community and city levels. This<br />
involves separation at source (recycling) and using waste as alternative<br />
energy source.<br />
Table <strong>14</strong>.30: Projected Cost for Solid Waste Management<br />
Bil. Project Location Proposed Agency Project Cost<br />
▼ Waste To Energy Plant<br />
One long-term objective is to convert waste into an alternative source<br />
of energy. A Waste to Energy plant needs to be constructed within SJER.<br />
A waste to energy plant burns waste to produce electricity and in this<br />
manner, it will reduce the amount of waste that needs to be buried in<br />
landfills, while producing electricity that can be sold to the main grid.<br />
Japan burns 62% of its solid waste by means of waste to energy plants,<br />
while Switzerland burns 58% and USA <strong>14</strong>% .<br />
1 Proposed transfer<br />
station for non<br />
toxic waste<br />
2 Proposed transfer<br />
station for toxic<br />
waste<br />
3 Proposed recycle<br />
centre<br />
4 Proposed central<br />
incinerator<br />
5 Maintenance<br />
and<br />
improvement on<br />
existing ex-waste<br />
disposal site<br />
Jalan Taruka,<br />
Nusajaya<br />
SWM/SJER 20,000,000<br />
Pasir Gudang SJER 20,000,000<br />
SJER 20,000,000<br />
Seelong SJER 126,000,000<br />
Tiram, Pasir<br />
Gudang, Kulai,<br />
Jalan Taruka<br />
SWM/SJER 40,000,000<br />
New technology is emerging such as thermal technology which<br />
produces less pollution than traditional incinerators. The new plants are<br />
also able to treat clinical waste and hazardous waste which can only<br />
be destroyed by very high temperatures.<br />
▼ Eco Friendly Landfill<br />
Landfill technology has also evolved whereby landfill sites are lined,<br />
well-treated and managed to ensure no leakage. SJER intends to adopt<br />
such systems.<br />
Source: SJER CDP 2025<br />
Grand Total for Solid Waste 226,000,000<br />
▼ Waste Separation at Source<br />
Separation at source shall be implemented at household and<br />
community level. At the household level, each residential unit shall be<br />
equipped with two waste bins segregating wet and dry waste. This shall<br />
be incorporated in the design of the units. In addition, grinders shall be<br />
incorporated with kitchen sinks so that food waste shall first be meshed<br />
before being disposed off into the sewerage system.<br />
At the community level, recycling centre shall be located at community<br />
centres and recycling bins at strategic location.<br />
<strong>14</strong> - 21
SECTION B<br />
PLANNING AND IMPLEMENTATION<br />
Landfill gas<br />
collection well<br />
Final cap<br />
Landfill gas<br />
monitoring probe<br />
Groundwater<br />
monitoring well<br />
Landfill gas as<br />
energy source<br />
Landfill<br />
gas flared<br />
Perimeter<br />
drainage<br />
Leachate removal<br />
to treatment<br />
/disposal<br />
Leachate<br />
extraction<br />
riser<br />
Leachate<br />
containment<br />
liner<br />
Completed<br />
landfill<br />
Operating<br />
landfill<br />
Final vegetated profile<br />
Surface water<br />
diversion barrier<br />
Working face<br />
Completed Daily/<br />
cell intermediate<br />
cover<br />
Undisturbed foundation<br />
Groundwater table<br />
Leachate<br />
collection<br />
system<br />
Stormwater from<br />
construction to ponds<br />
Clean<br />
stormwater<br />
diversion<br />
Existing<br />
landform<br />
Excavated<br />
base grade<br />
Landfill gas<br />
monitoring probe<br />
Groundwater<br />
monitoring well<br />
<strong>14</strong>.11 Information and Communication Technology<br />
In line with the government’s objective of promoting information and<br />
communication technology (ICT) usage, this will be an area of focus for<br />
SJER.<br />
A. Existing Situation<br />
The tables illustrate the rate of internet penetration and ICT usage in<br />
<strong>Malaysia</strong>.<br />
Table <strong>14</strong>.31: Internet (Dial-Up) Customers in <strong>Malaysia</strong>, (1995-2001)<br />
1995 1996 1997 1998 1999 2000 2001 2002<br />
Customer<br />
(million)<br />
0.0<strong>14</strong> 0.064 0.205 0.405 0.668 1.659 2.115 2,6<strong>14</strong><br />
Growth (%) - 357.7 220.3 97.6 64.9 <strong>14</strong>8.4 27.5 23.6<br />
Penetration 0.1 0.3 0.9 1.8 2.9 7.1 8.8 10.5<br />
Sources: Suruhanjaya Komunikasi Dan Multimedia, 2001<br />
Table <strong>14</strong>.32: Selected Information ICT in <strong>Malaysia</strong>, (1995-2000)<br />
Legend 1995 2000<br />
Telex customers 6,578 3,105<br />
Personal computers 610,000 2,200,000<br />
Personal computer for every 1,000 population 29.5 95.7<br />
Telephone line for every 1,000 population 161.07 204.76<br />
Example of Land fill sites in New Zealand which is also used partly as a Park<br />
Telephone customers 3,332,447 4,650,410<br />
Mobile phone 700,000 2,265,000<br />
Total internet customers 13,064 1,157,384<br />
Total internet users 30,000 4,000,000<br />
Sources: Suruhanjaya Komunikasi dan Multimedia, PIKOM, World Development<br />
Report, 1999/2000 and World Competitiveness Yearbook, 2000.<br />
Johor State has 78,000 Internet users in the year 2000, with a penetration<br />
rate of 3% (based on the total population size). This is very low<br />
compared to Kuala Lumpur and Selangor, which have penetration<br />
rates of 10% and 8% respectively.<br />
<strong>14</strong> - 22
URBAN INFRASTRUCTURE <strong>CHAPTER</strong> <strong>14</strong> | PART 4<br />
Table <strong>14</strong>.33: Internet User by State, 2000<br />
State Customer %<br />
Customer<br />
in 1,000<br />
population<br />
Selangor 335,262 38.2 84.9<br />
W. P. Kuala Lumpur 134,870 15.4 103.9<br />
Johor 77,747 8.8 30.3<br />
Pulau Pinang 63,648 7.3 51.9<br />
Perak 55,345 6.3 27.3<br />
Sarawak 43,219 5 21.5<br />
Sabah 40,692 4.6 16.6<br />
Kedah 28,494 3.2 18.1<br />
Negeri Sembilan 22,373 2.6 27.0<br />
State Customer %<br />
Customer<br />
in 1,000<br />
population<br />
Pahang 21,682 2.5 18.0<br />
Melaka 17,234 2 28.6<br />
Kelantan 16,101 1.8 12.5<br />
Terengganu 15,041 1.7 17.1<br />
Perlis 3,710 0.4 18.7<br />
Wilayah Persekutuan Labuan 1,355 0.2 19.2<br />
<strong>Malaysia</strong> 876,773 * 100 39.5<br />
Sources: Suruhanjaya Komunikasi Dan Multimedia, 2000<br />
Note: * Maxisnet not included<br />
B. Existing ICT Infrastructure<br />
The quality of SJER’s ICT infrastructure is relatively poor in comparison<br />
with the existing infrastructure at the Multimedia Super Corridor (MSC).<br />
Johor (in addition to Penang) is targeted to have a comparable quality<br />
of infrastructure by 2010 under the second phase of the MSC national<br />
roll out plan. This should help to drive adoption of high speed internet<br />
access, or broadband.<br />
C. Personal Computer Ownership<br />
The number of personal computers in SJER in 2003 stood at 305,227,<br />
which implies a penetration of 24.4% of the total population of SJER. This<br />
is expected to increase to 775,415 by the year 2025.<br />
Table <strong>14</strong>.34: Number of PC Owners in SJER, 2003<br />
Local Authority<br />
PC Owner<br />
Majlis Bandaraya Johor Bahru (MBJB) 138,<strong>14</strong>0<br />
Majlis Perbandaran Johor Bahru Tengah (MPJBT) 107,500<br />
Pihak Berkuasa Perancang Tempatan Daerah Johor Bahru<br />
(PBPTDJB)<br />
35,011<br />
Majlis Daerah Kulai (MDK) 12,479<br />
PBT Pasir Gudang (PBTPG) 12,097<br />
TOTAL 305,227<br />
Source: SJER CDP 2025<br />
Table <strong>14</strong>.35: Projected PC Ownership in SJER, 2003-2020<br />
Local<br />
Authority<br />
2003 2005 2010 2015 2020 2025<br />
MBJB 138,<strong>14</strong>0 155,960 166,565 200,378 246,465 308,574<br />
MPJBT 107,500 126,850 153,108 201,643 264,757 331,476<br />
MDK 12,479 13,8<strong>14</strong> <strong>14</strong>,947 17,996 22,261 27,827<br />
PBPTDJB 35,011 38,127 41,482 48,078 58,943 73,679<br />
PBTPG 12,097 15,000 18,675 23,213 27,044 33,859<br />
TOTAL 305,227 349,752 394,778 491,309 619,471 775,415<br />
Source: SJER CDP 2025<br />
The level of ICT adoption in SJER can be measured through three<br />
different indicators, which are the ownership of personal computers,<br />
the rate of Internet access and also the level of IT literacy.<br />
<strong>14</strong> - 23
SECTION B<br />
PLANNING AND IMPLEMENTATION<br />
D. Internet Penetration<br />
With regards to Internet usage, <strong>14</strong>3,064 people had access to the<br />
Internet in 2003 and this is expected to increase to 373,275 by the year<br />
2025.<br />
Table <strong>14</strong>.36: Number of Internet Users in the SJER, 2003<br />
E. ICT literacy<br />
The number IT literate users in SJER is 251,967, which translates into 20.1%<br />
of the total population in 2003 and this is expected to increase to 80% in<br />
the year 2025.<br />
Table <strong>14</strong>.38: IT Literacy Rate, 2003<br />
Local Authority<br />
Internet Owner<br />
Local Authority<br />
IT Literate<br />
Majlis Bandaraya Johor Bharu (MBJB) 62,163<br />
Majlis Perbandaran Johor Bahru Tengah (MPJBT) 60,200<br />
Majlis Bandaraya Johor Bahru (MBJB) 103,605<br />
Majlis Perbandaran Johor Bahru Tengah (MPJBT) 83,850<br />
Pihak Berkuasa Perancang Tempatan Daerah Johor Bahru<br />
(PBPTDJB)<br />
9,803<br />
Pihak Berkuasa Perancang Tempatan Daerah<br />
Johor Bahru (PBPTDJB)<br />
19,256<br />
Majlis Daerah Kulai (MDK) 4,118<br />
PBT Pasir Gudang (PBTPG) 6,779<br />
Source: SJER CDP 2025<br />
TOTAL <strong>14</strong>3,063<br />
Table <strong>14</strong>.37: Projected Internet Usage in the SJER, 2003-2020<br />
Local<br />
Authority<br />
2003 2005 2010 2015 2020 2025<br />
MBJB 62,163 70,182 74,954 90,170 110,909 138,858<br />
MPJBT 60,200 71,036 85,740 112,920 <strong>14</strong>8,264 185,627<br />
MDK 4,118 4,559 4,932 5,939 7,346 9,183<br />
PBPTDJB 9,803 10,675 11,615 13,462 16,504 20,630<br />
PBTPG 6,780 8,407 10,467 13,010 15,157 18,977<br />
TOTAL <strong>14</strong>3,064 164,859 187,709 235,501 298,181 373,275<br />
Source: SJER CDP 2025<br />
Majlis Daerah Kulai (MDK) 3,618<br />
PBT Pasir Gudang (PBTPG) 41,638<br />
TOTAL 251,967<br />
Source: SJER CDP 2025<br />
F. Proposal<br />
The development of the ICT infrastructure in SJER should be inline with<br />
the vision and strategy of the State of Johor’s ICT blueprint. As far<br />
as the ICT infrastructure is concerned, private sector participation is<br />
encouraged, through the implementation of new and cost-effective<br />
technology. It is also important that access to worldwide network is<br />
made available. To promote a participative society, an awareness<br />
initiative is necessary to ensure an effective utilisation of infrastructure. It<br />
is proposed that:<br />
■ The broadband coverage is increased to meet the State’s target<br />
for 100% broadband in Homes,<br />
■ The application of wireless Internet technology is enhanced; inline<br />
with the State vision for a Wireless City,<br />
■ further initiatives in the MSC rollout, subsequent to the creation of<br />
a Cybercentre at Menara MSC Cyberport, Johor Bahru<br />
■ Proposed village ICT (k-Centre) in community centres within SJER.<br />
<strong>14</strong> - 24
URBAN INFRASTRUCTURE <strong>CHAPTER</strong> <strong>14</strong> | PART 4<br />
<strong>14</strong>.12 Gas Supply<br />
Natural gas is used primarily for power generation (65%) in <strong>Malaysia</strong>. 24%<br />
of natural gas produced is used in heavy industry, 4% is used in housing,<br />
commercial and industrial areas and the remaining 7% is exported.<br />
Petronas Gas Berhad is responsible for the transmission of gas and for<br />
ensuring sufficient supply of gas.<br />
Figure <strong>14</strong>.6: Gas Distribution in <strong>Malaysia</strong><br />
A. Existing Gas Supply in SJER<br />
Natural gas is supplied mainly to the industrial areas in Plentong, Tebrau,<br />
Larkin, Tampoi, Kulai and Senai. However, the ‘City Gas System’ has<br />
not been extended to non industrial consumers, and most houses and<br />
restaurants use gas distributed in small cylinders, while hotel and some<br />
industrial users receive gas in bulb shaped cylinders. As of today there<br />
are four odoriser stations which are in Kulai, Senai, Permas Jaya and<br />
Pasir Gudang, with a total capacity of 177,100 (sm 2 /Hr).<br />
Table <strong>14</strong>.39: Odouriser Stations and its Capacity<br />
Location Odoriser Station Capacity (sm 2 /Hr)<br />
Johor Bahru Permas Jaya Odoriser Station 70,000<br />
Senai Senai Odoriser Station 8,100<br />
Kulai Kulai Odoriser Station 29,000<br />
Pasir Gudang Pasir Gudang Odoriser Station 70,000<br />
TOTAL 177,100<br />
Source: Gas <strong>Malaysia</strong> Berhad, 2003<br />
B. Supply and Demand<br />
Source: Gas <strong>Malaysia</strong> Berhad<br />
The supply and distribution of gas for commercial purposes is fairly<br />
advanced, with gas being supplied via pipelines to factories and other<br />
gas consumers. Natural gas is distributed by Gas <strong>Malaysia</strong> Berhad<br />
through a medium pressure piping system placed along road reserves.<br />
The natural gas is obtained from the Petronas Supply Centre in the east<br />
coast of <strong>Malaysia</strong> and these pipes run to the southern region of Johor,<br />
supplying gas to Johor Bahru, Pasir Gudang and Singapore.<br />
Demand for gas is currently quite low and expected to remain so.<br />
Demand for gas in year 2010 is projected at only 88 units (cubic metre).<br />
Table <strong>14</strong>.40: Projected Demand for Gas (cubic metre)<br />
Location Sector 2002 2005 2010 2015 2020 2025<br />
Plentong,<br />
Tebrau,<br />
Larkin,<br />
Tampoi<br />
Senai<br />
Domestic 0 - - - - -<br />
Commercial 0 9 34 44 57 75<br />
Industry 0 19 30 39 51 66<br />
Domestic - - - - - -<br />
Commercial - - - - - -<br />
This study of gas supply and distribution in the SJER area mainly<br />
concentrates on the consumption of gas by the housing, commercial<br />
and industrial sectors.<br />
Kulai<br />
Pasir<br />
Gudang<br />
Industry 1 8 <strong>14</strong> 18 24 31<br />
Domestic - - - - - -<br />
Commercial - - - - - -<br />
Industry 1 1 1 1 2 2<br />
Domestic - - - - - -<br />
Commercial 1 2 3 3 4 6<br />
Industry 2 5 7 8 11 <strong>14</strong><br />
TOTAL 5 44 88 115 <strong>14</strong>9 194<br />
Sources: Gas <strong>Malaysia</strong> Berhad, 2003<br />
<strong>14</strong> - 25
SECTION B<br />
PLANNING AND IMPLEMENTATION<br />
C. System Development<br />
The following recommendations are proposed:<br />
■ Provide gas piping system for all sectors (industrial, commercial<br />
and residential);<br />
■ Extend area of coverage for “City Gas System”; and<br />
■ Gas pipes should use the common “service utility tunnel”.<br />
As a minimum, Gas <strong>Malaysia</strong> should implement a gas piping network in<br />
future large developments. A comprehensive piping system in housing<br />
areas should also be promoted.<br />
D. Gas Supply Strategies<br />
It is recommended that a strategic plan should be prepared by SJER<br />
to identify all the utility providers. The gas distribution system should<br />
cover major development areas such as Tanjung Pelepas Port, Pasir<br />
Gudang Port, Johor Bahru City Centre and Senai Cargo Hub, as well as<br />
supporting development areas, such Bandar Nusajaya and Danga Bay.<br />
SJER should promote the use of piped gas in new development areas,<br />
especially for high-rise housing, mixed use development projects and<br />
projects within 2 km of the existing reserve pipeline. Pipelines should<br />
also be connected to Bandar Nusajaya, Pasir Gudang Port and PTP<br />
to support these mega township developments. Common trenching<br />
should be used where possible, to be implemented in stages, so that<br />
future maintenance work or upgrades can be done systematically<br />
without digging up roads.<br />
<strong>14</strong> - 26
URBAN INFRASTRUCTURE <strong>CHAPTER</strong> <strong>14</strong> | PART 4<br />
Figure <strong>14</strong>.7: Drainage, Solid Waste and Sewerage<br />
Source: SJER CDP 2025<br />
<strong>14</strong> - 27
SECTION B<br />
PLANNING AND IMPLEMENTATION<br />
Figure <strong>14</strong>.8: Telecommunication, Water Supply, Gas Supply and Power Supply Facilities<br />
Source: SJER CDP 2025<br />
<strong>14</strong> - 28