THE NEW ZEALAND TIMBER DESIGN SOCIETY
THE NEW ZEALAND TIMBER DESIGN SOCIETY
THE NEW ZEALAND TIMBER DESIGN SOCIETY

Create successful ePaper yourself
Turn your PDF publications into a flip-book with our unique Google optimized e-Paper software.
MACHINE STRESS GRADING REVISITED<br />
D J Gaunt, Forest Research, Rotorua, New Zealand<br />
SUMMARY<br />
With New Zealand’s adoption of the random location testing standard AS/NZS 4063:1992 and the move to<br />
shorter tree rotations and younger age at clear-felling, the effectiveness of current machine stress grading<br />
(MSG) procedures is questioned. A known and reliable relationship between strength and stiffness forms the<br />
basis of any MSG operation. This relationship has deteriorated making the prediction of strength implicit in an<br />
MSG operation often unreliable and inefficient in terms of grade recovery. Options for improving the<br />
effectiveness of MSG on young radiata pine are examined.<br />
INTRODUCTION<br />
Since 1992 the basis for evaluating the in-grade strength of timber has changed with the adoption of the new<br />
joint Australian/New Zealand Standard AS/NZS 4063:1992. The important change in this standard is that<br />
timber is tested to simulate actual use. That is the test specimen is taken at random from a length of graded<br />
timber rather than being chosen so as to contain the grade-determining defect. Historically the in-grade timber<br />
test methods used in Australia and New Zealand relied on a worst defect, worst location (biased) approach.<br />
With machine graded timber, this approach was described in the New Zealand standard NZS3618:1984. This<br />
standard requires the point of low stiffness as a plank (MoE Pmin ) to be positioned it in the test machine such that<br />
the obvious strength reducing defect was on the tension side.<br />
The intention of this paper is to discuss:<br />
Firstly can a machine stress grader be made to work more accurately when aligned with the random location<br />
test method and what are the implications on the machine stress grader's ability to predict strength?<br />
Secondly what are the other options for improving the assigned strength properties?<br />
MINIMUM MODULUS OF ELASTICITY AS A PLANK (MoEPmin) VERSUS AVERAGE MODULUS<br />
OF ELASTICITY AS A PLANK (MoEP average)<br />
The change in test method away from determining grade stresses always being at the position of MoE Pmin (the<br />
historic biased tested approach) to a random location, raises the issue of the actual importance of this MoE Pmin<br />
location. Machine grading in New Zealand has, and still does, rely on the minimum MoEp as the means for<br />
assigning a grade for the overall piece. With the MoE Pmin point now often being outside the test span zone,<br />
questions of its relevance in the prediction of structural properties have been raised.<br />
To reiterate the effect of the random test method, in reality within a six metre length of timber the MoE Pmin<br />
location maybe in the first 1.2m whereas the test location may well be in the last 1.8m. The net result of this<br />
separation between the MoE Pmin position and the test position is a deterioration in the relationship between<br />
MoE Pmin and the strength properties. This deterioration is readily apparent in the lower linear regression<br />
coefficients (r 2 ) between MoE Pmin and bending stiffness (MoE j ) and bending strength (MoR j ). It is these<br />
regression equations that presently form the basis by which a machine grader predicts strength and stiffness<br />
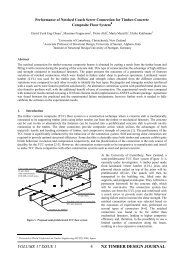
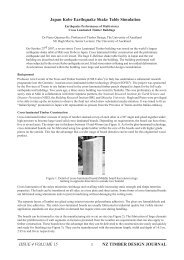
from the measured MoE Pmin . Figures 1, 2, 3 & 4 show these differences:<br />
• Figures 1 & 2 showing the relationships between MoE Pmin with MoE j and MoR j in old crop radiata pine<br />
when tested using the biased approach.<br />
• Figures 3 & 4 show the relationships between MoE Pmin with MoE j and MoR j in 19 year old radiata pine<br />
when tested using the random defect location approach.<br />
Similar relationships are found between MoE Pmin and the tension and compression strengths but not been<br />
included is this paper.<br />
ISSUE 1 VOLUME 8 10 NZ <strong>TIMBER</strong> <strong>DESIGN</strong> JOURNAL
MoEj<br />
18<br />
16<br />
14<br />
12<br />
10<br />
8<br />
6<br />
4<br />
2<br />
y = 0.8895x + 1.5489<br />
R 2 = 0.6837<br />
0<br />
1 2 3 4 5 6 7 8 9 10 11 12<br />
Machine grade MoEp min cut offs<br />
MoRj<br />
90<br />
80<br />
70<br />
60<br />
50<br />
40<br />
30<br />
20<br />
10<br />
y = 5.2791x - 2.5876<br />
R 2 = 0.524<br />
0<br />
1 2 3 4 5 6 7 8 9 10 11 12<br />
Machine grade MoEp min cut offs<br />
Figure 1: 90x45 Old crop MoE Pmin vs MoE j<br />
Figure 2: 90x45 Old crop MoE Pmin vs MoR j<br />
Biased Testing Biased Testing<br />
MoEj<br />
18<br />
16<br />
14<br />
12<br />
10<br />
8<br />
6<br />
4<br />
2<br />
y = 0.9895x + 2.5087<br />
R 2 = 0.4787<br />
0<br />
1 2 3 4 5 6 7 8 9 10 11 12<br />
Machine grade MoEp min cut offs<br />
MoRj<br />
90<br />
80<br />
70<br />
60<br />
50<br />
40<br />
30<br />
20<br />
10<br />
y = 4.0039x + 10.801<br />
R 2 = 0.1503<br />
0<br />
1 2 3 4 5 6 7 8 9 10 11 12<br />
Machine grade MoEp min cut offs<br />
Figure 3: 90x45 New Crop MoE Pmin vs MoE j Figure 4: 90x45 New Crop MoE Pmin vs MoR j<br />
Random Testing Random Testing<br />
Comparing Figures 1 & 2 with 3 & 4 shows:<br />
• Stronger relationships exist between MoE Pmin with MoE j and MoR j in the biased test method compared to<br />
the random location test method.<br />
• In this case for the biased test method, 68% and 52% of the variation in MoE j and MoR j respectively can be<br />
accounted for by changes in MoE Pmin .<br />
• With the random location test method, only 47% and 15% of the variation in MoE j and MoR j respectively<br />
can be accounted for by changes in MoE Pmin .<br />
Presently a machine grading operation relies on reliable relationships between MoE Pmin and the other strength<br />
properties to predict the MoE j and MoR j strength properties. The type of relationships shown in Figure 4, will<br />
produce, at best, questionable predictions of the MoE j and MoR j strength properties.<br />
It is suggested that the use MoE P average , instead of the present MoE Pmin , could be used as a means of improving<br />
the accuracy of these relationships, particularly for prediction of MoE j . Figures 5 & 6 show the same data as in<br />
Figures 3 & 4 but with MoE Pmin replaced by MoE Paverage . It can be noted the regression coefficient rising from<br />
0.47 to 0.67 and 0.15 to 0.20 in the relationship with MoE j and MoR j respectively. The prediction of stiffness<br />
is improved but the prediction of strength still remains questionable. Methods to improve the prediction of<br />
strength are discussed later. Appendix A shows these relationships for both 150x50 and 250x50 sizes. Again<br />
MoE Paverage is better stiffness predictor. In the 150x05 size, MoE Paverage predicts strength slightly better but not<br />
so in the 250x50 size.<br />
ISSUE 1 VOLUME 8 11 NZ <strong>TIMBER</strong> <strong>DESIGN</strong> JOURNAL
MoEj<br />
18<br />
16<br />
14<br />
12<br />
10<br />
8<br />
6<br />
4<br />
2<br />
y = 1.0417x + 0.4241<br />
R 2 = 0.6722<br />
0<br />
1 2 3 4 5 6 7 8 9 10 11 12<br />
Machine grade MoEp average cut offs<br />
MoRj<br />
90<br />
80<br />
70<br />
60<br />
50<br />
40<br />
30<br />
20<br />
10<br />
y = 4.0565x + 3.3958<br />
R 2 = 0.1955<br />
0<br />
1 2 3 4 5 6 7 8 9 10 11 12<br />
Machine grade MoEp average cut offs<br />
Figure 5: MoE Paverage vs MoE j<br />
Figure 6: MoE Paverage vs MoR j<br />
Random Testing Random Testing<br />
The reason proposed for the improvement in the prediction of MoE j using MoE Paverage is explained as: The<br />
random test method produces data that is considered more representative of the actual timber properties ie..<br />
more like an average value of the actual timber properties. Thus comparing these ‘average’ test values with the<br />
average MoE P values must improve the relationship ie.. comparing like with like. Whereas MoE Pmin is a<br />
minimum value and will not relate well the average timber stiffness.<br />
The poor relationship that exists between MoE Paverage and MoR j , which continues to seriously compromise the<br />
ability of a machine stress grade to predict strength from MoE P .<br />
It is accepted however that with adjustments to the machine grader (MoEp) cut off settings it is still possible to<br />
sort timber into grades of timber in which all the strength properties are achieved. However this is hopelessly<br />
inefficient as raising the cut off limits using the type of regressions in Figures 4 or 5 relegates a lot of<br />
acceptable timber to the reject pile. Table 1 shows this effect on our 19 year old timber sample when sorted by<br />
MoE Pmin to align the strength properties with the requirements of the grades F4, F5 & F8.<br />
In Table 1 the first band of data relates to a computer sort done using MoE Pmin that results in only the grade<br />
stiffness properties being achieved. Whereas the second band of data has similarly been sorted to ensure that<br />
all the strength properties are achieved. The net result of the two sorting methods is a dramatic reduction in the<br />
grade recoveries, as seen in the percentage recovery column. This is a direct result of the poor MoE Pmin to<br />
strength relationships. A machine grader can only measure stiffness as a plank and relies on robust strength<br />
relationships thus trying increase the strength properties by adjustment of the MoE P cut off limits must be<br />
hopelessly inefficient.<br />
MoE Pmin<br />
low cut off<br />
MPa<br />
MoE Pmin<br />
high cut off<br />
MPa<br />
MoE j<br />
Bending<br />
strength<br />
MPa<br />
Comp<br />
strength<br />
MPa<br />
Tension<br />
strength<br />
MPa<br />
Percentage<br />
Recovery<br />
%<br />
Number<br />
of pieces<br />
GPa<br />
Only the ‘F’ grade stiffness requirements achieved<br />
reject 9% 21<br />
F4 3.0 4.0 6.2 10.5 17.0 4.5 53% 126<br />
F5 4.0 5.7 7.7 13.8 20.7 7.7 38% 89<br />
F8 5.7 10 9.2 18.0 18.1 9.2 15% 43<br />
All the ‘F’ grade stiffness and strength requirements achieved<br />
reject 53% 147<br />
F4 4.7 5.7 7.6 12.7 20.8 7.7 27% 76<br />
F5 5.7 8.2 8.9 20.1 20.2 9.8 19% 54<br />
F8 8.2 10 1% 2<br />
Table 1 Characteristic stresses<br />
ISSUE 1 VOLUME 8 12 NZ <strong>TIMBER</strong> <strong>DESIGN</strong> JOURNAL
If the data presented thus far can be considered as the lower bound (but still fairly common) of New Zealand's<br />
current crop of radiata pine. Then relying on the abilities of the present stiffness only based machine stress<br />
graders to reliably predict strength has its problems. The next section of this paper explores two commonly<br />
promoted solutions.<br />
PROOF LOADING AS AN OPTION FOR IMPROVING STRENGTH<br />
When assigning a strength to a sample of timber, the 5 th percentile strength value is commonly used with some<br />
adjustment for sample size and variation. Thus by definition, it is the lower strength pieces that are more<br />
critical to assignment of strength to batch of timber. Thus removing the lower strength values should have a<br />
significant positive effect on the assigned strength values. Recognising this, proof loading was developed as<br />
means of culling out these few low strength pieces.<br />
Proof loading can either br done in tension or bending, the timber is simply passed through the machine and if<br />
it strong enough it passes through unbroken, while the weaker pieces simply break and are thus culled out.<br />
A computer based study has been done using the 19 data already presented Figures 3, 4, 5 & 6 and in Table 1.<br />
The study simulated a proof load grading operation using three different bending proof load levels namely 10,<br />
12.5 and 15MPa. In applying these bending proof load criteria to the data we have assumed that those pieces<br />
with a tension stress equal to or less than half the bending proof stress would also be removed.<br />
Table 2 shows the effect of proof loading on the characteristics strength and stiffness properties in four bands:<br />
1. No bending proof loading<br />
2. Bending to 10MPa & Tension 5MPa<br />
3. Bending to 12.5MPa & Tension 6.25MPa<br />
4. Bending to 15MPa & Tension 7.5MPa<br />
In this case however we have sorted the timber using better predictor ie.. MoE Paverage .<br />
MoEp<br />
average<br />
low cut<br />
off<br />
MPa<br />
MoEp<br />
average<br />
high cut<br />
off<br />
MPa<br />
MoE j<br />
Bending<br />
strength<br />
Comp<br />
strength<br />
Tension<br />
strength<br />
Grade<br />
Percentage<br />
Recovery<br />
GPa MPa MPa MPa %<br />
All in Data (no pieces removed from sample)<br />
Number<br />
of pieces<br />
in grade<br />
Reject 0 4.4 3% 9<br />
Grade 1 4.4 6.6 6.2 10.3 17.1 7.3 56% 155<br />
Grade 2 6.6 7.6 7.7 13.8 20.5 5.7 18% 50<br />
Grade 3 7.6 20 9.1 16.6 17.5 8.6 23% 65<br />
All data but with pieces with MoR j
With reference to Table 2 the effect of the different proof loading regimes on the characteristic strength<br />
properties are:<br />
• Generally no change in bending stiffness (MoE j )<br />
• A consistent improvement in the bending strengths particularly in grade 1, with smaller improvements in<br />
other higher grades.<br />
• An improvement in tension strength for all the grades, with smaller improvements in other higher grades.<br />
• No change in the compression strength.<br />
• The percentage of pieces removed is generally greatest in grade 1 but there are significant numbers of<br />
pieces being removed from grade 2 with lesser numbers in grade 3.<br />
For this sample several interesting features become apparent. Firstly proof loading removes low strength<br />
pieces in all three MoE Paverage sorted grades. This reflects in the characteristic stresses. This effect means that<br />
pieces with a high MoE Paverage can have low tension and bending strengths. The reverse is also true for those<br />
low MoE Paverage . Figure 6 graphically shows this effect for bending strength.<br />
For the data used in this example, increasing the levels of proof loading results in grade 2 having a lower<br />
bending and tension strengths than grade 1 but with a higher stiffness. This is a departure for the norm of<br />
higher grades having both higher stiffness and strength. Or could this imply that for this sample at least, that<br />
the two or three lower grades having the same characteristics strengths but different characteristics stiffnesses<br />
assigned to them.<br />
Either way it would that proof loading will remove the lower strength pieces and does have a positive effect on<br />
strength. But when combined with machine stress grading cannot produce higher stiffness grades with<br />
corresponding higher strength when applied to timber with the variation shown in Figure 6.<br />
USING A VISUAL OVERRIDE AS MEANS OF IMPROVING <strong>THE</strong> SELECTION FOR STRENGTH<br />
This option is one that combines the abilities of machine stress grading to sort for stiffness with visual grading<br />
to sort for strength. A machine grader is good at sorting for stiffness and poor at sorting for strength whereas<br />
visual is usually good at sorting for strength and poor at sorting for stiffness.<br />
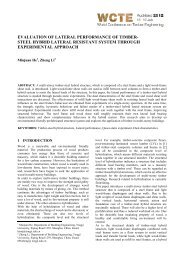
It is however important to look at the relationship between knot are ratio (KAR) and the two critical strengths<br />
ie.. bending and tension. Figures 7 and 8 graphically show these relationships. KAR being defined as the<br />
cross sectional area of the knot over the total timber cross section expressed as a percentage. Figure 9 shows<br />
the MKAR which is defined as average margin knot area ratio with the margins being the two outer quarters of<br />
the joist section. Figure 10 shows the lack of any significant relationship between KAR and MoE Paverage<br />
From the these Figures we note the following:<br />
1. There is a considerable range in strength for those pieces free of any knots.<br />
2. There a general trend with increasing knot size leading to lower strength. However, particularly in the case<br />
of bending strength there is no significant relationship.<br />
3. It is possible to have large knots giving reasonable strength and small knots giving low strength.<br />
4. For virtually any given MoE Paverage it is possible to have a range in KAR from 0% to 80%.<br />
ISSUE 1 VOLUME 8 14 NZ <strong>TIMBER</strong> <strong>DESIGN</strong> JOURNAL
MoRj, MPa<br />
90<br />
80<br />
70<br />
60<br />
50<br />
40<br />
30<br />
20<br />
10<br />
0<br />
y = -0.4831x + 54.475<br />
R 2 = 0.389<br />
0 20 40 60 80 100<br />
Knot Area Ratio (KAR), % at Bending<br />
Failure Point<br />
Figure 7: KAR vs Bending strength<br />
Maximum Tension stress, MPa<br />
70<br />
60<br />
50<br />
40<br />
30<br />
20<br />
10<br />
y = -0.2218x + 23.384<br />
R 2 = 0.3391<br />
0<br />
0 20 40 60 80 100<br />
Knot Area Ratio(KAR), % at Tension<br />
Failure Point<br />
Figure 8: KAR vs Tension strength<br />
MoRj, MPa<br />
90<br />
80<br />
70<br />
60<br />
50<br />
40<br />
30<br />
20<br />
10<br />
0<br />
y = -0.004x + 32.201<br />
R 2 = 5E-05<br />
0 20 40 60 80 100<br />
Average Margin Knot Area ratio<br />
(MKAR), % at Failure Point<br />
MoEPaverage, GPa<br />
12.00<br />
10.00<br />
8.00<br />
6.00<br />
4.00<br />
y = 0.0008x + 6.4705<br />
2.00<br />
R 2 = 0.0001<br />
0.00<br />
0 20 40 60 80 100<br />
Failure Knot Area ratio, %<br />
Figure 9: MKAR vs Bending strength<br />
Figure 10: KAR vs MoE Paverage<br />
In summary the data presented in Figures 7, 8, 9 & 10 indicates using KAR as an override after machine<br />
grading will be very inefficient in ensuring that the strength properties can be achieved for a particular grade.<br />
CONCLUSIONS<br />
1. MoE Paverage is a better predictor of MoE j than MoE Pmin . It is recommended that MoE Paverage be used as a<br />
basis of assigning machine stress grades.<br />
2. With the adoption of AS/NZ4063 and New Zealand's current variable resource neither MoE Pmin nor<br />
MoE Paverage predict strength with any level of confidence. As it is these relationship that a machine grader<br />
relies on, the ability of these machines to reliably predict strength must be questioned. While it is<br />
theoretically still possible to use these relationships to meet a grade strength requirement, this is at the<br />
expense of significant grade recovery reductions. Ie.. this approach relegates a lot of good timber to the<br />
reject pile.<br />
3. Proof loading is effective at improving the assigned strength properties by removing those few strength<br />
controlling low strength pieces.<br />
4. The positive effects of proof loading are not just reflected in the lower stiffness grades but in all stiffness<br />
grades. This effect reflects the variable nature of New Zealand's current resource. It means it is possible to<br />
have high stiffness/low strength pieces and low stiffness/high strength pieces.<br />
5. For the sample tested, the implication is that proof testing should not only be used on the lower grades but<br />
on all grades.<br />
6. A set of structural grades with similar strengths but different stiffnesses could be a potential solution.<br />
7. The relationship with KAR and strength shows it is possible to have large knots giving high strength and<br />
small knots (and clear timber) giving low strength.<br />
ISSUE 1 VOLUME 8 15 NZ <strong>TIMBER</strong> <strong>DESIGN</strong> JOURNAL
8. A visual override in conjunction with machine stress grading appears not to be an effective means of<br />
grading for both stiffness and strength.<br />
9. There are other grading machines and methods that could potentially provide better sorting ie.. scanning/Xray's<br />
and grading on edge etc, but these have not been discussed in this paper.<br />
REFERENCES<br />
1. AS/NZS AS 4063:1992, Timber - Stress graded - In-grade strength and stiffness evaluation,<br />
Standards Australia/Standards New Zealand.<br />
2. Bier, H., 1986: The effect of defect position on the strength of beams. New Zealand Journal of<br />
Timber Construction, 2(4), pp 12-14.<br />
3. Bier H., 1994, Derivation of Timber Design Stresses in New Zealand: Proceedings of the Pacific<br />
Timber Engineering Conference Auckland, Vol 3, pp760-767<br />
4. Bolden S, Leicester R H, Young, F, and Seath, C, 1994; In-grade evaluation of Australia pine.<br />
Proceedings of the Pacific Timber Engineering Conference, Gold Coast, Australia, Vol. 2, pp716-724<br />
5. Boughton, G, 1994; Superior sorting of timber using localised stiffness on edge. Proceedings of the<br />
Pacific Timber Engineering Conference, Gold Coast, Australia, Vol. 2, pp510-515<br />
6. Bier H., Derivation of Timber Design Stresses in New Zealand: PTEC 1984 Volume 3.<br />
7. Leichti R, and Cheung K, 1994; Effects of testing configuration on lumber test results. Proc. of the<br />
Pacific Timber Engineering Conference, Australia, Vol. 2, pp709-715<br />
8. NSW Forestry Commission, 1974; Information for the mechanical grading of common softwood<br />
sizes to discriminate F11, F8, F5 and F4 grades. Wood Tech. Division.<br />
9. NZS 3631:1988. New Zealand timber grading rules, Standards Association of New Zealand.<br />
10. Samson M., Blanchet L., 1981: Grading machine ability to detect knots in lumber members.<br />
Proceedings of the 1991 International Timber Engineering Conference, London, Vol. 2, pp 174-180.<br />
11. Walford G B, 1989; Reliable glulam through proof testing and LVL. Proc. of the Second Pacific<br />
Timber Engineering Conference, Auckland University, New Zealand<br />
12. Walford G. B., 1994; Evaluation of the bending and tension properties of NZ-grown, machine graded<br />
radiata pine. NZFRI Project Record 4217.<br />
ISSUE 1 VOLUME 8 16 NZ <strong>TIMBER</strong> <strong>DESIGN</strong> JOURNAL
APPENDIX A<br />
MoEj<br />
20<br />
18<br />
16<br />
14<br />
12<br />
10<br />
8<br />
6<br />
4<br />
2<br />
y = 0.9492x + 3.0755<br />
R 2 = 0.45<br />
0<br />
1 2 3 4 5 6 7 8 9 10 11 12 13 14<br />
Machine grade MoEp min cut offs<br />
MoEj<br />
20<br />
18<br />
16<br />
14<br />
12<br />
10<br />
8<br />
6<br />
4<br />
2<br />
0<br />
y = 1.1166x - 0.426<br />
R 2 = 0.7817<br />
1 2 3 4 5 6 7 8 9 10 11 12 13 14<br />
Machine grade MoEp average cut offs<br />
Figure A1: 150x50 MoE pmin vs MoE j<br />
Figure A2: 150x50 MoE P average vs MoE j<br />
Random Testing Random Testing<br />
MoRj<br />
90<br />
80<br />
70<br />
60<br />
50<br />
40<br />
30<br />
20<br />
10<br />
y = 4.3585x + 6.8926<br />
R 2 = 0.2268<br />
0<br />
1 2 3 4 5 6 7 8 9 10 11 12 13 14<br />
Machine grade MoEp min cut offs<br />
MoRj<br />
90<br />
80<br />
70<br />
60<br />
50<br />
40<br />
30<br />
20<br />
10<br />
y = 4.9568x - 7.8443<br />
R 2 = 0.3653<br />
0<br />
1 2 3 4 5 6 7 8 9 10 11 12 13 14<br />
Machine grade MoEp average cut offs<br />
Figure A3: 150x50 MoEpmin vs MoRj<br />
Figure A4: 150x50 MoE P average vs MoRj<br />
Random Testing Random Testing<br />
MoEj<br />
20<br />
18<br />
16<br />
14<br />
12<br />
10<br />
8<br />
6<br />
4<br />
2<br />
y = 1.1009x + 1.9242<br />
R 2 = 0.7348<br />
0<br />
1 2 3 4 5 6 7 8 9 10 11 12 13 14<br />
Machine grade MoEp min cut offs<br />
MoEj<br />
20<br />
18<br />
16<br />
14<br />
12<br />
10<br />
8<br />
6<br />
4<br />
2<br />
0<br />
y = 0.9747x + 0.6412<br />
R 2 = 0.8147<br />
1 2 3 4 5 6 7 8 9 10111213141516<br />
Machine grade MoEp average cut offs<br />
Figure A5: 250x50 MoE Pmin vs MoE j<br />
Figure A6: 250x50 MoE Paverage vs MoE j<br />
Random Testing Random Testing<br />
ISSUE 1 VOLUME 8 17 NZ <strong>TIMBER</strong> <strong>DESIGN</strong> JOURNAL
MoRj<br />
90<br />
80<br />
70<br />
60<br />
50<br />
40<br />
30<br />
20<br />
10<br />
0<br />
y = 5.4959x - 5.0536<br />
R 2 = 0.4013<br />
1 2 3 4 5 6 7 8 9 10 11 12 13 14<br />
Machine grade MoEp min cut offs<br />
MoRj<br />
90<br />
80<br />
70<br />
60<br />
50<br />
40<br />
30<br />
20<br />
10<br />
0<br />
y = 4.5285x - 8.7163<br />
R 2 = 0.3854<br />
1 2 3 4 5 6 7 8 9 10111213141516<br />
Machine grade MoEp average cut offs<br />
Figure A7: 250x50 MoE Pmin vs MoR j<br />
Figure A8: 250x50 MoE Paverage vs MoR j<br />
Random Testing Random Testing<br />
ISSUE 1 VOLUME 8 18 NZ <strong>TIMBER</strong> <strong>DESIGN</strong> JOURNAL