00694 Pouyan Zarnani - Timber Design Society
00694 Pouyan Zarnani - Timber Design Society
00694 Pouyan Zarnani - Timber Design Society

You also want an ePaper? Increase the reach of your titles
YUMPU automatically turns print PDFs into web optimized ePapers that Google loves.
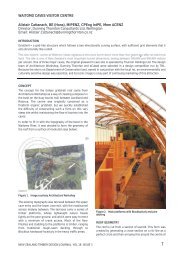
PREDICTVE ANALYTICAL MODEL FOR WOOD CAPACITY OF<br />
RIVET CONNECTIONS IN GLULAM AND LVL<br />
<strong>Pouyan</strong> <strong>Zarnani</strong> 1 and Pierre Quenneville 2<br />
ABSTRACT: <strong>Timber</strong> rivets are hardened nails with a rectangular cross section for making connections with high load<br />
transfer capacity, high stiffness and more ductility. Rivets are a cost effective alternative to large fasteners such as bolts<br />
which cause large localized stresses and force brittle ruptures in the timber. Rivets are part of the Canadian and U.S.<br />
structural wood design standards. However, in the current standards there is no closed form solution for the wood<br />
strength prediction. Also, the standards restrict the use of rivets to specific configurations and for glulam and sawn<br />
timber of some limited species. A simple close-form analytical method to determine the resistance of wood in rivet<br />
connection in timber products is proposed. For the wood strength, the stiffness and strength of the planes subjected to<br />
shear and tension stresses are taken into account. An algorithm is presented which allows the designer to predict the<br />
different possible brittle, ductile and mixed failure modes. Results of tests on New Zealand Radiata Pine LVL and<br />
glulam and data available from literature confirm the validity of this new method and show that the proposed analytical<br />
method can be used as design provision for timber riveted connections.<br />
KEYWORDS: <strong>Timber</strong> rivet, connection, wood capacity, failure mode, LVL, glulam<br />
1 INTRODUCTION<br />
1.1 GENERAL 123<br />
The timber rivet connections have been used in Canada<br />
and U.S. in different types of structures over the last 3<br />
decades such as in connections of a glulam arch<br />
spanning 100 meters. Rivets are a cost effective<br />
alternative to large fasteners such as bolts which cause<br />
large localized stresses and force brittle ruptures in the<br />
timber. Also, rivets have lower variability in strength<br />
and deflection properties than most other conventional<br />
connectors and have more ductile behaviour under<br />
dynamic loads.<br />
For riveted connections, there are two major mechanisms<br />
of failure; the brittle tear-out of a plug of wood defined<br />
by the rivet’s perimeter and the ductile yielding of rivets<br />
with localized wood crushing [1]. The brittle failure<br />
mode should be avoided since it induces the brittle<br />
downfall of the whole structure and the ability to predict<br />
it is important. In addition, a mixed failure mode is also<br />
possible and is investigated in this study. An algorithm is<br />
presented for the prediction of connection strength in this<br />
failure mode.<br />
The objective of this study is to develop a set of design<br />
equations to predict the strength and failure mode of the<br />
riveted connections of different configurations in diverse<br />
species loaded parallel-to-grain.<br />
1 <strong>Pouyan</strong> <strong>Zarnani</strong>, University of Auckland, Department of Civil<br />
and Environmental Engineering, 20 Symonds St., Auckland,<br />
New Zealand. Email: pzar004@aucklanduni.ac.nz<br />
2 Pierre Quenneville, University of Auckland, Department of<br />
Civil and Environmental Eng., 20 Symonds St., Auckland,<br />
New Zealand. Email: p.quenneville@auckland.ac.nz<br />
1.2 BACKGROUND<br />
The most significant work on timber rivets is that of<br />
Foschi and Longworth [2] which became the basis for<br />
the timber rivet design procedures in the Canadian O86-<br />
09 [3] and the U.S. NDS [4] codes. The authors<br />
proposed a prediction model (Eq. 1) based on finite<br />
element analysis for wood strength, P w , loaded parallelto-grain<br />
in brittle failure which involves the tensile, P t ,<br />
and shear, P v , capacities of the failure areas of wood.<br />
The authors provided tables of values for the numerically<br />
derived factors K, β, α and γ which are related to the<br />
connection geometry parameters.<br />
ft,<br />
k At<br />
Pt<br />
<br />
Kttt<br />
h<br />
P w = min (1)<br />
fv,<br />
k Av<br />
Pv<br />
<br />
K <br />
s<br />
s<br />
h<br />
In Eurocode 5 [5], Annex A, the wood resistance of<br />
dowel-type timber connections in plug shear failure is<br />
determined using Equation 2. The European equation is<br />
based on the maximum of the tensile resistance of the<br />
end face or the sum of the shear resistances of the side<br />
and bottom faces correspondent to the effective wood<br />
depth, t ef , which depends on the governing failure mode.<br />
1.5A<br />
t,<br />
ef ft,<br />
k<br />
P w = max (2)<br />
0.7 f<br />
A v,<br />
ef v,<br />
k<br />
Stahl et al. [6] presented a simplified analysis for wood<br />
strength. They assumed that the tensile and the shear<br />
capacities are additive. Their proposed equation (Eq. 3)<br />
is based on three possible wood failure modes shown in<br />
Figure 1. Their proposed model for wood strength in
ittle failure mode had better predictions in comparison<br />
to the ones from the Canadian code.<br />
P w = min (P a , P b , P c ), P i = 0.2 f t,k + 0.2 f v,k (3)<br />
(a) (b) (c)<br />
Figure 1: Proposed wood failure modes by Stahl (2004)<br />
1.3 MOTIVATION<br />
In the models which have been proposed for the wood<br />
strength so far, the minimum, maximum or the<br />
summation of the tensile and shear capacities of the<br />
failed wood block resisting planes is considered as the<br />
wood strength of the connection. These methods might<br />
not be appropriate since the stiffness in tensile and shear<br />
planes differs and this results in uneven load distribution<br />
amongst the resisting planes [1,7]. For instance, in a plug<br />
shear failure (Fig. 1a), the contribution of the bottom or<br />
lateral shear planes to the wood resistance cannot simply<br />
be considered as a function of their respective area as the<br />
connection load is not shared uniformly among the<br />
resisting planes due to the unequal stiffness of the<br />
adjacent wood. In the proposed analysis, the<br />
shortcomings of the existing predictive models are taken<br />
into account.<br />
2 NEW ANALYSIS FOR WOOD<br />
STRENGTH<br />
The proposed analysis for wood strength is based on a<br />
linear elastic spring system in which the applied load<br />
transfers from the main loaded wood block to the contact<br />
planes in conformity with the relative stiffness ratio of<br />
each resisting plane (Fig. 2). By predicting these<br />
stiffnesses, the contribution of each plane to lateral<br />
resistance and finally the ultimate load that cause brittle<br />
failure on these planes can be derived.<br />
Head<br />
tensile plane - h<br />
Bottom<br />
shear plane - b<br />
Lateral<br />
shear planes - l<br />
Figure 2: Proposed elastic spring model<br />
The difference in the stiffness of the tensile and shear<br />
planes is a function of the differences between the<br />
modulus of elasticity and modulus of rigidity, the wood<br />
surrounding the loaded block (bottom, end and edge<br />
distances-d z , d a and d e ) and also the connection<br />
geometry.<br />
2.1 HEAD TENSILE PLANE STIFFNESS<br />
In the rivet connection, the load is transferred from the<br />
plate to the wood block through the rivets. The load<br />
which applied to the wood increases as it reaches the<br />
head of the joint (Fig. 3). The load distribution in the<br />
row of rivets is assumed to be linear. Johnsson and Stehn<br />
P w<br />
K h<br />
K b<br />
P w<br />
Main loaded<br />
block<br />
K l<br />
P h P b P l<br />
Δ<br />
[7], using a load distribution model based on a spring<br />
system, showed that the maximum variation from the<br />
linear assumption, on the distributed loads among<br />
fasteners in a nail connection with 10 nails in a row<br />
before yielding was approximately 12%. The head<br />
tensile plane stiffness can then be derived by considering<br />
the tensile deformation of the loaded block, Δ, which is<br />
given by<br />
L<br />
<br />
EA ( N<br />
(4)<br />
where E is the modulus of elasticity, L is the length<br />
subjected to the tensile stress and A th the area subjected<br />
to the tensile stress at the head of the block. Thus, the<br />
average tensile stiffness for the head plane would be<br />
K<br />
h<br />
th<br />
2EA<br />
<br />
L<br />
th<br />
C<br />
(5)<br />
These equations use the connection geometry variables<br />
shown in Figure 4 and all dimensions are in mm.<br />
Figure 3: Simplified analytical model<br />
2.2 BOTTOM SHEAR PLANE STIFFNESS<br />
By developing an FE model, Foschi and Longworth [2]<br />
studied the effect of the bottom distance d z on the bottom<br />
plane shear stress. They observed that the shear stresses<br />
vary when d z is less than 2 times the rivet penetration, L p .<br />
They considered L p as the thickness of the failed block,<br />
t ef . This observation is applied when considering the<br />
effective depth of the wood bottom block in contact with<br />
the main loaded block in order to simplify the model<br />
(Fig. 3) to estimate the distortion of the bottom block<br />
which is considered fixed at the bottom edge and is<br />
subjected to shear stress on the top surface. Dividing the<br />
sum of the bottom shear forces P b by the total area over<br />
which they act A sb defines the average shear stress τ sb :<br />
<br />
Fixed<br />
edge<br />
sb<br />
Pb<br />
<br />
A<br />
sb<br />
in which G is the modulus of rigidity, γ sb the shear strain<br />
and X b the maximum effective depth of the bottom block<br />
defined as X b =2t ef . Thus, the average pure shear stiffness<br />
would be K GA X .<br />
sb<br />
1)<br />
Nc<br />
1<br />
Ph<br />
i<br />
<br />
i1<br />
NC<br />
<br />
<br />
sbG<br />
G<br />
X<br />
sb<br />
b<br />
b<br />
Ph<br />
L<br />
<br />
2EA<br />
da<br />
P l<br />
P<br />
Main loaded<br />
L<br />
t<br />
P h block<br />
ef<br />
P b<br />
P b<br />
X b=2t ef<br />
d z ≥ X b<br />
In contact<br />
bottom block<br />
Tensile force<br />
distribution<br />
L<br />
da<br />
However, as it is shown in Figure 3, the bottom block<br />
has a fixed edge at its head on its entire cross section<br />
which increases the stiffness and prevents deformation<br />
under the applied shear force.<br />
th<br />
X b<br />
Bottom block<br />
Fixed edge<br />
Shear force<br />
distribution<br />
(6)
the lateral blocks and is Atl<br />
2tef<br />
Xl<br />
. Consequently, the<br />
average lateral shear planes stiffness can be defined by<br />
Kl<br />
( 1<br />
F)(<br />
Ksl<br />
Ktl)<br />
(11)<br />
in which F is the reduction factor for lateral shear planes<br />
stiffness [1]. The reduction factor for the lateral shear<br />
plane, F, is determined using:<br />
F=0 , If d e ≥ 1.25X l<br />
F=0.16 (2.5- d e / (X l /2)) 2 , If d e < 1.25X l<br />
(12)<br />
Figure 4: Definition of connection geometry variables<br />
If Δ is the whole deformation of the bottom block at the<br />
top, then it decreases rapidly in a nonlinear form as it<br />
reaches the bottom. Adjacent to the bottom fixed edge,<br />
the deflection curve would be tangential as the stress<br />
diminishes and approaches zero. It is assumed that the<br />
deformed shape is a polynomial curve with order nine<br />
(n=9). Therefore, the average deflection for the whole<br />
cross section can be theoretically considered as Δ/(n+1)<br />
equal to Δ/10 in case of tensile deformation. Thus, the<br />
additional average tensile stiffness for the whole cross<br />
section, K tb , can be estimated as<br />
K<br />
tb<br />
(7)<br />
where A tb is the effective tensile area of the bottom block<br />
given as A tb =S q X b (N R -1). Therefore, the average bottom<br />
shear plane stiffness can be defined by<br />
K<br />
b<br />
(8)<br />
Foschi and Longworth [2] observed that when the<br />
bottom distance d z becomes less than X b ,the bottom shear<br />
stress decreases and the load thus released is transferred<br />
almost in its entirety to the tensile plane. To take this<br />
effect into account, a factor H is proposed [1]. This<br />
factor can be considered as the reduction rate of the<br />
bottom shear plane stiffness, H (Eq. 9), as a result of<br />
decreasing the bottom distance d z less than X b .<br />
H=0 , If d z ≥ X b<br />
H=0.25 (2- d z / t ef ) 2 , If d z < X b<br />
Thus,<br />
EAtb<br />
<br />
10L<br />
K<br />
sb<br />
K<br />
2.3 LATERAL SHEAR PLANES STIFFNESS<br />
(10)<br />
Assuming that the mechanical properties of the wood for<br />
lateral and bottom shear planes are the same, the<br />
correspondent equations for the two side lateral shear<br />
planes can be developed similarly. The average pure<br />
shear stiffness for the lateral planes would become<br />
Ksl<br />
AslG<br />
X<br />
l<br />
where A sl is the summation of the areas<br />
subjected to the lateral shear stress and X l the maximum<br />
effective edge distance (equal to 2 times the half of the<br />
distance between the first and the last rows, which is<br />
comparable to X b =2t ef for the bottom shear plane). The<br />
additional average tensile stiffness can be given as<br />
K EA L in which A tl is the effective tensile area of<br />
tl tl<br />
10<br />
tb<br />
Kb<br />
( 1<br />
H)(<br />
Ksb<br />
Ktb)<br />
(9)<br />
2.4 CLOSED-FORM APPROACH<br />
By predicting the stiffness of the wood surrounding each<br />
of the failure planes (K h , K b and K l ), one can predict the<br />
proportion of the total connection load applied to each<br />
plane, R K K<br />
<br />
i i<br />
.<br />
By further establishing the resistance of each of the<br />
failure planes as a function of a strength criterion, one<br />
can verify which of the failure planes governs the<br />
resistance of the entire connection. Thus, the wood load<br />
carrying capacity of the connection (Eq. 13) is the load<br />
which results in the earlier failure of one of the resisting<br />
planes due to being overloaded and equals to the<br />
minimum of P wh , P wb and P wl . In other words, the wood<br />
strength of the connection is the total capacity of the one<br />
plane which fails first plus a portion of strength capacity<br />
of the other planes. Moreover, while one plane fails then<br />
the load transfers to the rest of the planes in accordance<br />
with their relative stiffness ratios. It could be possible<br />
that the occurrence of the first failure of one plane does<br />
not correspond with the maximum load of the<br />
connection.<br />
Kb<br />
Kl<br />
Pwh<br />
ft,<br />
m Ath<br />
(1 )<br />
K h K h<br />
Kh<br />
Kl<br />
P w = N p .min Pwb<br />
fv,<br />
mCab<br />
Asb<br />
(1 ) (13)<br />
Kb<br />
Kb<br />
Cal<br />
Asl<br />
Kb<br />
Pwl<br />
Pwb<br />
C A K<br />
ab<br />
sb<br />
Here f t,m is the wood mean strength in tension parallel to<br />
the grain (MPa) and f v,m is the wood mean strength in<br />
shear along the grain (MPa). Also, C ab and C al are the<br />
ratios of the average to maximum stresses on the bottom<br />
and lateral shear planes respectively given by Equations<br />
14 and 15. These coefficients are derived based on the<br />
increasing load distribution on the shear planes (Fig. 3).<br />
The factor of k e is applied to C al to account for the<br />
reduction of the resisting area due to the cracks<br />
formation on the lateral planes, estimated at 20% of the<br />
failed block thickness while d e is less than 1.25X l .<br />
C<br />
ab<br />
S<br />
p(<br />
N<br />
<br />
C k C<br />
al<br />
e<br />
ab<br />
C<br />
( N<br />
C<br />
C<br />
1)/<br />
2 1)<br />
d<br />
N ( L d )<br />
k e<br />
k e<br />
1<br />
0.8<br />
a<br />
(14)<br />
(15)<br />
For a connection having only one plate, N p =1, the<br />
member thickness value, b, to be used to determine<br />
d z = b/2-t ef is twice the thickness of the wood.<br />
l<br />
a<br />
, If d e 1.25X l<br />
, If d e
2.5 EFFECTIVE WOOD THICKNESS<br />
2.5.1 BRITTLE FAILURE<br />
In current tests on LVL and glulam, the average<br />
thickness of the failed block, t block , in the majority of the<br />
brittle failures was observed around 0.85L p . This<br />
thickness corresponds to the elastic deformation of the<br />
rivets since there were no observed plastic deflections.<br />
For brittle failure modes, the effective wood thickness<br />
(Eq. 16) is determined from the elastic deformation of<br />
the rivet modelled as a beam on an elasto-plastic<br />
foundation (Fig. 5). The rivet is supported by springs<br />
with bilinear response that simulate the local nonlinear<br />
embedding behaviour of the timber surrounding it. For<br />
more details regarding the model refer to <strong>Zarnani</strong> and<br />
Quenneville [8].<br />
Rivet<br />
flexural axis<br />
k h<br />
Embedding<br />
stiffness<br />
Figure 5: Spring model of elastic deformation of rivet as<br />
a beam on an elasto-plastic foundation<br />
0.95L p , for L p equals to 28.5 mm<br />
t ef,e ~ 0.85L p , for L p equals to 53.5 mm (16)<br />
0.75L p , for L p equals to 78.5 mm<br />
2.5.2 MIXED FAILURE<br />
Wood effective thickness<br />
w(x)<br />
For some connection groups, considerable decrease of<br />
t block combined to a distortion of rivets was visible. This<br />
failure mode is defined as the mixed mode since the<br />
wood fails with some deflection of the rivets before they<br />
reach complete yielding. In these groups, t block<br />
corresponded to the effective wood thickness, t ef ,<br />
depending on the governing failure mode of the rivets<br />
(Fig. 6).<br />
Mode I m Mode III m Mode IV<br />
Figure 6: Effective thickness based on the rivet<br />
embedded length in different failure modes<br />
x<br />
w<br />
Rotationally fixed<br />
Rivet head<br />
t ef can be derived using Equation 17 based on the<br />
Johansen’s yield theory [9] which is the foundation for<br />
the EYM prediction formulas in Eurocode 5 [5]. The<br />
proposed prediction for the wood strength showed good<br />
agreement with observed values of t block for these groups.<br />
t ef,y =<br />
f h<br />
L p<br />
t ef<br />
2<br />
L p<br />
f<br />
P r<br />
M<br />
f<br />
2<br />
y, l Lp<br />
d<br />
h,0<br />
l<br />
h,0<br />
y,<br />
l<br />
d<br />
l<br />
2<br />
f h<br />
M <br />
L p<br />
t ef<br />
P r<br />
M y<br />
o<br />
P<br />
f h<br />
M y<br />
Mode I m<br />
Mode III m<br />
Mode IV<br />
L p<br />
t ef<br />
P r<br />
(17)<br />
M y<br />
d l is the rivet cross-section dimension bearing on the<br />
wood parallel-to-grain, (equal to 3.2 mm); ƒ h,0 is the<br />
embedment strength of the wood which can be<br />
determined as a function of d l and the density of the<br />
wood [10]; and M y,l is the parallel-to-grain moment<br />
capacity of the rivet, equal to 30000 Nmm [6].<br />
2.6 PROPOSED PROCEDURE<br />
Based on the observation that the effective wood<br />
thickness differs in brittle and mixed failure modes<br />
which affect the wood strength, the following procedure<br />
(Fig. 7) is suggested to determine the load carrying<br />
capacity of the riveted connection for the possible brittle,<br />
ductile and mixed failure modes. In this paper, the rivet<br />
strength and its yielding mode is based on experimental<br />
results which also can be predicted by a consistent yield<br />
model proposed by <strong>Zarnani</strong> and Quenneville [10].<br />
Assume t block = t ef,e corresponding to rivet elastic<br />
deformation to predict wood strength P w<br />
from Eq. 13 and compare with rivet yielding strength P r<br />
If P w < P r<br />
No<br />
If P w ≥ P r<br />
No<br />
P u = P w<br />
(Mixed failure)<br />
Figure 7: Proposed algorithm for different possible brittle,<br />
ductile and mixed failure modes<br />
3 EXPERIMENTAL PROGRAM<br />
3.1 SPECIMENS<br />
Yes<br />
Assume t block =t ef,y corresponding to<br />
rivet yielding mode to predict P w<br />
Yes<br />
Load carrying capacity of<br />
connection P u = P w<br />
(Brittle failure)<br />
P u = P r<br />
(Ductile failure)<br />
The laboratory tests were set up to evaluate the effect of<br />
bottom, edge and end distances on connection strength<br />
and to force and observe the possible connection wood<br />
modes of failure. Specimens were manufactured from<br />
New Zealand Radiata Pine LVL grade 10 and glulam<br />
with grade of 8. The tests series were divided into 26<br />
groups for LVL (Table 1) and 6 groups for glulam<br />
(Table 2). 3 replicates were tested for each group of<br />
specimens for LVL and 4 replicates for glulam. The<br />
parameters for connection geometries (Fig. 4) used<br />
varied from 4 to 8 for N R and N C ; from 15 to 25 mm for<br />
S q and 25 to 50 mm for S p ; L p from 28.5 to 78.5 mm<br />
(with rivet lengths L r of 40, 65 and 90 mm); d z from<br />
0.1X b to 1.1X b ; d e from 0.2X l to 1.9X l and d a from 50 to<br />
125 mm. The specimens had riveted plates on both faces<br />
of timber, making a symmetric connection that better<br />
simulates real applications. The steel side plates were 8.4
Grain<br />
1200 mm<br />
Load F [kN]nt<br />
mm thick of 300 grade with predrilled 6.8 mm holes to<br />
ensure adequate fixity of the rivet head.<br />
In the majority of the groups, the characteristics were<br />
specified in order to prompt wood failure and maximize<br />
the amount of observations on the brittle mechanism.<br />
This is why many specimens have identical row spacing<br />
of 15 mm. After observing the test results, the groups<br />
were matched and named based on the modes of failure.<br />
In Table 1 and 2, BRG, MIG and DUG stand for tests<br />
series with brittle, mixed and ductile modes of failure<br />
respectively, also, L for LVL and G for glulam. All<br />
specimens were conditioned to 20°C and 65% relative<br />
humidity to attain a target 12% equilibrium moisture<br />
condition (EMC). At the time of the test the wood had an<br />
average density of 590 and 480 kg/m 3 with a coefficient<br />
of variation of 4% and 9% at an average moisture<br />
content of 11.5% and 11% for LVL and glulam<br />
respectively.<br />
3.2 TEST SETUP<br />
Testing procedures outlined in ISO 6891 [11] were<br />
followed. The load was applied to the specimens using<br />
an MTS loading system. The deformation of the<br />
connection was measured continously with a pair of<br />
symmetrically placed LVDTs. Data was recorded with a<br />
frequency of 2 Hz. The specimens were loaded in<br />
tension parallel-to-grain and were fabricated with riveted<br />
connection in one end and bolts on the other end. The<br />
bolted connection was sufficiently strong to allow failure<br />
of the tested riveted connections to be observed in all<br />
cases. Additional plates were added between the grip<br />
and the rivet plate with the total thikness of 25 mm to<br />
limit the plate deformation and also provide resistance<br />
for the out-of-plane moment of the rivet plate resulting<br />
from eccentricities at time of failure. The loading rate<br />
was adjusted to 1 mm/min and kept constant until the<br />
occurence of failure in both or either side of the riveted<br />
connections. A typical specimen in the testing frame in<br />
shown in Figure 8.<br />
4 RESULTS AND DISCUSSION<br />
4.1 GENERAL<br />
The load-slip curve of each group was plotted (Fig. 9)<br />
and the ultimate load and the type of failure were<br />
recorded. The peak loads ranged from 159 kN to 468 kN.<br />
The effect of failure modes on the load-displacement<br />
plots is shown in Figure 9. The displacements observed<br />
in ductile failures with complete yielding of the rivets<br />
are far beyond the usual range of serviceability, but they<br />
indicate that the connections would be suitable for use in<br />
seismic design if rivet yielding failure mode controls<br />
[12]. In case of brittle failures, the maximum connection<br />
deformation was 2 to 3 mm and the wood rupture<br />
occurred suddenly. For mixed mode failures in which<br />
wood failed before final yielding of the rivets, more<br />
deflection can be seen compared to brittle failures due to<br />
slight deflection on rivets. The highest deformation for<br />
the mixed failures belongs to specimen MIG23-L in<br />
which the rivet and wood strengths are very close.<br />
Results for the LVL and glulam groups tested are listed<br />
in Table 3 and 4 respectively. The thickness of the failed<br />
blocks and predominant modes of failure observed are<br />
also listed in the tables. Along with the results,<br />
connection capacities have been calculated using the<br />
proposed analysis.<br />
The wood tensile and shear strengths (f t,m , f v,m ) used in<br />
the analysis were determined from the conducted<br />
material property tests (Fig.10). The average tensile<br />
and shear strengths in these tests were 34.3 MPa<br />
(COV=12%) and 6.8 MPa (COV=10%) for RP-LVL and<br />
24.1 MPa (COV=24%) and 4.2 MPa (COV=15%) for<br />
RP-glulam (samples from inner laminations)<br />
respectively. For the stiffness properties, based on the<br />
codes an average ratio of modulus of rigidity to modulus<br />
of elasticity (G/E) is considered equal to 0.045 and 0.069<br />
for LVL and glulam respectively in order to make the<br />
planes’ stiffness equations independent of G and E<br />
values.<br />
500<br />
450<br />
Rivets,<br />
along<br />
grain<br />
400<br />
350<br />
300<br />
250<br />
200<br />
LVDTs<br />
8/M20<br />
bolts<br />
Grip<br />
plates<br />
150<br />
100<br />
Brittle failure Mode<br />
50<br />
Ductile failure Mode<br />
Mixed failure Mode<br />
0<br />
0 1 2 3 4 5 6<br />
Displacement U [mm]nt<br />
Figure 9: Load-slip plots for joint tensile tests loaded<br />
parallel to grain in brittle, mixed and ductile failure modes<br />
Figure 8: Typical specimen in testing apparatus
LVL<br />
groups<br />
No. of<br />
rows by<br />
columns<br />
Row<br />
spacing<br />
Table 1: Configuration for the tested connections on LVL<br />
Column<br />
spacing<br />
Rivet<br />
penetration<br />
Member<br />
thickness<br />
Member<br />
width<br />
End<br />
distance<br />
Bottom<br />
distance<br />
Edge<br />
distance<br />
(N R*N C)<br />
S p S q L p b W d a d z d e<br />
(mm) (mm) (mm) (mm) (mm) (mm) (mm) (mm)<br />
BRG1-L 25 15 28.5 90 220 75 17 58<br />
BRG2-L 25 15 28.5 126 220 75 35 58<br />
BRG3-L 25 15 28.5 180 220 75 62 58<br />
BRG4-L 25 15 28.5 126 300 75 35 98<br />
BRG5-L 25 15 28.5 126 370 75 35 133<br />
BRG6-L 8*8 25 15 28.5 126 220 100 35 58<br />
BRG7-L 25 15 28.5 126 220 125 35 58<br />
BRG8-L 25 15 53.5 126 220 50 10 58<br />
BRG9-L 25 15 53.5 126 220 50 10 58<br />
BRG10-L 25 15 53.5 180 220 50 37 58<br />
BRG11-L 25 15 53.5 216 220 50 55 58<br />
BRG12-L * 25 15 53.5 216 220 50 55 58<br />
BRG13-L 25 15 53.5 180 300 50 37 98<br />
BRG14-L 8*6 25 15 53.5 180 370 50 37 133<br />
BRG15-L 25 15 53.5 180 220 75 37 58<br />
BRG16-L 25 15 53.5 180 220 100 37 58<br />
BRG17-L<br />
50 15 53.5 126 220 75 10 88<br />
4*8<br />
BRG18-L 25 15 28.5 126 220 75 35 73<br />
BRG19-L 25 15 53.5 180 260 50 37 93<br />
MIG20-L 6*6 25 15 78.5 216 220 50 30 73<br />
MIG21-L 25 15 78.5 216 220 75 30 88<br />
MIG22-L 25 15 53.5 180 300 75 37 128<br />
MIG23-L 4*6 25 15 28.5 180 220 75 62 88<br />
DUG24-L<br />
DUG25-L<br />
8*6<br />
6*6<br />
25 25 28.5 126 260 125 35 43<br />
25 25 53.5 180 260 125 37 68<br />
DUG26-L<br />
25 25 78.5 216 260 125 30 93<br />
4*4<br />
*<br />
In all groups except BRG12, rivets were installed on the faces of the specimen. In BRG12, rivets were driven into the other<br />
sides of the specimen with the same configuration as BRG11.<br />
Glulam<br />
groups<br />
No. of<br />
rows by<br />
columns<br />
Row<br />
spacing<br />
Table 2: Configuration for the tested connections on glulam<br />
Column<br />
spacing<br />
Rivet<br />
penetration<br />
Member<br />
thickness<br />
Member<br />
width<br />
End<br />
distance<br />
Bottom<br />
distance<br />
Edge<br />
distance<br />
(N R*N C)<br />
S p S q L p b W d a d z d e<br />
(mm) (mm) (mm) (mm) (mm) (mm) (mm) (mm)<br />
BRG1-G 8*8 25 15 53.5 135 225 75 14 60<br />
BRG2-G 8*6 25 15 53.5 180 225 75 37 60<br />
BRG3-G 6*8 25 15 28.5 135 225 75 39 75<br />
BRG4-G 4*8 50 15 53.5 135 225 75 14 90<br />
MIG5-G 4*6 25 15 78.5 230 225 75 37 90<br />
DUG6-G 6*6 25 25 53.5 180 270 125 37 73<br />
Note: In all groups, rivets were installed on the faces of the specimen.<br />
(a)<br />
(b)<br />
Fig. 10: Material property tests; (a) Tensile strength - European testing standards<br />
EN 408:2003 [13], (b) Shear strength - AS/NZS 4063.1 [14] by Lindsay [15]
Test groups with tightly spaced rivet pattern exhibited a<br />
failure with a brittle manner (Fig. 11). A sudden plug<br />
shear failure happened while a block of wood bounded<br />
by the rivets perimeter was pulled away from either one<br />
side or both sides of the specimens. As shown in Table 3<br />
and 4, in BRG test series the failed block thickness t block<br />
were observed at approximately 0.85L p which<br />
corresponds to the elastic deformation of the rivets since<br />
no plastic deflection was observed as in Figure 11a.<br />
However, in MIG test series, there was a considerable<br />
decrease on t block with visible distortion of the rivets (Fig.<br />
11b). This failure mode is defined as mixed mode since<br />
the wood fails before final yielding of the rivets. In this<br />
case the load-carrying capacity of the wood is based on<br />
the stiffness and strength of the tensile and shear planes<br />
corresponding to the effective depth of the wood, t ef,y .<br />
5 VALIDATION OF NEW ANALYSIS<br />
AND COMPARISON WITH OTHER<br />
MODELS<br />
Strength predictions of the current tests and tests from<br />
the literature were made using the new analytical method<br />
to compare it with codes equations and other analytical<br />
models. The CSA O86-09 [3], Eurocode 5 [5] and the<br />
prediction model proposed by Stahl et al. [6] were used<br />
in the comparison. Using the U.S. (NDS) code [4],<br />
results in similar predictions as the O86 code ones after<br />
correcting for limit state definition since the rivets are<br />
adopted from CSA [6].<br />
5.1 CURRENT TEST DATA<br />
Based on the proposed analysis, in the BRG test groups<br />
(Table 3 and 4), the wood strength for t block =t ef,e was<br />
lower than the rivets yielding strength P r and<br />
consequently the failure mode was brittle. However, in<br />
the MIG test groups, the wood strength for t block = t ef,e<br />
was more than the rivets strength. The strength of the<br />
connection was thus checked for the possible mixed or<br />
ductile modes of failure. Since in these test series the<br />
wood strength for t block =t ef,y was weaker than the rivets<br />
strength, therefore a mixed mode failure occurred for the<br />
connection with a load carrying capacity less than the<br />
rivets resistance. As shown in Table 3 and 4, there is<br />
very good agreement between the predictions and<br />
observations for the thickness of the failed block, the<br />
governing failure mode, and the strength of the<br />
connection.<br />
Fig. 12 shows the strength predictions of the<br />
experimental groups using the new analysis and the<br />
predictions from O86-09, EC5 and Stahl’s method. The<br />
proposed analysis results in more precise predictions<br />
with a correlation coefficient (r 2 ) of 0.91 and a mean<br />
absolute error (MAE) of -2.6% and standard deviation<br />
(STDEV) of 9.8%.<br />
(a)<br />
(b)<br />
t block ~t ef,y (Mode IV)<br />
Brittle plug shear<br />
t block ~t ef,y (Mode III m)<br />
t block ~t ef,y (Mode IV)<br />
Brittle plug shear<br />
Figure 11: Thickness of the failed block in LVL and glulam; (a) Brittle failure mode, (b) Mixed failure mode
LVL<br />
groups<br />
Rivet<br />
penetration<br />
Table 3: Strength and failure mode predictions using the proposed method<br />
compared to experimental results on LVL<br />
Proposed<br />
wood strength<br />
P w<br />
(kN)<br />
Rivet<br />
strength<br />
P r *<br />
(kN)<br />
t block<br />
(mm)<br />
Proposed/Observed<br />
Proposed<br />
wood<br />
strength P w<br />
(kN)<br />
Connection strength<br />
(prediction/test result)<br />
Mean<br />
ultimate<br />
load † Failure mode<br />
L p<br />
(mm)<br />
t block =t ef,e t block =t ef,y P u<br />
(kN)<br />
BRG1-L 28.5 314 "461" 27.1(t ef,e ) / 23 - 314/358 Brittle/Brittle<br />
BRG2-L 28.5 362 "461" 27.1(t ef,e ) / 27 - 362/370 Brittle/Brittle<br />
BRG3-L 28.5 380 "461" 27.1(t ef,e ) / 24 - 380/375 Brittle/Brittle<br />
BRG4-L 28.5 376 "461" 27.1(t ef,e ) / 21 - 376/391 Brittle/Brittle<br />
BRG5-L 28.5 381 "461" 27.1(t ef,e ) / 28 - 381/402 Brittle/Brittle<br />
BRG6-L 28.5 378 "461" 27.1(t ef,e ) / 26 - 378/410 Brittle/Brittle<br />
BRG7-L 28.5 391 "461" 27.1(t ef,e ) / 26 - 391/435 Brittle/Brittle<br />
BRG8-L 53.5 419 "692" 45.5(t ef,e ) / 48 - 419/463 Brittle/Brittle<br />
BRG9-L 53.5 392 "519" 45.5(t ef,e ) / 43 - 392/384 Brittle/Brittle<br />
BRG10-L 53.5 440 "519" 45.5(t ef,e ) / 42 - 440/419 Brittle/Brittle<br />
BRG11-L 53.5 432 "519" 45.5(t ef,e ) / 44 - 432/427 Brittle/Brittle<br />
BRG12-L 53.5 432 "519" 45.5(t ef,e ) / 41 - 432/398 Brittle/Brittle<br />
BRG13-L 53.5 436 "519" 45.5(t ef,e ) / 41 - 436/456 Brittle/Brittle<br />
BRG14-L 53.5 440 "519" 45.5(t ef,e ) / 46 - 440/468 Brittle/Brittle<br />
BRG15-L 53.5 427 "519" 45.5(t ef,e ) / 47 - 427/437 Brittle/Brittle<br />
BRG16-L 53.5 434 "519" 45.5(t ef,e ) / 42 - 434/445 Brittle/Brittle<br />
BRG17-L 53.5 441 "345" 40.1(t ef,y ) / 50 362 345/290 Ductile/Brittle<br />
BRG18-L 28.5 237 "259" 27.1(t ef,e ) / 24 - 237/247 Brittle/Brittle<br />
BRG19-L 53.5 334 "388" 45.5(t ef,e ) / 46 - 334/315 Brittle/Brittle<br />
MIG20-L 78.5 436 "417" 26.7(t ef,y ) / 29 233 233/245 Mixed IV/Mixed IV<br />
MIG21-L 78.5 338 "278" 26.7(t ef,y ) / 27 176 176/207 Mixed IV/Mixed IV<br />
MIG22-L 53.5 255 "259" 45.5(t ef,e ) / 35 - 255/214 Brittle/Mixed III m<br />
MIG23-L 28.5 178 "172" 24.2(t ef,y ) / 19 166 166/159 Mixed III m/Mixed III m<br />
DUG24-L 28.5 505 "345" 24.2(t ef,y ) / - 498 - /345 Ductile III m/Ductile III m<br />
DUG25-L 53.5 515 "388" 40.1(t ef,y ) / - 479 - /388 Ductile III m/Ductile III m<br />
DUG26-L 78.5 419 "185" 26.7(t ef,y ) / - 213 - /185 Ductile IV/Ductile IV<br />
* The rivet strength in BRG and MIG groups are based on the rivet capacity derived from DUG tests.<br />
† Coefficient of variation (COV%) for brittle/mixed failure modes 4-9 % and for ductile failure modes 2-4%.<br />
Table 4: Strength and failure mode predictions using the proposed method<br />
compared to experimental results on glulam<br />
Proposed<br />
t block<br />
Connection strength<br />
Proposed<br />
wood<br />
Rivet<br />
Rivet<br />
(mm)<br />
(prediction/test result)<br />
wood<br />
strength<br />
Glulam penetration<br />
strength<br />
strength P w<br />
Mean<br />
P<br />
groups<br />
w<br />
P r<br />
(kN) ultimate<br />
(kN) (kN) Proposed/Observed<br />
load †<br />
Failure mode<br />
L p t block =t ef,e<br />
P<br />
t<br />
(mm)<br />
block =t u<br />
ef,y<br />
(kN)<br />
BRG1-G 53.5 340 "531" 45.5(t ef,e ) / 46 - 340/335 Brittle/Brittle<br />
BRG2-G 53.5 328 "398" 45.5(t ef,e ) / 45 - 328/301 Brittle/Brittle<br />
BRG3-G 28.5 188 272 * 27.1(t ef,e ) / 25 - 188/224 Brittle/Brittle<br />
BRG4-G 53.5 226 "266" 45.5(t ef,e ) / 50 - 226/315 Brittle/Brittle<br />
MIG5-G 78.5 222 "217 * " 29.7(t ef,y ) / 28 127 127/160 Mixed IV/Mixed IV<br />
DUG6-G 53.5 397 "298" 40.6(t ef,y ) / - 379 - /298 Ductile III m /Ductile III m<br />
† Coefficient of variation (COV%) for brittle/mixed failure modes 11-17 % and for ductile failure modes 8%.<br />
*<br />
Values are based on the tests conducted by Buchanan and Lai [16] on Radiata Pine glulam with the same density.<br />
One can note that the predictions using the other models<br />
are mostly constant for the tests with approximate<br />
capacities of 350 kN to 450 kN (Fig. 12b). These are the<br />
tests series conducted to observe the effects of bottom,<br />
edge and end distances. For instance, as the bottom<br />
distance d z gets larger due to increase in timber<br />
thickness, the capacity of the connection gets higher as<br />
asserted by Stahl et al. [6] as well.<br />
The predictions based on the proposed analysis are<br />
shown in Table 5 for test groups BRG1-L to BRG3-L<br />
which are identical in every parameter except the bottom<br />
distance. Thicker specimen with larger d z induces more<br />
stiffness for the resisting bottom shear plane. Therefore,<br />
the stiffness ratio of the resisting bottom plane increases<br />
and for the other resisting planes reduces. Subsequently,<br />
a higher proportion of the applied load transfers to the
Predicted Average Strength [kN]<br />
Predicted Average Strength [kN]<br />
bottom resisting plane and the maximum stress lowers<br />
on the lateral shear and head tensile planes in<br />
comparison to the stresses for a thinner specimen.<br />
Regarding the fact that in these test series the earlier<br />
failure belongs to the head tensile plane which gets first<br />
overloaded, so the connection capacity gets higher. The<br />
same behavior happens in respect of increasing the edge<br />
distance d e . However, the predictions by the O86 code<br />
show an opposite behavior with a decreasing trend in<br />
thicker specimens. The reason is the fact that the<br />
Canadian code includes a volume effect on the shear<br />
strength which affects the connection capacity. The<br />
results from current tests and Stahl et al. [6] disprove the<br />
size effect based on Weibull weakest link theory of<br />
brittle failure adopted by Canadian and also U.S. codes.<br />
In fact, the size of the wood surrounding the main loaded<br />
block affects mostly the stiffness of the resisting shear<br />
planes rather than the shear strength of the wood. For<br />
instance, the strength of a connection with minimal edge<br />
and bottom distances can be simply predicted as the<br />
(a)<br />
(b)<br />
550<br />
450<br />
350<br />
250<br />
600<br />
500<br />
400<br />
300<br />
200<br />
New Analytical M.<br />
r² = 0.91<br />
MAE=-2.6%<br />
STDEV=9.8%<br />
150<br />
Radiata Pine-LVL<br />
Radiata Pine-Glulam<br />
Narrow connection<br />
50<br />
50 150 250 350 450 550<br />
Observed Average Test Strength [kN]<br />
700<br />
Unsafe<br />
Conservative<br />
100<br />
Stahl Method<br />
O86-09 Code<br />
0<br />
EC5<br />
0 100 200 300 400 500 600 700<br />
Observed Average Test Strength [kN]<br />
Figure 12: Comparison of analyses and the current test<br />
data in brittle/mixed failure modes; (a) New analysis, (b)<br />
Stahl’s method, O86 code and EC5<br />
tensile capacity of the head plane since shear planes have<br />
no significant stiffness to carry any load. Also, the<br />
predictions for narrow connections are overestimated by<br />
EC5 and Stahl’s models; on the other hand,<br />
underestimated by O86 code (Fig. 12b). Moreover, for<br />
mixed failures, the predictions using Stahl’s method are<br />
non-conservative. These overestimated values are due to<br />
the fact that Stahl’s equation considers the full length of<br />
the rivet penetration as the effective wood thickness and<br />
to the fact that the possibility of mixed mode failure is<br />
not included. Thus, the necessity for predicting the<br />
connection strength under a mixed mode of failure is<br />
required.<br />
5.2 DATA AVAILABLE IN THE LITERATURE<br />
A similar comparison was made using data available in<br />
the literature and current test data (Fig. 13). Five sets of<br />
data were considered from the literature: tests performed<br />
by Foschi and Longworth [2] on Douglas Fir-Larch<br />
glulam, Buchanan and Lai [16] on Radiata Pine glulam,<br />
Karacabeyli et al. [17] on Hem-Fir solid timber, Stahl et<br />
al. [6] on Southern Pine glulam, and Marjerrison [18] on<br />
Douglas Fir-Larch and Spruce Pine glulam. It should be<br />
mentioned that the practice codes report the connection<br />
strengths at the 5 th percentile level. Therefore, a<br />
conversion was made to compare mean ultimate test<br />
strengths with 5 th percentile values from the code<br />
estimated at 75% confidence level. Coefficients of<br />
variation (COV) of 20% and 15% were considered for<br />
brittle/mixed failures on glulam and LVL<br />
correspondingly. In addition, a load duration factor was<br />
applied to the wood strength values taken from the codes<br />
to consider the short term loading effect for experiments.<br />
Based on the codes, a load duration factor of 1.25 was<br />
used for O86 values and 1.10 for EC5.<br />
By comparing the prediction models (Fig. 13), it can be<br />
deduced that there is more conformity between the<br />
predictions using the proposed analysis and the available<br />
test data. The predictive new analysis results in a higher<br />
correlation coefficient of 0.87 and less MAE of +0.9%.<br />
The method proposed by Stahl and the O86 code<br />
predictions are better than the ones using the EC5 model.<br />
The values obtained using Stahl’s method are scattered<br />
(Fig. 13b) which leads to higher STDEV compared to<br />
the one using O86 (Fig. 13c). There is considerable over<br />
prediction for the strength of a connection with large end<br />
distance by Stahl’s method and EC5. This sample<br />
supports the fact that by adding to the end distance, the<br />
load carrying capacity of the connection doesn’t increase<br />
correspondingly to the additional shear resistance surface<br />
due to larger end distance. On the other hand, O86<br />
code’s values are underestimated and too conservative.<br />
Table 5: The effect of increasing the bottom distance on the stiffness ratio of resisting planes and the wood capacity<br />
Specimens<br />
Bottom<br />
distance<br />
d z<br />
Stiffness ratios of<br />
resisting planes<br />
Maximum load causing<br />
failure on each plane (kN)<br />
Capacity<br />
prediction<br />
(min P wi *2)<br />
Test<br />
result<br />
(mm)<br />
R h R b R l P wh P wb P wl<br />
(kN) (kN)<br />
BRG1-L 17 (0.3X b ) 58% 30% 12% 157 281 298 314 358<br />
BRG2-L 35 (0.6X b ) 51% 39% 10% 181 214 344 362 370<br />
BRG3-L 62 (1.1X b ) 49% 42% 9% 190 205 355 380 375
Predicted Average Strength [kN]<br />
Predicted Average Strength [kN]<br />
Predicted Average Strength [kN]<br />
(a)<br />
(b)<br />
(c)<br />
1800<br />
1600<br />
1400<br />
1200<br />
1000<br />
800<br />
600<br />
400<br />
1600<br />
1400<br />
1200<br />
1000<br />
800<br />
600<br />
400<br />
200<br />
1600<br />
1400<br />
1200<br />
1000<br />
800<br />
New Analytical M.<br />
r² = 0.87<br />
MAE=+0.9%<br />
STDEV=20.3%<br />
200<br />
New Analytical M.<br />
0<br />
0 200 400 600 800 1000 1200 1400 1600 1800<br />
Observed Average Test Strength [kN]<br />
Stahl's Method<br />
r² = 0.78<br />
MAE=+2.1%<br />
STDEV=29.4%<br />
0<br />
0 200 400 600 800 1000 1200 1400 1600<br />
Observed Average Test Strength [kN]<br />
EC5<br />
r² = 0.67<br />
MAE=+2.8%<br />
STDEV=28.7%<br />
Stahl's Method<br />
600<br />
O86-09 Code<br />
r² = 0.78<br />
400<br />
MAE=-23.2%<br />
STDEV=18.5%<br />
200<br />
O86-09 Code<br />
0<br />
EC5<br />
0 200 400 600 800 1000 1200 1400 1600<br />
Observed Average Test Strength [kN]<br />
Figure 13: Comparison of analyses and test data<br />
(current and literature data) in brittle/mixed failure modes;<br />
(a) new analytical method, (b) Stahl’s method, (c) O86<br />
code and EC5<br />
6 CONCLUSONS<br />
A close form stiffness-based analytical model to<br />
determine the wood resistance of riveted connections in<br />
timber products is proposed. It takes into account the<br />
stiffness and strength of the failure planes subjected to<br />
non-uniform shear and tension stresses in wood. Results<br />
of current tests and data available from literature confirm<br />
that this closed form analytical method can be used as<br />
design provision with more precise predictions for<br />
timber riveted connections. Based on the proposed<br />
design model, an efficient connection design can be<br />
made by decreasing the difference between the capacity<br />
of the wood and the rivets. The proposed method can be<br />
extended to other small dowel type fastener; e.g. nails<br />
and screws for connection design improvement and<br />
failure modes prediction.<br />
ACKNOWLEDGEMENTS<br />
The authors wish to thank the Structural <strong>Timber</strong><br />
Innovation Company (STIC) for funding this research<br />
work.<br />
REFERENCES<br />
[1] <strong>Zarnani</strong> P., Quenneville P.: New analytical method and<br />
experimental verification of timber rivet connections<br />
loaded parallel-to-grain. In proceedings of the CSCE<br />
Annual Conference, Struct Div, Ottawa, Canada, 2011.<br />
[2] Foschi R. O., Longworth J.: Analysis and design of<br />
griplam nailed connections. J Struct Div ASCE,<br />
101(12):2537-2555, 1975.<br />
[3] Canadian Standards Association (CSA). CAN/CSA-<br />
O86.09: Engineering design in wood (limit states<br />
design). Mississauga, Ontario, 2009.<br />
[4] American Forest and Paper Association (AF&PA).<br />
NDS-2001: National design specification (NDS) for<br />
wood construction. Washington, DC, 2001.<br />
[5] European Committee for Standardization (CEN). EN<br />
1995-1-1:2004: Eurocode 5-<strong>Design</strong> of timber<br />
structures. Brussels, Belgium, 2004.<br />
[6] Stahl D. C. , Wolfe R. W. , and Begel M.: Improved<br />
analysis of timber rivet connections. J Struct Eng<br />
ASCE, 130(8):1272-1279, 2004.<br />
[7] Johnsson H., Stehn L.: Plug shear failure in nailed<br />
timber connections: load distribution and failure<br />
initiation. Holz-als Roh und Werkstoff, 62:455-464,<br />
2004.<br />
[8] <strong>Zarnani</strong> P., Quenneville P.: Wood effective thickness in<br />
brittle and mixed failure modes of timber rivet<br />
connections. In proceedings of 12 th World Conference<br />
on <strong>Timber</strong> Engineering, New Zealand, 2012.<br />
[9] Johansen K. W.: Theory of timber connections.<br />
Publications of International Association for Bridge<br />
and Structural Engineering, 9:249-262, 1949.<br />
[10] <strong>Zarnani</strong> P., Quenneville P.: Consistent yield model for<br />
strength prediction of timber rivet connection under<br />
ductile failure. In proceedings of 12 th World<br />
Conference on <strong>Timber</strong> Engineering, New Zealand,<br />
2012.<br />
[11] International Organization for Standardization (ISO).<br />
ISO 6891:1983.<br />
[12] Begel M., Wolfe R. W., and Stahl D. C.: <strong>Timber</strong> rivet<br />
connections in US domestic species. Res Pap FPL-RP-<br />
619. Madison, WI: US Department of Agriculture,<br />
Forest Service, Forest Products Laboratory, 2004.<br />
[13] European Committee for Standardization (CEN). N<br />
408:2003: Structural timber and glued laminated<br />
timber-Determination of some physical and mechanical<br />
properties. Brussels, Belgium, 2003.<br />
[14] Standards Australia/ Standards New Zealand<br />
(AS/NZS). AS/NZS 4063.1, 2009.<br />
[15] Lindsay B.: Determination of characteristic shear<br />
strength values for Radiata Pine and LVL. Final Year<br />
Research Project Report, DCEE, University of<br />
Auckland, New Zealand, 2010.<br />
[16] Buchanan A. H., Lai J. C.: Glulam rivets in Radiata<br />
Pine. Can J Civ Eng, 21(2):340-350, 1994.<br />
[17] Karacabeyli E., Fraser H., and Deacon W.: Lateral and<br />
withdrawal load resistance of glulam rivet connections<br />
made with sawn timber. CJCE, 25(1):128-138, 1998.<br />
[18] Marjerrison M. R.: Analysis of timber rivet<br />
connections loaded parallel to grain. MSc dissertation,<br />
Department of Civil Eng, The Royal Military College<br />
of Canada, Kingston, Ontario, Canada, 2007.