Houston, TX TrendLines Publication - Transwestern
Houston, TX TrendLines Publication - Transwestern
Houston, TX TrendLines Publication - Transwestern

You also want an ePaper? Increase the reach of your titles
YUMPU automatically turns print PDFs into web optimized ePapers that Google loves.
TAPPING AN EXPANDING MARKET
FOREWORDNOVEMBER 2013<br />
To our friends, clients and colleagues:<br />
We are pleased to provide you this thirteenth annual edition of <strong>TrendLines</strong>: Trends in Metro <strong>Houston</strong> Commercial Real Estate. This is a collaborative publication of <strong>Transwestern</strong><br />
and its research affiliate, Delta Associates. Our purposes are to distill the trends of 2013 and to shed light on pivotal forces and issues that we believe will affect the region’s<br />
economy and commercial real estate in 2014 and beyond.<br />
Through the 3rd quarter of 2013, the Metro <strong>Houston</strong> commercial real estate market’s performance ranked among the best in the nation, a reflection of the robust local economy,<br />
strong demand for all property types, and a controlled development pipeline. New demand for office space continues, supported by a growing energy industry. Meanwhile,<br />
<strong>Houston</strong>’s industrial market boasts the lowest vacancy rate in the nation, with further market growth likely when the Panama Canal expansion is completed in 2015 and <strong>Houston</strong><br />
reaps the benefits of additional freight activity. The retail market is benefiting from a prospering and growing population while the apartment market is enjoying demographic<br />
and lifestyle shifts that favor this product type.<br />
Employment gains in Metro <strong>Houston</strong> have been among the best in the nation in 2013, and as a result, the commercial real estate market likely will continue to improve in 2014.<br />
Of note, pricing for all types of assets is increasing; <strong>Houston</strong>’s strong market fundamentals are attracting renewed attention from investors. Values are expected to rise further<br />
in 2014.<br />
We expect to find significant opportunities in our industry in the period ahead, notwithstanding the sluggish pace of the national economic recovery. In 2014, we expect:<br />
• Strong job growth in Metro <strong>Houston</strong>. We expect to have seen a gain of approximately 100,000 payroll jobs during 2013, once the year is complete, followed by an increase<br />
of 80,000 to 90,000 jobs per annum in 2014 and 2015. These projections are supported by the sturdy performance of the energy and health sectors and likely growth in<br />
<strong>Houston</strong>’s distribution sector over the next two years. The pace of regional economic growth may decelerate following robust expansion in 2012 and 2013, but <strong>Houston</strong> is<br />
likely to remain a national leader in job creation during 2014.<br />
• Stabilizing or declining vacancy and rising rents for office, industrial, and retail product. While the office pipeline of new supply is expanding more quickly than it was a year<br />
ago, demand remains strong enough to generate continued rent growth.<br />
• Declining vacancy and rising rents for apartment product, as job creation and lifestyle changes drive demand. Apartment rents, already at record levels, will see more upside<br />
in this cycle.<br />
• <strong>Houston</strong>’s commercial real estate assets to attract additional attention from investors, given the region’s strong economy; demand for high-quality assets will remain robust<br />
in 2014, with tenants focused on top-tier space.<br />
• Commercial real estate prices to continue rising along with improving fundamentals and investor demand. As pricing for existing assets continues to rise and vacancy<br />
remains low, we expect groundbreakings to continue across all property types, including additional spec development.<br />
We hope the following information provides insight into our collective opportunities. All the professionals at <strong>Transwestern</strong> and Delta Associates look forward to helping you<br />
interpret the material in this report, and to being your service partner in the successes we are confident you will achieve in the period ahead. We offer you our best wishes for<br />
a successful 2014.<br />
<strong>Transwestern</strong><br />
Kevin Roberts<br />
President, Southwest<br />
Delta Associates<br />
Gregory H. Leisch, CRE<br />
Chief Executive
TRANSWESTERN WOULD LIKE TO THANK OUR 2013 SPONSORS<br />
Locke Lord LLP<br />
Locke Lord LLP is a full-service, international law firm with offices in Atlanta, Austin, Chicago, Dallas, Hong Kong, <strong>Houston</strong>, London, Los Angeles, New Orleans, New York,<br />
Sacramento, San Francisco and Washington, D.C. Our team of nearly 650 attorneys has earned a solid national reputation in complex litigation, regulatory and transactional work.<br />
We serve our clients’ interests first, and these clients range from Fortune 500 and middle market public and private companies to start-ups and emerging businesses.<br />
Locke Lord’s team builds collaborative relationships and crafts creative solutions to solve problems - all designed and executed with long-term strategic goals in mind. Among<br />
Locke Lord’s many strong practice areas are appellate, aviation, bankruptcy/restructuring, business litigation, class action litigation, corporate, employee benefits, energy,<br />
environmental, financial services, health care, insurance and reinsurance, intellectual property, international, labor and employment, litigation, mergers and acquisitions, private<br />
equity, public law, real estate, regulatory, REIT, tax, technology, and white collar criminal defense and internal investigations.<br />
Chicago Title Insurance Company — Commercial<br />
Chicago Title offers customers the most comprehensive and accurate real estate related services in the nation. You can rely on Chicago Title, with its rich history of over 160<br />
years, to provide assurance and security for all your real estate transactions and title insurance needs. In <strong>Houston</strong>, please contact Jimmy Erwin, Reno Hartfiel or Karen Highfield<br />
for property related transactions in Texas and the rest of the United States.<br />
Harvey Builders<br />
Since the formation of D.E. Harvey Builders 50 years ago, the company has rapidly grown to be a recognized leader in the <strong>Houston</strong> building industry. Currently, the company<br />
maintains offices in <strong>Houston</strong>, Austin, San Antonio and Washington, D.C. All facets of the commercial construction markets are being served. Our people and the projects they<br />
manage represent a culture, philosophy and history based on community service. From the very beginning, we have worked hard to become an integral part of the communities<br />
we have helped to build. Our philosophy is based on 3 words: Innovation, Quality, Integrity. Harvey takes pride in taking great care of their clients by treating them as partners.<br />
With a solid foundation of past accomplishments we continually strive to build trusting relationships with our clients and for excellence in our performance. Our work is visible<br />
evidence of our concern for the environment, for education, for healthcare, and for the economy. At Harvey, we care enough to exceed the needs of our clients and society in<br />
everything we do.<br />
Kirksey<br />
Specializing in sustainable architecture, interior design and master planning, Kirksey designs high-performance, healthy buildings for all of our clients. Our firm is organized<br />
into focused practice groups — Commercial, Community/Religious, Education, Healthcare, Hospitality, Interior Architecture, Residential, Retail, and Science & Technology — each<br />
supported by departments of Design, EcoServices, Information Technology and Marketing. We’ve been shaping the <strong>Houston</strong> skyline since 1971 and have designed over 70 office<br />
buildings in the past ten years alone. We create environments that encourage collaboration and innovation, promote corporate culture, and foster growth. Headquartered on our<br />
own corporate campus in <strong>Houston</strong>, Texas we are a group of designers and creatives committed to our clients, our community, and our earth.<br />
J.P.Morgan<br />
J.P. Morgan is a leader in financial services, offering solutions to clients in more than 100 countries with one of the most comprehensive global product platforms available.<br />
We have been helping our clients to do business and manage their wealth for more than 200 years. Our business has been built upon our core principle of putting our clients’<br />
interests first. J.P. Morgan is part of JPMorgan Chase & Co. (NYSE: JPM), a global financial services firm with assets of $2.3 trillion.
SPECIAL THANK YOU TO OUR KEYNOTE SPEAKER<br />
William Bennett<br />
Former U.S. Secretary of Education William J. Bennett is one of America’s most important, influential and respected voices on cultural, political and education issues. Over the<br />
course of his professional life, in education, government and the private sector, Bennett has succeeded in a trifecta of American institutions. He is an award-winning professor<br />
in academia, having taught at Boston University, the University of Texas and Harvard. Further, he is a three-time confirmed executive in the Ronald Reagan and George W. Bush<br />
administrations including holding two cabinet-level positions, Secretary of Education under Ronald Reagan and the Nation’s first Drug Czar under the first President Bush. Prior<br />
to becoming Secretary of Education, he was also chairman of the National Endowment for the Humanities. Additionally, he is the author of more than 24 books, including two<br />
that reached No. 1 on the New York Times Best Sellers list and two of the most successful books of the 1990s. He is the host of the No. 7 ranked nationally syndicated radio<br />
show, “Morning in America.” Thanks to his government positions, his writings and speeches, and thousands of media appearances, Bennett has extraordinary influence on<br />
America’s political and social landscape. In many surveys and publications, he has been named one of the most influential individuals in America. He is the recipient of more<br />
than 30 honorary degrees.<br />
ACKNOWLEDGMENTS<br />
The editor, Alexander (Sandy) Paul, CRE, wishes to acknowledge and thank this project’s research team at Delta Associates: Elizabeth Norton, National Research Director; David<br />
Parham, Senior Vice President; and Joshua Cohen, Associate. Thanks also to the creative layout team at <strong>Transwestern</strong>, headed by Shannon Bedinger and Gregorio Barrera. We<br />
would also like to thank Cyndi McNeill for her help with this project. Finally, thanks to Gregory Leisch, CRE, for his insights on the economy and commercial real estate markets.<br />
REPRESENTATIONS<br />
Although the information contained herein is based on sources that Delta Associates (DA) and <strong>Transwestern</strong> (TW) believe to be reliable, DA and TW make no representation<br />
or warranty that such information is accurate or complete. All prices, yields, analyses, computations, and opinions expressed are subject to change without notice. Under no<br />
circumstances should any such information be considered representations or warranties of DA or TW of any kind. Any such information may be based on assumptions that may<br />
or may not be accurate, and any such assumption may differ from actual results. This report should not be considered investment advice.
TABLE OF CONTENTS<br />
Section One Summary 5<br />
National Economy: Recovery Endures as Private and Public<br />
Sectors Adapt<br />
<strong>Houston</strong>’s Economy Maintains Robust Expansion<br />
<strong>Houston</strong> Metro Office Market: Expansion in 2013<br />
<strong>Houston</strong> Metro Industrial Market Strong – and Improving<br />
Investment Sales<br />
<strong>Houston</strong> Metro Multifamily Market: Bolstered by Employment<br />
Growth<br />
<strong>Houston</strong> Metro Retail Market: Supported by Hiring in Core<br />
Industries<br />
Section Two The National Economy 9<br />
Section Three The <strong>Houston</strong> Metro Economy 16<br />
Section Four The <strong>Houston</strong> Metro Office Market 19<br />
Section Five The <strong>Houston</strong> Metro Industrial Market 27<br />
Section Six Office and Industrial Investment Trends 32<br />
Section Seven The <strong>Houston</strong> Metro Multifamily Market 36<br />
Section Eight The <strong>Houston</strong> Metro Retail Market 38<br />
National Economy: Recovery Endures as Private and Public Sectors Adapt<br />
In the face of tax hikes, spending cuts and recent volatility in the stock market, the national economic expansion<br />
remains on track, even if its performance is slow and uneven from month to month. Consumers’ improved outlook<br />
is partly due to:<br />
• Higher-income Americans feeling wealthier due to a 22.3% gain in the stock market year-to-date (the S&P<br />
500 as of mid-October);<br />
• Middle-income Americans feeling better due to a 12% gain in housing prices over the past 12 months; and<br />
• Lower- and middle-income earners benefiting from low inflation and declining gasoline prices since last<br />
year at this time.<br />
Thus far in 2013 there has been little residual impact from sequestration. The private and public sectors are<br />
each learning to adapt, and national economic growth has continued, though at a level that is weak for a postrecession<br />
recovery. Households should remain upbeat due to increases in net worth from home prices and the<br />
stock market, though the Federal government shutdown and debt ceiling fights in October may have weakened<br />
consumer confidence. On balance, we look for this recovery to continue on its slow but steady course through<br />
2017 or so, barring a catastrophic event.<br />
Specifically, we believe the economic outlook is as follows:<br />
• Real GDP growth: Approximately 2.0% in 2013.<br />
• Payroll jobs: Approximately 2.3 million added in 2013.<br />
• Housing: Price increases of approximately 12% from December 2012 to December 2013.<br />
• Unemployment rate: Hovering around 7.3% throughout the remainder of 2013.<br />
• Federal Funds Rate: 0% to 0.25% through year-end 2015.<br />
• Long-term interest rates: Edging higher during the rest of 2013.<br />
• Inflation rate: Remaining around 2.0% during the balance of 2013; higher in 2014 as consumer demand<br />
strengthens.<br />
Foreword | Sponsors | Special Thanks, Acknowledgments & Representations | Contact<br />
5<br />
TRENDLINES® 2013
TABLE OF CONTENTS<br />
Section One Summary 5<br />
National Economy: Recovery Endures as Private and Public<br />
Sectors Adapt<br />
<strong>Houston</strong>’s Economy Maintains Robust Expansion<br />
<strong>Houston</strong> Metro Office Market: Expansion in 2013<br />
<strong>Houston</strong> Metro Industrial Market Strong – and Improving<br />
Investment Sales<br />
<strong>Houston</strong> Metro Multifamily Market: Bolstered by Employment<br />
Growth<br />
<strong>Houston</strong> Metro Retail Market: Supported by Hiring in Core<br />
Industries<br />
Section Two The National Economy 9<br />
Section Three The <strong>Houston</strong> Metro Economy 16<br />
Section Four The <strong>Houston</strong> Metro Office Market 19<br />
Section Five The <strong>Houston</strong> Metro Industrial Market 27<br />
Section Six Office and Industrial Investment Trends 32<br />
Section Seven The <strong>Houston</strong> Metro Multifamily Market 36<br />
Section Eight The <strong>Houston</strong> Metro Retail Market 38<br />
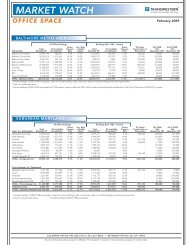
<strong>Houston</strong>’s Economy Maintains Robust Expansion<br />
The <strong>Houston</strong> metro economy continued to improve during 2013. The 12-month employment growth of 80,700 jobs through August<br />
2013 is fourth-most in the nation among large metro areas. <strong>Houston</strong>’s payroll employment rose by 3.0% during that period, above<br />
the national growth of 2.4%. The Energy, Construction, and Trade/Transportation Sectors are fueling growth, and <strong>Houston</strong>’s other core<br />
industries are continuing to expand, including the Leisure/Hospitality sector.<br />
Energy (Mining/Logging)<br />
6,200 jobs added over the 12 months ending August<br />
2013 – a 6.0% increase.<br />
Professional Services<br />
12,000 jobs added over the 12 months ending August<br />
2013 – a 2.9% increase.<br />
Construction<br />
8,200 jobs were added during the 12 months ending<br />
August 2013 – a 4.5% increase.<br />
Manufacturing<br />
5,900 jobs were added over the 12 months ending in<br />
August 2013 – a 2.4% increase.<br />
Trade/Transportation<br />
19,200 jobs added in the 12 months ending August<br />
2013 – a 3.5% increase.<br />
Foreword | Sponsors | Special Thanks, Acknowledgments & Representations | Contact<br />
<strong>Houston</strong>’s economic outlook is bright and it should remain strong for several years to come. Economic uncertainty and political instability<br />
in the Middle East does cause some concern, but <strong>Houston</strong> is in a strong position to withstand any slowdown in economic growth.<br />
The energy sector has been a boon for <strong>Houston</strong> and not only because of its oil and gas production. Wind power is another source of<br />
production. Strength in the Energy, Trade/Transportation, and Education and Health Services sectors will drive expansion locally over<br />
the next several years. As a result, we expect metro <strong>Houston</strong>’s job growth to average approximately 91,700 per year for the 2013-2015<br />
period, comparable to the growth during the 2005-2007 expansion period. <strong>Houston</strong>’s employment growth should be among the<br />
nation’s strongest.<br />
6<br />
TRENDLINES® 2013
TABLE OF CONTENTS<br />
Section One Summary 5<br />
7<br />
National Economy: Recovery Endures as Private and Public<br />
Sectors Adapt<br />
<strong>Houston</strong>’s Economy Maintains Robust Expansion<br />
<strong>Houston</strong> Metro Office Market: Expansion in 2013<br />
<strong>Houston</strong> Metro Industrial Market Strong – and Improving<br />
Investment Sales<br />
<strong>Houston</strong> Metro Multifamily Market: Bolstered by Employment<br />
Growth<br />
<strong>Houston</strong> Metro Retail Market: Supported by Hiring in Core<br />
Industries<br />
Section Two The National Economy 9<br />
Section Three The <strong>Houston</strong> Metro Economy 16<br />
Section Four The <strong>Houston</strong> Metro Office Market 19<br />
Section Five The <strong>Houston</strong> Metro Industrial Market 27<br />
Section Six Office and Industrial Investment Trends 32<br />
Section Seven The <strong>Houston</strong> Metro Multifamily Market 36<br />
Section Eight The <strong>Houston</strong> Metro Retail Market 38<br />
Foreword | Sponsors | Special Thanks, Acknowledgments & Representations | Contact<br />
TRENDLINES® 2013<br />
<strong>Houston</strong> Metro Office Market:<br />
Expansion in 2013<br />
The <strong>Houston</strong> metro office market experienced growth in 2013, as the<br />
local economy expands at a healthy rate. Job creation, especially<br />
among energy-related firms, has driven office leasing activity, and<br />
tenants are seeking quality space in prime submarkets.<br />
Net absorption totaled 1.3 million SF in the first three quarters of 2013<br />
(1.7 million SF when annualized), compared to 4.2 million SF in all of<br />
2012. The Class A market accounted for that entire total, absorbing<br />
1.4 million SF, with Class B reporting negative absorption in the<br />
<strong>Houston</strong> market. Positive Class A absorption is occurring because of<br />
the strength of the local economy. Owners are looking for tenants to<br />
fill Class A space before new buildings currently under construction<br />
come online.<br />
The overall office vacancy rate (including sublet space) in the <strong>Houston</strong><br />
metro area was 10.9% at 3rd quarter 2013, unchanged from one year<br />
ago. The direct vacancy rate was 10.4%, down from 10.6% one year<br />
ago. The continued strength of the local economy is driving this rate<br />
down; direct vacancy is nearing its recent nadir of 10.2% in 2007.<br />
Asking rents for all classes of office space have risen approximately<br />
1.0% in metro <strong>Houston</strong> during the first three quarters of 2013, after<br />
rising 3.6% in 2012. Class A rents rose 2.4% through the 3rd quarter<br />
of 2013, and Class B rents increased 0.7% in the same period. Class<br />
A rents have been rising faster than Class B rents because of the flight<br />
to quality underway, with stronger demand for newer space.<br />
The <strong>Houston</strong> metro office market will likely experience continued<br />
growth in the period ahead. However, given the growing pipeline,<br />
coupled with tenants vacating older space, we expect the vacancy<br />
rate to stabilize over the next two years – hovering in the low-11%<br />
range. Rents will likely continue rising modestly for the remainder<br />
of 2013 and into 2014, especially for Class A space, as office market<br />
conditions currently favor owners. However, with the development<br />
pipeline (including planned space expected to start construction<br />
soon) now at 5.3% of the standing inventory, rent increases are likely<br />
to remain modest.<br />
<strong>Houston</strong> Metro Industrial Market Strong –<br />
and Improving<br />
The fundamentals of the <strong>Houston</strong> industrial market improved in<br />
2013, with vacancy being the lowest in the nation and continuing<br />
to decline. As consumer spending increases, demand for industrial<br />
space will continue to grow over the intermediate to long term. As<br />
the national economic recovery continues, we expect demand for<br />
<strong>Houston</strong> industrial space to remain strong for the remainder of 2013<br />
and into 2014. The rising demand for goods and increased trade with<br />
Asia via the expanded Panama Canal suggest a strong future for the<br />
<strong>Houston</strong> industrial market.<br />
Net absorption of industrial space in the <strong>Houston</strong> metro totaled<br />
4.8 million SF through the first three quarters of 2013, compared<br />
to a total of 5.0 million SF in 2012. Local businesses are expanding<br />
as the regional economy strengthens and consumer spending<br />
and confidence increase. A growing retail segment benefits the<br />
warehouse/distribution market.<br />
The overall <strong>Houston</strong> metro area industrial vacancy rate declined to<br />
4.3% in September 2013 from 4.6% a year earlier. The direct industrial<br />
vacancy rate, 4.2% in September, is down from 4.5% a year earlier.<br />
Industrial asking rents edged down 0.3% through the 3rd quarter of<br />
2013, after rising by 5.0% in 2012. The 3rd quarter 2013 average<br />
asking rent for all types of industrial space is $5.87/SF, triple net.<br />
Steady demand should support healthy rent increases during the<br />
remainder of 2013 and into 2014, particularly in the warehouse/<br />
distribution sector, given the already-low vacancy rate in the <strong>Houston</strong><br />
industrial market.<br />
The <strong>Houston</strong> metro industrial market will likely experience continued<br />
growth for the remainder of 2013 and into 2014. Despite gains in<br />
the United States, global economic uncertainty persists and could<br />
potentially curtail national economic growth. However, the energy<br />
boom in <strong>Houston</strong> should be able to sustain the volatility of the broader<br />
economy, and industrial vacancies in <strong>Houston</strong> likely will continue to fall.<br />
Large-scale construction is underway all across the <strong>Houston</strong> market. If<br />
construction remains controlled, industrial rents will rise, and market<br />
conditions will turn further in favor of landlords. The current level of<br />
construction is limited enough to promote continuing strong market<br />
conditions, though the pipeline has been increasing. On balance,<br />
we expect strong performance from the <strong>Houston</strong> industrial market<br />
during the remainder of 2013 and into 2014.<br />
Investment Sales<br />
Sales have returned to peak levels in <strong>Houston</strong> faster than in many<br />
other major markets, even as national office investment volume has<br />
plateaued. Annualized national office volume for 2013 totals $77.5<br />
billion, compared to $81.1 billion in 2012 and $64.7 billion in 2011.<br />
Improved market conditions, driven by one of the nation’s strongest<br />
local economies, continue to fuel investor interest in the Energy<br />
Capital. The shale revolution has given local energy companies the<br />
confidence and incentive to expand their workforces, which translates<br />
into greater interest in <strong>Houston</strong> office assets.<br />
In the long term, real estate investments have either matched or<br />
outperformed stocks and bonds. While in the short term the stock<br />
market has been robust, investors continue to seek real estate as a<br />
hedge against inflation. After a precipitous fall following the housing<br />
bubble and recession, real estate has again proved to be a strong<br />
investment. In the last 10 years as of June 2013 the NAREIT Equity REIT<br />
Index saw a 10.96% increase. The NCREIF Property Index increased<br />
8.6% during the same period, while stocks (as measured by the S&P<br />
500) rose 7.3%. Direct investment in real estate remains attractive at<br />
this point in the cycle compared to the alternatives, particularly given<br />
the run-up in the bull market.<br />
In <strong>Houston</strong>, there was $2.5 billion in total office sales recorded yearto-date<br />
in 2013. The $3.3 billion annualized total for the year is set to<br />
surpass marks of $2.5 billion in 2012 and $1.4 billion in 2011.<br />
The average cap rate on a rolling three-month basis for core <strong>Houston</strong><br />
office assets was 7.2% in June 2013. However, there is a wide range<br />
of cap rates depending on the locations and characteristics of the<br />
properties being traded. Trophy properties have recently traded<br />
at cap rates in the 6.0% range. We expect cap rates to edge down<br />
locally during the balance of 2013, as market fundamentals suggest<br />
increasing investor interest in <strong>Houston</strong>’s office assets. However, if<br />
long-term interest rates rise substantially in the period ahead cap<br />
rates likely will rise in turn.<br />
Despite decelerating some from 2012 numbers, national industrial<br />
investment sales remain well above recessionary levels seen in 2008<br />
through 2010. At the current pace, sales will total $36.3 billion in
TABLE OF CONTENTS<br />
Section One Summary 5<br />
National Economy: Recovery Endures as Private and Public<br />
Sectors Adapt<br />
<strong>Houston</strong>’s Economy Maintains Robust Expansion<br />
<strong>Houston</strong> Metro Office Market: Expansion in 2013<br />
<strong>Houston</strong> Metro Industrial Market Strong – and Improving<br />
Investment Sales<br />
<strong>Houston</strong> Metro Multifamily Market: Bolstered by Employment<br />
Growth<br />
<strong>Houston</strong> Metro Retail Market: Supported by Hiring in Core<br />
Industries<br />
Section Two The National Economy 9<br />
Section Three The <strong>Houston</strong> Metro Economy 16<br />
Section Four The <strong>Houston</strong> Metro Office Market 19<br />
Section Five The <strong>Houston</strong> Metro Industrial Market 27<br />
Section Six Office and Industrial Investment Trends 32<br />
Section Seven The <strong>Houston</strong> Metro Multifamily Market 36<br />
Section Eight The <strong>Houston</strong> Metro Retail Market 38<br />
2013, compared to $40.3 billion in 2012 and $34.9 billion in 2011.<br />
Additionally, the <strong>Houston</strong> market has seen strong returns over the past<br />
year and is poised to see an increase in demand with the completion<br />
of the Panama Canal expansion in 2015, allowing for a larger amount<br />
of cargo from the Pacific.<br />
Returns on investments in industrial assets have shown continued<br />
strength in 2013. Like the office market, the <strong>Houston</strong> industrial market<br />
has performed the best relative to other markets across the country.<br />
Returns in <strong>Houston</strong> measured 15.97% over the 12 months ending<br />
in June 2013, compared to the national average of 10.82%. Among<br />
major industrial markets, only Denver performed nearly as well.<br />
Investor demand for industrial properties in <strong>Houston</strong> will continue to<br />
strengthen with the abundance of capital (core and value-add funds)<br />
that is chasing industrial product based on the strength of the market<br />
and the <strong>Houston</strong> economy. This, coupled with the lack of quality<br />
product on the market, will continue to put downward pressure on<br />
cap rates (perhaps below 6% for premier assets) as long as interest<br />
rates remain low by historical standards. If long-term interest rates<br />
rise in 2014 cap rates for <strong>Houston</strong> industrial product may edge up,<br />
but the market’s strong fundamentals, including the lowest vacancy<br />
rate among major metro areas, will encourage investor interest.<br />
<strong>Houston</strong> Metro Multifamily Market: Bolstered<br />
by Employment Growth<br />
The <strong>Houston</strong> metro multifamily market continues to expand due<br />
to population increases and one of the highest job growth rates in<br />
the country. This year has seen market fundamentals improve, with<br />
absorption and rents up and vacancy down.<br />
Net absorption for all classes of apartments remained strong yearto-date<br />
in the <strong>Houston</strong> metro as of September 2013, surpassing the<br />
pace of absorption in 2012. Absorption was approximately 16,168<br />
units year-to-date through September 2013, compared to 14,664<br />
units during all of 2012. <strong>Houston</strong>’s population is increasing as the<br />
availability of employment attracts new residents from other parts of<br />
the country.<br />
The delivery of new apartment units has not kept pace with demand<br />
in the past year, leading to a declining vacancy rate. Vacancy as of<br />
September 2013 stood at 8.9%, down from 10.6% at the end of<br />
2012 and 12.3% at year-end 2011. The vacancy rate for all classes<br />
of <strong>Houston</strong> metro apartments has continued to decline following its<br />
spike in 2009 and is now at the lowest level in the past decade. With<br />
strong job creation and population growth expected to continue, we<br />
anticipate the vacancy rate will edge down further over the next 12<br />
months.<br />
Strong demand and declining vacancy have allowed property owners<br />
to push rents to record levels in 2013. The average rental rate for<br />
<strong>Houston</strong> apartments was $0.97/SF/month at the end of September,<br />
up 6.0% over the past 12 months. Rents will likely increase through<br />
the balance of 2013 and into 2014 as job creation continues and<br />
economic growth strengthens.<br />
<strong>Houston</strong> Metro Retail Market: Supported by<br />
Hiring in Core Industries<br />
Metro <strong>Houston</strong>’s retail market experienced steady improvement in<br />
2013, as the economy strengthened and job growth remained strong<br />
locally. This sector’s growth is supported by one of the nation’s best<br />
regional economies and its solid employment gains, reinforced by<br />
hiring in the core industries.<br />
<strong>Houston</strong>’s retail vacancy rate, at 10.1% in the 3rd quarter of 2013, is<br />
down from 11.0% in the 3rd quarter of 2012. We expect that vacancy<br />
will remain steady or decline modestly for the remainder of 2013 and<br />
into early 2014, as <strong>Houston</strong>’s consumer sector remains strong and<br />
retailers open more stores.<br />
Retail rents remained at $1.40/SF/month in the 3rd quarter of 2013<br />
for all classes of retail space combined. Rents for superior product<br />
are rising; commodity product is reducing the overall average. While<br />
overall rents declined during the past year, they likely will experience<br />
modest growth during the balance of 2013 and into 2014, as<br />
consumer spending accelerates and market conditions continue to<br />
strengthen. The recent trends in vacancy have set the stage for rent<br />
growth.<br />
The <strong>Houston</strong> retail market will likely see further expansion during the<br />
balance of 2013 and into 2014, as local job growth remains robust<br />
and the consumer sector is strengthening. Nationally, consumer<br />
confidence remains at its highest point in over five years. With<br />
regional economic growth, new consumers will arrive, increasing total<br />
consumption. A growth cycle in the retail market will likely occur over<br />
the next several years, making investment very attractive. We look<br />
for a focus on grocery-anchored and mixed-use development, as well<br />
as increasing urban infill projects, as these best address consumers’<br />
needs and preferences.<br />
Foreword | Sponsors | Special Thanks, Acknowledgments & Representations | Contact<br />
8<br />
TRENDLINES® 2013
TABLE OF CONTENTS<br />
Section One Summary 5<br />
Section Two The National Economy 9<br />
Recovery Endures as Private and Public Sectors Adapt<br />
Payroll Jobs<br />
Payroll Jobs - Continued<br />
Gross Domestic Product (GDP) and Consumption<br />
Housing Market<br />
Federal Intervention and Inflation<br />
Federal Intervention and Inflation - Continued<br />
Economic Outlook<br />
National Payroll Job Growth Summary<br />
Section Three The <strong>Houston</strong> Metro Economy 16<br />
Section Four The <strong>Houston</strong> Metro Office Market 19<br />
Section Five The <strong>Houston</strong> Metro Industrial Market 27<br />
Section Six Office and Industrial Investment Trends 32<br />
Section Seven The <strong>Houston</strong> Metro Multifamily Market 36<br />
Section Eight The <strong>Houston</strong> Metro Retail Market 38<br />
Foreword | Sponsors | Special Thanks, Acknowledgments & Representations | Contact<br />
9<br />
TRENDLINES® 2013<br />
RECOVERY ENDURES AS PRIVATE AND PUBLIC<br />
SECTORS ADAPT<br />
In the face of tax hikes, spending cuts and recent volatility in the stock<br />
market, the national economic expansion remains on track, even if its<br />
performance is slow and uneven from month to month. Consumers’<br />
improved outlook is partly due to:<br />
• Higher-income Americans feeling wealthier due to a 22.3% gain<br />
in the stock market year-to-date (the S&P 500 as of mid-October);<br />
• Middle-income Americans feeling better due to a 12% gain in<br />
housing prices over the past 12 months; and<br />
• Lower- and middle-income earners benefiting from low inflation<br />
and declining gasoline prices since last year at this time.<br />
These factors have sent consumer sentiment to its highest level in<br />
nearly six years. The Thomson Reuters/University of Michigan index of<br />
consumer sentiment stood at 75.2 in October. While down in recent<br />
months, it remains high compared to values from the past several<br />
years. Consumers are becoming more confident in the economy as<br />
their net worth increases, driven by the strong performance of stocks<br />
(which supports the growth of workers’ 401(k) plans), and the housing<br />
market (with housing representing most workers’ single greatest<br />
asset). Rising household wealth has translated into spending, as retail<br />
sales are up 4.7% year-over-year as of August 2013.<br />
While sequestration (the Federal government’s automatic budget<br />
cuts) is a reality, and a payroll tax holiday ended at the start of the<br />
year, neither has been able to derail U.S. economic growth. Each has<br />
likely acted as a drag on growth – GDP gains have been lackluster<br />
recently, and this is the weakest post-recession recovery since the<br />
Great Depression – but the economy does continue to expand, along<br />
with the job market. Look for tensions in the Middle East and rising<br />
interest rates to also act as a drag on growth in the near-term.<br />
GDP RECOVERY PATTERNS AFTER THE PAST FOUR<br />
RECESSIONS<br />
United States<br />
Cumulative % Change in GDP<br />
25%<br />
20%<br />
15%<br />
10%<br />
5%<br />
0%<br />
1982-Q3<br />
1991-Q1<br />
2001-Q4<br />
2009-Q2<br />
0 1 2 3 4 5 6 7 8 9 10 11 12 13 14 15 16<br />
Quarters After Trough<br />
Note: Based on chained 2009 dollars.<br />
Source: Bureau of Economic Analysis, Center for Regional Analysis, Delta Associates; October 2013.<br />
One benefit of Federal austerity and an enduring economy is that<br />
they are reducing the deficit. The Congressional Budget Office<br />
(CBO) projects that in 2015, the Federal budget deficit will be just<br />
39% of what it was in 2012. Of note, the U.S. will still be running a<br />
deficit – we are not paying down debt, just increasing it at a slower<br />
rate – but that is still substantial progress in three years. As long as<br />
GDP gradually accelerates along with job creation, the reduction in<br />
Federal spending will be of long-term benefit to the economy. While<br />
the deficit is expected to fall to 2.4% of GDP by 2015, the deficit is<br />
projected to increase later in the coming decade due to rising health<br />
care costs and rising interest payments on government debt once<br />
the borrowing environment returns to more normal conditions. If this<br />
occurs, expect a few more battles on Capitol Hill to rein in spending<br />
or in pursuit of other deficit-reducing measures.<br />
BASELINE BUDGET PROJECTIONS<br />
United States<br />
Federal Deficit ($ Billions)<br />
0<br />
-200<br />
-400<br />
-600<br />
-800<br />
-1,000<br />
-1,200 2012<br />
Deficit % of GDP<br />
2013 2014 2015 2016 2017 2018 2019 2020 2021 2022 2023<br />
Source: Congressional Budget Office, Delta Associates; October2013.<br />
In sum, we look for this recovery to continue on its slow but steady<br />
course through 2017 or so, barring a catastrophic event.<br />
PAYROLL JOBS<br />
The national economy added 2.2 million new jobs (not seasonally<br />
adjusted) during the 12 months ending August 2013, with the private<br />
sector adding close to 2.3 million new jobs while the public sector<br />
shed 83,000 positions. Month-to-month gains continue to be hit<br />
or miss, as the 169,000 jobs (seasonally adjusted) that were added<br />
to the economy during the month of August 2013 were slightly<br />
lower than consensus estimates. In general, job growth has been<br />
disappointing in this cycle compared to past economic recoveries.<br />
Because of population growth, about 125,000 jobs must be created<br />
each month just to keep a steady unemployment rate. Although the<br />
economy continues to move forward, it is doing so at a tepid pace,<br />
which has encouraged businesses and consumers to alter spending<br />
patterns and adjust to limited growth. Although we expect that job<br />
growth will continue to be sub-par during this expansion cycle, we<br />
project that 2013 will overall be somewhat better than 2012, with<br />
approximately 2.3 million jobs created.<br />
PAYROLL JOB GROWTH<br />
United States | Year‐Over‐Year<br />
Thousands of New Payroll Jobs<br />
4,000<br />
2,000<br />
0<br />
-2,000<br />
-4,000<br />
-6,000<br />
Private Sector<br />
Public Sector<br />
-8,000<br />
Aug. Oct. Dec. Feb. Apr. Jun. Aug. Oct. Dec. Feb. Apr. Jun. Aug. Oct. Dec. Feb. Apr. Jun. Aug. Oct. Dec. Feb. Apr. Jun. Aug<br />
09 09 09 10 10 10 10 10 10 11 11 11 11 11 11 12 12 12 12 12 12 13 13 13 13<br />
Note: Data are not seasonally adjusted.<br />
Source: Bureau of Labor Statistics, Delta Associates; October 2013.<br />
8%<br />
7%<br />
6%<br />
5%<br />
4%<br />
3%<br />
2%<br />
1%<br />
0%<br />
Deficit as a % of GDP
TABLE OF CONTENTS<br />
Section One Summary 5<br />
Section Two The National Economy 9<br />
Recovery Endures as Private and Public Sectors Adapt<br />
Payroll Jobs<br />
Payroll Jobs - Continued<br />
Gross Domestic Product (GDP) and Consumption<br />
Housing Market<br />
Federal Intervention and Inflation<br />
Federal Intervention and Inflation - Continued<br />
Economic Outlook<br />
National Payroll Job Growth Summary<br />
Section Three The <strong>Houston</strong> Metro Economy 16<br />
Section Four The <strong>Houston</strong> Metro Office Market 19<br />
We expect more jobs to be trimmed from the public sector during<br />
the balance of 2013, as governments continue to cut their workforces<br />
to make up for budget shortfalls. At the Federal level, these cuts will<br />
largely be achieved through attrition. However, the national economy<br />
will continue to see overall job growth as public sector losses will<br />
be more than offset by continued growth in the private sector. On a<br />
bright note, many government agencies such as the Departments of<br />
Defense, Education, Agriculture and Justice were able to reduce the<br />
length of expected employee furloughs from the lower budget caps<br />
that took effect March 1st through cost-cutting measures and internal<br />
reviews.<br />
During the 12 months ending August 2013, the top three sectors in<br />
job gains were Professional/Business Services, Leisure/Hospitality,<br />
and Retail Trade – adding a total of 1.4 million new jobs. Retail<br />
employment is growing at a healthy rate, though retail jobs have<br />
less of a multiplier effect than many others due to their low wages.<br />
Retail employment is likely to get a boost from strong new-car sales,<br />
which are projected to experience a double-digit rise during 2013.<br />
Job losses were confined to the Federal government, State and Local<br />
government, and Information sectors over the past year, with a total<br />
net loss of 90,000 positions. Job losses in the public sphere are likely<br />
to continue, as governments have ongoing difficulties with financing<br />
and budgeting constraints. Most of those losses are likely to be in the<br />
Federal sector.<br />
PAYROLL JOB GROWTH<br />
United States | 12 Months Ending August 2013<br />
Professional/Business Services<br />
Leisure/Hospitality<br />
Retail Trade<br />
Education/Health<br />
Construction/Mining<br />
The Bureau of Labor Statistics projects that the economy will add 19.7<br />
million nonfarm payroll jobs from 2010 through 2020, for an average<br />
annual growth rate of 1.4%. This growth rate compares to a 1.1%<br />
annual average over the past 20 years. Education/Health is projected<br />
to be the leader in job growth through 2020, adding 6.5 million jobs.<br />
Professional/Business Services follows, adding 3.8 million positions.<br />
Although the Construction sector ranks third for the number of jobs<br />
added, this sector suffered severe job loss during the 2008 downturn<br />
and in 2020 likely will remain below its pre-recession employment<br />
peak.<br />
PROJECTED PAYROLL JOB GROWTH<br />
United States | December 2010 – December 2020<br />
Education/Health<br />
Professional/Business<br />
Construction/Mining<br />
Retail Trade<br />
State/Local Govt<br />
Leisure/Hospitality<br />
Other Services<br />
Transportation/Utilities<br />
Financial Activities<br />
Wholesale Trade<br />
Information<br />
Manufacturing<br />
Federal Govt<br />
-1,000 0 1,000 2,000 3,000 4,000 5,000 6,000 7,000<br />
Job Change (Thousands)<br />
Source: Bureau of Labor Statistics, Delta Associates; October 2013.<br />
Initial unemployment claims were falling in 2013 until October’s<br />
Federal government shutdown began to have an effect on filings.<br />
In mid-October, initial claims stood at 336,500 based on a 4-week<br />
moving average. This compares to the 15-year average of 378,500.<br />
We expect claims to hover at or slightly below current levels through<br />
the end of 2013.<br />
Section Five The <strong>Houston</strong> Metro Industrial Market 27<br />
Section Six Office and Industrial Investment Trends 32<br />
Section Seven The <strong>Houston</strong> Metro Multifamily Market 36<br />
Section Eight The <strong>Houston</strong> Metro Retail Market 38<br />
Foreword | Sponsors | Special Thanks, Acknowledgments & Representations | Contact<br />
10<br />
TRENDLINES® 2013<br />
Financial Activities<br />
Wholesale Trade<br />
Other Services<br />
Transportation/Utilities<br />
Manufacturing<br />
Information<br />
State and Local Government<br />
Federal Government<br />
-100,000 0 100,000 200,000 300,000 400,000 500,000 600,000 700,000<br />
Job Change<br />
Note: Data are not seasonally adjusted.<br />
Source: Bureau of Labor Statistics, Delta Associates; October 2013.<br />
INITIAL UNEMPLOYMENT CLAIMS<br />
United States | Four‐Week Moving Average<br />
Initial Unemployment Claims<br />
700,000<br />
650,000<br />
600,000<br />
550,000<br />
500,000<br />
450,000<br />
400,000<br />
350,000<br />
300,000<br />
250,000<br />
Peak in Initial Unemployment Claims<br />
(Week of 3/28/09) = 660,250<br />
Note: Data are seasonally adjusted.<br />
Source: U.S. Department of Labor, Delta Associates; October 2013.<br />
Jan-09<br />
Mar-09<br />
May-09<br />
Jul-09<br />
Sep-09<br />
Nov-09<br />
Jan-10<br />
Mar-10<br />
May-10<br />
Jul-10<br />
Sep-10<br />
Nov-10<br />
Jan-11<br />
Mar-11<br />
May-11<br />
Jul-11<br />
Sep-11<br />
Nov-11<br />
Jan-12<br />
Mar-12<br />
May-12<br />
Jul-12<br />
Sep-12<br />
Nov-12<br />
Jan-13<br />
Mar-13<br />
May-13<br />
15-Year Average=378,500<br />
Jul-13<br />
Sep-13
The unemployment rate has declined to 7.3% as of August 2013, from<br />
8.1% one year earlier. The 7.3% rate is the lowest level since the end<br />
of 2008. We anticipate that the unemployment rate will hover around<br />
7.3% throughout the balance of 2013.<br />
NUMBER OF UNEMPLOYED VS. JOB OPENINGS<br />
12‐Month Average Ending July 2013<br />
Mining<br />
Information<br />
Financial activities<br />
Number of Job Openings<br />
TABLE OF CONTENTS<br />
UNEMPLOYMENT RATE<br />
United States<br />
12%<br />
Transportation<br />
and utilities<br />
Other services<br />
Government<br />
Construction<br />
Number of Unemployed<br />
Section One Summary 5<br />
Section Two The National Economy 9<br />
Recovery Endures as Private and Public Sectors Adapt<br />
Payroll Jobs<br />
Payroll Jobs - Continued<br />
Gross Domestic Product (GDP) and Consumption<br />
Housing Market<br />
Federal Intervention and Inflation<br />
Federal Intervention and Inflation - Continued<br />
Economic Outlook<br />
National Payroll Job Growth Summary<br />
Section Three The <strong>Houston</strong> Metro Economy 16<br />
Section Four The <strong>Houston</strong> Metro Office Market 19<br />
Section Five The <strong>Houston</strong> Metro Industrial Market 27<br />
Section Six Office and Industrial Investment Trends 32<br />
Section Seven The <strong>Houston</strong> Metro Multifamily Market 36<br />
Section Eight The <strong>Houston</strong> Metro Retail Market 38<br />
Foreword | Sponsors | Special Thanks, Acknowledgments & Representations | Contact<br />
11<br />
TRENDLINES® 2013<br />
U.S. Unemployment Rate<br />
10%<br />
8%<br />
6%<br />
4%<br />
2%<br />
0%<br />
80 82 84 86 88 90 92 94 96 98 00 02 04 06 08 10 12<br />
Note: Through August 2013; seasonally adjusted; shaded bars represent recessions.<br />
Source: Bureau of Labor Statistics, Delta Associates; October 2013.<br />
As of July 2013, for every job opening there are 3.1 potential<br />
applicants. This is well below the July 2009 peak of 6.7 applicants<br />
for every job and marginally less than the 10-year average of 3.2. The<br />
ratio has been 3:1 or greater since October 2008.<br />
JOB- SEEKERS RATIO<br />
United States<br />
Ratio<br />
7<br />
6<br />
5<br />
4<br />
3<br />
2<br />
1<br />
0<br />
10-Year Average = 3.2<br />
Jul-00 Jul-01 Jul-02 Jul-03 Jul-04 Jul-05 Jul-06 Jul-07 Jul-08 Jul-09 Jul-10 Jul-11 Jul-12 Jul-13<br />
Source: Bureau of Labor Statistics, Economic Policy Institute, Delta Associates; October 2013.<br />
Drilling down to job sectors, there are still too many potential<br />
applicants for too few jobs within each sector. This gap is most<br />
apparent in the construction sector, where for every job opening,<br />
there are 10.1 potential applicants as of July 2013. This gap is forcing<br />
many unemployed construction workers to revamp their skill sets in<br />
order to be hirable in another sector. Of note, the job seeker ratio<br />
for the construction industry fell from 12.5 in March 2013, which<br />
corresponds to the rebound in homebuilding seen this year. In<br />
comparison, the Education and Health Services sector has just 1.8<br />
applicants per job opening.<br />
Manufacturing<br />
Education and<br />
health services<br />
Professional and<br />
business services<br />
Leisure and<br />
hospitality<br />
Wholesale and<br />
retail trade<br />
0 200 400 600 800 1,000 1,200 1,400 1,600 1,800<br />
Thousands of Jobs<br />
Source: Bureau of Labor Statistics, Delta Associates; October 2013.<br />
GROSS DOMESTIC PRODUCT (GDP) AND<br />
CONSUMPTION<br />
GDP increased at a 2.5% annualized rate during the 2nd quarter of<br />
2013, compared to a 1.1% revised growth rate during the 1st quarter<br />
of 2013. The 20-year annual average growth rate is 2.5%. The rise in<br />
GDP during the 2nd quarter represents the 9th consecutive quarter in<br />
which the economy has expanded. Although the economy continues<br />
to make gains, the growth rate remains sub-par. Momentum may<br />
be returning to the economy as business and consumer confidence<br />
strengthens and Europe emerges from its 18-month recession. The<br />
consensus view of economists is that GDP growth may decelerate<br />
slightly through 2013 and into 2014 as Federal budget cuts due<br />
to sequestration filter through the economy, businesses work off<br />
inventories, and uncertainty permeates the world’s financial markets<br />
regarding the tapering of the Federal Reserve’s bond-buying program.<br />
GDP PERCENT CHANGE<br />
United States<br />
Annual GDP Change in 2009 Constant Dollars<br />
6%<br />
4%<br />
2%<br />
0%<br />
-2%<br />
-4%<br />
-6%<br />
-8%<br />
-10%<br />
20-Year Average = 2.5%<br />
Q1Q2Q3Q4Q1Q2Q3Q4Q1Q2Q3Q4Q1Q2Q3Q4Q1Q2Q3Q4Q1Q2Q3Q4Q1Q2<br />
07 07 07 07 08 08 08 08 09 09 09 09 10 10 10 10 11 11 11 11 12 12 12 12 13 13<br />
Note: Annualized.<br />
Source: Bureau of Economic Analysis, Delta Associates; October 2013.
TABLE OF CONTENTS<br />
Section One Summary 5<br />
Section Two The National Economy 9<br />
Recovery Endures as Private and Public Sectors Adapt<br />
Payroll Jobs<br />
Payroll Jobs - Continued<br />
Gross Domestic Product (GDP) and Consumption<br />
Housing Market<br />
Federal Intervention and Inflation<br />
Federal Intervention and Inflation - Continued<br />
Economic Outlook<br />
National Payroll Job Growth Summary<br />
Section Three The <strong>Houston</strong> Metro Economy 16<br />
Section Four The <strong>Houston</strong> Metro Office Market 19<br />
Section Five The <strong>Houston</strong> Metro Industrial Market 27<br />
Section Six Office and Industrial Investment Trends 32<br />
Due to uncertainty, public U.S. companies are hoarding cash, waiting<br />
for clear signals that the economy is on a consistent recovery curve.<br />
Uncertainty regarding the tapering of the Federal Reserve’s bondbuying<br />
program may further delay business investment. Corporate<br />
profits totaled $2.09 trillion during the 2nd quarter of 2013 on an<br />
annualized basis, just above the previous record of $2.01 trillion set<br />
in 2012. Companies have the resources to hire but remain wary about<br />
future demand for their products and services.<br />
U.S. CORPORATE PROFITS<br />
Corporate Profits in Trillions<br />
$2.5<br />
$2.0<br />
$1.5<br />
$1.0<br />
$0.5<br />
$0.0<br />
2000 2001 2002 2003 2004 2005 2006 2007 2008 2009 2010 2011 2012 2013*<br />
*Through Q2 2013; seasonally adjusted at annual rates.<br />
Source: Bureau of Economic Analysis, Delta Associates; October 2013.<br />
HOUSING MARKET<br />
Home prices in the 20 major metro areas increased 12.4% during<br />
the 12 months ending July 2013, the most recent data available,<br />
according to S&P/Case-Shiller. The housing market has performed<br />
well in 2013 after years of sub-par performance. Nationally, we expect<br />
home prices to rise around 12.0% from December 2012 to December<br />
2013, as any further growth may be restrained due to rising mortgage<br />
rates and more sellers entering the market.<br />
ANNUAL CHANGE IN EXISTING HOME SALE PRICES<br />
United States<br />
15%<br />
The number of U.S. home sales increased to 5.5 million (on an<br />
annualized basis) during August 2013, which is 18% above the 4.7<br />
million-unit pace for all of 2012. Existing home sales have remained<br />
above year-ago levels for 26 straight months. The average existing<br />
home sales price was $258,700 in August, which sits 15% above<br />
the year-end 2012 sales price and marks 18 consecutive months of<br />
year-over-year increases. If the inventory remains tight, prices could<br />
escalate further.<br />
U.S. EXISTING HOME SALES VS. SALES PRICE<br />
Number of Sales ‐ Thousands of Units<br />
6,500<br />
6,000<br />
5,500<br />
5,000<br />
4,500<br />
4,000<br />
3,500<br />
3,000<br />
Number of Existing Home Sales<br />
Average Existing Home Sales Price<br />
2006 2007 2008 2009 2010 2011 2012 2013*<br />
*Seasonally adjusted annual sales rate; data as of August 2013.<br />
Source: National Association of Realtors, Delta Associates; October 2013.<br />
FEDERAL INTERVENTION AND INFLATION<br />
$280,000<br />
$270,000<br />
$260,000<br />
$250,000<br />
$240,000<br />
$230,000<br />
$220,000<br />
$210,000<br />
$200,000<br />
Notwithstanding the stalemate in Congress over possibly amending<br />
sequestration, the Federal Reserve has remained active, vowing to do<br />
what it takes to keep U.S. economic growth on track.<br />
Given the economy continues to grow at a slow pace, the Fed plans to<br />
keep short-term rates at their current range of 0% to 0.25% until the<br />
unemployment rate drops to 6.5% or inflation becomes problematic.<br />
However, market forces began to drive up longer-term rates – with<br />
10-year U.S. Treasuries rising to 2.9% as of early September before<br />
declining to 2.6% in mid-October after the Fed announced it would<br />
continue its bond-buying program. In September, 30-year fixed-rate<br />
mortgages rose above 4.5% – their highest level in two years – before<br />
edging down again in October.<br />
Average Sales Price<br />
Section Seven The <strong>Houston</strong> Metro Multifamily Market 36<br />
Section Eight The <strong>Houston</strong> Metro Retail Market 38<br />
Percent Change for Median Price of<br />
Single ‐ Family Homes<br />
10%<br />
5%<br />
0%<br />
-5%<br />
-10%<br />
-15%<br />
-20%<br />
Foreword | Sponsors | Special Thanks, Acknowledgments & Representations | Contact<br />
-25%<br />
Jan Apr Jul Oct Jan Apr Jul Oct Jan Apr Jul Oct Jan Apr Jul Oct Jan Apr Jul Oct Jan Apr Jul<br />
2008 2009 2010 2011 2012 2013<br />
Note: Data reflect 20‐city composite index.<br />
Source: S&P/Case ‐ Shiller, Delta Associates; October 2013.<br />
12<br />
TRENDLINES® 2013
TABLE OF CONTENTS<br />
Section One Summary 5<br />
Section Two The National Economy 9<br />
Recovery Endures as Private and Public Sectors Adapt<br />
Payroll Jobs<br />
Payroll Jobs - Continued<br />
Gross Domestic Product (GDP) and Consumption<br />
Housing Market<br />
Federal Intervention and Inflation<br />
Federal Intervention and Inflation - Continued<br />
Economic Outlook<br />
National Payroll Job Growth Summary<br />
Section Three The <strong>Houston</strong> Metro Economy 16<br />
Section Four The <strong>Houston</strong> Metro Office Market 19<br />
Section Five The <strong>Houston</strong> Metro Industrial Market 27<br />
Section Six Office and Industrial Investment Trends 32<br />
Section Seven The <strong>Houston</strong> Metro Multifamily Market 36<br />
Section Eight The <strong>Houston</strong> Metro Retail Market 38<br />
Most pundits believe we are at the<br />
beginning of a trend of rising long-term<br />
rates after a period of inflated asset prices<br />
due to the easy money policies of the<br />
Federal Reserve. It is important to note that<br />
rates are expected to rise due to a reduction<br />
in buying by the Federal Reserve at the long<br />
end of the curve, and not from an increase<br />
in the Federal Funds rate. The real questions<br />
are:<br />
How fast will rates rise?<br />
How high will they go?<br />
What effect will they have on<br />
economic growth?<br />
For those in the commercial real<br />
estate industry, what impact will<br />
they have on cap rates and debt<br />
financing?<br />
Rising long-term interest rates? Time will tell,<br />
but this trend during an economic recovery<br />
is not new. The key to the speed with which<br />
this happens may be the temperament of<br />
our foreign bond holders and accelerating<br />
inflation – will U.S. debt continue to look<br />
attractive compared to alternatives? If so,<br />
then rates will remain lower longer. If not,<br />
then rates will rise faster sooner.<br />
FEDERAL FUNDS RATE<br />
Interest Rate<br />
20%<br />
16%<br />
12%<br />
8%<br />
4%<br />
0%<br />
78 80 82 84 86 88 90 92 94 96 98 00 02 04 06 08*<br />
*Unchanged since December 16, 2008.<br />
Source: Federal Reserve Board, Delta Associates; October 2013.<br />
Regarding inflation, prices increased 1.5% during the 12 months<br />
ending August 2013, the most recent data available. Real personal<br />
consumption expenditure (PCE), which takes into account changes in<br />
consumption habits, rose 2.0% during the 12 months ending August<br />
2013. We expect inflation to be contained in the near-term due to<br />
still-high unemployment rates and poor income growth, which may<br />
continue to inhibit significant gains in consumer spending. Given<br />
this, coupled with appropriate monetary measures, inflation looks<br />
soft and should remain around 2.0% during the balance of 2013.<br />
Many economists argue against tapering of the Federal Reserve’s<br />
asset-buying program if prices are not accelerating at a healthy rate.<br />
U.S. INFLATION AND REAL PERSONAL CONSUMPTION<br />
EXPENDITURES<br />
Percentage Change in CPI ‐ U<br />
16%<br />
14%<br />
12%<br />
10%<br />
8%<br />
6%<br />
4%<br />
2%<br />
0%<br />
-2%<br />
Inflation<br />
Real PCE<br />
-4%<br />
79 81 83 85 87 89 91 93 95 97 99 01 03 05 07 09 11 13*<br />
*12 ‐ month percentage change through August 2013. Note: data is seasonally adjusted.<br />
Source: Bureau of Labor Statistics, Bureau of Economic Analysis, Delta Associates; October 2013.<br />
Foreword | Sponsors | Special Thanks, Acknowledgments & Representations | Contact<br />
13<br />
TRENDLINES® 2013
TABLE OF CONTENTS<br />
Section One Summary 5<br />
Section Two The National Economy 9<br />
Recovery Endures as Private and Public Sectors Adapt<br />
Payroll Jobs<br />
Payroll Jobs - Continued<br />
Gross Domestic Product (GDP) and Consumption<br />
Housing Market<br />
Federal Intervention and Inflation<br />
Federal Intervention and Inflation - Continued<br />
Economic Outlook<br />
National Payroll Job Growth Summary<br />
Section Three The <strong>Houston</strong> Metro Economy 16<br />
Section Four The <strong>Houston</strong> Metro Office Market 19<br />
Section Five The <strong>Houston</strong> Metro Industrial Market 27<br />
Section Six Office and Industrial Investment Trends 32<br />
Section Seven The <strong>Houston</strong> Metro Multifamily Market 36<br />
Section Eight The <strong>Houston</strong> Metro Retail Market 38<br />
ECONOMIC OUTLOOK<br />
Thus far in 2013 there has been little residual impact from sequestration. The private and public sectors<br />
are each learning to adapt, and national economic growth has continued, though at a level that is weak<br />
for a post-recession recovery. Households should remain upbeat due to increases in net worth from home<br />
prices and the stock market, though the Federal government shutdown and debt ceiling fights in October<br />
may have weakened consumer confidence. On balance, we look for this recovery to continue on its slow<br />
but steady course through 2017 or so, barring a catastrophic event.<br />
Specifically, we believe the economic outlook is as follows:<br />
Real GDP growth<br />
Approximately 2.0% in 2013.<br />
Payroll jobs<br />
Approximately 2.3 million added in 2013.<br />
Housing<br />
Price increases of approximately 12% from December 2012 to December 2013.<br />
Unemployment rate<br />
Hovering around 7.3% throughout the remainder of 2013.<br />
Federal Funds Rate<br />
0% to 0.25% through year-end 2015.<br />
Long-term interest rates<br />
Edging higher during the rest of 2013.<br />
Inflation rate<br />
Remaining around 2.0% during the balance of 2013; higher in 2014 as consumer demand strengthens.<br />
Foreword | Sponsors | Special Thanks, Acknowledgments & Representations | Contact<br />
14<br />
TRENDLINES® 2013
NATIONAL PAYROLL JOB GROWTH SUMMARY<br />
The U.S. economy gained 2.2 million payroll jobs over the 12 months ending August 2013 (seasonally adjusted), representing an increase<br />
of 1.6%. This compares to the 25-year annual average of 1.3 million jobs at a 1.1% average growth rate.<br />
TABLE OF CONTENTS<br />
Section One Summary 5<br />
Section Two The National Economy 9<br />
Recovery Endures as Private and Public Sectors Adapt<br />
Payroll Jobs<br />
Payroll Jobs - Continued<br />
Gross Domestic Product (GDP) and Consumption<br />
Housing Market<br />
Federal Intervention and Inflation<br />
Federal Intervention and Inflation - Continued<br />
Economic Outlook<br />
National Payroll Job Growth Summary<br />
Section Three The <strong>Houston</strong> Metro Economy 16<br />
Section Four The <strong>Houston</strong> Metro Office Market 19<br />
Section Five The <strong>Houston</strong> Metro Industrial Market 27<br />
Section Six Office and Industrial Investment Trends 32<br />
Section Seven The <strong>Houston</strong> Metro Multifamily Market 36<br />
Section Eight The <strong>Houston</strong> Metro Retail Market 38<br />
U.S. PAYROLL JOB GROWTH<br />
YEAR 2013* 2012 2011 2010 2009 2008 2007 2006 2005 2004 2003 2002<br />
JOB CHANGE 2,206,000 2,237,000 1,589,000 -948,000 -5,990,000 -793,000 1,513,000 2,391,000 2,245,000 1,396,000 -352,000 -1,473,000<br />
%CHANGE 1.6% 1.7% 1.2% -0.7% -4.4% -0.6% 1.1% 1.8% 1.7% 1.1% -0.3% -1.1%<br />
*Seasonally-adjusted change for 12 months ending in August 2013; others are comparisons of annual averages. Note that BLS has rebenchmarked figures since their initial<br />
publication; the figures presented above are the most recent estimates.<br />
12-MONTH PAYROLL EMPLOYMENT CHANGE<br />
THROUGH AUGUST 2013<br />
JOB CHANGE<br />
12-MONTH PAYROLL EMPLOYMENT CHANGE<br />
THROUGH AUGUST 2013 — CONT’D<br />
JOB CHANGE<br />
METRO AREA # % METRO AREA # %<br />
New York 172,800 2.0% Washington, DC 33,400 1.1%<br />
Dallas/Ft. Worth 111,000 3.7% Nashville 26,300 3.3%<br />
LA Basin Austin 23,800 2.9%<br />
Los Angeles/Long Beach/Glendale 52,000 1.4% Charlotte 23,400 2.7%<br />
Santa Ana/Anaheim/Irvine 32,500 2.3% Baltimore 23,100 1.8%<br />
Riverside/San Bernardino/Ontario 8,100 0.7% Las Vegas 22,200 2.7%<br />
Subtotal LA Basin 92,600 1.5% Salt Lake City 20,800 3.2%<br />
<strong>Houston</strong> 80,700 3.0% Portland (OR) 19,500 1.9%<br />
Boston (Metropolitan NECTA) 64,700 2.6% Orlando 19,400 1.9%<br />
Atlanta 57,100 2.4% Columbus (OH) 17,000 1.8%<br />
Minneapolis-St. Paul 57,000 3.2% Pittsburgh 15,300 1.3%<br />
Chicago 53,700 1.2% San Diego 14,800 1.2%<br />
San Francisco Bay Area Oklahoma City 13,800 2.3%<br />
San Francisco/San Mateo/Redwood City 18,200 1.8% Indianapolis 12,200 1.3%<br />
San Jose/Sunnyvale/Santa Clara 28,000 3.1% Cincinnati 11,500 1.1%<br />
Oakland/Fremont/Hayward 3,800 0.4% St. Louis 11,000 0.8%<br />
Subtotal Bay Area 50,000 1.7% Jacksonville 10,500 1.8%<br />
Seattle 45,500 2.6% Kansas City 10,000 1.0%<br />
Phoenix 42,200 2.4% Detroit (Detroit/Warren/Livonia) 9,000 0.5%<br />
Tampa-St. Pete 41,700 3.6% San Antonio 7,800 0.9%<br />
Denver-Boulder 41,900 3.7% New Orleans 6,500 1.2%<br />
South Florida Memphis 4,700 0.8%<br />
Fort Lauderdale 22,700 3.1% Raleigh-Durham 4,500 0.6%<br />
Miami/Miami Beach/Kendall 2,900 0.3% Sacramento 2,600 0.3%<br />
Foreword | Sponsors | Special Thanks, Acknowledgments & Representations | Contact<br />
West Palm Beach/Boca Raton 9,500 1.8% Cleveland (7,900) -0.8%<br />
15<br />
TRENDLINES® 2013<br />
Subtotal South Florida 35,100 1.5%<br />
Philadelphia 33,600 1.2%<br />
Source: Bureau of Labor Statistics, Delta Associates; October 2013.
TABLE OF CONTENTS<br />
Section One Summary 5<br />
Section Two The National Economy 9<br />
Section Three The <strong>Houston</strong> Metro Economy 16<br />
Local Economy Among Nation’s Strongest<br />
Local Economy Among Nation’s Strongest - Continued<br />
The <strong>Houston</strong> Metro Area Economic Outlook<br />
Section Four The <strong>Houston</strong> Metro Office Market 19<br />
Section Five The <strong>Houston</strong> Metro Industrial Market 27<br />
Section Six Office and Industrial Investment Trends 32<br />
Section Seven The <strong>Houston</strong> Metro Multifamily Market 36<br />
Section Eight The <strong>Houston</strong> Metro Retail Market 38<br />
Foreword | Sponsors | Special Thanks, Acknowledgments & Representations | Contact<br />
16<br />
TRENDLINES® 2013<br />
Local Economy Among Nation’s Strongest<br />
The <strong>Houston</strong> metro economy continued to improve during 2013. The<br />
12-month employment growth of 80,700 jobs through August 2013 is<br />
fourth-most in the nation among large metro areas. <strong>Houston</strong>’s payroll<br />
employment rose by 3.0% during that period, above the national<br />
growth of 2.4%. The Energy, Construction, and Trade/Transportation<br />
Sectors are fueling growth, and <strong>Houston</strong>’s other core industries are<br />
continuing to expand, including the Leisure/Hospitality sector.<br />
PAYROLL JOB GROWTH<br />
Large Metro Areas | 12 Months Ending August 2013<br />
Payroll Jobs in Thousands<br />
180<br />
160<br />
140<br />
120<br />
100<br />
80<br />
60<br />
40<br />
20<br />
0<br />
80.7<br />
NY DFW LA BASIN HOU BOS ATL CHI PHX DEN S.FLA WAS SF BAY<br />
Source: Bureau of Labor Statistics, Delta Associates; October 2013.<br />
Unemployment Rate<br />
PAYROLL JOB GROWTH<br />
<strong>Houston</strong> Metro | 1991 – August 2013<br />
Annual Job Growth (in Thousands)<br />
120<br />
100<br />
80<br />
60<br />
40<br />
20<br />
0<br />
-20<br />
-40<br />
-60<br />
-80<br />
08<br />
07<br />
06<br />
05<br />
04<br />
03<br />
02<br />
01<br />
00<br />
99<br />
98<br />
97<br />
96<br />
95<br />
94<br />
93<br />
92<br />
91<br />
22-Year Average<br />
Job Growth =<br />
43,600/Year<br />
*12-month job growth through August 2013.<br />
Source: Bureau of Labor Statistics, Delta Associates; October 2013.<br />
UNEMPLOYMENT RATES<br />
Large Metro Areas | August 2012 vs. August 2013<br />
12%<br />
10%<br />
8%<br />
6%<br />
4%<br />
2%<br />
0%<br />
August 2012<br />
August 2013<br />
National Average<br />
8.1%<br />
7.3%<br />
13*<br />
12<br />
11<br />
10<br />
09<br />
The <strong>Houston</strong> area unemployment rate dropped to 6.1% in August<br />
2013, the most recent data available at this writing, from 6.9% in<br />
August 2012. The national unemployment rate was at 7.3% in August<br />
2013, down from 8.1% one year prior.<br />
WAS DFW HOU BOS DEN SF BAY S.FLA PHX NY ATL CHI LA BASIN<br />
Source: Bureau of Labor Statistics, Delta Associates; October 2013.<br />
Metro <strong>Houston</strong>’s core industries continue to<br />
lead growth:<br />
Energy (Mining/Logging)<br />
6,200 jobs added over the 12 months ending August 2013 – a 6.0%<br />
increase.<br />
Professional Services<br />
12,000 jobs added over the 12 months ending August 2013 – a 2.9%<br />
increase.<br />
Construction<br />
8,200 jobs were added during the 12 months ending August 2013 – a<br />
4.5% increase.<br />
Manufacturing<br />
5,900 jobs were added over the 12 months ending in August 2013 – a<br />
2.4% increase.<br />
Trade/Transportation<br />
19,200 jobs added in the 12 months ending August 2013 – a 3.5%<br />
increase<br />
Core Industries<br />
<strong>Houston</strong> Metro | 2012<br />
Core Industries $ (Bil) % GRP<br />
Energy $115 27%<br />
Financial, Professional, Tech $56 13%<br />
Construction $39 9%<br />
Federal & State Government $34 8%<br />
Manufacturing $26 6%<br />
Medical/Educational $17 4%<br />
Trade/Transportation $17 4%<br />
Total Core Industries: $304 71%<br />
Other $124 29%<br />
Total GRP: $428 100%<br />
Source: BEA, BLS, GMU Center for Regional Analysis, Delta Associates; October 2013. GRP = Gross Regional<br />
Product.<br />
Employment in <strong>Houston</strong>’s Mining sector increased by 6,200 jobs, or<br />
6.0%, in the 12-month period ending in August 2013. In addition, the<br />
U.S. rotary rig count was at 1,744 in late-September, down from late-<br />
August and from the average of 1,919 in 2012. Benchmark crude<br />
oil prices stood at $110 per barrel for Brent and $101 for WTI as of<br />
mid-October. The Brent price is considered a more accurate global<br />
indicator and is the only source used by the U.S. Energy Department<br />
for its price forecasts. Oil and gas shale plays are not only set to boost<br />
the <strong>Houston</strong> market but also the national market. As a result, there<br />
will be increased investments in energy companies, an estimated 3.3<br />
million jobs created by 2020, and a reduction in electricity prices,<br />
according to a recent study by HIS, Inc. While the nation as a whole<br />
will benefit, <strong>Houston</strong> will enjoy substantial benefits from being at the<br />
hub of this activity.
TABLE OF CONTENTS<br />
Section One Summary 5<br />
Section Two The National Economy 9<br />
Section Three The <strong>Houston</strong> Metro Economy 16<br />
Local Economy Among Nation’s Strongest<br />
Local Economy Among Nation’s Strongest - Continued<br />
The <strong>Houston</strong> Metro Area Economic Outlook<br />
Section Four The <strong>Houston</strong> Metro Office Market 19<br />
Section Five The <strong>Houston</strong> Metro Industrial Market 27<br />
Section Six Office and Industrial Investment Trends 32<br />
Section Seven The <strong>Houston</strong> Metro Multifamily Market 36<br />
Section Eight The <strong>Houston</strong> Metro Retail Market 38<br />
U.S. ROTARY RIG COUNT<br />
1990 – 2013<br />
Annual Average Working Rigs<br />
2,000<br />
1,800<br />
1,600<br />
1,400<br />
1,200<br />
1,000<br />
800<br />
600<br />
400<br />
200<br />
0<br />
90<br />
91<br />
92<br />
93<br />
94<br />
95<br />
96<br />
97<br />
98<br />
99<br />
00<br />
01<br />
02<br />
03<br />
04<br />
05<br />
06<br />
07<br />
08<br />
09<br />
10<br />
11<br />
12<br />
Source: Baker Hughes, Delta Associates; October 2013. *Count as of 9/27/13.<br />
The Construction sector added 8,200 jobs during the 12 months<br />
ending August 2013 – a 4.5% increase. As <strong>Houston</strong>’s economy gains<br />
strength, commercial and residential construction are increasing.<br />
Of note, office construction is picking up in the Katy Freeway/<br />
Energy Corridor and remains substantial in the Woodlands/Conroe<br />
submarkets. Part of the overall increase in <strong>Houston</strong>-area office<br />
construction is due to the 3.0 million SF ExxonMobil campus in The<br />
Woodlands. However, a number of additional projects are helping<br />
drive increased construction to these areas. Over 4.3 million SF is<br />
under construction in the Katy Freeway/Energy Corridor submarket<br />
and over 4.2 million SF in the Woodlands/Conroe submarket.<br />
<strong>Houston</strong>’s Manufacturing sector employment increased by 5,900<br />
jobs over the 12 months ending in August 2013, a gain of 2.4%. The<br />
<strong>Houston</strong> Purchasing Managers Index, a short-term leading indicator<br />
of production, measured 60.8 in September 2013 and has been in<br />
expansion every month since October 2009. (A score above 50<br />
indicates expansion.) The outlook for the manufacturing sector is<br />
dependent on other sectors, such as energy and the state of consumer<br />
confidence. Both areas are doing well in <strong>Houston</strong>, which bodes well<br />
for manufacturing. Companies such as Cosentino North America<br />
are taking advantage of such prime conditions. The manufacturer,<br />
fabricator, and distributor of natural stone will be opening 12<br />
additional showrooms across the nation by the end of 2014, with the<br />
largest one set to open in <strong>Houston</strong>. Approximately 250 of Cosentino’s<br />
900 employees are located in <strong>Houston</strong>.<br />
13*<br />
The Education and Health Services sector continues to grow, adding<br />
13,400 jobs in the 12 months ending August 2013 – a 4.1% increase. As<br />
baby boomers age, many <strong>Houston</strong> healthcare businesses are starting<br />
to focus more on this demographic. Four of the five largest assisted<br />
living communities in the metro area either have plans to expand or<br />
have recently expanded. Companies such as the Laser Spine Institute<br />
are opening offices in the area to attend to the increasing needs<br />
of aging <strong>Houston</strong>ians. According to the Census Bureau, <strong>Houston</strong>’s<br />
population over 65 years old increased 17.7% from 2000 to 2010,<br />
and it will only increase more in this decade. In the Education sector,<br />
a professor at the University of <strong>Houston</strong> has developed a nanocoating<br />
business called C-Voltaics that started as a university research project.<br />
Based out of UH’s Energy Research Park, C-Voltaics plans on ramping<br />
up production to 2,000 to 3,000 gallons of the nanocoating by the<br />
end of the year. Businesses like this are advantageous for universities<br />
as they bring in money and attract more researchers to develop their<br />
own technologies. With <strong>Houston</strong>’s abundant resources, research and<br />
development is set to continue expanding.<br />
Trade/Transportation added 19,200 jobs during the 12 months<br />
ending in July 2013 – a 3.5% increase. However, <strong>Houston</strong>’s airports are<br />
on track to have slightly less air freight than in 2012. The Metropolitan<br />
Transit Authority of Harris County is considering changes to its bus<br />
routes that could cut costs. Part of the plan would involve using<br />
smaller buses for shorter routes that also have fewer riders and<br />
also cutting some routes altogether. The changes would affect less<br />
than 1% of riders and would not impact low-income or minority<br />
neighborhoods as required by the Department of Transportation.<br />
New routes would target areas with the highest ridership rather than<br />
trying to accommodate as many areas as possible.<br />
HOUSTON AIRPORT SYSTEM<br />
Air Freight | 1999 – August 2013<br />
Air Freight (000 lbs)<br />
450,000<br />
425,000<br />
400,000<br />
375,000<br />
350,000<br />
325,000<br />
Long-Term Average:<br />
364 metric tons/annum<br />
HOUSTON MANUFACTURING OUTLOOK<br />
Purchasing Managers Index | 2002 – August 2013<br />
300,000<br />
99<br />
00<br />
01<br />
Source: <strong>Houston</strong> Airport System, Delta Associates; October 2013.<br />
02<br />
03<br />
04<br />
05<br />
06<br />
07<br />
08<br />
09<br />
10<br />
11<br />
12<br />
13*<br />
*YTD annualized.<br />
Foreword | Sponsors | Special Thanks, Acknowledgments & Representations | Contact<br />
17<br />
TRENDLINES® 2013<br />
Index<br />
70<br />
65<br />
60<br />
55<br />
50<br />
45<br />
40<br />
35<br />
30<br />
02 03 04 05 06 07 08 09 10 11 12 13<br />
Source: NAPM –<strong>Houston</strong>, Delta Associates; October 2013.<br />
Expansion<br />
Contraction<br />
In Housing, the <strong>Houston</strong> Association of Realtors reported a 16.2%<br />
increase in single-family home sales volume in August 2013,<br />
compared to August 2012. The average single-family home sale price<br />
was $260,607 in August 2013 which is 16.4% higher than the average<br />
price for August 2012. The median price was $186,200 in August<br />
2013, up 12.8% from August 2012. These figures are the highest ever<br />
for the month of August in <strong>Houston</strong>. The number of active listings at<br />
the end of August 2013 fell 18.9% from August 2012, indicating there<br />
is more demand and less inventory available.
TABLE OF CONTENTS<br />
Section One Summary 5<br />
Section Two The National Economy 9<br />
Section Three The <strong>Houston</strong> Metro Economy 16<br />
Local Economy Among Nation’s Strongest<br />
Local Economy Among Nation’s Strongest - Continued<br />
The <strong>Houston</strong> Metro Area Economic Outlook<br />
Section Four The <strong>Houston</strong> Metro Office Market 19<br />
The <strong>Houston</strong> Metro Area Economic Outlook<br />
<strong>Houston</strong>’s economic outlook is bright and it should remain strong for several years to come. Economic<br />
uncertainty and political instability in the Middle East does cause some concern, but <strong>Houston</strong> is in a strong<br />
position to withstand any slowdown in economic growth. Forbes recently ranked <strong>Houston</strong> as third on its “Best<br />
Cities for Future Job Growth” list out of the 200 largest metro areas in the nation. Additionally, <strong>Houston</strong> ranked<br />
first in the nation for job growth in the engineering field by Monster.com, and Texas ranked fourth in the<br />
nation for job growth in technology by Dice.com, which was heavily attributed to healthcare technology jobs<br />
in <strong>Houston</strong>.<br />
The energy sector has been a boon for <strong>Houston</strong> and not only because of its oil and gas production. Wind<br />
power is another source of production. Strength in the Energy, Trade/Transportation, and Education and<br />
Health Services sectors will drive expansion locally over the next several years. As a result, we expect metro<br />
<strong>Houston</strong>’s job growth to average approximately 91,700 per year for the 2013-2015 period, comparable to the<br />
growth during the 2005-2007 expansion period. <strong>Houston</strong>’s employment growth should be among the nation’s<br />
strongest.<br />
Section Five The <strong>Houston</strong> Metro Industrial Market 27<br />
Section Six Office and Industrial Investment Trends 32<br />
JOB FORECAST<br />
<strong>Houston</strong> Metro | 2013 – 2015<br />
OFFICE ABSORPTION AND EMPLOYMENT<br />
<strong>Houston</strong> Metro | 1980 – 3 RD Quarter 2013<br />
Section Seven The <strong>Houston</strong> Metro Multifamily Market 36<br />
Section Eight The <strong>Houston</strong> Metro Retail Market 38<br />
Annual Job Growth<br />
120,000<br />
100,000<br />
80,000<br />
60,000<br />
40,000<br />
20,000<br />
0<br />
Avg. Annual Growth<br />
2005-07 =<br />
87,300/annum<br />
Projected Avg.<br />
Annual Growth<br />
2013-15 =<br />
91,700/annum<br />
Net Absorption (Millions of SF)<br />
14<br />
12<br />
10<br />
8<br />
6<br />
4<br />
2<br />
0<br />
-2<br />
-4<br />
Change in Employment (000’s)<br />
Net Absorption (Millions of SF)<br />
150<br />
100<br />
50<br />
0<br />
-50<br />
-100<br />
Change in Employment (000’s)<br />
-20,000<br />
*12-month employment growth through August 2013. YTD 2013 net absorption annualized.<br />
Source: Bureau of Labor Statistics, Delta Associates; October 2013.<br />
-40,000<br />
-60,000<br />
-80,000<br />
2003 2004 2005 2006 2007 2008 2009 2010 2011 2012 2013 2014 2015<br />
Source: Bureau of Labor Statistics, Delta Associates; October 2013.<br />
Foreword | Sponsors | Special Thanks, Acknowledgments & Representations | Contact<br />
18<br />
TRENDLINES® 2013
TABLE OF CONTENTS<br />
Section One Summary 5<br />
Section Two The National Economy 9<br />
Section Three The <strong>Houston</strong> Metro Economy 16<br />
Section Four The <strong>Houston</strong> Metro Office Market 19<br />
19<br />
Office Market Expanding<br />
Consistent Demand for Office Space<br />
Vacancy Remains Low<br />
Development Pipeline Growing<br />
Office Asking Rents Rising<br />
The <strong>Houston</strong> Metro Area Office Market Outlook<br />
Summary Of Office Market Indicators - All Space<br />
Summary Of Office Market Indicators - Class A Space<br />
Summary Of Office Market Indicators - Class B Space<br />
Asking Rental Rate Analysis Of Class A & B Office Buildings<br />
Section Five The <strong>Houston</strong> Metro Industrial Market 27<br />
Section Six Office and Industrial Investment Trends 32<br />
Section Seven The <strong>Houston</strong> Metro Multifamily Market 36<br />
Section Eight The <strong>Houston</strong> Metro Retail Market 38<br />
Foreword | Sponsors | Special Thanks, Acknowledgments & Representations | Contact<br />
TRENDLINES® 2013<br />
Office Market Expanding<br />
The <strong>Houston</strong> metro office market experienced growth in 2013, as the<br />
local economy expands at a healthy rate. Job creation, especially<br />
among energy-related firms, has driven office leasing activity, and<br />
tenants are seeking quality space in prime submarkets.<br />
CONSISTENT Demand for Office Space<br />
Net absorption totaled 1.3 million SF in the first three quarters of 2013<br />
(1.7 million SF when annualized), compared to 4.2 million SF in all of<br />
2012. The Class A market accounted for that entire total, absorbing<br />
1.4 million SF, with Class B reporting negative absorption in the<br />
<strong>Houston</strong> market. Positive Class A absorption is occurring because of<br />
the strength of the local economy. Owners are looking for tenants to<br />
fill Class A space before new buildings currently under construction<br />
come online.<br />
Net absorption by class (SF):<br />
2012 YTD 2013<br />
Class A 2,969,000 1,415,000<br />
Class B 1,183,000 (146,000)<br />
Class C 70,000 (8,000)<br />
How the Multi-Tenant Market Compares to<br />
Our Market Coverage<br />
Vacancy and absorption in the <strong>Houston</strong> metro area often are<br />
reported by brokerage firms on multi-tenant buildings only. We<br />
include owner-occupied and single-tenant buildings as well,<br />
on the basis of immediate availability, to capture more market<br />
activity. We exclude government-owned space. As a point of<br />
comparison, below is data for the <strong>Houston</strong> multi-tenant office<br />
market at Q3 2013:<br />
Multi-Tenant Entire Market<br />
Inventory: 204.3 MSF 253.3 MSF<br />
Overall vac. (incl. sublet): 13.3% 10.9%<br />
YTD net absorption: 689,000 SF 1.3 MSF<br />
Net Absorption (SF) in Selected Submarkets:<br />
2012 YTD 2013<br />
Woodlands/Conroe 640,000 483,000<br />
Katy Freeway/Energy Corridor 1,211,000 429,000<br />
Southwest Freeway/Sugarland 280,000 356,000<br />
West Loop (337,000) 513,000<br />
Available sublease space in the <strong>Houston</strong> metro currently stands at 1.3<br />
million SF – just 0.5% of the standing inventory.<br />
Notable 2013 leases<br />
include:<br />
• ConocoPhillips pre-leased<br />
846,604 SF at 935 N. Eldridge<br />
Parkway and 925 N. Eldridge<br />
Parkway in Katy Freeway West.<br />
• WesternGeco leased 554,385 SF<br />
at 10001 Richmond Avenue in the<br />
Westchase submarket.<br />
• Technip pre-leased 428,831 SF<br />
at 11740 Katy Freeway in Katy<br />
Freeway West.<br />
• Swift Energy Company pre-leased<br />
236,880 SF at Five Chasewood<br />
Drive in the FM 1960/Highway<br />
249 submarket.<br />
• Huntsman International LLC<br />
renewed 158,598 SF at 10003<br />
Woodloch Forest Drive in The<br />
Woodlands submarket.<br />
• TETRA Technologies, Inc. renewed<br />
152,999 SF at 24955 I-45 North in<br />
The Woodlands submarket.<br />
• Subsea 7 pre-leased 96,292 SF<br />
at 17220 Katy Freeway in Katy<br />
Freeway West.
NET ABSORPTION OF OFFICE SPACE<br />
SELECT METRO AREAS<br />
January Through September 2013<br />
TABLE OF CONTENTS<br />
Section One Summary 5<br />
Section Two The National Economy 9<br />
Section Three The <strong>Houston</strong> Metro Economy 16<br />
Section Four The <strong>Houston</strong> Metro Office Market 19<br />
Office Market Expanding<br />
Consistent Demand for Office Space<br />
Vacancy Remains Low<br />
Why This Methodology Is the Best<br />
Indicator Of Current Market Conditions<br />
We include owner-occupied and single-tenant buildings in<br />
our inventory, vacancy, and absorption statistics. Doing so<br />
allows us to capture more market activity than many of our<br />
competitors, and to better correlate changes in the market with<br />
changes in employment. As single-tenant space does compete<br />
with multi-tenant space, we believe it is critical to understand<br />
all components of the market. We also offer wider geographic<br />
coverage than some of our competitors. The result is that the<br />
inclusion of single-tenant and owner-occupied space tends to<br />
yield lower vacancy rates and higher absorption totals than our<br />
competitors’ results, but our coverage of the market is more<br />
comprehensive.<br />
Millions of SF<br />
7<br />
6<br />
5<br />
4<br />
3<br />
2<br />
1<br />
Development Pipeline Growing<br />
0<br />
Office Asking Rents Rising<br />
The <strong>Houston</strong> Metro Area Office Market Outlook<br />
Strong job creation and the continued strength of the energy sector<br />
have put <strong>Houston</strong> on pace to absorb 1.7 million SF during 2013. New<br />
York and the San Francisco Bay Area lead the nation in office space<br />
absorbed this year, while <strong>Houston</strong> ranks eighth.<br />
-1<br />
NY SF BAY DFW LA/OC ATL BOS PHX HOU S. FLA DEN WAS CHI<br />
Source: CoStar, Delta Associates; October 2013.<br />
Summary Of Office Market Indicators - All Space<br />
Summary Of Office Market Indicators - Class A Space<br />
Summary Of Office Market Indicators - Class B Space<br />
Asking Rental Rate Analysis Of Class A & B Office Buildings<br />
Section Five The <strong>Houston</strong> Metro Industrial Market 27<br />
Section Six Office and Industrial Investment Trends 32<br />
Section Seven The <strong>Houston</strong> Metro Multifamily Market 36<br />
Section Eight The <strong>Houston</strong> Metro Retail Market 38<br />
NET ABSORPTION OF OFFICE SPACE AND<br />
VACANCY RATE TRENDS<br />
<strong>Houston</strong> Metro | 1998 – 3 RD Quarter 2013<br />
Net Absorption in Thousands of SF<br />
8,000<br />
7,000<br />
6,000<br />
5,000<br />
4,000<br />
3,000<br />
2,000<br />
1,000<br />
0<br />
-1,000<br />
-2,000<br />
Net Absorption in Thousands of SF<br />
Direct Vacancy Rate<br />
16%<br />
14%<br />
12%<br />
10%<br />
8%<br />
6%<br />
4%<br />
2%<br />
Direct Vacancy Rate<br />
Vacancy Remains Low<br />
The overall office vacancy rate (including sublet space) in the <strong>Houston</strong><br />
metro area was 10.9% at 3rd quarter 2013, unchanged from one year<br />
ago. The direct vacancy rate was 10.4%, down from 10.6% one year<br />
ago. The continued strength of the local economy is driving this rate<br />
down; direct vacancy is nearing its recent nadir of 10.2% in 2007.<br />
The overall Class A vacancy rate is 8.2%, compared to 8.6% a year<br />
ago. Overall 3rd quarter 2013 vacancy rates for all classes in selected<br />
submarkets:<br />
• Katy Fwy/Energy Corridor 5.8%<br />
• Woodlands/Conroe 6.2%<br />
• Downtown 9.9%<br />
• West Loop 11.0%<br />
Foreword | Sponsors | Special Thanks, Acknowledgments & Representations | Contact<br />
-3,000<br />
98 99 00 01 02 03 04 05 06 07 08 09 10 11 12 13<br />
0%<br />
• Southwest Freeway/Sugar Land 16.4%<br />
20<br />
TRENDLINES® 2013<br />
Source: CoStar, Delta Associates; October 2013.<br />
Note: Delivery of pre-leased space counts as positive net absorption.
TABLE OF CONTENTS<br />
Section One Summary 5<br />
Section Two The National Economy 9<br />
Section Three The <strong>Houston</strong> Metro Economy 16<br />
Section Four The <strong>Houston</strong> Metro Office Market 19<br />
Office Market Expanding<br />
Consistent Demand for Office Space<br />
Vacancy Remains Low<br />
Development Pipeline Growing<br />
Office Asking Rents Rising<br />
The <strong>Houston</strong> Metro Area Office Market Outlook<br />
Summary Of Office Market Indicators - All Space<br />
Summary Of Office Market Indicators - Class A Space<br />
Summary Of Office Market Indicators - Class B Space<br />
Asking Rental Rate Analysis Of Class A & B Office Buildings<br />
The overall office vacancy rate (including sublet space) in the <strong>Houston</strong><br />
metro will likely stabilize over the next two years, as the increased<br />
demand for new space in select submarkets is nearly balanced by an<br />
increased pipeline and rising vacancy in aged buildings. Given this,<br />
we expect an overall vacancy rate in the low-11% range in two years.<br />
Still, without a major disruption in the regional economy, a period of<br />
consistent rent growth is on the horizon. However, the pipeline of new<br />
construction is rising along with potential increased demand.<br />
OFFICE VACANCY RATE<br />
<strong>Houston</strong> Metro | 1983 – 3 RD Quarter 2013<br />
Direct Vacancy Rate<br />
OFFICE VACANCY RATES<br />
Selected Metro Areas | 3 RD Quarter 2013<br />
Overall Vacancy Rate<br />
30%<br />
25%<br />
20%<br />
15%<br />
10%<br />
5%<br />
0%<br />
20%<br />
15%<br />
10%<br />
National Vacancy<br />
Rate: 13.3%<br />
12.1%<br />
9.9% 10.3%10.9%10.9% 11.2%<br />
12.7%13.4%13.5% 13.7% 15.5% 15.8%<br />
10.4%<br />
Source: CoStar, Delta Associates; October 2013. *As of Q3 2013.<br />
19.4%<br />
Office Space Under Construction or<br />
Renovation IN THE <strong>Houston</strong> Metro Area<br />
Submarket<br />
OFFICE SPACE UNDER CONSTRUCTION<br />
Selected Metro Areas | 3 RD Quarter 2013<br />
14<br />
12<br />
SF<br />
%<br />
Pre-leased<br />
Downtown 736,000 47.6%<br />
FM 1960 220,915 100.0%<br />
Katy Fwy/Energy Corridor 4,305,809 74.7%<br />
Northwest 417,897 50.2%<br />
S Main/Medical Center 50,000 44.4%<br />
SW Fwy/Sugar Land 451,259 54.3%<br />
West Loop 513,454 61.9%<br />
Westchase 822,355 44.5%<br />
Woodlands/Conroe 4,257,133 93.9%<br />
Total 11,774,822 75.9%<br />
Source: Delta Associates’ analysis of CoStar data; October 2013<br />
Section Five The <strong>Houston</strong> Metro Industrial Market 27<br />
Section Six Office and Industrial Investment Trends 32<br />
Section Seven The <strong>Houston</strong> Metro Multifamily Market 36<br />
5%<br />
0%<br />
BOS SF BAY HOU NY OC DEN LA WAS S. FLA CHI ATL DFW PHX<br />
Source: CoStar, Delta Associates; October 2013.<br />
Millions of SF<br />
10<br />
8<br />
6<br />
4<br />
U/C Nationally<br />
= 71.8 Million SF<br />
Section Eight The <strong>Houston</strong> Metro Retail Market 38<br />
Foreword | Sponsors | Special Thanks, Acknowledgments & Representations | Contact<br />
21<br />
TRENDLINES® 2013<br />
Development Pipeline Growing<br />
There is 11.8 million SF of office space under construction or<br />
renovation in the <strong>Houston</strong> metro area as of September, compared to<br />
3.6 million SF one year ago. Space under construction is 76% preleased,<br />
compared to 46% a year ago.<br />
The largest projects under construction include Exxon’s new 3.0<br />
million SF campus and Anadarko Petroleum’s 550,000 SF corporate<br />
office, both of which are in the Woodlands/Conroe submarket. Also<br />
significant is Energy Center Three, a 547,000 SF project underway in<br />
Katy Freeway West.<br />
2<br />
0<br />
NY HOU BOS WAS SF BAY DFW CHI DEN LA/OC ATL<br />
Source: CoStar, Delta Associates; October 2013.<br />
S. FLA PHX
AVERAGE CHANGE IN ASKING RENT<br />
Select Metro Areas | January - September 2013<br />
5.0%<br />
4.0%<br />
TABLE OF CONTENTS<br />
Section One Summary 5<br />
Section Two The National Economy 9<br />
Section Three The <strong>Houston</strong> Metro Economy 16<br />
Section Four The <strong>Houston</strong> Metro Office Market 19<br />
22<br />
Office Market Expanding<br />
Consistent Demand for Office Space<br />
Vacancy Remains Low<br />
Development Pipeline Growing<br />
Office Asking Rents Rising<br />
The <strong>Houston</strong> Metro Area Office Market Outlook<br />
Summary Of Office Market Indicators - All Space<br />
Summary Of Office Market Indicators - Class A Space<br />
Summary Of Office Market Indicators - Class B Space<br />
Asking Rental Rate Analysis Of Class A & B Office Buildings<br />
Section Five The <strong>Houston</strong> Metro Industrial Market 27<br />
Section Six Office and Industrial Investment Trends 32<br />
Section Seven The <strong>Houston</strong> Metro Multifamily Market 36<br />
Section Eight The <strong>Houston</strong> Metro Retail Market 38<br />
Foreword | Sponsors | Special Thanks, Acknowledgments & Representations | Contact<br />
TRENDLINES® 2013<br />
The amount of office space under construction nationally is<br />
edging up, with market conditions gradually improving and<br />
financing becoming more available. Nationally, 71.8 million<br />
SF of office space is under construction today, compared<br />
to 64.8 million SF one year ago. <strong>Houston</strong> has the secondmost<br />
office space under construction, and at 11.8 million<br />
SF, it represents approximately 4.6% of the current metro<br />
inventory.<br />
Deliveries totaled 1.4 million SF through the 3rd quarter of<br />
2013, after totaling 1.0 million SF for all of 2012.<br />
Office Asking Rents Rising<br />
Asking rents for all classes of office space have risen<br />
approximately 1.0% in metro <strong>Houston</strong> during the first three<br />
quarters of 2013, after rising 3.6% in 2012. Class A rents<br />
rose 2.4% through the 3rd quarter of 2013, and Class B rents<br />
increased 0.7% in the same period. Class A rents have been<br />
rising faster than Class B rents because of the flight to quality<br />
underway, with stronger demand for newer space.<br />
AVERAGE OFFICE RENTS<br />
<strong>Houston</strong> Metro | 1982 –3 RD Quarter 2013<br />
Asking Rents ($’s/SF, FS)<br />
$26<br />
$24<br />
$22<br />
$20<br />
$18<br />
$16<br />
$14<br />
$12<br />
$10<br />
$8<br />
$18.11<br />
$14.80<br />
$11.70<br />
$11.92<br />
$19.18<br />
$23.78<br />
$24.93<br />
83 85 87 89 91 93 95 97 99 01 03 05 07 09 11 13<br />
Source: CoStar, Delta Associates; October 2013.<br />
Note: All Classes of Office Space.<br />
<strong>Houston</strong>’s asking rent growth looks average when compared<br />
to asking rent changes in other major markets. Rent growth<br />
in <strong>Houston</strong> is sixth in the country and nearly the same as<br />
comparable markets, such as Dallas /Fort Worth and Phoenix.<br />
Asking Rents, $/SF, FS<br />
3.0%<br />
2.0%<br />
1.0%<br />
0.0%<br />
-1.0%<br />
-2.0%<br />
-3.0%<br />
SF BAY DEN<br />
Asking rents average $28.08/SF, full service, for Class A buildings<br />
and $19.44/SF, full service, for Class B buildings. These are metrowide<br />
averages; newer buildings in more desirable submarkets are<br />
outperforming these market-wide averages.<br />
Metro-wide asking rents will likely increase during the balance of<br />
2013 and into 2014, as demand for space remains consistent. At<br />
the submarket level, asking rents will likely continue fluctuating,<br />
with landlords reacting quickly to changes in the market. Given the<br />
relatively strong demand for Class A space, rents for that product type<br />
should outperform in the period ahead.<br />
The <strong>Houston</strong> Metro Area<br />
Office Market Outlook<br />
The <strong>Houston</strong> metro office market will likely experience continued<br />
growth in the period ahead. However, given the growing pipeline,<br />
coupled with tenants vacating older space, we expect the vacancy<br />
rate to stabilize over the next two years – hovering in the low-11%<br />
range. Rents will likely continue rising modestly for the remainder<br />
of 2013 and into 2014, especially for Class A space, as office market<br />
conditions currently favor owners. However, with the development<br />
pipeline (including planned space expected to start construction<br />
soon) now at 5.3% of the standing inventory, rent increases are likely<br />
to remain modest. Of note, excluding Exxon’s build-to-suit campus,<br />
the development pipeline equals just 4.1% of the standing inventory.<br />
Office submarkets likely to outperform in the months ahead, with<br />
declining vacancy and rising rents, include:<br />
• Katy Freeway/Energy Corridor<br />
• Westchase<br />
• West Loop<br />
NY<br />
Source: CoStar, Delta Associates; October 2013.<br />
• Woodlands/Conroe<br />
LA/OC PHX HOU DFW ATL CHI S. FLA BOS<br />
The Katy Freeway/Energy Corridor in particular is a candidate for<br />
improved performance during the balance of 2013. However,<br />
competition for tenants is limiting rent growth, and more supply is due<br />
to come on the market soon, with 4.3 million SF under construction<br />
there. Therefore, investors should carefully balance strong demand<br />
forecasts against evolving market fundamentals.<br />
WAS
SUMMARY OF OFFICE MARKET INDICATORS - ALL SPACE<br />
<strong>Houston</strong> Metro Area | 2010 Through Third Quarter 2013<br />
Q3 2013 Direct Vacancy Rate at the End of: Q3 2013 Net Absorption (SF) 2/<br />
Submarket<br />
Total Bldgs<br />
Total<br />
Rentable SF<br />
All Bldgs. 1/<br />
SF Available<br />
Immediately 2010 2011 2012 Q3 2013<br />
All Bldgs. 2/<br />
Vacancy<br />
Rate w/<br />
Sublet<br />
SF Under<br />
Constr. or<br />
Renovation<br />
2010 2011 2012 Q3 2013 YTD 2013<br />
Central Business District 112 48,072,971 4,470,786 9.3% 9.5% 8.7% 9.3% 10.1% 330,000 (166,000) 1,552,000 385,000 (144,000) (288,000)<br />
Midtown 106 7,212,574 620,281 14.7% 13.2% 13.4% 8.6% 8.7% 406,000 22,000 108,000 (14,000) (7,000) 346,000<br />
Downtown 218 55,285,545 5,091,068 10.0% 10.0% 9.3% 9.2% 9.9% 736,000 (144,000) 1,660,000 371,000 (151,000) 58,000<br />
I-45 North 42 2,270,142 301,929 17.9% 16.3% 14.6% 13.3% 13.4% - (35,000) 36,000 38,000 14,000 30,000<br />
FM 1960 / Champions 68 2,958,692 683,458 18.6% 20.2% 23.4% 23.1% 23.8% - 77,000 (47,000) (95,000) 21,000 9,000<br />
FM 1960 / Highway 249 129 6,908,809 1,063,957 30.4% 26.2% 16.0% 15.4% 15.5% 220,915 120,000 134,000 752,000 28,000 54,000<br />
FM 1960 239 12,137,643 2,049,343 25.5% 22.9% 17.5% 16.9% 17.1% 220,915 162,000 123,000 695,000 63,000 93,000<br />
North Belt West/Greenspoint 90 10,688,423 1,688,771 13.3% 13.8% 13.0% 15.8% 16.4% - 42,000 (28,000) 85,000 (139,000) (299,000)<br />
Greenspoint / IAH 36 3,154,574 356,467 11.1% 12.6% 12.7% 11.3% 11.3% (47,000) (42,000) 11,000 135,000 132,000<br />
Greenspoint / North Belt 126 13,842,997 2,045,238 12.9% 13.6% 12.9% 14.8% 15.2% - (5,000) (70,000) 96,000 (4,000) (167,000)<br />
Greenway Plaza 99 12,166,960 1,131,527 11.5% 9.8% 9.7% 9.3% 9.7% - (12,000) 232,000 12,000 (49,000) 121,000<br />
Gulf Freeway/Pasadena 109 4,572,000 525,780 11.7% 12.6% 10.2% 11.5% 11.5% - 106,000 (41,000) 109,000 46,000 (59,000)<br />
Katy Freeway East 114 9,510,671 798,896 8.5% 7.3% 7.9% 8.4% 8.8% 538,052 331,000 105,000 364,000 57,000 146,000<br />
Katy Freeway West 171 21,734,098 956,300 14.2% 9.6% 5.7% 4.4% 4.5% 3,767,757 108,000 1,144,000 847,000 22,000 283,000<br />
Katy Fwy / Energy Corridor 285 31,244,769 1,755,197 12.4% 8.9% 6.4% 5.6% 5.8% 4,305,809 439,000 1,249,000 1,211,000 79,000 429,000<br />
Kingwood / Humble 46 1,822,176 118,441 8.4% 7.3% 6.4% 6.5% 7.2% - 17,000 47,000 20,000 5,000 39,000<br />
NASA / Clear Lake 171 9,643,387 1,552,585 7.5% 10.6% 12.8% 16.1% 16.2% - 104,000 (140,000) (212,000) 58,000 (318,000)<br />
Northeast 47 2,097,508 287,359 10.6% 12.3% 12.6% 13.7% 13.8% - 82,000 (35,000) (6,000) (6,000) 3,000<br />
North Loop West 71 5,497,896 951,136 21.7% 24.9% 18.4% 17.3% 19.8% 126,000 (178,000) (175,000) 358,000 16,000 (44,000)<br />
Northwest Near 27 1,986,836 286,104 9.8% 10.4% 8.5% 14.4% 14.4% - 87,000 (10,000) 30,000 (72,000) (108,000)<br />
Northwest Far 96 7,828,050 782,805 19.1% 12.2% 10.3% 10.0% 10.3% 291,897 110,000 540,000 149,000 (55,000) 23,000<br />
Northwest 194 15,312,782 2,020,045 19.1% 16.7% 13.1% 13.2% 14.2% 417,897 19,000 355,000 537,000 (111,000) (129,000)<br />
South Main / Medical Center 88 11,135,712 835,178 7.0% 6.9% 5.9% 7.5% 7.5% 50,000 (71,000) 12,000 112,000 (33,000) (177,000)<br />
Southwest / Hillcroft 59 4,743,707 716,300 19.2% 16.0% 14.9% 15.1% 15.1% - 65,000 152,000 52,000 14,000 (10,000)<br />
Southwest Beltway 8 98 7,354,337 1,610,600 16.6% 19.2% 21.1% 21.9% 22.0% - (190,000) (433,000) 112,000 15,000 (58,000)<br />
East Ft Bend Co. / Sugar Land 152 8,965,820 1,022,103 18.9% 16.6% 15.3% 11.4% 12.6% 451,259 (432,000) 227,000 116,000 193,000 424,000<br />
Southwest Fwy / Sugar Land 309 21,063,864 3,349,003 18.1% 17.4% 17.2% 15.9% 16.4% 451,259 (557,000) (54,000) 280,000 222,000 356,000<br />
Bellaire 42 4,748,537 379,883 7.0% 10.3% 10.2% 8.0% 8.4% - (4,000) (156,000) 5,000 0 104,000<br />
Post Oak Park 34 4,771,860 854,163 11.2% 9.9% 17.1% 17.9% 18.1% - 47,000 62,000 (344,000) 14,000 (38,000)<br />
Galleria 56 15,571,819 1,214,602 8.8% 9.0% 8.3% 7.8% 9.0% 513,454 321,000 (31,000) 31,000 31,000 365,000<br />
Riverway 22 3,086,415 274,691 9.5% 10.4% 10.3% 8.9% 8.9% - 12,000 (28,000) 4,000 (28,000) 43,000<br />
Richmond / Fountainview 44 1,783,906 372,836 6.7% 9.9% 19.4% 20.9% 20.9% - 76,000 (58,000) 12,000 (32,000) (27,000)<br />
San Felipe / Voss 43 5,489,762 559,956 11.2% 10.6% 11.4% 10.2% 10.5% - (71,000) 33,000 (45,000) 126,000 66,000<br />
West Loop 241 35,452,299 3,656,131 9.2% 9.7% 11.0% 10.3% 11.0% 513,454 381,000 (178,000) (337,000) 111,000 513,000<br />
Westchase 109 15,558,952 1,104,686 12.7% 11.4% 7.2% 7.1% 7.9% 822,355 (62,000) 203,000 694,000 16,000 16,000<br />
The Woodlands 142 10,307,344 494,753 9.9% 6.7% 3.9% 4.8% 5.1% 4,257,133 258,000 420,000 439,000 511,000 530,000<br />
Conroe 41 1,612,431 204,779 7.1% 7.1% 9.9% 12.7% 13.1% - (2,000) (27,000) 201,000 (34,000) (47,000)<br />
Woodlands / Conroe 183 11,919,775 699,531 9.5% 6.8% 4.9% 5.9% 6.2% 4,257,133 256,000 393,000 640,000 477,000 483,000<br />
TOTAL - <strong>Houston</strong> 2,464 253,256,369 26,221,112 12.3% 11.5% 10.3% 10.4% 10.9% 11,774,822 715,000 3,756,000 4,222,000 723,000 1,261,000<br />
Vacancy Rate with Sublet Space 12.9% 12.0% 10.7% 10.9%<br />
1/ Includes buildings 15,000 SF RBA and greater. Does not include buildings under construction or buildings owned by the government. Delta Associates, the research affiliate of <strong>Transwestern</strong>, is headquartered at: 500 Montgomery Street, Suite 600, Alexandria, VA 22314; Phone: 703-836-5700; DeltaAssociates.com<br />
2/ Does not include sublet space. Source: Inventory and Vacancy from analysis of CoStar data, Net Absorption computed by Delta Associates; October 2013.<br />
SECTION 4: THE HOUSTON METRO OFFICE MARKET
SUMMARY OF OFFICE MARKET INDICATORS - CLASS A SPACE 1/<br />
<strong>Houston</strong> Metro Area | 2010 Through Third Quarter 2013<br />
Q3 2013 Net Absorption (SF) 2/<br />
Submarket<br />
Total Bldgs<br />
Total Rentable<br />
SF<br />
All Bldgs. 1/<br />
SF Available<br />
Vacancy Rate<br />
Immediately Vacancy Rate 2/ w/ Sublet<br />
All Bldgs. 2/<br />
SF Under<br />
Constr. or<br />
Renovation<br />
2010 2011 2012 Q3 2013 YTD 2013<br />
Central Business District 31 30,200,614 2,053,642 6.8% 8.1% - (198,000) 1,406,000 212,000 (60,000) (151,000)<br />
Midtown 4 1,829,725 93,316 5.1% 5.1% - 2,000 9,000 82,000 11,000 16,000<br />
Downtown 35 32,030,339 2,146,958 6.7% 7.9% - (196,000) 1,415,000 294,000 (49,000) (135,000)<br />
I-45 North 2 204,821 - 0.0% 0.0% - (15,000) 21,000 28,000 0 0<br />
FM 1960 / Champions 1 150,000 - 0.0% 0.0% - 0 0 0 0 0<br />
FM 1960 / Highway 249 17 2,725,914 545,183 20.0% 20.1% - 102,000 22,000 702,000 41,000 82,000<br />
FM 1960 20 3,080,735 545,183 17.7% 17.8% - 87,000 43,000 730,000 41,000 82,000<br />
North Belt West/Greenspoint 15 3,709,849 341,306 9.2% 10.4% - (18,000) (70,000) (38,000) (93,000) (119,000)<br />
Greenspoint / IAH 7 1,085,573 121,584 11.2% 11.2% 67,000 (22,000) 8,000 91,000 88,000<br />
Greenspoint / North Belt 22 4,795,422 462,890 9.7% 10.6% - 49,000 (92,000) (30,000) (2,000) (31,000)<br />
Greenway Plaza 15 6,168,363 450,290 7.3% 8.2% - 44,000 104,000 179,000 (111,000) 74,000<br />
Gulf Freeway/Pasadena 1 52,362 8,273 15.8% 15.8% - 8,000 2,000 5,000 0 0<br />
Katy Freeway East 16 4,027,953 132,922 3.3% 4.2% 440,052 357,000 32,000 442,000 48,000 145,000<br />
Katy Freeway West 48 11,524,605 103,721 0.9% 0.9% 3,483,579 77,000 1,095,000 484,000 81,000 162,000<br />
Katy Fwy / Energy Corridor 64 15,552,558 236,644 1.5% 1.8% 3,923,631 434,000 1,127,000 926,000 129,000 307,000<br />
Kingwood / Humble 1 90,000 28,170 31.3% 31.3% - 0 (70,000) 0 0 13,000<br />
NASA / Clear Lake 13 1,914,706 160,835 8.4% 8.4% - (43,000) (27,000) 71,000 (21,000) 33,000<br />
Northeast - - - - - - 0 0 0 0 0<br />
North Loop West 5 1,054,498 287,878 27.3% 29.3% - 1,000 21,000 (6,000) 3,000 (21,000)<br />
Northwest Near 1 237,384 - 0.0% 0.0% - 0 0 0 0 0<br />
Northwest Far 15 2,520,121 143,647 5.7% 6.2% 159,056 37,000 268,000 182,000 (33,000) (2,000)<br />
Northwest 21 3,812,003 431,525 11.3% 12.2% 159,056 38,000 289,000 176,000 (30,000) (23,000)<br />
South Main / Medical Center 14 4,474,422 246,093 5.5% 5.6% 50,000 39,000 96,000 124,000 4,000 (1,000)<br />
Southwest / Hillcroft 6 1,485,352 190,125 12.8% 12.8% - (78,000) 67,000 66,000 4,000 35,000<br />
Southwest Beltway 8 3 573,152 126,093 22.0% 22.6% - 42,000 19,000 (5,000) (36,000) (34,000)<br />
East Ft Bend Co. / Sugar Land 23 3,737,972 512,102 13.7% 14.2% 328,764 (372,000) 52,000 159,000 117,000 343,000<br />
Southwest Fwy / Sugar Land 32 5,796,476 828,321 14.3% 14.7% 328,764 (408,000) 138,000 220,000 85,000 344,000<br />
Bellaire 7 1,186,294 200,484 16.9% 18.0% - (3,000) (14,000) (199,000) 4,000 85,000<br />
Post Oak Park 6 1,909,919 343,785 18.0% 18.4% - (10,000) (53,000) (50,000) 31,000 36,000<br />
Galleria 26 11,293,758 858,326 7.6% 9.3% 513,454 229,000 (19,000) (44,000) 23,000 147,000<br />
Riverway 8 2,038,628 142,704 7.0% 7.0% - 27,000 10,000 (23,000) (35,000) 42,000<br />
Richmond / Fountainview - - - - - - 0 0 0 0 0<br />
San Felipe / Voss 3 1,714,029 251,962 14.7% 14.7% - (46,000) 7,000 (57,000) 34,000 55,000<br />
West Loop 50 18,142,628 1,797,261 9.9% 11.1% 513,454 197,000 (69,000) (373,000) 57,000 365,000<br />
Westchase 22 6,681,105 387,504 5.8% 7.3% 634,204 (111,000) 363,000 473,000 (27,000) (47,000)<br />
The Woodlands 22 4,346,471 178,205 4.1% 4.1% 4,145,438 248,000 303,000 178,000 403,000 437,000<br />
Conroe 2 128,832 10,564 8.2% 8.2% - 0 (4,000) (4,000) (4,000) (3,000)<br />
Woodlands / Conroe 24 4,475,303 188,770 4.2% 4.2% 4,145,438 248,000 299,000 174,000 399,000 434,000<br />
TOTAL - <strong>Houston</strong> 334 107,066,422 7,918,717 7.4% 8.2% 9,754,547 388,000 3,618,000 2,969,000 475,000 1,415,000<br />
1/<br />
Class A buildings per CoStar that are greater than 50,000 SF. Does not include buildings under construction or owned by the government. Delta Associates, the research affiliate of <strong>Transwestern</strong>, is headquartered at:<br />
2/<br />
Does not include sublet space. 500 Montgomery Street, Suite 600, Alexandria, VA 22314; Phone: 703-836-5700; DeltaAssociates.com<br />
Source: Inventory and Vacancy from analysis of CoStar data, Net Absorption computed by Delta Associates; October 2013.<br />
SECTION 4: THE HOUSTON METRO OFFICE MARKET
SUMMARY OF OFFICE MARKET INDICATORS - CLASS B SPACE 1/<br />
<strong>Houston</strong> Metro Area | 2010 Through Third Quarter 2013<br />
Q3 2013 Net Absorption (SF) 2/<br />
Submarket<br />
Total Bldgs<br />
Total Rentable<br />
SF<br />
All Bldgs. 1/<br />
SF Available<br />
Vacancy Rate<br />
Immediately Vacancy Rate 2/ w/ Sublet<br />
All Bldgs. 2/<br />
SF Under<br />
Constr. or<br />
Renovation<br />
2010 2011 2012 Q3 2013 YTD 2013<br />
Central Business District 41 13,812,760 1,436,527 10.4% 10.5% 330,000 (9,000) 194,000 194,000 55,000 (97,000)<br />
Midtown 50 3,908,556 297,050 7.6% 7.8% 406,000 (23,000) 28,000 (86,000) 23,000 81,000<br />
Downtown 91 17,721,316 1,733,577 9.8% 9.9% 736,000 (32,000) 222,000 108,000 78,000 (16,000)<br />
I-45 North 30 1,606,441 208,837 13.0% 13.1% - (36,000) 20,000 27,000 11,000 31,000<br />
FM 1960 / Champions 47 2,424,240 693,333 28.6% 28.7% - 56,000 (51,000) (92,000) 19,000 4,000<br />
FM 1960 / Highway 249 92 3,762,871 492,936 13.1% 13.5% 220,915 24,000 141,000 34,000 (30,000) (21,000)<br />
FM 1960 169 7,793,552 1,395,106 17.9% 18.1% 220,915 44,000 110,000 (31,000) 0 14,000<br />
North Belt West/Greenspoint 49 4,630,321 935,325 20.2% 20.6% - 1,000 112,000 44,000 (14,000) (168,000)<br />
Greenspoint / IAH 21 1,966,352 243,828 12.4% 12.4% - (111,000) (52,000) 4,000 41,000 36,000<br />
Greenspoint / North Belt 70 6,596,673 1,179,152 17.9% 18.2% - (110,000) 60,000 48,000 27,000 (132,000)<br />
Greenway Plaza 40 3,988,808 315,116 7.9% 7.9% - (21,000) 17,000 (109,000) 20,000 (28,000)<br />
Gulf Freeway/Pasadena 58 2,883,887 331,647 11.5% 11.5% - 24,000 (20,000) 100,000 52,000 (3,000)<br />
Katy Freeway East 40 2,970,248 540,585 18.2% 18.3% 98,000 (20,000) 25,000 (86,000) (9,000) (62,000)<br />
Katy Freeway West 102 9,622,766 837,181 8.7% 8.8% 284,178 61,000 (4,000) 355,000 (77,000) 86,000<br />
Katy Fwy / Energy Corridor 142 12,593,014 1,377,766 10.9% 11.0% 382,178 41,000 21,000 269,000 (86,000) 24,000<br />
Kingwood / Humble 29 1,366,534 80,626 5.9% 6.6% - 16,000 56,000 18,000 1,000 27,000<br />
NASA / Clear Lake 105 6,811,810 1,341,927 19.7% 19.7% - 123,000 27,000 (225,000) 20,000 (416,000)<br />
Northeast 28 1,306,209 269,079 20.6% 20.9% - 19,000 (45,000) 2,000 (14,000) (2,000)<br />
North Loop West 34 3,178,080 530,739 16.7% 20.2% 126,000 (197,000) (5,000) 320,000 111,000 79,000<br />
Northwest Near 13 1,191,123 203,682 17.1% 17.1% - 62,000 (1,000) 23,000 (77,000) (78,000)<br />
Northwest Far 46 3,963,188 515,214 13.0% 13.2% 132,841 29,000 (13,000) (26,000) (4,000) 36,000<br />
Northwest 93 8,332,391 1,249,636 15.0% 16.4% 258,841 (106,000) (19,000) 317,000 30,000 37,000<br />
South Main / Medical Center 39 4,239,998 491,840 11.6% 11.6% - (117,000) 69,000 (39,000) (25,000) (178,000)<br />
Southwest / Hillcroft 21 1,698,185 366,808 21.6% 21.6% - 49,000 9,000 (10,000) 3,000 (10,000)<br />
Southwest Beltway 8 60 5,268,629 1,338,232 25.4% 25.5% - (230,000) (367,000) 90,000 16,000 (53,000)<br />
East Ft Bend Co. / Sugar Land 112 4,834,445 507,617 10.5% 12.6% 122,495 141,000 174,000 (62,000) 73,000 92,000<br />
Southwest Fwy / Sugar Land 193 11,801,259 2,212,656 18.7% 19.7% 122,495 (40,000) (184,000) 18,000 92,000 29,000<br />
Bellaire 22 2,884,038 155,738 5.4% 5.5% - 9,000 (164,000) 121,000 6,000 12,000<br />
Post Oak Park 24 2,653,133 504,095 19.0% 19.2% - (6,000) 31,000 (289,000) (19,000) 146,000<br />
Galleria 25 4,083,486 343,013 8.4% 8.4% - 113,000 (8,000) 91,000 16,000 200,000<br />
Riverway 14 1,039,510 137,215 13.2% 13.2% - (20,000) (38,000) 26,000 5,000 6,000<br />
Richmond / Fountainview 17 870,347 217,587 25.0% 25.0% - 1,000 (24,000) 16,000 17,000 28,000<br />
San Felipe / Voss 36 3,569,141 242,702 6.8% 7.2% - (28,000) 36,000 22,000 89,000 21,000<br />
West Loop 138 15,099,655 1,600,350 10.6% 10.7% - 69,000 (167,000) (13,000) 114,000 413,000<br />
Westchase 67 7,861,837 652,532 8.3% 8.5% 188,151 44,000 (166,000) 267,000 16,000 9,000<br />
The Woodlands 113 6,043,504 350,523 5.8% 6.2% 111,695 29,000 82,000 249,000 88,000 86,000<br />
Conroe 20 934,494 135,502 14.5% 15.2% - (4,000) (22,000) 204,000 (7,000) (10,000)<br />
Woodlands / Conroe 133 6,977,998 486,025 7.0% 7.4% 111,695 25,000 60,000 453,000 81,000 76,000<br />
TOTAL - <strong>Houston</strong> 1,395 115,374,941 14,717,035 12.8% 13.1% 2,020,275 (21,000) 41,000 1,183,000 406,000 (146,000)<br />
1/<br />
Class B per CoStar, and buildings under 50,000 SF even if CoStar classified them as Class A. Does not include buildings under construction. Delta Associates, the research affiliate of <strong>Transwestern</strong>, is headquartered at:<br />
2/<br />
Does not include sublet space. 500 Montgomery Street, Suite 600, Alexandria, VA 22314; Phone: 703-836-5700; DeltaAssociates.com<br />
Source: Inventory and Vacancy from analysis of CoStar data, Net Absorption computed by Delta Associates; October 2013.<br />
SECTION 4: THE HOUSTON METRO OFFICE MARKET
ASKING RENTAL RATE ANALYSIS OF CLASS A & B OFFICE BUILDINGS<br />
<strong>Houston</strong> Metro Area | 2010 Through Third Quarter 2013<br />
Average Asking Rent ($’s/SF) At End of:<br />
Submarket<br />
2010 2011 2012 Q3 2013 % Change 12/12 - 9/13<br />
Class A Class B Class A Class B Class A Class B Class A Class B Class A Class B<br />
Central Business District $29.95 $24.97 $30.59 $25.13 $32.30 $26.60 $32.34 $26.27 0.1% -1.2%<br />
Midtown $23.54 $22.36 $25.85 $21.85 $26.81 $22.62 $24.16 $23.06 -9.9% 1.9%<br />
Downtown $29.23 $23.73 $30.04 $23.77 $31.69 $25.04 $31.57 $24.87 -0.4% -0.7%<br />
I-45 North $20.22 $15.18 $16.97 $16.20 - $17.26 N/A $17.43 -- 1.0%<br />
FM 1960 / Champions - $13.40 - $12.85 - $13.55 N/A $13.95 -- 3.0%<br />
FM 1960 / Highway 249 $27.38 $20.21 $25.57 $19.67 $24.54 $19.60 $25.61 $20.67 4.4% 5.4%<br />
FM 1960 $26.96 $16.65 $25.11 $16.42 $24.10 $17.03 $25.15 $17.62 4.4% 3.5%<br />
North Belt West / Greenspoint $20.07 $15.80 $20.51 $16.17 $24.02 $17.35 $28.05 $16.83 16.8% -3.0%<br />
Greenspoint / IAH $23.23 $15.24 $22.86 $16.91 $22.06 $15.89 $23.46 $16.23 6.4% 2.1%<br />
Greenspoint / North Belt $20.49 $15.72 $20.68 $16.36 $22.95 $17.09 $26.05 $16.76 13.5% -1.9%<br />
Greenway Plaza $23.61 $21.50 $24.49 $20.52 $25.85 $20.80 $27.46 $21.52 6.2% 3.5%<br />
Gulf Freeway/Pasadena $24.25 $19.95 $24.25 $20.72 $25.69 $20.55 $27.84 $21.05 8.4% 2.5%<br />
Katy Freeway East $25.35 $17.87 $25.98 $17.99 $26.34 $20.17 $25.83 $19.96 -1.9% -1.0%<br />
Katy Freeway West $24.46 $18.76 $25.32 $19.18 $23.51 $19.99 $24.26 $20.15 3.2% 0.8%<br />
Katy Freeway / Energy Corridor $25.31 $18.36 $26.14 $18.72 $25.41 $19.90 $25.57 $19.90 0.6% 0.0%<br />
Kingwood / Humble $29.50 $16.49 $30.10 $16.44 $30.10 $16.72 $30.10 $17.11 0.0% 2.3%<br />
NASA / Clear Lake $21.29 $20.46 $23.93 $20.82 $23.25 $20.01 $22.97 $19.74 -1.2% -1.4%<br />
Northeast - $13.67 - $13.55 - $14.32 N/A $14.24 -- -0.6%<br />
North Loop West $20.96 $15.62 $19.98 $15.94 $21.77 $15.62 $21.60 $16.35 -0.8% 4.7%<br />
Northwest Near - $14.84 - $14.39 - $14.84 N/A $15.30 -- 3.1%<br />
Northwest Far $26.79 $14.29 $25.04 $14.17 $22.12 $15.95 $22.56 $15.79 2.0% -1.0%<br />
Northwest $25.41 $15.07 $23.96 $15.17 $24.39 $15.90 $24.39 $16.25 0.0% 2.2%<br />
South Main / Medical Center $27.65 $21.88 $28.09 $25.85 $28.07 $25.50 $26.28 $25.18 -6.4% -1.3%<br />
Southwest / Hillcroft $14.58 $13.76 $14.98 $13.76 $15.39 $13.91 $15.09 $13.66 -1.9% -1.8%<br />
Southwest Beltway 8 $16.87 $16.45 $19.33 $17.29 $19.08 $17.34 $17.69 $16.78 -7.3% -3.2%<br />
East Fort Bend County / Sugar Land $29.21 $18.47 $27.04 $18.18 $27.03 $19.09 $26.66 $19.32 -1.4% 1.2%<br />
Southwest Freeway / Sugar Land $22.48 $15.93 $21.58 $16.33 $21.67 $16.60 $21.21 $16.28 -2.1% -2.0%<br />
Bellaire $23.13 $14.77 $24.21 $14.78 $24.85 $14.78 $25.08 $15.54 0.9% 5.1%<br />
Post Oak Park $30.91 $15.77 $31.47 $16.83 $33.02 $19.10 $34.39 $18.10 4.1% -5.2%<br />
Galleria $28.01 $20.32 $28.01 $20.40 $29.17 $21.44 $29.53 $22.52 1.2% 5.0%<br />
Riverway $25.47 $20.19 $27.42 $19.90 $30.74 $22.22 $33.09 $23.17 7.7% 4.3%<br />
Richmond / Fountainview - $16.69 - $16.95 - $17.43 N/A $17.68 -- 1.5%<br />
San Felipe / Voss $29.94 $19.45 $32.37 $19.57 $33.51 $20.50 $33.28 $21.11 -0.7% 2.9%<br />
West Loop $27.81 $18.78 $28.53 $19.08 $29.86 $20.54 $30.42 $20.79 1.9% 1.2%<br />
Westchase $26.72 $18.89 $23.95 $17.50 $30.35 $17.90 $30.22 $18.67 -0.4% 4.3%<br />
The Woodlands $22.76 $20.11 $22.06 $21.16 $23.39 $22.70 $24.42 $22.95 4.4% 1.1%<br />
Conroe - $14.91 $30.67 $18.54 $29.54 $22.31 $28.42 $23.01 -3.8% 3.2%<br />
Woodlands / Conroe $22.76 $19.34 $22.24 $21.11 $23.41 $23.54 $24.21 $23.94 3.4% 1.7%<br />
<strong>Houston</strong> Total: $25.86 $18.30 $26.08 $18.48 $27.42 $19.30 $28.08 $19.44 2.4% 0.7%<br />
Note: Rents for properties using triple net terms have been grossed up to full service by applying operating expense data. Rents reflect full service equivalent.<br />
Note: Due to small submarket sample sizes in some cases, particularly in Class A, rent increases and decreases may be magnified relative to other submarkets<br />
Delta Associates, the research affiliate of <strong>Transwestern</strong>, is headquartered at: 500 Montgomery Street, Suite 600, Alexandria, VA 22314; Phone: 703-836-5700;<br />
DeltaAssociates.com<br />
Source: Delta Associates analysis of CoStar data; October 2013.<br />
SECTION 4: THE HOUSTON METRO OFFICE MARKET
TABLE OF CONTENTS<br />
Section One Summary 5<br />
Section Two The National Economy 9<br />
Section Three The <strong>Houston</strong> Metro Economy 16<br />
Section Four The <strong>Houston</strong> Metro Office Market 19<br />
Section Five The <strong>Houston</strong> Metro Industrial Market 27<br />
Market Fundamentals Remain Sturdy, Should Gain Further<br />
Momentum<br />
Absorption Healthy in 2013<br />
Industrial Vacancy Ticks Down; Lowest in U.S.<br />
Construction Activity Increasing<br />
Market Fundamentals Remain Sturdy, Should<br />
Gain Further Momentum<br />
The fundamentals of the <strong>Houston</strong> industrial market improved in<br />
2013, with vacancy being the lowest in the nation and continuing<br />
to decline. As consumer spending increases, demand for industrial<br />
space will continue to grow over the intermediate to long-term. As<br />
the national economic recovery continues, we expect demand for<br />
<strong>Houston</strong> industrial space to remain strong for the remainder of 2013<br />
and into 2014. The rising demand for goods and increased trade with<br />
Asia via the expanded Panama Canal suggest a strong future for the<br />
<strong>Houston</strong> industrial market.<br />
LARGEST U.S. INDUSTRIAL MARKETS<br />
2013<br />
Millions of SF<br />
2,000<br />
1,600<br />
1,200<br />
800<br />
400<br />
0<br />
LA BASIN NY/ NNJ CHI PHI DFW ATL SF BAY HOU<br />
Source: CoStar; Delta Associates; October 2013.<br />
Absorption Healthy in 2013<br />
Net absorption of industrial space in the <strong>Houston</strong> metro totaled<br />
4.8 million SF through the first three quarters of 2013, compared<br />
to a total of 5.0 million SF in 2012. Local businesses are expanding<br />
as the regional economy strengthens and consumer spending<br />
and confidence increase. A growing retail segment benefits the<br />
warehouse/distribution market.<br />
NET ABSORPTION OF INDUSTRIAL SPACE AND<br />
DIRECT VACANCY RATE TRENDS<br />
<strong>Houston</strong> Metro | 1998 –3 RD Quarter 2013<br />
Net Absorption in 000s of SF<br />
14,000<br />
12,000<br />
10,000<br />
8,000<br />
6,000<br />
4,000<br />
2,000<br />
0<br />
-2,000<br />
-4,000<br />
Source: Vacancy –Delta Associates analysis of CoStar data;<br />
Net Absorption –Delta Associates; October 2013.<br />
Net Absorption<br />
Vacancy Rate<br />
98 99 00 01 02 03 04 05 06 07 08 09 10 11 12 YTD<br />
2013<br />
10%<br />
9%<br />
8%<br />
7%<br />
6%<br />
5%<br />
4%<br />
3%<br />
2%<br />
Direct Vacancy Rate<br />
Industrial Asking Rents: Edge Down<br />
Metro <strong>Houston</strong> Industrial Market Outlook<br />
Summary of Industrial Market Indicators - All Space<br />
Summary of Industrial Market Indicators - All Space - Continued<br />
Section Six Office and Industrial Investment Trends 32<br />
Section Seven The <strong>Houston</strong> Metro Multifamily Market 36<br />
Section Eight The <strong>Houston</strong> Metro Retail Market 38<br />
Foreword | Sponsors | Special Thanks, Acknowledgments & Representations | Contact<br />
Why This Methodology is the Best<br />
Indicator of Current Market Conditions<br />
We include owner-occupied and single-tenant<br />
buildings in our inventory, vacancy, and absorption<br />
statistics. Doing so allows us to capture more market<br />
activity than many of our competitors, and to better<br />
correlate changes in the market with changes in<br />
employment. As single-tenant space does compete<br />
with multi-tenant space, we believe it is critical to<br />
understand all components of the market. We also<br />
include flex space in our industrial market analysis,<br />
and offer wider geographic coverage than some<br />
of our competitors. The result of these differences<br />
is that the inclusion of single-tenant and owneroccupied<br />
space, as well as flex space, tends to yield<br />
lower vacancy rates and higher absorption totals<br />
than our competitors’ results, but our coverage of<br />
the market is more comprehensive.<br />
How the Multi-Tenant Market<br />
Compares to Our Market Coverage<br />
Vacancy and absorption in the <strong>Houston</strong> metro area<br />
often are reported by brokerage firms on multitenant<br />
buildings only. We include owner-occupied<br />
and single-tenant buildings as well, on the basis<br />
of immediate availability, to capture more market<br />
activity. We exclude government-owned space. As<br />
a point of comparison, below is data for the <strong>Houston</strong><br />
multi-tenant industrial market at Q3 2013:<br />
Multi-Tenant Entire Market<br />
Inventory: 198.2 MSF 565.0 MSF<br />
Overall vac.<br />
(incl. sublet):<br />
YTD net absorption:<br />
9.2% 4.3%<br />
1,608,000 SF 4,828,000 SF<br />
27<br />
TRENDLINES® 2013
TABLE OF CONTENTS<br />
Section One Summary 5<br />
Section Two The National Economy 9<br />
Section Three The <strong>Houston</strong> Metro Economy 16<br />
Section Four The <strong>Houston</strong> Metro Office Market 19<br />
Section Five The <strong>Houston</strong> Metro Industrial Market 27<br />
28<br />
Market Fundamentals Remain Sturdy, Should Gain Further<br />
Momentum<br />
Absorption Healthy in 2013<br />
Industrial Vacancy Ticks Down; Lowest in U.S.<br />
Construction Activity Increasing<br />
Industrial Asking Rents: Edge Down<br />
Metro <strong>Houston</strong> Industrial Market Outlook<br />
Summary of Industrial Market Indicators - All Space<br />
Summary of Industrial Market Indicators - All Space - Continued<br />
Section Six Office and Industrial Investment Trends 32<br />
Section Seven The <strong>Houston</strong> Metro Multifamily Market 36<br />
Section Eight The <strong>Houston</strong> Metro Retail Market 38<br />
Foreword | Sponsors | Special Thanks, Acknowledgments & Representations | Contact<br />
TRENDLINES® 2013<br />
In terms of net absorption in 2013, <strong>Houston</strong> has normally been a steady<br />
performer among major markets. However, in 2013 <strong>Houston</strong> trails the<br />
LA Basin, Dallas/Ft. Worth, NY/Northern NJ, and Chicago markets.<br />
<strong>Houston</strong>’s absorption may be artificially low relative to its economic<br />
performance because there is so little available industrial space to be<br />
leased. This would explain the large increase in its pipeline.<br />
NET ABSORPTION OF INDUSTRIAL SPACE<br />
Select Metro Areas | January – September 2013<br />
Millions of SF<br />
14<br />
13<br />
12<br />
11<br />
10<br />
9<br />
8<br />
7<br />
6<br />
5<br />
4<br />
3<br />
2<br />
1<br />
0<br />
-1<br />
-2<br />
LA BASIN DFW NY/ NNJ CHI<br />
Source: CoStar, Delta Associates; October 2013.<br />
HOU<br />
WAS/BAL<br />
The <strong>Houston</strong> industrial market is on pace to absorb about 6.4 million<br />
SF of space in 2013. The Warehouse/Distribution sector makes up the<br />
largest portion of the market, having accounted for 77% of the space<br />
absorbed thus far in 2013.<br />
2012 (SF) YTD (SF)<br />
• Warehouse/Dist.: 4,411,000 3,730,000<br />
• Manufacturing: 440,000 231,000<br />
• Flex/R&D: 99,000 867,000<br />
Notable leases during 2013 include:<br />
• DB Schenker, Inc. leased 267,201 SF at 10650 Okanella Lane in<br />
the Northwest submarket.<br />
• Exel renewed 254,765 SF at 8833 Citypark Loop in the East<br />
submarket.<br />
• Amazon leased 240,000 SF at 8120 Humble Road in the North<br />
submarket.<br />
• Frontier Logistics leased 300,000 SF at 3041 Highway 225 (Port<br />
225) in the Southeast submarket.<br />
• HD Supply leased 500,000 SF for a build-to-suit at Pinto<br />
Business Park in the North submarket.<br />
• Goodman Global Group, Inc leased 299,840 SF at 7310<br />
Langfield Road in the Northwest submarket.<br />
Industrial Vacancy Ticks Down; Lowest in U.S.<br />
The overall <strong>Houston</strong> metro area industrial vacancy rate declined to<br />
4.3% in September 2013 from 4.6% a year earlier. The direct industrial<br />
vacancy rate, 4.2% in September, is down from 4.5% a year earlier.<br />
INDUSTRIAL VACANCY RATES<br />
Select Metro Areas | 3 RD Quarter 2013<br />
Overall Vacancy Rate<br />
12%<br />
10%<br />
8%<br />
6%<br />
4%<br />
2%<br />
0%<br />
HOU<br />
Source: CoStar, Delta Associates; October 2013.<br />
LA BASIN NY/ NNJ DFW<br />
CHI<br />
Current vacancy rates by product type:<br />
DIRECT<br />
WAS/BAL<br />
OVERALL<br />
Warehouse/Dist.: 4.1% 4.2%<br />
Manufacturing: 2.0% 2.2%<br />
Flex/R&D: 8.6% 8.8%<br />
<strong>Houston</strong>’s industrial vacancy rate will likely decline to approximately<br />
4.1% over the next 12 months, as steady demand continues to outpace<br />
the pipeline of new supply. Vacancy will continue to decline until the<br />
development of new product escalates and catches up to demand.<br />
However, the pipeline is growing, and we do expect groundbreakings<br />
to increase further during the remainder of 2013 and into 2014.<br />
Construction Activity Increasing<br />
There is currently 4.8 million SF of industrial space under construction<br />
in metro <strong>Houston</strong>, well above the 2.3 million SF under construction<br />
a year ago. Warehouse/Distribution product comprises 96% of<br />
space under construction. Space under construction today is 38%<br />
preleased, compared to 43% one year ago. With the pipeline<br />
(including planned space likely to start construction soon) only at<br />
1.0% of standing inventory, more developers are breaking ground on<br />
new projects, especially warehouse/distribution buildings. Build-tosuit<br />
projects also are moving forward for companies expanding along<br />
with the energy industry.<br />
INDUSTRIAL SPACE UNDER CONSTRUCTION<br />
Select Metro Areas | 3 RD Quarter 2013<br />
Millions of SF<br />
11<br />
10<br />
9<br />
8<br />
7<br />
6<br />
5<br />
4<br />
3<br />
2<br />
1<br />
0<br />
DFW<br />
Source: CoStar, Delta Associates; October 2013.<br />
National Total<br />
= 61.2 Million SF<br />
LA BASIN HOU NY/ NNJ CHI<br />
WAS/BAL
Deliveries in <strong>Houston</strong> have totaled 4.1 million SF thus far in 2013,<br />
compared to 3.0 million SF at the same point last year. Even with these<br />
deliveries, the market has been underserved from a development<br />
standpoint in 2013.<br />
TABLE OF CONTENTS<br />
Section One Summary 5<br />
Section Two The National Economy 9<br />
Section Three The <strong>Houston</strong> Metro Economy 16<br />
Section Four The <strong>Houston</strong> Metro Office Market 19<br />
Section Five The <strong>Houston</strong> Metro Industrial Market 27<br />
Market Fundamentals Remain Sturdy, Should Gain Further<br />
Momentum<br />
Absorption Healthy in 2013<br />
Industrial Vacancy Ticks Down; Lowest in U.S.<br />
Construction Activity Increasing<br />
Industrial Asking Rents: Edge Down<br />
Metro <strong>Houston</strong> Industrial Market Outlook<br />
Summary of Industrial Market Indicators - All Space<br />
Summary of Industrial Market Indicators - All Space - Continued<br />
Section Six Office and Industrial Investment Trends 32<br />
Section Seven The <strong>Houston</strong> Metro Multifamily Market 36<br />
Section Eight The <strong>Houston</strong> Metro Retail Market 38<br />
INDUSTRIAL SPACE DELIVERED<br />
<strong>Houston</strong> Metro | 1998 - 3 RD Quarter 2013<br />
Millions of SF Delivered<br />
13<br />
12<br />
11<br />
10<br />
9<br />
8<br />
7<br />
6<br />
5<br />
4<br />
3<br />
2<br />
1<br />
0<br />
4.9<br />
6.6<br />
5.4<br />
4.8<br />
4.4<br />
3.1 3.4 7.7<br />
5.6<br />
12.1<br />
10.1<br />
7.1<br />
2.4 2.3<br />
3.0 4.1<br />
98 99 00 01 02 03 04 05 06 07 08 09 10 11 12 YTD<br />
2013<br />
Source: CoStar, Delta Associates; October 2013.<br />
Industrial Asking Rents: Edge Down<br />
Industrial asking rents edged down 0.3% through the 3rd quarter of<br />
2013, after rising by 5.0% in 2012. The 3rd quarter 2013 average<br />
asking rent for all types of industrial space is $5.87/SF, triple net.<br />
Steady demand should support healthy rent increases during the<br />
remainder of 2013 and into 2014, particularly in the warehouse/<br />
distribution sector, given the already-low vacancy rate in the<br />
<strong>Houston</strong> industrial market. While some concern remains about<br />
macroeconomic factors that could impact the distribution needs of<br />
retailers, the <strong>Houston</strong> industrial market is among the best-positioned<br />
in the country for future rent growth.<br />
AVERAGE INDUSTRIAL RENT<br />
Select Metro Areas | 3 RD Quarter 2013<br />
Asking Rent, ($/SF, NNN)<br />
$8<br />
$7<br />
$6<br />
$5<br />
$4<br />
$3<br />
$2<br />
$1<br />
Metro <strong>Houston</strong><br />
Industrial Market<br />
Outlook<br />
The <strong>Houston</strong> metro industrial market will likely<br />
experience continued growth for the remainder of<br />
2013 and into 2014. Despite gains in the United<br />
States, global economic uncertainty persists and could<br />
potentially curtail national economic growth. However,<br />
the energy boom in <strong>Houston</strong> should be able to sustain<br />
the volatility of the broader economy, and industrial<br />
vacancies in <strong>Houston</strong> likely will continue to fall. Largescale<br />
construction is underway all across the <strong>Houston</strong><br />
market. If construction remains controlled, industrial<br />
rents will rise, and market conditions will turn further in<br />
favor of landlords. The current level of construction is<br />
limited enough to promote continuing strong market<br />
conditions, though the pipeline has been increasing.<br />
On balance, we expect strong performance from the<br />
<strong>Houston</strong> industrial market during the remainder of<br />
2013 and into 2014.<br />
Industrial submarkets<br />
likely to outperform in<br />
the period ahead, with<br />
declining vacancy and<br />
rising rents, include:<br />
• East-Southeast Far<br />
• North Far<br />
$0<br />
WAS/BAL<br />
NY/ NNJ LA BASIN HOU<br />
CHI DFW<br />
• Northwest Near<br />
Source: CoStar, Delta Associates; October 2013.<br />
Foreword | Sponsors | Special Thanks, Acknowledgments & Representations | Contact<br />
29<br />
TRENDLINES® 2013
SUMMARY OF INDUSTRIAL MARKET INDICATORS - ALL SPACE<br />
<strong>Houston</strong> Metro Area | 2010 Through Third Quarter 2013<br />
Submarket<br />
Central Business District<br />
Total Rentable<br />
SF<br />
All Bldgs. 1/<br />
Q3 2013 Direct Vacancy Rate at the End of: Q3 2013 Net Absorption (SF) 2/<br />
SF Available<br />
Immediately 2010 2011 2012 Q3 2013<br />
All Bldgs. 2/<br />
Vacancy Rate<br />
w/ Sublet<br />
SF Under<br />
Constr. or<br />
Renovation<br />
2010 2011 2012 Q3 2013 YTD 2013<br />
Flex/R & D 704,587 69,754 7.8% 8.4% 8.0% 9.9% 9.9% - 45,000 (5,000) 4,000 (4,000) (14,000)<br />
Manufacturing 5,883,053 47,064 5.6% 4.3% 1.4% 0.8% 0.8% - (184,000) 64,000 166,000 (6,000) 35,000<br />
Warehouse/Distribution 26,527,175 1,697,739 5.2% 4.8% 6.4% 6.4% 6.4% - (209,000) 120,000 (477,000) 80,000 36,000<br />
Total - Central Business District 33,114,815 1,814,558 5.3% 4.8% 5.6% 5.5% 5.5% - (348,000) 179,000 (307,000) 70,000 57,000<br />
East-Southeast Far<br />
Flex/R & D 2,937,496 252,625 12.0% 9.5% 12.2% 8.6% 8.6% - 80,000 54,000 (72,000) 132,000 105,000<br />
Manufacturing 5,947,936 279,553 2.7% 0.5% 6.4% 4.7% 4.7% - 61,000 202,000 (279,000) 54,000 102,000<br />
Warehouse/Distribution 54,546,207 4,090,966 11.4% 8.2% 8.3% 7.5% 7.5% 25,050 (120,000) 965,000 695,000 (87,000) 353,000<br />
Total - East-Southeast Far 63,431,639 4,623,143 10.6% 7.5% 8.3% 7.3% 7.3% 25,050 21,000 1,221,000 344,000 99,000 560,000<br />
North Far<br />
Flex/R & D 8,548,136 726,592 10.9% 9.3% 8.9% 8.5% 8.5% - (197,000) 214,000 90,000 (59,000) 118,000<br />
Manufacturing 7,278,777 196,527 2.4% 2.7% 2.1% 2.7% 2.7% - (86,000) (17,000) 15,000 148,000 (11,000)<br />
Warehouse/Distribution 48,770,428 2,340,981 6.0% 4.3% 4.3% 4.8% 4.8% 1,711,081 1,163,000 1,021,000 828,000 154,000 1,161,000<br />
Total - North Far 64,597,341 3,264,099 6.3% 4.8% 4.6% 5.1% 5.1% 1,711,081 880,000 1,218,000 933,000 243,000 1,268,000<br />
NORTH NEAR<br />
Flex/R & D 1,309,501 161,069 15.2% 22.9% 18.9% 12.3% 12.3% - (32,000) (92,000) 48,000 115,000 185,000<br />
Manufacturing 2,626,374 120,813 3.1% 0.9% 0.3% 4.6% 4.6% - (19,000) 58,000 16,000 (11,000) (113,000)<br />
Warehouse/Distribution 15,668,423 783,421 4.1% 4.8% 3.6% 5.0% 5.0% 351,250 21,000 298,000 456,000 102,000 (94,000)<br />
Total - North Near 19,604,298 1,065,303 4.7% 5.4% 4.1% 5.4% 5.4% 351,250 (30,000) 264,000 520,000 206,000 (22,000)<br />
NORTHEAST FAR<br />
Flex/R & D 96,952 - 2.7% 2.7% 0.0% 0.0% 0.0% - - - 3,000 - -<br />
Manufacturing 196,600 - 0.0% 0.0% 0.0% 0.0% 0.0% - - - - - -<br />
Warehouse/Distribution 1,465,187 36,630 0.3% 0.7% 1.2% 2.5% 2.5% - 4,000 (5,000) (5,000) 7,000 (19,000)<br />
Total - Northeast Far 1,758,739 36,630 0.4% 0.7% 1.0% 2.1% 2.1% - 4,000 (5,000) (2,000) 7,000 (19,000)<br />
Northeast Near<br />
Flex/R & D 771,671 50,159 11.8% 8.3% 10.5% 6.5% 6.5% - (78,000) 2,000 (18,000) (9,000) 35,000<br />
Manufacturing 5,937,172 23,749 4.9% 0.8% 0.4% 0.4% 2.5% - (141,000) 244,000 23,000 (6,000) 0<br />
Warehouse/Distribution 26,943,756 862,200 3.7% 3.5% 3.4% 3.2% 3.2% 20,000 (173,000) 113,000 65,000 (54,000) 94,000<br />
Total - Northeast Near 33,652,599 936,107 4.1% 3.1% 3.1% 2.8% 3.2% 20,000 (392,000) 359,000 70,000 (69,000) 129,000<br />
Northwest Far<br />
Flex/R & D 5,435,616 239,167 5.6% 5.4% 5.3% 4.4% 4.5% - 566,000 38,000 75,000 (65,000) 49,000<br />
Manufacturing 7,563,586 242,035 4.2% 3.7% 2.9% 3.2% 3.2% - 299,000 31,000 51,000 322,000 293,000<br />
Warehouse/Distribution 51,379,301 1,130,345 5.1% 3.4% 2.6% 2.2% 2.3% 2,229,291 821,000 1,203,000 801,000 168,000 839,000<br />
Total - Northwest Far 64,378,503 1,611,546 5.0% 3.6% 2.9% 2.5% 2.6% 2,229,291 1,686,000 1,272,000 927,000 425,000 1,181,000<br />
Northwest Near<br />
Flex/R & D 11,614,223 987,209 10.5% 9.7% 8.9% 8.5% 9.4% - 297,000 93,000 92,000 101,000 147,000<br />
Manufacturing 10,690,280 85,522 1.7% 3.3% 0.6% 0.8% 1.0% - (27,000) (144,000) 256,000 - (21,000)<br />
Warehouse/Distribution 80,971,394 2,995,942 4.9% 4.3% 3.9% 3.7% 3.8% - 320,000 530,000 871,000 (81,000) 687,000<br />
Total - Northwest Near 103,275,897 4,068,673 5.3% 4.8% 4.1% 3.9% 4.1% - 590,000 479,000 1,219,000 20,000 813,000<br />
1/ Includes buildings 15,000 SF RBA and greater. Does not include buildings under construction or buildings owned by the<br />
government. 2/ Does not include sublet space.<br />
Source: Inventory and Vacancy from analysis of CoStar data, Net Absorption computed by Delta Associates; October 2013.<br />
Delta Associates, the research affiliate of <strong>Transwestern</strong>, is headquartered at: 500 Montgomery Street, Suite 600, Alexandria, VA 22314; Phone: 703-836-5700; DeltaAssociates.com<br />
Section 5: The <strong>Houston</strong> Metro Industrial Market
SUMMARY OF INDUSTRIAL MARKET INDICATORS - ALL SPACE<br />
<strong>Houston</strong> Metro Area | 2010 Through Third Quarter 2013<br />
Submarket<br />
South Far<br />
Total Rentable<br />
SF<br />
All Bldgs. 1/<br />
- CONTINUED<br />
Q3 2013 Direct Vacancy Rate at the End of: Q3 2013 Net Absorption (SF) 2/<br />
SF Available<br />
Immediately 2010 2011 2012 Q3 2013<br />
All Bldgs. 2/<br />
Vacancy Rate<br />
w/ Sublet<br />
SF Under<br />
Constr. or<br />
Renovation<br />
2010 2011 2012 Q3 2013 YTD 2013<br />
Flex/R & D 1,709,126 54,692 11.0% 10.5% 9.3% 3.2% 3.2% - 7,000 8,000 21,000 77,000 105,000<br />
Manufacturing 6,010,516 114,200 2.9% 1.8% 1.8% 1.9% 1.9% 150,000 (33,000) 61,000 - (30,000) (6,000)<br />
Warehouse/Distribution 30,789,178 1,046,832 4.3% 2.9% 3.6% 3.4% 3.5% 55,000 33,000 521,000 17,000 142,000 103,000<br />
Total - South Far 38,508,820 1,215,724 4.4% 3.1% 3.6% 3.2% 3.2% 205,000 7,000 590,000 38,000 189,000 202,000<br />
SOUTH NEAR<br />
Flex/R & D 803,477 135,788 10.3% 18.1% 21.2% 16.9% 16.9% - (25,000) (12,000) (25,000) 28,000 35,000<br />
Manufacturing 1,696,371 137,406 3.8% 3.6% 3.8% 8.1% 8.1% - (2,000) 3,000 (2,000) 10,000 (73,000)<br />
Warehouse/Distribution 12,169,760 608,488 1.8% 2.5% 3.4% 5.0% 5.0% - 244,000 (86,000) (109,000) (97,000) (195,000)<br />
Total - South Near 14,669,608 881,682 2.5% 3.5% 4.4% 6.0% 6.0% - 217,000 (95,000) (136,000) (59,000) (233,000)<br />
Southeast Near<br />
Flex/R & D 461,763 55,873 21.3% 20.2% 15.3% 12.1% 12.1% - (16,000) 6,000 25,000 (7,000) 15,000<br />
Manufacturing 7,673,620 - 0.2% 0.0% 0.0% 0.0% 0.0% - - 14,000 - - -<br />
Warehouse/Distribution 29,507,769 649,171 2.7% 2.3% 1.6% 2.2% 2.2% - (59,000) 118,000 207,000 98,000 (176,000)<br />
Total - Southeast Near 37,643,152 705,044 2.5% 2.1% 1.4% 1.9% 1.9% - (75,000) 138,000 232,000 91,000 (161,000)<br />
Southwest Far<br />
Flex/R & D 1,821,901 473,694 7.9% 24.1% 25.6% 26.0% 26.0% 26,250 (33,000) (26,000) (23,000) 24,000 (7,000)<br />
Manufacturing 1,732,823 71,046 3.8% 4.4% 5.5% 4.1% 4.1% 26,809 35,000 64,000 (15,000) 21,000 24,000<br />
Warehouse/Distribution 9,556,086 305,795 4.3% 4.8% 4.2% 3.2% 3.3% - 117,000 81,000 100,000 (11,000) 119,000<br />
Total - Southwest Far 13,110,810 850,535 4.8% 7.7% 7.4% 6.5% 6.6% 53,059 119,000 119,000 62,000 34,000 136,000<br />
SOUTHWEST NEAR<br />
Flex/R & D 8,108,347 672,993 7.0% 6.4% 8.7% 8.3% 8.4% - 45,000 5,000 (186,000) 24,000 32,000<br />
Manufacturing 4,603,792 101,283 3.6% 2.7% 2.1% 2.2% 2.2% - 53,000 35,000 113,000 5,000 1,000<br />
Warehouse/Distribution 41,960,273 1,049,007 5.0% 4.2% 3.1% 2.5% 2.7% 208,800 675,000 385,000 795,000 483,000 716,000<br />
Total - Southwest Near 54,672,412 1,823,283 5.2% 4.4% 3.9% 3.3% 3.5% 208,800 773,000 425,000 722,000 512,000 749,000<br />
SUGAR LAND<br />
Flex/R & D 3,319,898 212,473 11.9% 9.6% 7.4% 6.4% 6.4% 12,208 47,000 64,000 65,000 29,000 62,000<br />
Manufacturing 2,424,996 - 0.7% 0.0% 0.0% 0.0% 0.0% - (13,000) 12,000 96,000 - -<br />
Warehouse/Distribution 16,873,136 793,037 5.9% 6.1% 5.1% 4.7% 4.8% 15,180 842,000 65,000 167,000 36,000 106,000<br />
Total - Sugar Land 22,618,030 1,005,511 6.3% 5.9% 4.9% 4.4% 4.5% 27,388 876,000 141,000 328,000 65,000 168,000<br />
TOTAL HOUSTON<br />
Flex/R & D 47,642,694 4,092,087 10.0% 9.7% 9.7% 8.6% 8.8% 38,458 706,000 349,000 99,000 386,000 867,000<br />
Manufacturing 70,265,896 1,419,198 2.9% 2.1% 1.8% 2.0% 2.2% 176,809 (57,000) 627,000 440,000 507,000 231,000<br />
Warehouse/Distribution 447,148,073 18,390,552 5.3% 4.4% 4.2% 4.1% 4.2% 4,615,652 3,679,000 5,329,000 4,411,000 940,000 3,730,000<br />
Total - <strong>Houston</strong> 565,036,663 23,901,838 5.4% 4.6% 4.3% 4.2% 4.3% 4,830,919 4,328,000 6,305,000 4,950,000 1,833,000 4,828,000<br />
Vacancy Rate with Sublet Space 5.6% 4.7% 4.4% 4.3%<br />
1/ Includes buildings 15,000 SF RBA and greater. Does not include buildings under construction or buildings owned by the<br />
government. 2/ Does not include sublet space.<br />
Source: Inventory and Vacancy from analysis of CoStar data, Net Absorption computed by Delta Associates; October 2013.<br />
Delta Associates, the research affiliate of <strong>Transwestern</strong>, is headquartered at: 500 Montgomery Street, Suite 600, Alexandria, VA 22314; Phone: 703-836-5700; DeltaAssociates.com<br />
Section 5: The <strong>Houston</strong> Metro Industrial Market
TABLE OF CONTENTS<br />
Section One Summary 5<br />
Section Two The National Economy 9<br />
Section Three The <strong>Houston</strong> Metro Economy 16<br />
Section Four The <strong>Houston</strong> Metro Office Market 19<br />
Section Five The <strong>Houston</strong> Metro Industrial Market 27<br />
Section Six Office and Industrial Investment Trends 32<br />
32<br />
Office Investment Sales<br />
Office Investment Sales - Continued<br />
Industrial Investment Sales<br />
Office Investment Prospects<br />
Industrial Investment Prospects<br />
Section Seven The <strong>Houston</strong> Metro Multifamily Market 36<br />
Section Eight The <strong>Houston</strong> Metro Retail Market 38<br />
Foreword | Sponsors | Special Thanks, Acknowledgments & Representations | Contact<br />
TRENDLINES® 2013<br />
Office Investment Sales<br />
Sales have returned to peak levels in <strong>Houston</strong> faster than in many<br />
other major markets, even as national office investment volume has<br />
plateaued. Annualized national office volume for 2013 totals $77.5<br />
billion, compared to $81.1 billion in 2012 and $64.7 billion in 2011.<br />
Improved market conditions, driven by one of the nation’s strongest<br />
local economies, continue to fuel investor interest in the Energy<br />
Capital. The shale revolution has given local energy companies the<br />
confidence and incentive to expand their workforces, which translates<br />
into greater interest in <strong>Houston</strong> office assets.<br />
INVESTMENT SALES OF OFFICE BUILDINGS<br />
United States | 2002 Through 2013<br />
Billions of $<br />
$220<br />
$200<br />
$180<br />
$160<br />
$140<br />
$120<br />
$100<br />
$80<br />
$60<br />
$40<br />
$20<br />
$0<br />
2002 2003 2004 2005 2006 2007 2008 2009 2010 2011 2012 2013*<br />
*Sales through August 2013 annualized.<br />
Sources: Real Capital Analytics, graphic by Delta Associates; October 2013.<br />
In the long term, real estate investments have either matched or<br />
outperformed stocks and bonds. While in the short term the stock<br />
market has been robust, investors continue to seek real estate as a<br />
hedge against inflation. After a precipitous fall following the housing<br />
bubble and recession, real estate has again proved to be a strong<br />
investment. In the last 10 years as of June 2013 the NAREIT Equity REIT<br />
Index saw a 10.96% increase. The NCREIF Property Index increased<br />
8.6% during the same period, while stocks (as measured by the S&P<br />
500) rose 7.3%. Direct investment in real estate remains attractive at<br />
this point in the cycle compared to the alternatives, particularly given<br />
the run-up in the bull market. While real threats face office market<br />
investors – notably concerns about continued economic growth and<br />
job creation – returns have been solid. Loan balances coming due<br />
in 2014 remain a concern in some asset types and geographies.<br />
Nationally, on balance, asset performance has improved gradually,<br />
with vacancy trending lower.<br />
REAL ESTATE RETURNS VS.<br />
OTHER INVESTMENT OPTIONS<br />
Mid-Year 2013<br />
Total Return/Year<br />
25%<br />
20%<br />
15%<br />
10%<br />
5%<br />
0%<br />
-5%<br />
1 YR. 3 YR. 5 YR. 10 YR.<br />
Sources: NCREIF, Delta Associates; October 2013.<br />
Real Estate<br />
NAREIT Equity REIT Index<br />
NCREIF Property Index<br />
Alternatives<br />
Stocks (S&P 500)<br />
Bonds (Barclays Capital Government)<br />
After peaking in 2009, U.S. office cap rates began their decline and<br />
have trended lower since, though they have plateaued in 2013. The<br />
mean cap rate in the U.S. in 2013 is 7.0% for core office assets, the<br />
same as in 2012 and down from 7.4% in 2011, according to Real<br />
Capital Analytics. We believe cap rates will remain fairly stable<br />
through the remainder of 2013 as market conditions continue to firm.<br />
Given the sluggish pace of economic recovery, we expect interest<br />
rates to remain relatively low into 2015 – though perhaps edging up<br />
slightly as we saw earlier this year – helping to keep cap rates fairly<br />
stable. However, modest job growth is likely to translate into middling<br />
demand for office space in many markets in 2014, which may reduce<br />
investors’ appetite for office product and cause cap rates to edge up.<br />
AVERAGE CORE OFFICE ASSET CAP RATE<br />
United States | 2004 Through August 2013<br />
Average Cap Rate<br />
12%<br />
11%<br />
10%<br />
9%<br />
8%<br />
7%<br />
6%<br />
5%<br />
4%<br />
2004 2005 2006 2007 2008 2009 2010 2011 2012<br />
Sources: Real Capital Analytics, graphic by Delta Associates; October 2013. *Through August 2013.<br />
Looking at the NCREIF Property Index, total returns have edged down<br />
marginally in 2013 compared to the year prior, although <strong>Houston</strong> has<br />
seen an increase in returns compared to 2012. <strong>Houston</strong>’s office asset<br />
returns are 15.92% over the 12 months ending June 2013 after a<br />
return of 13.59% for the 12 months ending June 2012. The returns<br />
in <strong>Houston</strong> led all other major metro areas and well surpassed the<br />
national average of 9.57%. This robust performance can be attributed<br />
largely to demand for office space by the energy sector, <strong>Houston</strong>’s<br />
most important core industry.<br />
NCREIF Return Index 1 for Office Properties<br />
Metro Area<br />
12-Month Total Return<br />
at Mid-Year 2013<br />
<strong>Houston</strong> 15.92%<br />
San Francisco 14.47%<br />
New York 12.79%<br />
Denver 12.08%<br />
Dallas 9.68%<br />
National Average 9.57%<br />
Atlanta 8.99%<br />
Boston 8.36%<br />
Los Angeles 8.27%<br />
Chicago 7.16%<br />
Washington 5.18%<br />
1<br />
NCREIF index includes both current income and capital appreciation returns.<br />
Source: NCREIF, Delta Associates; October 2013.<br />
2013*
TABLE OF CONTENTS<br />
Section One Summary 5<br />
Section Two The National Economy 9<br />
Section Three The <strong>Houston</strong> Metro Economy 16<br />
Section Four The <strong>Houston</strong> Metro Office Market 19<br />
Section Five The <strong>Houston</strong> Metro Industrial Market 27<br />
Section Six Office and Industrial Investment Trends 32<br />
33<br />
Office Investment Sales<br />
Office Investment Sales - Continued<br />
Industrial Investment Sales<br />
Office Investment Prospects<br />
Industrial Investment Prospects<br />
Section Seven The <strong>Houston</strong> Metro Multifamily Market 36<br />
Section Eight The <strong>Houston</strong> Metro Retail Market 38<br />
Foreword | Sponsors | Special Thanks, Acknowledgments & Representations | Contact<br />
TRENDLINES® 2013<br />
Recent activity in <strong>Houston</strong>’s office investment market was highlighted<br />
by the sale of the Men’s Wearhouse headquarters, which closed<br />
for $51.3 million, or $248/SF. There was $2.5 billion in total sales<br />
recorded year-to-date in 2013. The $3.3 billion annualized total for<br />
the year is set to surpass marks of $2.5 billion in 2012 and $1.4 billion<br />
in 2011.<br />
COMPARATIVE INVESTMENT SALES VOLUME<br />
Office Buildings | 2009 –3 RD Quarter 2013<br />
Billions of $<br />
$3.5<br />
$3.0<br />
$2.5<br />
$2.0<br />
$1.5<br />
$1.0<br />
$0.5<br />
$0.0<br />
HOU<br />
DEN<br />
DFW<br />
2009 2010 2011 2012 2013*<br />
Source: Real Capital Analytics, graphic by Delta Associates; October 2013.<br />
*Annualized.<br />
<strong>Houston</strong>’s office sales volume, on pace for $3.3 billion in 2013, puts it<br />
on par with Chicago, San Francisco Bay, and Boston.<br />
OFFICE INVESTMENT SALES VOLUME<br />
Select Metro Areas | January Through August 2013<br />
Millions of $<br />
$14,000<br />
$12,000<br />
$10,000<br />
$8,000<br />
$6,000<br />
$4,000<br />
$2,000<br />
$0<br />
NY LA WAS CHI SF BAY BOS HOU ATL DFW<br />
Sources: Real Capital Analytics, graphic by Delta Associates; October 2013.<br />
Nationally, sales prices have edged down in 2013 to $205/SF in<br />
the first eight months of the year, compared to $216 for all of 2012.<br />
Sales returned to peak levels in <strong>Houston</strong> faster than in many other<br />
major markets in the country. Improved market conditions, driven<br />
by one of the strongest local economies in the nation, continue to<br />
fuel investor interest in the Energy Capital of the World. Hydraulic<br />
fracturing, shale, and alternative fuel activities are giving local energy<br />
companies the confidence and incentive to expand their workforces,<br />
which is translating into greater investor interest in <strong>Houston</strong> office<br />
assets.<br />
DEN<br />
AVERAGE CORE OFFICE ASSET SALES PRICE<br />
United States | 2004 Through August 2013<br />
$ per SF<br />
$275<br />
$250<br />
$225<br />
$200<br />
$175<br />
$150<br />
$125<br />
$100<br />
2004 2005 2006 2007 2008 2009 2010 2011 2012 2013<br />
Sources: Real Capital Analytics, graphic by Delta Associates; October 2013.<br />
The average office sales price in <strong>Houston</strong> through the third quarter<br />
of 2013 is $199/SF, compared to $194/SF during all of 2012. With<br />
the exception of 2009 – the low point of the downturn – values in<br />
<strong>Houston</strong> have generally been on an upward trajectory. Values will<br />
likely increase in the period ahead, as market conditions continue to<br />
strengthen, rents rise, and competition increases for <strong>Houston</strong>’s assets.<br />
AVERAGE OFFICE SALE PRICE<br />
<strong>Houston</strong> Metro | 2002 –3 RD Quarter 2013<br />
Average Sale Price Per SF<br />
$225<br />
$200<br />
$175<br />
$150<br />
$125<br />
$100<br />
$75<br />
$50<br />
$25<br />
$97<br />
$87<br />
$128<br />
$141 $138<br />
$148<br />
<strong>Houston</strong>’s office investment sales market likely will continue to<br />
improve gradually through the remainder of 2013 and into 2014.<br />
While uncertainty within the Federal government (as exemplified by<br />
October’s shutdown) and the larger national economy is hampering<br />
potential growth, <strong>Houston</strong> has remained fairly well insulated. The<br />
<strong>Houston</strong> market has the capacity to outperform the national average<br />
in the period ahead, in terms of percentage increases in both pricing<br />
and volume, due to the strength of the energy industry, its largest<br />
core sector.<br />
The average cap rate on a rolling three-month basis for core <strong>Houston</strong><br />
office assets was 7.2% in June 2013. However, there is a wide range<br />
of cap rates depending on the locations and characteristics of the<br />
properties being traded. Trophy properties have recently traded<br />
at cap rates in the 6.0% range. We expect cap rates to edge down<br />
locally during the balance of 2013, as market fundamentals suggest<br />
increasing investor interest in <strong>Houston</strong>’s office assets. However, if<br />
long-term interest rates rise substantially in the period ahead cap<br />
rates likely will rise in turn.<br />
$168<br />
$50<br />
Source: Real Capital Analytics, graphic by Delta Associates; October 2013.<br />
$180<br />
$214<br />
$194<br />
$199<br />
2002 2003 2004 2005 2006 2007 2008 2009 2010 2011 2012 2013*<br />
*As of Q3 2013.
TABLE OF CONTENTS<br />
Section One Summary 5<br />
Section Two The National Economy 9<br />
Section Three The <strong>Houston</strong> Metro Economy 16<br />
Section Four The <strong>Houston</strong> Metro Office Market 19<br />
Section Five The <strong>Houston</strong> Metro Industrial Market 27<br />
Section Six Office and Industrial Investment Trends 32<br />
34<br />
Office Investment Sales<br />
Office Investment Sales - Continued<br />
Industrial Investment Sales<br />
Office Investment Prospects<br />
Industrial Investment Prospects<br />
Section Seven The <strong>Houston</strong> Metro Multifamily Market 36<br />
Section Eight The <strong>Houston</strong> Metro Retail Market 38<br />
Foreword | Sponsors | Special Thanks, Acknowledgments & Representations | Contact<br />
TRENDLINES® 2013<br />
CAP RATES – CORE OFFICE ASSETS<br />
<strong>Houston</strong> Metro | 2001 – 2013<br />
Average Cap Rate<br />
12%<br />
11%<br />
10%<br />
9%<br />
8%<br />
7%<br />
6%<br />
5%<br />
'01 '02 '03 '04 '05 '06 '07 '08 '09 '10 '11 12 13*<br />
*Quarterly average through June 2013.<br />
Source: Real Capital Analytics, graphic by Delta Associates; October 2013.<br />
As of June 2013, <strong>Houston</strong> office cap rates were still elevated compared<br />
with larger coastal markets such as Manhattan, Washington, and San<br />
Francisco. Buyers who focus on quality <strong>Houston</strong> assets can achieve a<br />
higher initial return on their investment.<br />
AVERAGE OFFICE CAP RATES<br />
Select Metro Areas | Second Quarter 2013<br />
Weighted Average Cap Rate<br />
9.0%<br />
8.5%<br />
8.0%<br />
7.5%<br />
7.0%<br />
6.5%<br />
6.0%<br />
5.5%<br />
5.0%<br />
4.5%<br />
4.0%<br />
3.5%<br />
3.0%<br />
HOU<br />
Top Buyers of Office Buildings<br />
Top investors in office assets nationally in the 12 months ending in<br />
August 2013, according to Real Capital Analytics, include:<br />
• Vornado Realty Trust<br />
• Related Companies<br />
• RXR Realty<br />
• OMERS<br />
CHI<br />
• Zhang Xin<br />
DEN<br />
Note: Three-month rolling average.<br />
Sources: Real Capital Analytics, graphic by Delta Associates; October 2013.<br />
• M. Safra & Co.<br />
• Norges Bank Investment Management<br />
DFW<br />
LA<br />
BOS<br />
SF BAY<br />
WAS<br />
MANHATTAN<br />
Industrial Investment Sales<br />
Despite decelerating some from 2012 numbers, national industrial<br />
investment sales remain well above recessionary levels seen in 2008<br />
through 2010. At the current pace, sales will total $36.3 billion in<br />
2013, compared to $40.3 billion in 2012 and $34.9 billion in 2011.<br />
Additionally, the <strong>Houston</strong> market has seen strong returns over the past<br />
year and is poised to see an increase in demand with the completion<br />
of the Panama Canal expansion in 2015, allowing for a larger amount<br />
of cargo from the Pacific.<br />
INVESTMENT SALES OF INDUSTRIAL BUILDINGS<br />
United States | 2002 Through 2013<br />
Billions of $<br />
$55<br />
$50<br />
$45<br />
$40<br />
$35<br />
$30<br />
$25<br />
$20<br />
$15<br />
$10<br />
$5<br />
$0<br />
2002 2003 2004 2005 2006 2007 2008 2009 2010 2011 2012 2013*<br />
*Sales through August 2013 annualized.<br />
Sources: Real Capital Analytics, graphic by Delta Associates; October 2013.<br />
The <strong>Houston</strong> industrial market achieved total sales volume of $558<br />
million through the first eight months of 2013. Despite the <strong>Houston</strong><br />
industrial market’s low vacancy rate and robust performance, it<br />
remains overshadowed as an investment alternative by larger, coastal<br />
industrial markets such as the LA Basin and New York/Northern New<br />
Jersey.<br />
INDUSTRIAL INVESTMENT SALES VOLUME<br />
Select Metro Areas | January Through August 2013<br />
Millions of $<br />
$4,000<br />
$3,500<br />
$3,000<br />
$2,500<br />
$2,000<br />
$1,500<br />
$1,000<br />
$500<br />
$0<br />
LA BASIN NY/NNJ SF BAY<br />
DFW CHI WAS/BAL HOU ATL DEN<br />
Sources: Real Capital Analytics, graphic by Delta Associates; October 2013.<br />
Returns on investments in industrial assets have shown continued<br />
strength in 2013. Like the office market, the <strong>Houston</strong> industrial market<br />
has performed the best relative to other markets across the country.<br />
Returns in <strong>Houston</strong> measured 15.97% over the 12 months ending<br />
in June 2013, compared to the national average of 10.82%. Among<br />
major industrial markets, only Denver performed nearly as well.
TABLE OF CONTENTS<br />
Section One Summary 5<br />
Section Two The National Economy 9<br />
Section Three The <strong>Houston</strong> Metro Economy 16<br />
Section Four The <strong>Houston</strong> Metro Office Market 19<br />
Section Five The <strong>Houston</strong> Metro Industrial Market 27<br />
Section Six Office and Industrial Investment Trends 32<br />
Office Investment Sales<br />
Office Investment Sales - Continued<br />
Industrial Investment Sales<br />
Office Investment Prospects<br />
Industrial Investment Prospects<br />
Section Seven The <strong>Houston</strong> Metro Multifamily Market 36<br />
Section Eight The <strong>Houston</strong> Metro Retail Market 38<br />
NCREIF Return Index 1 FOR Industrial<br />
Properties<br />
Metro Area<br />
12-Month Total Return At Mid-<br />
Year 2013<br />
<strong>Houston</strong> 15.97%<br />
Denver 15.67%<br />
New York 12.77%<br />
San Francisco 12.39%<br />
Los Angeles 11.73%<br />
National Average 10.82%<br />
Dallas 9.96%<br />
Chicago 8.42%<br />
Atlanta 7.68%<br />
Washington* 7.32%<br />
1<br />
NCREIF index includes both current income and capital appreciation returns. *Baltimore, MD.<br />
Source: NCREIF, Delta Associates; October 2013.<br />
Recorded <strong>Houston</strong> industrial sales volume, at $558 million through<br />
August, is on pace to reach $837 million in 2013. The average sales<br />
price is $55/SF thus far in 2013, up just slightly from $54/SF for all of<br />
2012.<br />
INDUSTRIAL INVESTMENT SALES<br />
<strong>Houston</strong> Metro | 2002 Through 2013<br />
Millions of $<br />
$1,200<br />
$1,000<br />
$800<br />
$600<br />
$400<br />
$200<br />
$0<br />
2002 2003 2004 2005 2006 2007 2008 2009 2010 2011 2012 2013*<br />
*YTD through August, annualized.<br />
Sources: Real Capital Analytics, graphic by Delta Associates; October 2013.<br />
AVERAGE INDUSTRIAL SALES PRICES<br />
Select Metro Areas | January Through August 2013<br />
$ per SF<br />
$180<br />
$160<br />
$140<br />
$120<br />
$100<br />
$80<br />
$60<br />
$40<br />
$20<br />
$0<br />
CHI<br />
ATL<br />
DFW<br />
HOU<br />
DEN<br />
NY/NNJ LA BASIN<br />
Sources: Real Capital Analytics, graphic by Delta Associates; October 2013.<br />
BOS<br />
SF BAY<br />
Office Investment<br />
Prospects<br />
With the exception of 2009 – the low point of the<br />
downturn – values in <strong>Houston</strong> have risen nearly every<br />
year since 2003 and will likely grow in the period ahead,<br />
as market conditions continue to strengthen, rents rise,<br />
and competition increases for <strong>Houston</strong>’s assets. The<br />
<strong>Houston</strong> office market will continue to attract additional<br />
interest from investors so long as the energy industry<br />
continues its strong performance. <strong>Houston</strong> office<br />
assets remain a bargain compared to gateway markets,<br />
potentially allowing for further price appreciation in<br />
2014.<br />
Industrial Investment<br />
Prospects<br />
Investor demand for industrial properties in <strong>Houston</strong> will<br />
continue to strengthen with the abundance of capital<br />
(core and value-add funds) that is chasing industrial<br />
product based on the strength of the market and the<br />
<strong>Houston</strong> economy. This, coupled with the lack of quality<br />
product on the market, will continue to put downward<br />
pressure on cap rates (perhaps below 6% for premier<br />
assets) as long as interest rates remain low by historical<br />
standards. If long-term interest rates rise in 2014 cap<br />
rates for <strong>Houston</strong> industrial product may edge up, but<br />
the market’s strong fundamentals, including the lowest<br />
vacancy rate among major metro areas, will encourage<br />
investor interest.<br />
Foreword | Sponsors | Special Thanks, Acknowledgments & Representations | Contact<br />
35<br />
TRENDLINES® 2013<br />
Cap rates for recorded sales of <strong>Houston</strong> industrial product in 2013<br />
have been concentrated in the 6.0% to 7.0% range. There continues<br />
to be a large spread between Class A and Class B product, reflecting<br />
a flight to quality in the market.
TABLE OF CONTENTS<br />
Section One Summary 5<br />
Section Two The National Economy 9<br />
Section Three The <strong>Houston</strong> Metro Economy 16<br />
Section Four The <strong>Houston</strong> Metro Office Market 19<br />
Section Five The <strong>Houston</strong> Metro Industrial Market 27<br />
Section Six Office and Industrial Investment Trends 32<br />
Section Seven The <strong>Houston</strong> Metro Multifamily Market 36<br />
36<br />
Multifamily: Strong Performance<br />
Net Absorption Ranks Second in the U.S.<br />
Vacancy: New Cyclical Low<br />
Rents: Highest Level on Record<br />
<strong>Houston</strong> Metro Multifamily Market Outlook<br />
Section Eight The <strong>Houston</strong> Metro Retail Market 38<br />
Foreword | Sponsors | Special Thanks, Acknowledgments & Representations | Contact<br />
TRENDLINES® 2013<br />
Multifamily: Strong Performance<br />
The <strong>Houston</strong> metro multifamily market continues to expand due<br />
to population increases and one of the highest job growth rates in<br />
the country. This year has seen market fundamentals improve, with<br />
absorption and rents up and vacancy down. The <strong>Houston</strong> apartment<br />
market, at over 511,000 units, ranks sixth in the nation in terms of total<br />
market size (New York is not included in the accompanying graph to<br />
conserve scale).<br />
LARGEST MULTIFAMILY MARKETS<br />
United States | 2013<br />
Thousands of Apartment Units<br />
900<br />
800<br />
700<br />
600<br />
500<br />
400<br />
300<br />
200<br />
100<br />
0<br />
LA CHI DFW WAS HOU ATL PHX<br />
Source: REIS, Delta Associates; October 2013.<br />
Note: Excludes NYC and includes only those units in projects<br />
of 40 or more units (20+ units in California and Arizona).<br />
Net Absorption Ranks Second in the U.S.<br />
Net absorption for all classes of apartments remained strong yearto-date<br />
in the <strong>Houston</strong> metro as of September 2013, surpassing the<br />
pace of absorption in 2012. Absorption was approximately 16,168<br />
units year-to-date through September 2013, compared to 14,664<br />
units during all of 2012. <strong>Houston</strong>’s population is increasing as the<br />
availability of employment attracts new residents from other parts of<br />
the country.<br />
NET ABSORPTION - ALL CLASSES<br />
<strong>Houston</strong> Metro | 2005 Through September 2013<br />
Thousands of Units<br />
40<br />
30<br />
20<br />
10<br />
0<br />
-10<br />
2005 2006 2007 2008 2009 2010 2011 2012 2013*<br />
Source: ADS, Delta Associates; October 2013.<br />
*January through September 2013.<br />
<strong>Houston</strong> has the second highest net absorption of units compared to<br />
other U.S. metro areas for the 12 months ending June 2013. Demand<br />
for apartments has remained strong nationwide as tight lending<br />
requirements are limiting the potential pool of homebuyers and in<br />
turn funneling a growing cohort of young adults into apartments.<br />
NET ABSORPTION – ALL CLASSES<br />
Select Metro Areas | 2013*<br />
Units<br />
12,000<br />
10,000<br />
8,000<br />
6,000<br />
4,000<br />
2,000<br />
0<br />
DFW HOU LA WAS CHI ATL PHX NY<br />
Source: REIS, Delta Associates; October 2013.<br />
*12 months ending 6/13.<br />
Vacancy: New Cyclical Low<br />
The delivery of new apartment units has not kept pace with demand<br />
in the past year, leading to a declining vacancy rate. Vacancy as of<br />
September 2013 stood at 8.9%, down from 10.6% at the end of 2012<br />
and 12.3% at year-end 2011. The vacancy rate for all classes of <strong>Houston</strong><br />
metro apartments has continued to decline following its spike in 2009<br />
and is now at the lowest level in the past decade. With strong job<br />
creation and population growth expected to continue, we anticipate<br />
the vacancy rate will edge down further over the next 12 months.<br />
APARTMENT VACANCY RATE – ALL CLASSES<br />
<strong>Houston</strong> Metro | 2005 Through September 2013<br />
Vacancy Rate<br />
18%<br />
16%<br />
14%<br />
12%<br />
10%<br />
8%<br />
6%<br />
4%<br />
2%<br />
0%<br />
9.4%<br />
2005 2006 2007 2008 2009 2010 2011 2012 2013*<br />
Source: ADS, Delta Associates; October 2013.<br />
16.1%<br />
Rents: Highest Level on Record<br />
Strong demand and declining vacancy have allowed property owners<br />
to push rents to record levels in 2013. The average rental rate for<br />
<strong>Houston</strong> apartments was $0.97/SF/month at the end of September,<br />
up 6.0% over the past 12 months. Rents will likely increase through<br />
the balance of 2013 and into 2014 as job creation continues and<br />
economic growth strengthens.<br />
AVERAGE APARTMENT RENTAL RATE<br />
<strong>Houston</strong> Metro | October 2011 Through September 2013<br />
Rent ($/SF/month)<br />
$0.99<br />
$0.97<br />
$0.95<br />
$0.93<br />
$0.91<br />
$0.89<br />
$0.87<br />
$0.85<br />
Source: ADS, Delta Associates; October 2013.<br />
8.9%<br />
*As of September 2013.<br />
6.0% increase in the<br />
last 12 months<br />
Oct Nov Dec Jan Feb Mar Apr May Jun Jul Aug Sep Oct Nov Dec Jan Feb Mar Apr May Jun Jul Aug Sep<br />
2011 2012<br />
2013<br />
$0.97
TABLE OF CONTENTS<br />
Section One Summary 5<br />
Section Two The National Economy 9<br />
Section Three The <strong>Houston</strong> Metro Economy 16<br />
Section Four The <strong>Houston</strong> Metro Office Market 19<br />
Section Five The <strong>Houston</strong> Metro Industrial Market 27<br />
Section Six Office and Industrial Investment Trends 32<br />
Section Seven The <strong>Houston</strong> Metro Multifamily Market 36<br />
Multifamily: Strong Performance<br />
Net Absorption Ranks Second in the U.S.<br />
Vacancy: New Cyclical Low<br />
Rents: Highest Level on Record<br />
<strong>Houston</strong> Metro Multifamily Market Outlook<br />
Section Eight The <strong>Houston</strong> Metro Retail Market 38<br />
<strong>Houston</strong> Metro Multifamily Market<br />
Outlook<br />
The <strong>Houston</strong> metro multifamily market likely will continue the steady growth it has experienced<br />
during the last four years as the regional economy adds jobs and population growth persists.<br />
<strong>Houston</strong>’s local economic strength has benefited the apartment market, with job seekers attracted<br />
to <strong>Houston</strong> and taking rental units off the market. Rents likely will rise during the balance of 2013<br />
and into 2014. With long-term interest rates rising (and likely to dampen demand for for-sale<br />
housing) and with continuing robust job growth in <strong>Houston</strong>, we expect the local multifamily market<br />
to remain strong next year.<br />
Foreword | Sponsors | Special Thanks, Acknowledgments & Representations | Contact<br />
37<br />
TRENDLINES® 2013
TABLE OF CONTENTS<br />
Section One Summary 5<br />
Section Two The National Economy 9<br />
Section Three The <strong>Houston</strong> Metro Economy 16<br />
Section Four The <strong>Houston</strong> Metro Office Market 19<br />
Section Five The <strong>Houston</strong> Metro Industrial Market 27<br />
Section Six Office and Industrial Investment Trends 32<br />
Section Seven The <strong>Houston</strong> Metro Multifamily Market 36<br />
Section Eight The <strong>Houston</strong> Metro Retail Market 38<br />
Retail Sector Growing<br />
Retail Inventory: Getting Larger<br />
Retail Employment Rising<br />
Retail Vacancy Down Year-over-Year<br />
Retail Rents Tick Down for All Classes of Space Combined<br />
Retail Spending Continues Recovery<br />
Retail Market Likely to Expand in 2014<br />
Foreword | Sponsors | Special Thanks, Acknowledgments & Representations | Contact<br />
38<br />
TRENDLINES® 2013<br />
Retail Sector Growing<br />
Metro <strong>Houston</strong>’s retail market experienced steady improvement in<br />
2013, as the economy strengthened and job growth remained strong<br />
locally. This sector’s growth is supported by one of the nation’s best<br />
regional economies and its solid employment gains, reinforced by<br />
hiring in the core industries.<br />
Retail Inventory: Getting Larger<br />
The <strong>Houston</strong> metro area has approximately 340 million square feet<br />
of retail inventory. Approximately two-thirds of <strong>Houston</strong>’s retail<br />
inventory consists of neighborhood and community center product<br />
types, including power, lifestyle, outlet, and theme/festival centers.<br />
RETAIL MARKET SCALE<br />
<strong>Houston</strong> Metro – October 2013<br />
Regional<br />
Malls**<br />
Community<br />
Centers*<br />
Strip<br />
Centers<br />
Total =<br />
340.1 Million SF<br />
Source: Delta Associates' analysis of CoStar data; October 2013.<br />
*Includes power, lifestyle, outlet, and theme/festival centers.<br />
** Includes regional and super regional centers.<br />
Neighborhood<br />
Centers<br />
Retail Employment Rising<br />
The Retail sector in metro <strong>Houston</strong> added 9,100 jobs over the<br />
12-month period ending August 2013 in metro <strong>Houston</strong>, a 3.3% gain<br />
and a firm indicator of strength in this sector. On a trailing 12-month<br />
basis, retail employment in the <strong>Houston</strong> metro area increased for the<br />
34th consecutive month. Retail employment will likely continue to<br />
increase as consumer spending increases in 2014.<br />
RETAIL JOB GROWTH<br />
<strong>Houston</strong> Metro | 1997 – August 2013<br />
Jobs in Thousands<br />
14<br />
12<br />
10<br />
8<br />
6<br />
4<br />
2<br />
0<br />
-2<br />
-4<br />
-6<br />
-8<br />
1997 1998 1999 2000 2001 2002 2003 2004 2005 2006 2007 2008 2009 2010 2011 2012 2013*<br />
*12 months ending in August.<br />
Source: U.S. Bureau of Labor Statistics, Delta Associates; October 2013.<br />
Retail Vacancy Down Year-over-Year<br />
<strong>Houston</strong>’s retail vacancy rate, at 10.1% in the 3rd quarter of 2013, is<br />
down from 11.0% in the 3rd quarter of 2012. We expect that vacancy<br />
will remain steady or decline modestly for the remainder of 2013 and<br />
into early 2014, as <strong>Houston</strong>’s consumer sector remains strong and<br />
retailers open more stores.<br />
VACANCY RATE TRENDS<br />
<strong>Houston</strong> Metro Retail Market | 2000 – Q3 2013<br />
17%<br />
16%<br />
15%<br />
14%<br />
13%<br />
12%<br />
11%<br />
10.1%<br />
10%<br />
9%<br />
2000 2001 2002 2003 2004 2005 2006 2007 2008 2009 2010 2011 2012 2013<br />
Source: O’Connor & Associates, Delta Associates; October 2013.<br />
Note: Data source has adjusted its inventory and restated its vacancy rates.<br />
Vacancy Rate<br />
Retail Rents Tick Down for All Classes of<br />
Space Combined<br />
Retail rents remained at $1.40/SF/month in the 3rd quarter of 2013<br />
for all classes of retail space combined. Rents for superior product<br />
are rising; commodity product is reducing the overall average. While<br />
overall rents declined during the past year, they likely will experience<br />
modest growth during the balance of 2013 and into 2014, as<br />
consumer spending accelerates and market conditions continue to<br />
strengthen. The recent trends in vacancy have set the stage for rent<br />
growth.<br />
AVERAGE RENTAL RATE<br />
<strong>Houston</strong> Metro Retail Market | 2000 – Q3 2013<br />
Average Rental Rate<br />
(Per SF, Per Month)<br />
$1.70<br />
$1.60<br />
$1.50<br />
$1.40<br />
$1.30<br />
2000 2001 2002 2003 2004 2005 2006 2007 2008 2009 2010 2011 2012 2013<br />
Source: O’Connor & Associates, Delta Associates; October 2013.<br />
Note: Data source has adjusted its inventory and restated its rental rates.<br />
$1.40<br />
Retail Spending Continues Recovery<br />
The most recent data from the Texas Comptroller’s Office show that<br />
gross retail sales in the <strong>Houston</strong> metro area totaled $107.5 billion<br />
during all of 2012. Figures for the 1st quarter of 2013 suggest an<br />
annualized total of $115.6 billion during all of 2013, which would<br />
be a new high. We expect that retail sales will continue to grow in<br />
metro <strong>Houston</strong> in 2014, in part due to <strong>Houston</strong>’s growing population<br />
and employment base, and in part due to the greater aggregated<br />
discretionary income that a growing labor force generates.<br />
GROSS RETAIL SALES<br />
<strong>Houston</strong> Metro | 2002 – 2013<br />
Total Gross Retail Sales<br />
(in Billions of Dollars)<br />
$120 $115.6<br />
$110<br />
$100<br />
$90<br />
$80<br />
$70<br />
$60<br />
$50<br />
$55.3<br />
2002 2003 2004 2005 2006 2007 2008 2009 2010 2011 2012 2013*<br />
Source: Texas Comptroller’s Office, Delta Associates; October 2013.<br />
$101.4<br />
$87.9<br />
*Estimate.
TABLE OF CONTENTS<br />
Section One Summary 5<br />
Section Two The National Economy 9<br />
Section Three The <strong>Houston</strong> Metro Economy 16<br />
Section Four The <strong>Houston</strong> Metro Office Market 19<br />
Section Five The <strong>Houston</strong> Metro Industrial Market 27<br />
Section Six Office and Industrial Investment Trends 32<br />
Section Seven The <strong>Houston</strong> Metro Multifamily Market 36<br />
Section Eight The <strong>Houston</strong> Metro Retail Market 38<br />
Retail Sector Growing<br />
Retail Inventory: Getting Larger<br />
Retail Employment Rising<br />
Retail Vacancy Down Year-over-Year<br />
Retail Rents Tick Down for All Classes of Space Combined<br />
Retail Market Likely to Expand in 2014<br />
The <strong>Houston</strong> retail market will likely see further expansion during the balance of 2013 and into<br />
2014, as local job growth remains robust and the consumer sector is strengthening. Nationally,<br />
consumer confidence remains at its highest point in over five years. With regional economic<br />
growth, new consumers will arrive, increasing total consumption. A growth cycle in the retail<br />
market will likely occur over the next several years, making investment very attractive. As<br />
an example, Dunkin’ Donuts plans on opening 60 new stores in <strong>Houston</strong> over the next five<br />
years, creating many new jobs in the process. Additionally, Costco, Fresh Market, and Sprouts<br />
Farmers Market all have plans to expand in <strong>Houston</strong> or recently have. We look for a focus on<br />
such grocery-anchored and mixed-use development, as well as increasing urban infill projects,<br />
as these best address consumers’ needs and preferences.<br />
Retail Spending Continues Recovery<br />
Retail Market Likely to Expand in 2014<br />
Foreword | Sponsors | Special Thanks, Acknowledgments & Representations | Contact<br />
39<br />
TRENDLINES® 2013
Atlanta<br />
3340 Peachtree Rd<br />
Suite 1000<br />
Atlanta, Georgia 30326<br />
PHONE: 404.842.6600<br />
Fort Lauderdale<br />
110 Tower<br />
110 Southeast 6th Street<br />
Fort Lauderdale, Florida 33301<br />
PHONE: 954.607.1083<br />
New Jersey<br />
300 Kimball Drive<br />
1st Floor<br />
Parsippany, New Jersey 07054<br />
PHONE: 973.947.9200<br />
San Antonio<br />
8200 IH-10 West<br />
Suite 800<br />
San Antonio, Texas 78230<br />
PHONE: 210.341.1344<br />
Austin<br />
901 MoPac Expressway<br />
South Bldg. 4, Suite 250<br />
Austin, Texas 78746<br />
PHONE: 512.328.5600<br />
Fort Worth<br />
100 Throckmorton Street<br />
Suite 700<br />
Fort Worth, Texas 76102<br />
PHONE: 817.877.4433<br />
New Orleans<br />
935 Gravier Street<br />
Suite 600<br />
New Orleans, Louisiana 70112<br />
PHONE: 504.528.9910<br />
San Diego<br />
5935 Cornerstone Court West<br />
Suite 200<br />
San Diego, California 92121<br />
PHONE: 858.452.8668<br />
Baltimore<br />
7160 Columbia Gateway Dr<br />
Suite 210<br />
Columbia, Maryland 21046<br />
PHONE: 443.285.0770<br />
Greenwich<br />
1 Fawcett Place<br />
4th Floor<br />
Greenwich, Connecticut 06830<br />
PHONE: 203.637.9300<br />
New York<br />
400 Park Avenue<br />
16th Floor<br />
New York, New York 10022<br />
PHONE: 212.537.0370<br />
San Francisco<br />
Four Embarcadero Center<br />
Suite 1400<br />
San Francisco, California 94111<br />
PHONE: 415.489.1821<br />
Bethesda<br />
6700 Rockledge Dr<br />
Suite 400-A<br />
Bethesda, Maryland 20817<br />
PHONE: 301.571.0900<br />
<strong>Houston</strong><br />
1900 West Loop South<br />
Suite 1300<br />
<strong>Houston</strong>, Texas 77027<br />
PHONE: 713.270.7700<br />
Northern Virginia<br />
8614 Westwood Center Drive<br />
Suite 800<br />
Vienna, Virginia 22182<br />
PHONE: 703.821.0040<br />
Seattle<br />
1420 Fifth Avenue<br />
Suite 2204<br />
Seattle, Washington 98101<br />
PHONE: 206.737.4300<br />
Boston<br />
75 State Street<br />
Boston, Massachusetts<br />
PHONE: 617.439.6000<br />
Chicago<br />
200 West Madison St<br />
Suite 3300<br />
Chicago, Illinois 60606<br />
PHONE: 312.881.7000<br />
Dallas<br />
5001 Spring Valley Rd<br />
Suite 400W<br />
Dallas, Texas 75244<br />
PHONE: 972.774.2500<br />
Denver<br />
4643 S. Ulster St<br />
Suite 300<br />
Denver, Colorado 80237<br />
PHONE: 303.639.3000<br />
Detroit<br />
32255 Northwestern Highway,<br />
Suite 206<br />
Farmington Hills, Michigan 48334<br />
PHONE: 248.932.2840<br />
Los Angeles<br />
601 South Figueroa Street<br />
Suite 2750<br />
Los Angeles, California 90017<br />
PHONE: 213.624.5700<br />
MENA<br />
Prince Turki Bin Abdullah Al-<br />
Saud St.,<br />
Sulaimania Area , P.O. Box 2600<br />
Riyadh, KSA 11461<br />
PHONE: +966 (1) 292.24.22<br />
Miami<br />
100 SE 2nd Street<br />
Suite 3100<br />
Miami, Florida 33131<br />
PHONE: 305.808.7310<br />
Milwaukee<br />
234 W. Florida Street<br />
Suite 310<br />
Milwaukee, Wisconsin 53204<br />
PHONE: 414.937.5030<br />
Minneapolis<br />
706 Second Avenue South<br />
100 Baker Building<br />
Minneapolis, Minnesota 55402<br />
PHONE: 612.343.4200<br />
Oklahoma City<br />
235 North MacArthur<br />
Suite 500<br />
Oklahoma City, Oklahoma 73127<br />
PHONE: 405.789.0900<br />
Orange County<br />
2211 Michelson Drive<br />
Suite 650<br />
Irvine, California 92612<br />
PHONE: 949.751.5700<br />
Orlando<br />
158 Tuskawilla Road<br />
Suite 2324<br />
Winter Springs, Florida 32708<br />
PHONE: 407.253.3140<br />
Phoenix<br />
2415 E. Camelback Road<br />
Suite 900<br />
Phoenix, Arizona 85016<br />
PHONE: 602.956.5000<br />
Salt Lake City<br />
11781 S. Lone Peak Pkwy<br />
Suite 250<br />
Draper, Utah 84020<br />
PHONE: 801.972.5200<br />
Silicon Valley<br />
2025 Gateway Place<br />
Suite 328<br />
San Jose, California 95110<br />
PHONE: 408.843.4100<br />
St. Louis<br />
1001 Highlands Plaza Drive West<br />
Suite 150<br />
St. Louis, Missouri 63110<br />
PHONE: 314.621.1414<br />
Walnut Creek<br />
500 Ygnacio Valley Road<br />
Suite 100<br />
Walnut Creek, California 94596<br />
PHONE: 925.357.2000<br />
Washington, D.C.<br />
1700 K Street, NW<br />
Suite 660<br />
Washington, DC 20006<br />
PHONE: 202.775.7000<br />
TRANSWESTERN HOUSTON<br />
1900 WEST LOOP SOUTH, SUITE 1300<br />
HOUSTON, <strong>TX</strong> 77027<br />
PHONE: 713.270.7700 | FAX: 713.270.6285<br />
WWW.TRANSWESTERN.NET/HOUSTON<br />
DELTA ASSOCIATES<br />
500 MONTGOMERY ST, SUITE 600<br />
ALEXANDRIA, VA 22314<br />
PHONE: 703.836.5700 | FAX: 703.836.5765<br />
WWW.DELTAASSOCIATES.COM