Exclusive Investment Offering: Condominium Interest - Transwestern
Exclusive Investment Offering: Condominium Interest - Transwestern
Exclusive Investment Offering: Condominium Interest - Transwestern

Create successful ePaper yourself
Turn your PDF publications into a flip-book with our unique Google optimized e-Paper software.
Demographic Summary<br />
Fairfax County has been one of the most rapidly growing<br />
jurisdictions in the United States over the past three decades<br />
– more than doubling the size of its population since 1970.<br />
Despite this growth downtown McLean has been successful in<br />
retaining its small-town charm. Its current population is 67,500<br />
and is projected to grow 17% by 2025. Residents within a mile<br />
radius of The Palladium boast a median household income of<br />
$158,000, one of the highest in the country and nearly triple that<br />
of Virginia at $54,240. Income levels are likely to remain in the<br />
uppermost tier because of the area’s low unemployment rates<br />
(3.0%), high levels of educational attainment, and the diversity<br />
of public and private job sectors. Housing values in McLean<br />
also benefit from the region’s economic stability; the estimated<br />
home value is $865,000 which has grown 120% since 2000 when<br />
it stood at $388,000.<br />
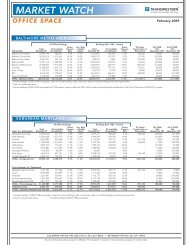
The Shops at The Palladium November 2007<br />
1445 LAUGHLIN AVENUE, MCLEAN, VA<br />
1 Mile Radius 3 Mile Radius 5 Mile Radius<br />
POPULATION<br />
2006 Estimated Population 10,162 77,209 263,319<br />
2011 Projected Population 10,499 79,644 270,308<br />
2000 Census Population 9,709 74,118 254,849<br />
1990 Census Population 9,736 69,952 233,023<br />
Historical Annual Growth 1990 to 2006 0.3% 0.6% 0.8%<br />
Projected Annual Growth 2006 to 2011 0.7% 0.6% 0.5%<br />
2006 Median Age 46.0 41.8 40.6<br />
HOUSEHOLDS<br />
2006 Estimated Households 4,029 30,791 102,671<br />
2011 Projected Households 4,158 31,654 104,924<br />
2000 Census Households 3,877 29,705 99,570<br />
1990 Census Households 3,741 27,206 89,766<br />
Historical Annual Growth 1990 to 2006 0.5% 0.8% 0.9%<br />
Projected Annual Growth 2006 to 2011 0.6% 0.6% 0.4%<br />
POPULATION BY RACE<br />
2006 Estimated White 78.6% 78.2% 76.8%<br />
2006 Estimated Black or African American 2.1% 2.6% 3.9%<br />
2006 Estimated Asian & Pacific Islander 16.4% 15.6% 14.3%<br />
2006 Estimated American Indian & Native Alaskan 0.1% 0.1% 0.2%<br />
2006 Estimated Hispanic 5.5% 7.9% 10.8%<br />
INCOME<br />
2006 Estimated Average Household Income $ 158,572 $ 154,514 $ 150,072<br />
2006 Estimated Median Household Income $ 126,733 $ 122,395 $ 119,197<br />
2006 Estimated Per Capita Income $ 62,938 $ 61,863 $ 58,916<br />
EDUCATION (AGE 25+)<br />
2006 High School Graduate 8.4% 9.5% 10.0%<br />
2006 Some College 9.2% 8.6% 9.2%<br />
2006 Associates Degree Only 4.7% 4.6% 4.5%<br />
2006 Bachelors Degree Only 28.9% 32.2% 31.2%<br />
2006 Graduate Degree 47.0% 43.1% 41.3%<br />
BUSINESS<br />
Number of Businesses 1,390 4,836 14,166<br />
Total Number of Employees 9,969 67,776 178,633<br />
Employee Population per Business 7.2 14.0 12.6<br />
Residential Population per Business 7.3 16.0 18.6<br />
57<br />
At left: Tysons Corner Center<br />
Above: New Housing along Chain Bridge Road<br />
ASSET INVESTMENT SALES GROUP