ESIA Albania Annex 9 - Sediment Dispersion Modelling
ESIA Albania Annex 9 - Sediment Dispersion Modelling
ESIA Albania Annex 9 - Sediment Dispersion Modelling

You also want an ePaper? Increase the reach of your titles
YUMPU automatically turns print PDFs into web optimized ePapers that Google loves.
<strong>ESIA</strong> <strong>Albania</strong><br />
<strong>Annex</strong> 9 - <strong>Sediment</strong> <strong>Dispersion</strong> <strong>Modelling</strong>
Trans Adriatic Pipeline – TAP, <strong>ESIA</strong> <strong>Albania</strong>, <strong>Annex</strong> 9 - <strong>Sediment</strong> <strong>Dispersion</strong> <strong>Modelling</strong><br />
AAL00-ERM-641-Y-TAE-1010, Rev.: 01 / at05, Page 2 of 278<br />
TAP (Trans Adriatic Pipeline)<br />
<strong>Sediment</strong> dispersion study at the<br />
<strong>Albania</strong>n landfall site
Trans Adriatic Pipeline – TAP, <strong>ESIA</strong> <strong>Albania</strong>, <strong>Annex</strong> 9 - <strong>Sediment</strong> <strong>Dispersion</strong> <strong>Modelling</strong><br />
AAL00-ERM-641-Y-TAE-1010, Rev.: 01 / at05, Page 3 of 278<br />
TAP (Trans Adriatic Pipeline)<br />
<strong>Sediment</strong> dispersion study at the<br />
<strong>Albania</strong>n landfall site<br />
Via Pomba 23<br />
I-10123 Torino<br />
Italia<br />
Tel: +39 011 56 24 649<br />
Fax: +39 011 56 20 620<br />
dhi-italia@dhi-italia.it<br />
www.dhi-italia.it<br />
Client<br />
Client’s representative<br />
ERM, TAP<br />
Alberto Sambartolome<br />
Javier Odriozola<br />
Project<br />
Project No.<br />
TAP (Trans Adriatic Pipeline): sediment dispersion<br />
study at the <strong>Albania</strong>n landfall site<br />
22700172-01-00101<br />
Authors<br />
Paola Letizia<br />
Date<br />
Approved by<br />
29 May 2012<br />
Andrea Pedroncini<br />
01 Final Report PLE ANP ANP MAY 12<br />
Revision Description by Verified Approved Date<br />
Key words<br />
Representative meteomarine conditions<br />
Dredging release rate<br />
<strong>Sediment</strong> plume<br />
Classification<br />
Open<br />
Internal<br />
Proprietary<br />
Distribution:<br />
ERM, TAP:<br />
DHI Italia:<br />
Alberto Sambartolome<br />
Luisa Di Chele<br />
No of copies<br />
1 (pdf)<br />
1 (pdf)
Trans Adriatic Pipeline – TAP, <strong>ESIA</strong> <strong>Albania</strong>, <strong>Annex</strong> 9 - <strong>Sediment</strong> <strong>Dispersion</strong> <strong>Modelling</strong><br />
AAL00-ERM-641-Y-TAE-1010, Rev.: 01 / at05, Page 4 of 278<br />
CONTENTS<br />
1 INTRODUCTION ........................................................................................................... 1<br />
2 OFFSHORE METEOMARINE CONDITIONS ................................................................ 2<br />
2.1 Wind climate offshore the <strong>Albania</strong>n Coast ..................................................................... 2<br />
2.2 Wave climate offshore the <strong>Albania</strong>n landfall site............................................................ 6<br />
2.3 Tidal conditions ........................................................................................................... 12<br />
2.4 Currents from the general circulation of the Adriatic Sea, temperature and salinity ..... 13<br />
2.4.1 Currents, temperature and salinity offshore the <strong>Albania</strong>n landfall site .......................... 15<br />
3 REPRESENTATIVE METEOMARINE SCENARIOS ................................................... 23<br />
4 3D HYDRODYNAMIC MODEL .................................................................................... 31<br />
4.1 Bathymetric data, model domain and resolution .......................................................... 31<br />
4.2 Scenario 1: results ...................................................................................................... 35<br />
4.3 Scenario 2: results ...................................................................................................... 42<br />
4.4 Scenario 3: results ...................................................................................................... 48<br />
4.5 Considerations on tidal currents .................................................................................. 58<br />
5 3D SEDIMENT DISPERSION MODEL ........................................................................ 60<br />
5.1 Methodological approach ............................................................................................ 60<br />
5.1.1 Selection of representative points for the sediment release ......................................... 60<br />
5.1.2 Dredging rate, release rate, settling velocity ................................................................ 62<br />
5.1.3 Model bathymetries ..................................................................................................... 65<br />
5.2 Assumptions on background suspended sediment concentration ............................... 69<br />
5.3 Scenario 1: results ...................................................................................................... 69<br />
5.4 Scenario 2: results ...................................................................................................... 74<br />
5.5 Scenario 3: results ...................................................................................................... 79<br />
5.6 Settling of fine sediment in the model domain ............................................................. 80<br />
5.7 Settling of sand in the model domain ........................................................................... 81<br />
6 CONCLUSIONS .......................................................................................................... 82<br />
7 REFERENCES ........................................................................................................... 84<br />
22700172-01-00101.docx i DHI Italia
Trans Adriatic Pipeline – TAP, <strong>ESIA</strong> <strong>Albania</strong>, <strong>Annex</strong> 9 - <strong>Sediment</strong> <strong>Dispersion</strong> <strong>Modelling</strong><br />
AAL00-ERM-641-Y-TAE-1010, Rev.: 01 / at05, Page 5 of 278<br />
1 INTRODUCTION<br />
The scope of the work is to study, by means of numerical modelling, the<br />
sediment release and dispersion during the construction phase of the Trans<br />
Adriatic Pipeline (TAP). The present study is part of the Environmental and Social<br />
Impact Assessment (<strong>ESIA</strong>) for the offshore part of the <strong>Albania</strong>n landfall of the<br />
TAP.<br />
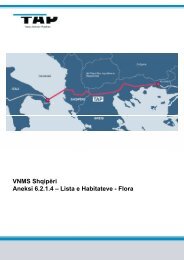
The pipeline is planned to go from Italy (Puglia) to <strong>Albania</strong>, covering a distance<br />
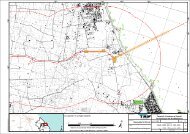
of more than 100 km. Figure 1-1 illustrates the pipeline route.<br />
Figure 1-1 Illustration of the pipeline route. Source: Google Earth<br />
In Chapter 2 the analysis of the offshore meteomarine data is illustrated. In<br />
particular, the available data of wind, waves, tide, currents from the general<br />
circulation of the Adriatic Sea (the so called “baroclinic currents”), temperature<br />
and salinity are described. The analysis and processing of these raw data have<br />
led to the identification of representative meteomarine conditions for the<br />
<strong>Albania</strong>n landfall site.<br />
Based on these analyses, three representative scenarios have been selected<br />
(Chapter 3). The assumptions and the results of the hydrodynamic and sediment<br />
dispersion models are illustrated in Chapters 4 and 5.<br />
22700172-01-00101.docx 1 DHI Italia
Trans Adriatic Pipeline – TAP, <strong>ESIA</strong> <strong>Albania</strong>, <strong>Annex</strong> 9 - <strong>Sediment</strong> <strong>Dispersion</strong> <strong>Modelling</strong><br />
AAL00-ERM-641-Y-TAE-1010, Rev.: 01 / at05, Page 6 of 278<br />
2 OFFSHORE METEOMARINE CONDITIONS<br />
The scope of this chapter is to provide a description of the available data of the<br />
meteomarine conditions offshore the <strong>Albania</strong>n landfall site of the TAP. In<br />
particular, the following chapters describe the wind and wave conditions, both<br />
yearly and seasonal, tidal variations and the circulation in the southern Adriatic<br />
Sea (baroclinic currents).<br />
2.1 Wind climate offshore the <strong>Albania</strong>n Coast<br />
The database used to analyse the wind climate conditions offshore the <strong>Albania</strong>n<br />
coast comes from the “Wind and Wave Mediterranean Atlas” [1] which is the<br />
result of the Medatlas project led by a consortium of six companies located in<br />
France, Italy and Greece between 1999 and 2004.<br />
This electronic atlas provides data of univariate and bivariate statistics, yearly<br />
and seasonal, of wind and wave (speed/height and direction). In particular, the<br />
reference station used in the present study is located at the point of<br />
geographical coordinates LON 19° LAT 41°, as shown in Figure 2-1, 30 km<br />
north-west of the <strong>Albania</strong>n landfall site.<br />
Figure 2-1 Location of point (LON 19° LAT 41°) in the Mediterranean Atlas. Source:<br />
“Wind and Wave Mediterranean Atlas” [1]<br />
The available wind data are illustrated in a scatter table of wind speed vs. wind<br />
direction (Table 2-1) and in a yearly wind rose (Figure 2-2). The data are also<br />
represented in seasonal wind roses (Figure 2-3).<br />
The analysis of wind data, as wind speed and directions, shows that the most<br />
frequent winds come from south-east while the strongest winds (maximum wind<br />
speed higher than 16 m/s) come from the sector around south (165° N to<br />
195°N).<br />
22700172-01-00101.docx 2 DHI Italia
Trans Adriatic Pipeline – TAP, <strong>ESIA</strong> <strong>Albania</strong>, <strong>Annex</strong> 9 - <strong>Sediment</strong> <strong>Dispersion</strong> <strong>Modelling</strong><br />
AAL00-ERM-641-Y-TAE-1010, Rev.: 01 / at05, Page 7 of 278<br />
Also the north-west sector is important in connection with frequency of<br />
occurrence; the importance of these directions is mainly observable during the<br />
summer season, when this sector becomes prevalent.<br />
Table 2-1<br />
Yearly wind climate – scatter table of wind speed vs. wind direction. Source:<br />
“Wind and Wave Mediterranean Atlas” [1]<br />
22700172-01-00101.docx 3 DHI Italia
Trans Adriatic Pipeline – TAP, <strong>ESIA</strong> <strong>Albania</strong>, <strong>Annex</strong> 9 - <strong>Sediment</strong> <strong>Dispersion</strong> <strong>Modelling</strong><br />
AAL00-ERM-641-Y-TAE-1010, Rev.: 01 / at05, Page 8 of 278<br />
Figure 2-2 Yearly wind rose. Source: the rose is processed by DHI on the basis of wind<br />
data coming from “Wind and Wave Mediterranean Atlas” [1]<br />
22700172-01-00101.docx 4 DHI Italia
Trans Adriatic Pipeline – TAP, <strong>ESIA</strong> <strong>Albania</strong>, <strong>Annex</strong> 9 - <strong>Sediment</strong> <strong>Dispersion</strong> <strong>Modelling</strong><br />
AAL00-ERM-641-Y-TAE-1010, Rev.: 01 / at05, Page 9 of 278<br />
Figure 2-3 Seasonal wind roses. Source: the roses are processed by DHI on the basis of<br />
wind data coming from “Wind and Wave Mediterranean Atlas” [1]<br />
The “Wind and Wave Mediterranean Atlas” [1] database is a powerful tool to<br />
simulate the wind climate at a certain site but it cannot simulate the real<br />
variability of wind speed and wind direction over a limited time window.<br />
For the numerical modelling of representative meteomarine conditions (Chapter<br />
4), the wind data are therefore taken from another database. In particular, the<br />
wind model realised by DHI for the Integrated Project Water and Global Change<br />
(WATCH, 2007-2011) [2] has been used. This project, funded under the EU FP6,<br />
brings together the hydrological, water resources and climate communities, to<br />
analyse, quantify and predict the components of the current and future global<br />
water cycles and related water resources states, evaluates their uncertainties<br />
and clarifies the overall vulnerability of global water resources related to the<br />
main societal and economic sectors.<br />
Within the framework of the Integrated Project Water and Global Change<br />
(WATCH, 2007-2011) [2], also the setup of a global wind model was previewed;<br />
in particular for this model the simulation was executed with the newest version<br />
of the HIRHAM regional climate model using the ERA Interim as driving field<br />
22700172-01-00101.docx 5 DHI Italia
Trans Adriatic Pipeline – TAP, <strong>ESIA</strong> <strong>Albania</strong>, <strong>Annex</strong> 9 - <strong>Sediment</strong> <strong>Dispersion</strong> <strong>Modelling</strong><br />
AAL00-ERM-641-Y-TAE-1010, Rev.: 01 / at05, Page 10 of 278<br />
covering the period from January 2000 to July 2009. This simulation was also<br />
executed in a restart every day mode in order to stay very close to the driving<br />
field.<br />
The domain has an extension of 302 x 202 grid cells and covers the whole<br />
Europe (Figure 2-4). The velocity components U and V are computed in the<br />
HIRHAM model according to the grid projection. An additional post processing<br />
was done on the wind vectors to fit them to the meridional (V component) and<br />
zonal (U component) coordinate system of the Earth. Wind speed is referred to a<br />
quote of 10 m and represents a mean value over an hour.<br />
Figure 2-4 Image of one time step of the wind model. Source: Integrated Project Water<br />
and Global Change (WATCH, 2007-2011) [2]<br />
2.2 Wave climate offshore the <strong>Albania</strong>n landfall site<br />
The “Wind and Wave Mediterranean Atlas” [1] database has also been used to<br />
analyse the offshore wave climate.<br />
The wave statistics are illustrated in a scatter table of wave height vs. wave<br />
direction (from Table 2-2 to Table 2-6) and wave roses (Figure 2-5 and Figure<br />
2-6), both yearly and seasonal.<br />
The analysis of wave data, such as significant wave height and directions, shows<br />
that the highest waves come from south-south-west (maximum wave heights<br />
ranging from 4.0 and 5.0 m). Together with the waves from the south-southwest<br />
sector, the north-west sector is characterized by a high frequency of<br />
incoming waves.<br />
22700172-01-00101.docx 6 DHI Italia
Trans Adriatic Pipeline – TAP, <strong>ESIA</strong> <strong>Albania</strong>, <strong>Annex</strong> 9 - <strong>Sediment</strong> <strong>Dispersion</strong> <strong>Modelling</strong><br />
AAL00-ERM-641-Y-TAE-1010, Rev.: 01 / at05, Page 11 of 278<br />
Table 2-2<br />
Yearly wave climate – scatter table of wave height vs. wave direction.<br />
Source: “Wind and Wave Mediterranean Atlas” [1]<br />
22700172-01-00101.docx 7 DHI Italia
Trans Adriatic Pipeline – TAP, <strong>ESIA</strong> <strong>Albania</strong>, <strong>Annex</strong> 9 - <strong>Sediment</strong> <strong>Dispersion</strong> <strong>Modelling</strong><br />
AAL00-ERM-641-Y-TAE-1010, Rev.: 01 / at05, Page 12 of 278<br />
Figure 2-5 Yearly wave rose. Source: the rose is processed by DHI on the basis of wave<br />
data coming from “Wind and Wave Mediterranean Atlas” [1]<br />
The seasonal trend follows, in general, the same yearly behaviour apart from the<br />
summer season. In particular during the winter/autumn months the waves from<br />
the south-south-west sector are particularly relevant, characterized by high and<br />
frequent waves. During the summer months both the highest and most frequent<br />
waves come from north-west.<br />
22700172-01-00101.docx 8 DHI Italia
MEAN WAVE DIRECTION [°N]<br />
MEAN WAVE DIRECTION [°N]<br />
Trans Adriatic Pipeline – TAP, <strong>ESIA</strong> <strong>Albania</strong>, <strong>Annex</strong> 9 - <strong>Sediment</strong> <strong>Dispersion</strong> <strong>Modelling</strong><br />
AAL00-ERM-641-Y-TAE-1010, Rev.: 01 / at05, Page 13 of 278<br />
Table 2-3<br />
Winter wave climate – scatter table of wave height vs. wave direction.<br />
Source: “Wind and Wave Mediterranean Atlas” [1]<br />
SIGNIFICANT WAVE HEIGHT [M]<br />
0 0.25 0.5 0.75 1 1.25 1.5 1.75 2 2.5 3 3.5 4 5<br />
0.25 0.5 0.75 1 1.25 1.5 1.75 2 2.5 3 3.5 4 5 6<br />
0 15 0.000 0.201 0.201 0.201 0.100 0.100 0.100 0.000 0.100 0.000 0.000 0.000 0.000 0.000 1.0<br />
15 30 0.100 0.201 0.703 0.502 0.602 0.301 0.301 0.201 0.100 0.000 0.000 0.000 0.000 0.000 3.0<br />
30 45 0.100 0.402 0.301 0.301 0.301 0.402 0.201 0.301 0.201 0.000 0.100 0.000 0.000 0.000 2.6<br />
45 60 0.100 0.602 0.602 0.602 0.402 0.402 0.201 0.100 0.201 0.000 0.201 0.000 0.000 0.000 3.4<br />
60 75 0.100 0.301 0.402 0.602 0.402 0.100 0.100 0.100 0.100 0.000 0.000 0.000 0.000 0.000 2.2<br />
75 90 0.000 0.301 0.201 0.402 0.100 0.100 0.000 0.000 0.000 0.100 0.000 0.000 0.000 0.000 1.2<br />
90 105 0.000 0.100 0.201 0.100 0.100 0.100 0.000 0.100 0.100 0.100 0.000 0.000 0.000 0.000 0.9<br />
105 120 0.000 0.100 0.100 0.100 0.000 0.000 0.000 0.000 0.100 0.100 0.000 0.000 0.000 0.000 0.5<br />
120 135 0.100 0.100 0.201 0.100 0.100 0.000 0.000 0.000 0.000 0.000 0.000 0.000 0.000 0.000 0.6<br />
135 150 0.000 0.100 0.402 0.100 0.100 0.100 0.000 0.100 0.000 0.100 0.000 0.000 0.000 0.000 1.0<br />
150 165 0.100 0.301 0.402 0.502 0.301 0.402 0.201 0.100 0.100 0.100 0.000 0.000 0.000 0.000 2.5<br />
165 180 0.301 0.602 0.904 1.104 0.803 0.803 0.602 0.502 1.004 0.402 0.301 0.301 0.100 0.100 7.7<br />
180 195 0.301 1.406 2.811 2.610 2.008 2.410 1.707 1.908 1.707 1.104 0.502 0.301 0.301 0.100 19.1<br />
195 210 0.703 2.008 2.108 1.506 1.305 1.205 1.104 0.602 1.104 0.502 0.301 0.301 0.100 0.000 12.9<br />
210 225 0.602 1.205 1.004 0.803 0.803 0.502 0.402 0.301 0.402 0.301 0.100 0.100 0.000 0.000 6.5<br />
225 240 0.301 0.301 0.402 0.402 0.301 0.100 0.100 0.000 0.201 0.100 0.000 0.000 0.000 0.000 2.2<br />
240 255 0.301 0.402 0.402 0.201 0.201 0.100 0.000 0.100 0.100 0.000 0.000 0.000 0.000 0.000 1.8<br />
255 270 0.201 0.502 0.402 0.402 0.201 0.100 0.000 0.100 0.000 0.100 0.000 0.000 0.000 0.000 2.0<br />
270 285 0.201 0.301 0.402 0.402 0.301 0.100 0.100 0.000 0.100 0.100 0.000 0.000 0.000 0.000 2.0<br />
285 300 0.402 0.602 0.602 0.402 0.301 0.201 0.100 0.100 0.100 0.100 0.100 0.000 0.000 0.000 3.0<br />
300 315 2.108 3.414 1.908 1.104 0.602 0.201 0.301 0.201 0.000 0.000 0.000 0.000 0.000 0.000 9.8<br />
315 330 1.707 1.807 1.305 1.707 0.602 0.201 0.100 0.100 0.100 0.000 0.000 0.000 0.000 0.000 7.6<br />
330 345 0.402 0.602 0.803 0.703 0.301 0.301 0.201 0.100 0.100 0.100 0.000 0.000 0.000 0.000 3.6<br />
345 360 0.100 0.602 0.602 0.301 0.301 0.201 0.100 0.100 0.100 0.100 0.000 0.000 0.000 0.000 2.5<br />
8.23 16.47 17.37 15.16 10.54 8.43 5.92 5.12 6.02 3.41 1.61 1.00 0.50 0.20 100.00<br />
Table 2-4<br />
Summer wave climate – scatter table of wave height vs. wave direction.<br />
Source: “Wind and Wave Mediterranean Atlas” [1]<br />
SIGNIFICANT WAVE HEIGHT [M]<br />
0 0.25 0.5 0.75 1 1.25 1.5 1.75 2 2.5 3 3.5 4 5<br />
0.25 0.5 0.75 1 1.25 1.5 1.75 2 2.5 3 3.5 4 5 6<br />
0 15 0.101 0.101 0.201 0.000 0.000 0.000 0.000 0.000 0.000 0.000 0.000 0.000 0.000 0.000 0.4<br />
15 30 0.101 0.201 0.201 0.101 0.000 0.000 0.000 0.000 0.000 0.000 0.000 0.000 0.000 0.000 0.6<br />
30 45 0.101 0.302 0.201 0.101 0.000 0.000 0.000 0.000 0.000 0.000 0.000 0.000 0.000 0.000 0.7<br />
45 60 0.000 0.201 0.101 0.101 0.000 0.000 0.000 0.000 0.000 0.000 0.000 0.000 0.000 0.000 0.4<br />
60 75 0.101 0.101 0.101 0.000 0.000 0.000 0.000 0.000 0.000 0.000 0.000 0.000 0.000 0.000 0.3<br />
75 90 0.101 0.101 0.000 0.000 0.000 0.000 0.000 0.000 0.000 0.000 0.000 0.000 0.000 0.000 0.2<br />
90 105 0.000 0.101 0.101 0.000 0.000 0.000 0.000 0.000 0.000 0.000 0.000 0.000 0.000 0.000 0.2<br />
105 120 0.000 0.101 0.101 0.000 0.000 0.000 0.000 0.000 0.000 0.000 0.000 0.000 0.000 0.000 0.2<br />
120 135 0.000 0.101 0.101 0.000 0.000 0.000 0.000 0.000 0.000 0.000 0.000 0.000 0.000 0.000 0.2<br />
135 150 0.000 0.201 0.101 0.000 0.000 0.000 0.000 0.000 0.000 0.000 0.000 0.000 0.000 0.000 0.3<br />
150 165 0.101 0.504 0.201 0.101 0.101 0.000 0.000 0.000 0.000 0.000 0.000 0.000 0.000 0.000 1.0<br />
165 180 0.201 0.806 0.705 0.604 0.201 0.201 0.101 0.000 0.000 0.000 0.000 0.000 0.000 0.000 2.8<br />
180 195 0.906 3.424 2.618 1.611 0.806 0.504 0.201 0.101 0.101 0.101 0.000 0.000 0.000 0.000 10.4<br />
195 210 2.518 4.935 2.316 1.108 0.504 0.201 0.201 0.000 0.101 0.000 0.000 0.000 0.000 0.000 11.9<br />
210 225 2.820 1.813 1.108 0.201 0.101 0.101 0.000 0.000 0.000 0.000 0.000 0.000 0.000 0.000 6.1<br />
225 240 1.108 0.403 0.403 0.101 0.000 0.000 0.000 0.000 0.000 0.000 0.000 0.000 0.000 0.000 2.0<br />
240 255 0.604 0.403 0.403 0.101 0.000 0.000 0.000 0.000 0.000 0.000 0.000 0.000 0.000 0.000 1.5<br />
255 270 0.504 0.403 0.504 0.201 0.000 0.000 0.000 0.000 0.000 0.000 0.000 0.000 0.000 0.000 1.6<br />
270 285 0.806 0.604 0.504 0.201 0.000 0.000 0.000 0.000 0.000 0.000 0.000 0.000 0.000 0.000 2.1<br />
285 300 0.604 0.806 0.906 0.403 0.302 0.101 0.101 0.000 0.000 0.000 0.000 0.000 0.000 0.000 3.2<br />
300 315 2.115 3.323 2.216 2.014 0.806 0.403 0.201 0.101 0.000 0.000 0.000 0.101 0.000 0.000 11.3<br />
315 330 5.337 10.171 7.351 4.532 1.913 1.309 0.403 0.201 0.201 0.101 0.000 0.000 0.000 0.000 31.5<br />
330 345 1.410 2.518 2.618 1.108 0.504 0.201 0.000 0.000 0.000 0.000 0.000 0.000 0.000 0.000 8.4<br />
345 360 0.504 0.806 0.806 0.403 0.101 0.000 0.000 0.000 0.000 0.000 0.000 0.000 0.000 0.000 2.6<br />
20.04 32.43 23.87 12.99 5.34 3.02 1.21 0.40 0.40 0.20 0.00 0.10 0.00 0.00 100.00<br />
22700172-01-00101.docx 9 DHI Italia
MEAN WAVE DIRECTION [°N]<br />
MEAN WAVE DIRECTION [°N]<br />
Trans Adriatic Pipeline – TAP, <strong>ESIA</strong> <strong>Albania</strong>, <strong>Annex</strong> 9 - <strong>Sediment</strong> <strong>Dispersion</strong> <strong>Modelling</strong><br />
AAL00-ERM-641-Y-TAE-1010, Rev.: 01 / at05, Page 14 of 278<br />
Table 2-5<br />
Spring wave climate – scatter table of wave height vs. wave direction.<br />
Source: “Wind and Wave Mediterranean Atlas” [1]<br />
SIGNIFICANT WAVE HEIGHT [M]<br />
0 0.25 0.5 0.75 1 1.25 1.5 1.75 2 2.5 3 3.5 4 5<br />
0.25 0.5 0.75 1 1.25 1.5 1.75 2 2.5 3 3.5 4 5 6<br />
0 15 0.000 0.204 0.204 0.306 0.102 0.000 0.102 0.102 0.000 0.000 0.000 0.000 0.000 0.000 1.0<br />
15 30 0.102 0.613 0.511 0.511 0.204 0.409 0.102 0.102 0.000 0.000 0.000 0.000 0.000 0.000 2.6<br />
30 45 0.102 0.409 0.613 0.204 0.204 0.204 0.204 0.000 0.000 0.000 0.000 0.000 0.000 0.000 1.9<br />
45 60 0.102 0.204 0.409 0.511 0.204 0.102 0.204 0.204 0.000 0.000 0.000 0.000 0.000 0.000 1.9<br />
60 75 0.102 0.204 0.204 0.204 0.204 0.204 0.102 0.102 0.102 0.000 0.000 0.000 0.000 0.000 1.4<br />
75 90 0.000 0.102 0.000 0.000 0.102 0.000 0.000 0.000 0.000 0.000 0.000 0.000 0.000 0.000 0.2<br />
90 105 0.000 0.000 0.000 0.000 0.000 0.000 0.000 0.000 0.000 0.000 0.000 0.000 0.000 0.000 0.0<br />
105 120 0.000 0.000 0.000 0.000 0.102 0.102 0.000 0.000 0.000 0.000 0.000 0.000 0.000 0.000 0.2<br />
120 135 0.000 0.102 0.000 0.102 0.000 0.000 0.000 0.000 0.000 0.000 0.000 0.000 0.000 0.000 0.2<br />
135 150 0.000 0.102 0.102 0.204 0.000 0.000 0.000 0.000 0.000 0.000 0.000 0.000 0.000 0.000 0.4<br />
150 165 0.000 0.102 0.306 0.000 0.204 0.102 0.000 0.102 0.000 0.000 0.000 0.000 0.000 0.000 0.8<br />
165 180 0.306 0.715 0.613 1.124 1.124 0.409 0.306 0.000 0.204 0.102 0.102 0.000 0.102 0.000 5.1<br />
180 195 0.919 3.677 3.882 4.086 2.656 2.043 1.124 1.226 1.124 0.919 0.409 0.204 0.000 0.000 22.3<br />
195 210 2.349 4.494 3.882 2.962 1.226 1.021 0.409 0.306 0.409 0.306 0.102 0.000 0.000 0.000 17.5<br />
210 225 1.839 2.247 1.124 1.124 0.409 0.204 0.204 0.102 0.000 0.000 0.102 0.000 0.000 0.000 7.4<br />
225 240 0.715 0.511 0.306 0.409 0.102 0.204 0.000 0.000 0.000 0.000 0.000 0.000 0.000 0.000 2.2<br />
240 255 0.409 0.409 0.306 0.204 0.102 0.000 0.000 0.000 0.000 0.000 0.000 0.000 0.000 0.000 1.4<br />
255 270 0.511 0.715 0.306 0.306 0.102 0.000 0.000 0.000 0.000 0.000 0.000 0.000 0.000 0.000 1.9<br />
270 285 0.511 0.409 0.306 0.102 0.000 0.000 0.000 0.000 0.000 0.000 0.000 0.000 0.000 0.000 1.3<br />
285 300 0.613 1.124 0.715 0.409 0.204 0.102 0.000 0.000 0.000 0.000 0.000 0.000 0.000 0.000 3.2<br />
300 315 2.043 3.575 2.043 1.124 0.511 0.204 0.204 0.000 0.102 0.000 0.000 0.000 0.000 0.000 9.8<br />
315 330 1.634 3.166 2.554 0.919 0.919 0.613 0.102 0.000 0.000 0.000 0.000 0.000 0.000 0.000 9.9<br />
330 345 0.409 0.817 0.817 0.715 0.409 0.102 0.204 0.204 0.102 0.000 0.000 0.000 0.000 0.000 3.8<br />
345 360 0.306 0.919 0.919 0.511 0.204 0.306 0.102 0.102 0.102 0.000 0.000 0.000 0.000 0.000 3.5<br />
12.97 24.82 20.12 16.04 9.30 6.33 3.37 2.55 2.15 1.33 0.72 0.20 0.10 0.00 100.00<br />
Table 2-6<br />
Autumn wave climate – scatter table of wave height vs. wave direction.<br />
Source: “Wind and Wave Mediterranean Atlas” [1]<br />
SIGNIFICANT WAVE HEIGHT [M]<br />
0 0.25 0.5 0.75 1 1.25 1.5 1.75 2 2.5 3 3.5 4 5<br />
0.25 0.5 0.75 1 1.25 1.5 1.75 2 2.5 3 3.5 4 5 6<br />
0 15 0.100 0.300 0.400 0.200 0.100 0.000 0.000 0.000 0.000 0.000 0.000 0.000 0.000 0.000 1.1<br />
15 30 0.200 0.701 0.601 0.300 0.200 0.000 0.100 0.000 0.000 0.000 0.000 0.000 0.000 0.000 2.1<br />
30 45 0.300 0.501 0.501 0.200 0.200 0.100 0.100 0.000 0.100 0.000 0.000 0.000 0.000 0.000 2.0<br />
45 60 0.200 0.701 0.601 0.400 0.100 0.200 0.000 0.000 0.000 0.000 0.000 0.000 0.000 0.000 2.2<br />
60 75 0.000 0.400 0.200 0.200 0.100 0.100 0.100 0.000 0.000 0.000 0.000 0.000 0.000 0.000 1.1<br />
75 90 0.100 0.100 0.100 0.100 0.100 0.000 0.000 0.100 0.000 0.000 0.000 0.000 0.000 0.000 0.6<br />
90 105 0.100 0.100 0.100 0.000 0.000 0.000 0.100 0.000 0.000 0.000 0.000 0.000 0.000 0.000 0.4<br />
105 120 0.000 0.100 0.200 0.000 0.000 0.100 0.000 0.100 0.000 0.000 0.000 0.000 0.000 0.000 0.5<br />
120 135 0.000 0.200 0.200 0.100 0.000 0.000 0.000 0.000 0.000 0.000 0.000 0.000 0.000 0.000 0.5<br />
135 150 0.200 0.400 0.100 0.000 0.100 0.100 0.100 0.000 0.100 0.000 0.000 0.000 0.000 0.000 1.1<br />
150 165 0.100 0.200 0.400 0.400 0.200 0.100 0.100 0.100 0.200 0.100 0.000 0.000 0.000 0.000 1.9<br />
165 180 0.400 1.001 1.001 1.802 1.101 0.701 0.701 0.501 0.901 0.400 0.300 0.200 0.100 0.000 9.1<br />
180 195 1.602 2.503 3.403 3.303 2.803 2.302 1.602 1.301 1.301 0.701 0.501 0.200 0.200 0.100 21.7<br />
195 210 1.702 3.203 2.603 2.202 1.602 0.901 0.801 0.601 0.801 0.300 0.100 0.100 0.100 0.000 15.0<br />
210 225 1.201 1.602 1.101 1.001 0.601 0.300 0.400 0.200 0.200 0.000 0.100 0.000 0.000 0.000 6.7<br />
225 240 0.300 0.501 0.601 0.501 0.200 0.100 0.100 0.000 0.000 0.000 0.000 0.000 0.000 0.000 2.3<br />
240 255 0.300 0.601 0.400 0.200 0.300 0.100 0.200 0.000 0.100 0.000 0.000 0.000 0.000 0.000 2.2<br />
255 270 0.200 0.300 0.300 0.300 0.200 0.100 0.100 0.000 0.000 0.000 0.000 0.000 0.000 0.000 1.5<br />
270 285 0.300 0.400 0.300 0.200 0.100 0.100 0.100 0.000 0.100 0.000 0.000 0.000 0.000 0.000 1.6<br />
285 300 0.501 0.601 0.300 0.300 0.100 0.100 0.100 0.100 0.100 0.100 0.000 0.000 0.000 0.000 2.3<br />
300 315 1.401 2.102 1.001 0.701 0.300 0.200 0.100 0.100 0.100 0.100 0.100 0.000 0.000 0.000 6.2<br />
315 330 2.002 3.403 2.202 1.301 0.601 0.400 0.100 0.100 0.200 0.100 0.000 0.000 0.000 0.000 10.4<br />
330 345 0.901 1.201 1.101 0.601 0.300 0.100 0.100 0.100 0.100 0.100 0.000 0.000 0.000 0.000 4.6<br />
345 360 0.400 0.801 0.601 0.501 0.300 0.100 0.000 0.000 0.000 0.000 0.000 0.000 0.000 0.000 2.7<br />
12.51 21.92 18.32 14.81 9.61 6.21 5.01 3.30 4.30 1.90 1.10 0.50 0.40 0.10 100.00<br />
22700172-01-00101.docx 10 DHI Italia
Trans Adriatic Pipeline – TAP, <strong>ESIA</strong> <strong>Albania</strong>, <strong>Annex</strong> 9 - <strong>Sediment</strong> <strong>Dispersion</strong> <strong>Modelling</strong><br />
AAL00-ERM-641-Y-TAE-1010, Rev.: 01 / at05, Page 15 of 278<br />
Figure 2-6 Seasonal wave roses. Source: the roses are processed by DHI on the basis of<br />
wave data coming from “Wind and Wave Mediterranean Atlas” [1]<br />
The “Wind and Wave Mediterranean Atlas” [1] also provides the scatter table of<br />
wave height vs. wave period, as shown in Table 2-7. The table will be used to<br />
associate a reliable peak wave period to the modelled wave conditions (Chapter<br />
3).<br />
22700172-01-00101.docx 11 DHI Italia
Trans Adriatic Pipeline – TAP, <strong>ESIA</strong> <strong>Albania</strong>, <strong>Annex</strong> 9 - <strong>Sediment</strong> <strong>Dispersion</strong> <strong>Modelling</strong><br />
AAL00-ERM-641-Y-TAE-1010, Rev.: 01 / at05, Page 16 of 278<br />
Table 2-7<br />
Yearly scatter table of wave height vs. peak wave period. Source: “Wind and<br />
Wave Mediterranean Atlas” [1].<br />
2.3 Tidal conditions<br />
Tide analysis has been carried out by means of the tool MIKE C-MAP, developed<br />
by DHI (Danish Hydraulic Institute) [5]. This tool provides, together with nautical<br />
charts data, water level time series (astronomical tide variations) for a huge<br />
number of tidal stations worldwide. Both information are based on Admiralty<br />
Charts and Admiralty Tide Tables.<br />
The tidal station used as reference for the present study is Durres, about 60 km<br />
north of the <strong>Albania</strong>n landfall site.<br />
Figure 2-7 illustrates the astronomical tide cycle, in relation to a period which<br />
can be considered representative of the local average tidal conditions. As shown<br />
in the figure, the tide is semi-diurnal (two highs and two lows every day). During<br />
Spring Tide conditions the tide amplitude is in the order of 0.38 m, while during<br />
Neap Tide conditions the tide amplitude does not exceed 0.18 m.<br />
22700172-01-00101.docx 12 DHI Italia
Trans Adriatic Pipeline – TAP, <strong>ESIA</strong> <strong>Albania</strong>, <strong>Annex</strong> 9 - <strong>Sediment</strong> <strong>Dispersion</strong> <strong>Modelling</strong><br />
AAL00-ERM-641-Y-TAE-1010, Rev.: 01 / at05, Page 17 of 278<br />
Figure 2-7 Astronomical tide cycle for the Durres C-MAP station. Source: the time series<br />
is extracted from the database available in the tool MIKE C-MAP, part of DHI<br />
software package [5], station: Durres, period: 01/12/2010-31/12/2010<br />
2.4 Currents from the general circulation of the Adriatic Sea, temperature<br />
and salinity<br />
The analysis of currents from the general circulation of the Adriatic Sea<br />
(baroclinic currents), together with the analysis of temperature and salinity, has<br />
been carried out by processing data coming from the Mediterranean Forecasting<br />
System (MFS) database which is available within the framework of MyOcean EU<br />
Project [3].<br />
MFS is a 3D global circulation model that provides daily analyses and 10-day<br />
forecasts of currents, temperature and salinity fields for the entire Mediterranean<br />
Sea at approximately 6.5 km resolution. MFS model is widely considered the<br />
state of the art of the models aiming at simulating the Mediterranean circulation.<br />
Figure 2-8 illustrates the domain of the MFS Mediterranean circulation model<br />
through an example of surface temperature distribution over the whole basin,<br />
while Figure 2-9 shows an example of the current fields in the Adriatic Sea.<br />
22700172-01-00101.docx 13 DHI Italia
Trans Adriatic Pipeline – TAP, <strong>ESIA</strong> <strong>Albania</strong>, <strong>Annex</strong> 9 - <strong>Sediment</strong> <strong>Dispersion</strong> <strong>Modelling</strong><br />
AAL00-ERM-641-Y-TAE-1010, Rev.: 01 / at05, Page 18 of 278<br />
Figure 2-8 MFS Mediterranean model domain and example of temperature distribution in<br />
the whole basin. Source: the image is extracted from the GNOO (Gruppo<br />
Nazionale di Oceanografia Operativa) website,<br />
http://gnoo.bo.ingv.it/mfs/web_ita/contents.htm.<br />
Figure 2-9 Example of MFS current fields for the Adriatic Sea. Source: the image is<br />
extracted from the GNOO (Gruppo Nazionale di Oceanografia Operativa)<br />
website, http://gnoo.bo.ingv.it/mfs/web_ita/contents.htm.<br />
22700172-01-00101.docx 14 DHI Italia
Trans Adriatic Pipeline – TAP, <strong>ESIA</strong> <strong>Albania</strong>, <strong>Annex</strong> 9 - <strong>Sediment</strong> <strong>Dispersion</strong> <strong>Modelling</strong><br />
AAL00-ERM-641-Y-TAE-1010, Rev.: 01 / at05, Page 19 of 278<br />
MFS data are available under MyOcean project [3] since 01/01/2006 (to date)<br />
and have been extracted for the model point of coordinates LON 19.25°, LAT<br />
40.75°, located about 10 km offshore of the <strong>Albania</strong>n landfall site.<br />
The location of the MSF point is illustrated in Figure 2-10.<br />
The sea temperature and salinity data, at surface, 10 m and 20 m depth, have<br />
been processed and illustrated as yearly time series, for every year from 2006 to<br />
2011, in Appendix A for temperature and in Appendix B for salinity.<br />
The current fields (as current speed and current mean direction), at surface, 10<br />
m and 20 m depth, have been processed and illustrated as monthly time series,<br />
for every year from 2006 to 2011, in Appendix C.<br />
Figure 2-10 Location of the <strong>Albania</strong>n MFS point. Source: Google Earth.<br />
2.4.1 Currents, temperature and salinity offshore the <strong>Albania</strong>n landfall site<br />
In the below plots the current fields, at surface, 10 m and 20 m depth, as yearly<br />
current roses (Figure 2-11 and Figure 2-12) and seasonal current roses (Figure<br />
2-13, Figure 2-14, Figure 2-15) are illustrated.<br />
From the analysis of the surface current rose, a bimodal trend appears; in fact<br />
the strongest and most frequent currents come from north-east and from southsouth-west<br />
(maximum current speed about 0.5 m/s).<br />
The current rose at 10 m depth shows a similar trend characterized by the<br />
strongest and most frequent currents from north-east and from south-west. But<br />
in this case the north-east sector of incoming currents is narrower and turned<br />
towards north. In addition, the current speed at 10 m depth appears a lot<br />
weaker than at surface.<br />
The current rose at 20 m depth looks similar to the rose at 10 m depth but the<br />
currents are even weaker.<br />
22700172-01-00101.docx 15 DHI Italia
Trans Adriatic Pipeline – TAP, <strong>ESIA</strong> <strong>Albania</strong>, <strong>Annex</strong> 9 - <strong>Sediment</strong> <strong>Dispersion</strong> <strong>Modelling</strong><br />
AAL00-ERM-641-Y-TAE-1010, Rev.: 01 / at05, Page 20 of 278<br />
From the analysis of these roses, it can be concluded that a significant<br />
stratification of the currents is present offshore the <strong>Albania</strong>n landfall site.<br />
Figure 2-11 Surface yearly current rose generated using MyOcean Products [3]. Source:<br />
the rose is processed by DHI on the basis of the oceanographic data<br />
downloaded from MyOcean website (http://www.myocean.org/) for the point<br />
of coordinates LON 19.25°, LAT 40.75° for the period 01/01/2006-<br />
01/11/2011<br />
22700172-01-00101.docx 16 DHI Italia
Trans Adriatic Pipeline – TAP, <strong>ESIA</strong> <strong>Albania</strong>, <strong>Annex</strong> 9 - <strong>Sediment</strong> <strong>Dispersion</strong> <strong>Modelling</strong><br />
AAL00-ERM-641-Y-TAE-1010, Rev.: 01 / at05, Page 21 of 278<br />
Figure 2-12 10 m (left) and 20 m (right) water depth current roses generated using<br />
MyOcean Products [3]. Source: the roses are processed by DHI on the basis<br />
of the oceanographic data downloaded from MyOcean website<br />
(http://www.myocean.org/) for the point of coordinates LON 19.25°, LAT<br />
40.75° for the period 01/01/2006-01/11/2011<br />
The seasonal analysis (at surface, 10 m and 20 m depth) confirms the yearly<br />
trend and the relevant stratification of the currents. In fact, the current speed at<br />
20 m depth appears significantly weaker than at surface.<br />
From the seasonal analysis, it is also possible to observe a different trend during<br />
the spring/summer months and during the autumn/winter months: in the first<br />
case the most important sector of incoming currents is north-east; this sector is<br />
turned more towards north in deeper water.<br />
During the autumn and winter seasons the current directions show a higher<br />
variability, characterized by two main sectors: north-east and south-west. In<br />
autumn/winter, the strongest and most frequent currents come from southsouth-west.<br />
22700172-01-00101.docx 17 DHI Italia
Trans Adriatic Pipeline – TAP, <strong>ESIA</strong> <strong>Albania</strong>, <strong>Annex</strong> 9 - <strong>Sediment</strong> <strong>Dispersion</strong> <strong>Modelling</strong><br />
AAL00-ERM-641-Y-TAE-1010, Rev.: 01 / at05, Page 22 of 278<br />
Figure 2-13 Surface seasonal current roses generated using MyOcean Products [3].<br />
Source: the roses are processed by DHI on the basis of the oceanographic<br />
data downloaded from MyOcean website (http://www.myocean.org/) for the<br />
point of coordinates LON 19.25°, LAT 40.75° for the period 01/01/2006-<br />
01/11/2011<br />
22700172-01-00101.docx 18 DHI Italia
Trans Adriatic Pipeline – TAP, <strong>ESIA</strong> <strong>Albania</strong>, <strong>Annex</strong> 9 - <strong>Sediment</strong> <strong>Dispersion</strong> <strong>Modelling</strong><br />
AAL00-ERM-641-Y-TAE-1010, Rev.: 01 / at05, Page 23 of 278<br />
Figure 2-14 10 m depth seasonal current roses generated using MyOcean Products [3].<br />
Source: the roses are processed by DHI on the basis of the oceanographic<br />
data downloaded from MyOcean website (http://www.myocean.org/) for the<br />
point of coordinates LON 19.25°, LAT 40.75° for the period 01/01/2006-<br />
01/11/2011<br />
22700172-01-00101.docx 19 DHI Italia
Trans Adriatic Pipeline – TAP, <strong>ESIA</strong> <strong>Albania</strong>, <strong>Annex</strong> 9 - <strong>Sediment</strong> <strong>Dispersion</strong> <strong>Modelling</strong><br />
AAL00-ERM-641-Y-TAE-1010, Rev.: 01 / at05, Page 24 of 278<br />
Figure 2-15 20 m depth seasonal current roses generated using MyOcean Products [3].<br />
Source: the roses are processed by DHI on the basis of the oceanographic<br />
data downloaded from MyOcean website (http://www.myocean.org/) for the<br />
point of coordinates LON 19.25°, LAT 40.75° for the period 01/01/2006-<br />
01/11/2011<br />
Together with the currents, also temperature and salinity data coming from the<br />
MyOcean database [3] have been extracted and processed.<br />
The analysis of yearly temperature and salinity trends, at surface, 10 m and 20<br />
m depths is illustrated in Appendix A and B, respectively.<br />
The minimum temperature during the year is around 13.0°C and it is reached in<br />
February, while the maximum temperature is around 26.5°C (at surface) and it<br />
22700172-01-00101.docx 20 DHI Italia
Trans Adriatic Pipeline – TAP, <strong>ESIA</strong> <strong>Albania</strong>, <strong>Annex</strong> 9 - <strong>Sediment</strong> <strong>Dispersion</strong> <strong>Modelling</strong><br />
AAL00-ERM-641-Y-TAE-1010, Rev.: 01 / at05, Page 25 of 278<br />
is reached in July. As an example, the 2010 temperature time series is illustrated<br />
in Figure 2-16.<br />
Relevant differences in temperature, around 6°, between surface and 20 m<br />
depth can be found during summer (when the stratification is higher). Also<br />
during the winter and autumn months there is a limited stratification, with a<br />
maximum variation of temperature between surface and 20 m depth around 1°.<br />
At the <strong>Albania</strong>n landfall site, an important stratification of the water column also<br />
in terms of salinity is present (as an example, the 2010 salinity time series is<br />
illustrated in Figure 2-17): the differences between surface and 20 m depth are<br />
around 4 PSU (38.8-34.8 PSU). This variability is not only distributed along the<br />
water column, but also during the year, even if it is not straightforward to define<br />
a seasonal trend. The salinity variations presumably originated by the proximity<br />
of two important river mouths (Vjosa and Seman rivers).<br />
Figure 2-16 Example of yearly sea temperature at three different depths (0, -10, -20 m<br />
m.s.l.) offshore the <strong>Albania</strong>n coast. Source: the trends are processed by DHI<br />
on the basis of the oceanographic data downloaded from MyOcean website<br />
[3] (http://www.myocean.org/) for the point of coordinates LON 19.25°, LAT<br />
40.75° for the period 01/01/2010-31/12/2010<br />
22700172-01-00101.docx 21 DHI Italia
Trans Adriatic Pipeline – TAP, <strong>ESIA</strong> <strong>Albania</strong>, <strong>Annex</strong> 9 - <strong>Sediment</strong> <strong>Dispersion</strong> <strong>Modelling</strong><br />
AAL00-ERM-641-Y-TAE-1010, Rev.: 01 / at05, Page 26 of 278<br />
Figure 2-17 Example of yearly sea salinity at three different depths (0, -10, -20 m m.s.l.)<br />
offshore the <strong>Albania</strong>n coast. Source: the trends are processed by DHI on the<br />
basis of the oceanographic data downloaded from MyOcean website [3]<br />
(http://www.myocean.org/) for the point of coordinates LON 19.25°, LAT<br />
40.75° for the period 01/01/2010-31/12/2010<br />
22700172-01-00101.docx 22 DHI Italia
Trans Adriatic Pipeline – TAP, <strong>ESIA</strong> <strong>Albania</strong>, <strong>Annex</strong> 9 - <strong>Sediment</strong> <strong>Dispersion</strong> <strong>Modelling</strong><br />
AAL00-ERM-641-Y-TAE-1010, Rev.: 01 / at05, Page 27 of 278<br />
3 REPRESENTATIVE METEOMARINE SCENARIOS<br />
In order to model the representative hydrodynamic conditions characterising the<br />
area around the pipeline route at the <strong>Albania</strong>n landfall site, the following three<br />
different scenarios have been selected.<br />
The meteomarine forcing which has been considered refers to wind, waves, tide,<br />
currents from the general circulation of the Adriatic Sea (baroclinic currents),<br />
temperature and salinity, as illustrated in the previous chapters. Since the<br />
analysis of offshore data (Chapter 2) pointed out the presence of a seasonal<br />
trend, two representative scenarios for two different seasonal representative<br />
behaviours have been selected. In addition, a representative scenario of storm<br />
conditions has been taken into account.<br />
1. Scenario 1: Representative meteomarine conditions during autumn/winter<br />
season.<br />
This scenario has been selected in order to model the hydrodynamic field due<br />
to typical meteomarine autumn/winter conditions. A real period of 15 days<br />
has been considered, so that a complete tidal cycle is included in the<br />
simulation.<br />
Scenario 1 conditions will be used to simulate the dispersion of the fine<br />
sediment which will be released during dredging operations.<br />
In order to select a reliable and representative scenario for this autumn/winter<br />
scenario, with reference to the analysis of offshore data illustrated in<br />
Chapter 2, a time window during which currents come from south-south-<br />
West and are characterized by speed values with high frequency of<br />
occurrence has been selected. The vertical stratification of salinity and<br />
temperature is not relevant in these months. The selected time window is the<br />
period between 04/01/2008 and 18/01/2008.<br />
In Table 3-1 the daily averaged values of velocity components, temperature<br />
and salinity at 10 reference depths for the 15-day period are illustrated<br />
(source: MyOcean database [3]).<br />
22700172-01-00101.docx 23 DHI Italia
Trans Adriatic Pipeline – TAP, <strong>ESIA</strong> <strong>Albania</strong>, <strong>Annex</strong> 9 - <strong>Sediment</strong> <strong>Dispersion</strong> <strong>Modelling</strong><br />
AAL00-ERM-641-Y-TAE-1010, Rev.: 01 / at05, Page 28 of 278<br />
Table 3-1<br />
Temperature (T), salinity (S), horizontal (U) and vertical (V) current velocity<br />
components at 10 different reference depths during the 15 days of the<br />
autumn/winter scenario. Source: oceanographic data downloaded from<br />
MyOcean website [3] (http://www.myocean.org/) for the point of coordinates<br />
LON 19.25°, LAT 40.75° for the period 04/01/2008-18/01/2008<br />
Depth [m]<br />
1 5 8 12 15 20 24 29 34 40<br />
04/01/2008<br />
05/01/2008<br />
06/01/2008<br />
07/01/2008<br />
08/01/2008<br />
09/01/2008<br />
10/01/2008<br />
11/01/2008<br />
12/01/2008<br />
13/01<br />
/2008<br />
T [°C] 13.8 14.2 14.7 15.1 15.3 15.3 15.3 15.3 15.2 15.2<br />
S [PSU] 37.6 37.8 38.1 38.3 38.4 38.5 38.5 38.5 38.5 38.5<br />
U [m/s] -0.026 -0.024 -0.001 0.005 -0.002 -0.003 -0.002 0.000 0.005 0.004<br />
V [m/s] 0.124 0.064 0.002 -0.017 -0.018 -0.002 0.001 0.001 -0.001 -0.001<br />
T [°C] 14.2 14.2 14.3 14.4 14.6 14.8 15.0 15.2 15.3 15.3<br />
S [PSU] 37.8 37.8 37.8 37.9 38.1 38.2 38.3 38.4 38.5 38.5<br />
U [m/s] 0.061 0.062 0.066 0.067 0.053 0.019 -0.003 -0.027 -0.044 -0.046<br />
V [m/s] 0.367 0.350 0.293 0.200 0.129 0.080 0.048 0.027 0.022 0.018<br />
T [°C] 15.0 15.0 15.0 15.0 15.0 15.0 15.0 15.0 15.1 15.2<br />
S [PSU] 38.3 38.3 38.3 38.3 38.3 38.3 38.3 38.3 38.4 38.4<br />
U [m/s] 0.029 0.029 0.029 0.029 0.029 0.029 0.029 0.029 0.021 0.003<br />
V [m/s] 0.381 0.381 0.381 0.372 0.331 0.229 0.145 0.099 0.071 0.025<br />
T [°C] 15.0 15.0 15.0 15.0 15.0 15.1 15.1 15.1 15.1 15.1<br />
S [PSU] 38.4 38.4 38.4 38.4 38.4 38.4 38.4 38.4 38.4 38.4<br />
U [m/s] 0.010 0.010 0.010 0.010 0.010 0.010 0.010 0.010 0.010 0.010<br />
V [m/s] 0.126 0.126 0.126 0.125 0.096 0.056 0.033 0.017 0.011 0.011<br />
T [°C] 14.7 14.9 15.0 15.0 15.1 15.1 15.1 15.1 15.1 15.1<br />
S [PSU] 37.8 38.1 38.3 38.3 38.4 38.4 38.4 38.4 38.4 38.4<br />
U [m/s] 0.001 0.001 0.004 -0.001 -0.009 -0.008 0.001 0.001 0.001 0.001<br />
V [m/s] 0.105 0.047 0.022 0.013 0.006 -0.003 -0.001 -0.001 -0.001 -0.001<br />
T [°C] 14.2 14.8 15.0 15.1 15.1 15.1 15.1 15.1 15.1 15.1<br />
S [PSU] 36.8 37.9 38.3 38.3 38.4 38.4 38.5 38.5 38.5 38.5<br />
U [m/s] -0.056 -0.002 0.003 -0.003 -0.003 0.000 0.003 0.006 0.012 0.013<br />
V [m/s] 0.092 0.035 0.000 -0.007 -0.013 -0.006 -0.006 -0.007 -0.008 -0.008<br />
T [°C] 13.9 14.7 15.0 15.1 15.1 15.1 15.1 15.1 15.1 15.1<br />
S [PSU] 36.1 37.7 38.2 38.3 38.4 38.5 38.5 38.5 38.5 38.5<br />
U [m/s] -0.016 0.013 -0.003 -0.007 -0.008 -0.001 0.002 0.005 0.012 0.012<br />
V [m/s] 0.061 0.002 -0.008 -0.011 -0.021 -0.011 -0.008 -0.009 -0.010 -0.010<br />
T [°C] 13.8 14.6 15.0 15.1 15.2 15.1 15.1 15.1 15.1 15.1<br />
S [PSU] 35.9 37.4 38.2 38.3 38.4 38.5 38.5 38.5 38.5 38.5<br />
U [m/s] 0.009 0.013 -0.008 -0.013 -0.015 -0.006 -0.002 0.001 0.010 0.011<br />
V [m/s] 0.089 0.006 -0.014 -0.014 -0.025 -0.017 -0.012 -0.012 -0.014 -0.013<br />
T [°C] 14.2 14.3 14.7 15.0 15.2 15.2 15.2 15.2 15.1 15.1<br />
S [PSU] 36.9 37.2 37.6 38.1 38.3 38.4 38.5 38.5 38.5 38.5<br />
U [m/s] 0.093 0.088 0.056 0.025 -0.001 -0.015 -0.020 -0.020 -0.015 -0.015<br />
V [m/s] 0.323 0.217 0.125 0.067 0.044 0.005 0.001 0.001 0.000 0.000<br />
T [°C] 14.8 14.8 14.8 14.8 14.9 15.0 15.1 15.1 15.1 15.1<br />
S [PSU] 38.1 38.1 38.1 38.1 38.2 38.3 38.4 38.5 38.5 38.5<br />
22700172-01-00101.docx 24 DHI Italia
Trans Adriatic Pipeline – TAP, <strong>ESIA</strong> <strong>Albania</strong>, <strong>Annex</strong> 9 - <strong>Sediment</strong> <strong>Dispersion</strong> <strong>Modelling</strong><br />
AAL00-ERM-641-Y-TAE-1010, Rev.: 01 / at05, Page 29 of 278<br />
Depth [m]<br />
1 5 8 12 15 20 24 29 34 40<br />
U [m/s] 0.043 0.043 0.043 0.043 0.043 0.036 0.018 0.006 -0.001 -0.008<br />
V [m/s] 0.421 0.419 0.391 0.287 0.191 0.107 0.038 0.005 0.005 0.001<br />
18/01/2008 17/01/2008 16/01/2008 15/01/2008 14/01/2008<br />
T [°C] 14.8 14.8 14.8 14.8 14.8 14.8 14.9 14.9 15.0 15.0<br />
S [PSU] 38.3 38.3 38.3 38.3 38.3 38.4 38.4 38.4 38.5 38.5<br />
U [m/s] 0.020 0.020 0.020 0.020 0.020 0.020 0.020 0.020 0.020 0.020<br />
V [m/s] 0.261 0.261 0.261 0.259 0.199 0.134 0.080 0.027 0.000 -0.002<br />
T [°C] 14.5 14.6 14.7 14.7 14.8 14.8 14.9 14.9 14.9 14.9<br />
S [PSU] 38.1 38.2 38.3 38.3 38.3 38.4 38.4 38.5 38.5 38.5<br />
U [m/s] 0.001 0.001 0.001 0.001 0.001 0.002 0.003 0.003 0.003 0.003<br />
V [m/s] 0.074 0.047 0.036 0.028 0.008 -0.005 -0.003 -0.004 -0.004 -0.004<br />
T [°C] 14.3 14.4 14.6 14.7 14.7 14.8 14.8 14.9 14.9 14.9<br />
S [PSU] 37.9 37.9 38.1 38.2 38.3 38.4 38.5 38.5 38.5 38.5<br />
U [m/s] 0.035 0.035 0.035 0.035 0.025 0.011 -0.005 -0.018 -0.019 -0.020<br />
V [m/s] 0.310 0.214 0.130 0.077 0.044 0.007 0.002 0.001 0.001 0.001<br />
T [°C] 14.6 14.6 14.6 14.6 14.7 14.7 14.8 14.8 14.8 14.8<br />
S [PSU] 38.2 38.2 38.2 38.2 38.3 38.3 38.4 38.5 38.5 38.5<br />
U [m/s] 0.033 0.033 0.033 0.033 0.033 0.033 0.030 0.024 0.022 0.021<br />
V [m/s] 0.424 0.417 0.386 0.288 0.192 0.102 0.028 -0.001 -0.003 -0.003<br />
T [°C] 14.6 14.6 14.6 14.6 14.6 14.7 14.7 14.8 14.8 14.8<br />
S [PSU] 38.3 38.3 38.3 38.3 38.3 38.4 38.4 38.5 38.5 38.5<br />
U [m/s] 0.016 0.016 0.016 0.016 0.016 0.016 0.015 0.014 0.015 0.015<br />
V [m/s] 0.273 0.273 0.271 0.215 0.150 0.089 0.036 -0.003 -0.007 -0.007<br />
In addition to temperature, salinity and currents from the general circulation<br />
of the Adriatic Sea (baroclinic currents), also wind conditions for the selected<br />
time window have been extracted. As illustrated in Chapter 2, the WATCH<br />
model database has been used [2]. In particular, the hourly values of wind<br />
velocity components U and V, together with the hourly atmospheric pressure<br />
for the period 04/01/2008 – 18/01/2008, have been extracted from the<br />
closest location (the closest cell) to the <strong>Albania</strong>n landfall site.<br />
Finally, the astronomical tide conditions at the site during the period<br />
04/01/2008 – 18/01/2008 have been extracted from C-MAP database [5]<br />
(Chapter 2); the time series for the 15 days is illustrated in Figure 3-1: an<br />
entire tidal cycle is represented.<br />
22700172-01-00101.docx 25 DHI Italia
Trans Adriatic Pipeline – TAP, <strong>ESIA</strong> <strong>Albania</strong>, <strong>Annex</strong> 9 - <strong>Sediment</strong> <strong>Dispersion</strong> <strong>Modelling</strong><br />
AAL00-ERM-641-Y-TAE-1010, Rev.: 01 / at05, Page 30 of 278<br />
Figure 3-1 Astronomical tide during the period 04/01/2008 – 18/01/2008 for the Durres<br />
C-MAP station. Source: The time series is extracted from the database<br />
available in the tool MIKE C-MAP, part of DHI software package [5], station:<br />
Durres, period: 04/01/2008 – 18/01/2008<br />
2. Scenario 2: Representative meteomarine conditions during spring/summer<br />
season.<br />
This scenario has been selected in order to model the hydrodynamic field due<br />
to typical meteomarine spring/summer conditions. Again, a real period of 15<br />
days has been considered, so that a complete tidal cycle is included in the<br />
simulation.<br />
Scenario 2 conditions will be used in order to simulate the dispersion of the<br />
fine sediment which will be released during dredging operations.<br />
In order to select a reliable and representative scenario for this spring/summer<br />
scenario, with reference to the analysis of offshore data illustrated in<br />
Chapter 2, a time window during which currents come from north-east and<br />
are characterized by speed values with high frequency of occurrence has<br />
been selected (lower average speed than scenario 1). The vertical<br />
stratification of salinity and temperature is significant in these months, with a<br />
difference between surface and 20 m depth of around 8°C for temperature<br />
and of around 1 PSU for salinity. The selected time window is the period<br />
between 23/06/2008 and 07/07/2008.<br />
In Table 3-2 the daily averaged values of velocity components, temperature<br />
and salinity at 10 reference depths for the 15-day period are illustrated<br />
(source: MyOcean database [3]).<br />
22700172-01-00101.docx 26 DHI Italia
Trans Adriatic Pipeline – TAP, <strong>ESIA</strong> <strong>Albania</strong>, <strong>Annex</strong> 9 - <strong>Sediment</strong> <strong>Dispersion</strong> <strong>Modelling</strong><br />
AAL00-ERM-641-Y-TAE-1010, Rev.: 01 / at05, Page 31 of 278<br />
Table 3-2<br />
Temperature (T), salinity (S), horizontal (U) and vertical (V) current velocity<br />
at 10 different reference depths during the 15 days. Source: oceanographic<br />
data downloaded from MyOcean website [3] (http://www.myocean.org/) for<br />
the point of coordinates LON 19.25°, LAT 40.75° for the period 23/06/2008-<br />
07/07/2008<br />
Depth [m]<br />
1 5 8 12 15 20 24 29 34 40<br />
30/06/2008 29/06/2008 28/06/2008 27/06/2008 26/06/2008 25/06/2008 24/06/2008 23/06/2008<br />
T [°C] 23.6 22.6 21.8 20.7 19.1 17.2 16.3 15.7 15.4 15.3<br />
S [PSU] 37.7 37.9 38.0 38.1 38.2 38.3 38.3 38.4 38.4 38.4<br />
U [m/s] -0.076 -0.040 -0.028 -0.026 -0.033 -0.004 0.001 -0.001 0.009 0.015<br />
V [m/s] -0.213 -0.161 -0.150 -0.124 -0.138 -0.061 -0.032 -0.020 -0.016 -0.016<br />
T [°C] 23.9 22.6 21.6 20.4 18.8 17.1 16.3 15.6 15.3 15.2<br />
S [PSU] 37.8 38.0 38.1 38.1 38.2 38.3 38.3 38.4 38.4 38.4<br />
U [m/s] -0.097 -0.048 -0.028 -0.018 -0.025 -0.001 0.003 0.002 0.010 0.016<br />
V [m/s] -0.221 -0.156 -0.145 -0.121 -0.132 -0.057 -0.030 -0.019 -0.015 -0.015<br />
T [°C] 24.1 22.4 21.3 20.1 18.6 17.0 16.2 15.6 15.3 15.2<br />
S [PSU] 37.8 38.0 38.1 38.2 38.2 38.3 38.3 38.4 38.4 38.4<br />
U [m/s] -0.093 -0.042 -0.023 -0.017 -0.027 -0.003 0.001 -0.001 0.009 0.016<br />
V [m/s] -0.233 -0.163 -0.151 -0.128 -0.138 -0.061 -0.032 -0.021 -0.017 -0.017<br />
T [°C] 24.4 22.3 21.1 19.8 18.3 16.8 16.1 15.5 15.2 15.2<br />
S [PSU] 37.9 38.1 38.1 38.2 38.3 38.3 38.4 38.4 38.4 38.4<br />
U [m/s] -0.091 -0.040 -0.027 -0.024 -0.033 -0.006 0.001 0.000 0.012 0.018<br />
V [m/s] -0.215 -0.169 -0.157 -0.129 -0.136 -0.062 -0.035 -0.025 -0.022 -0.022<br />
T [°C] 24.9 22.6 21.1 19.8 18.5 17.0 16.1 15.5 15.2 15.1<br />
S [PSU] 37.9 38.1 38.1 38.2 38.3 38.3 38.4 38.4 38.4 38.4<br />
U [m/s] -0.033 -0.025 -0.024 -0.021 -0.029 -0.009 -0.003 -0.007 0.002 0.008<br />
V [m/s] -0.158 -0.150 -0.129 -0.099 -0.107 -0.052 -0.029 -0.018 -0.014 -0.014<br />
T [°C] 25.2 22.7 21.0 19.7 18.5 17.1 16.2 15.6 15.2 15.2<br />
S [PSU] 37.8 38.1 38.2 38.2 38.3 38.3 38.4 38.4 38.4 38.4<br />
U [m/s] -0.075 -0.026 -0.019 -0.014 -0.019 -0.003 0.001 -0.001 0.005 0.010<br />
V [m/s] -0.159 -0.132 -0.116 -0.092 -0.097 -0.045 -0.024 -0.015 -0.011 -0.011<br />
T [°C] 24.8 22.3 20.8 19.5 18.3 17.0 16.2 15.6 15.2 15.2<br />
S [PSU] 37.8 38.1 38.2 38.2 38.3 38.3 38.4 38.4 38.4 38.4<br />
U [m/s] -0.104 -0.029 -0.014 -0.010 -0.015 0.001 0.003 0.001 0.004 0.008<br />
V [m/s] -0.182 -0.124 -0.109 -0.084 -0.088 -0.034 -0.017 -0.010 -0.006 -0.006<br />
T [°C] 24.4 22.0 20.5 19.3 18.2 16.9 16.3 15.7 15.3 15.2<br />
S [PSU] 37.8 38.1 38.2 38.3 38.3 38.3 38.4 38.4 38.4 38.4<br />
U [m/s] -0.076 -0.031 -0.014 -0.012 -0.014 0.001 0.003 0.001 0.001 0.004<br />
V [m/s] -0.183 -0.119 -0.097 -0.072 -0.074 -0.026 -0.012 -0.006 -0.003 -0.003<br />
01/0<br />
7/20<br />
08<br />
T [°C] 24.7 22.1 20.5 19.4 18.3 17.1 16.4 15.8 15.3 15.3<br />
S [PSU] 37.8 38.0 38.2 38.3 38.3 38.3 38.4 38.4 38.4 38.4<br />
22700172-01-00101.docx 27 DHI Italia
Trans Adriatic Pipeline – TAP, <strong>ESIA</strong> <strong>Albania</strong>, <strong>Annex</strong> 9 - <strong>Sediment</strong> <strong>Dispersion</strong> <strong>Modelling</strong><br />
AAL00-ERM-641-Y-TAE-1010, Rev.: 01 / at05, Page 32 of 278<br />
Depth [m]<br />
1 5 8 12 15 20 24 29 34 40<br />
U [m/s] -0.058 -0.028 -0.013 -0.007 -0.006 0.004 0.005 0.003 0.000 0.001<br />
V [m/s] -0.159 -0.107 -0.076 -0.049 -0.048 -0.016 -0.006 -0.002 0.002 0.001<br />
07/07/2008 06/07/2008 05/07/2008 04/07/2008 03/07/2008 02/07/2008<br />
T [°C] 24.9 22.1 20.4 19.3 18.3 17.1 16.5 15.9 15.4 15.3<br />
S [PSU] 37.7 38.0 38.2 38.3 38.3 38.3 38.4 38.4 38.4 38.4<br />
U [m/s] -0.041 -0.025 -0.015 -0.006 -0.004 0.005 0.006 0.005 0.001 0.001<br />
V [m/s] -0.115 -0.084 -0.062 -0.042 -0.040 -0.011 -0.002 0.001 0.004 0.003<br />
T [°C] 25.0 22.1 20.3 19.2 18.2 17.1 16.5 16.0 15.5 15.4<br />
S [PSU] 37.5 38.0 38.2 38.3 38.3 38.3 38.4 38.4 38.4 38.4<br />
U [m/s] -0.064 -0.019 -0.010 -0.007 -0.005 0.005 0.006 0.006 0.003 0.004<br />
V [m/s] -0.143 -0.084 -0.062 -0.044 -0.044 -0.009 -0.002 0.000 0.002 0.001<br />
T [°C] 25.1 22.1 20.4 19.3 18.2 17.1 16.5 16.0 15.6 15.5<br />
S [PSU] 37.5 37.9 38.2 38.3 38.3 38.3 38.4 38.4 38.4 38.4<br />
U [m/s] -0.040 -0.018 -0.012 -0.009 -0.008 0.004 0.005 0.004 0.002 0.003<br />
V [m/s] -0.125 -0.095 -0.066 -0.041 -0.042 -0.010 -0.001 0.002 0.003 0.002<br />
T [°C] 25.4 22.4 20.4 19.2 18.3 17.2 16.5 16.1 15.6 15.5<br />
S [PSU] 37.4 37.9 38.2 38.3 38.3 38.3 38.4 38.4 38.4 38.4<br />
U [m/s] -0.025 -0.030 -0.022 -0.011 -0.004 0.007 0.009 0.009 0.005 0.005<br />
V [m/s] -0.074 -0.076 -0.048 -0.027 -0.027 -0.005 0.000 0.003 0.004 0.003<br />
T [°C] 25.7 22.9 20.5 19.2 18.3 17.2 16.6 16.2 15.7 15.6<br />
S [PSU] 37.3 37.8 38.1 38.3 38.3 38.3 38.4 38.4 38.4 38.4<br />
U [m/s] -0.048 -0.024 -0.005 0.000 0.002 0.006 0.006 0.006 0.002 0.001<br />
V [m/s] -0.098 -0.052 -0.041 -0.030 -0.028 -0.004 0.003 0.005 0.006 0.006<br />
T [°C] 25.2 22.4 20.3 19.1 18.1 17.0 16.5 16.1 15.7 15.6<br />
S [PSU] 37.3 37.8 38.2 38.3 38.3 38.4 38.4 38.4 38.4 38.4<br />
U [m/s] -0.058 -0.017 -0.015 -0.014 -0.012 0.004 0.007 0.008 0.008 0.010<br />
V [m/s] -0.133 -0.093 -0.064 -0.041 -0.043 -0.007 0.000 0.002 0.002 0.001<br />
As illustrated for scenario 1, in addition to temperature, salinity and currents<br />
from the general circulation of the Adriatic Sea (baroclinic currents), also<br />
wind conditions for the selected time window have been extracted. As<br />
illustrated in Chapter 2, the WATCH model database has been used [2]. In<br />
particular, the hourly values of wind velocity components U and V, together<br />
with the hourly atmospheric pressure for the period 23/06/2008 –<br />
07/07/2008, have been extracted from the closest location (the closest cell)<br />
to the <strong>Albania</strong>n landfall site.<br />
Finally, the astronomical tide conditions at the <strong>Albania</strong>n landfall site during<br />
the period 23/06/2008 – 07/07/2008 have been extracted from C-MAP<br />
database (Chapter 2) [5]; the time series for 15 days is illustrated in Figure<br />
3-2: an entire tidal cycle is represented.<br />
22700172-01-00101.docx 28 DHI Italia
Trans Adriatic Pipeline – TAP, <strong>ESIA</strong> <strong>Albania</strong>, <strong>Annex</strong> 9 - <strong>Sediment</strong> <strong>Dispersion</strong> <strong>Modelling</strong><br />
AAL00-ERM-641-Y-TAE-1010, Rev.: 01 / at05, Page 33 of 278<br />
Figure 3-2 Astronomical tide during the period 23/06/2008 – 07/07/2008 for the Durres<br />
C-MAP station. Source: The time series is extracted from the database<br />
available in the tool MIKE C-MAP, part of DHI software package [5], station:<br />
Durres, period: 23/06/2008 – 07/07/2008<br />
3. Scenario 3: Representative meteomarine conditions for a spring/summer<br />
storm event.<br />
In this scenario the same meteomarine conditions assumed for scenario 2 of<br />
tide, wind and currents from the general circulation of the Adriatic Sea<br />
(baroclinic currents), have been considered. In addition, a relatively severe<br />
wave event has been added.<br />
Scenario 3 therefore includes the effect of wave generated currents and since<br />
the dredging operations will be suspended during storm conditions, this<br />
scenario will be particularly relevant in terms of resuspension of the amount<br />
of dredged sediment which will be temporarily deposited close to the dredged<br />
channel during the operations. The assumption for scenario 3 is that dredging<br />
operations will likely take place in the spring/summer period, which is<br />
characterized by a lower frequency and magnitude of storms.<br />
Under assumed wave conditions, a storm event characterized by a simplified<br />
triangular shape has been considered (Figure 3-3). The significant wave<br />
height at the peak of the storm has been chosen referring to the scatter<br />
analysis illustrated in Table 2-5 and Table 2-4 for spring/summer seasons:<br />
the most frequent direction for the seasons and a wave height characterized<br />
by approximately one year’s return period have been selected.<br />
The peak wave period has been estimated referring to the bivariate statistics<br />
provided by “Wind and Wave Mediterranean Atlas” [1] (Table 2-7). The wave<br />
22700172-01-00101.docx 29 DHI Italia
Trans Adriatic Pipeline – TAP, <strong>ESIA</strong> <strong>Albania</strong>, <strong>Annex</strong> 9 - <strong>Sediment</strong> <strong>Dispersion</strong> <strong>Modelling</strong><br />
AAL00-ERM-641-Y-TAE-1010, Rev.: 01 / at05, Page 34 of 278<br />
height at the peak of the storm, together with the mean wave direction and<br />
the peak wave period are illustrated in Table 3-3.<br />
Table 3-3<br />
Significant wave height, mean wave direction and peak wave period at the<br />
peak of the storm<br />
H s [m] T p [s] MWD [°N]<br />
2.5 7.0 315<br />
Figure 3-3 Modification of significant wave height during the storm event: shape of<br />
triangular wave storm assumed for scenario 3<br />
22700172-01-00101.docx 30 DHI Italia
Trans Adriatic Pipeline – TAP, <strong>ESIA</strong> <strong>Albania</strong>, <strong>Annex</strong> 9 - <strong>Sediment</strong> <strong>Dispersion</strong> <strong>Modelling</strong><br />
AAL00-ERM-641-Y-TAE-1010, Rev.: 01 / at05, Page 35 of 278<br />
4 3D HYDRODYNAMIC MODEL<br />
The numerical modelling study has been performed using the MIKEbyDHI<br />
package, developed by DHI (Danish Hydraulic Institute). In particular, the 3D<br />
model MIKE 3 HD FM has been used for the simulation of hydrodynamic fields in<br />
the <strong>Albania</strong>n landfall site.<br />
The MIKE 3 primitive equation model is based on a flexible mesh approach and it<br />
has been developed for applications within oceanographic, coastal and estuarine<br />
environments. The spatial discretization of the equations is performed using a<br />
cell centred finite volume method.<br />
The horizontal discretization can combine triangles and quadrilateral elements,<br />
while the vertical is based on a sigma or combined sigma-zed discretization.<br />
Together with the inclusion of the Flather boundary conditions, the model is ideal<br />
for down scaling the regional scale oceanographic models to high resolution<br />
coastal application. The regional scale resolution and bathymetry can be very<br />
well approximated at the boundaries, then gradually imposing the higher<br />
resolution through the flexible mesh approach.<br />
A detailed description of MIKE 3 HD FM model is included in Appendix F.<br />
In Section 4.1, a detailed description of the bathymetric data used in the model,<br />
together with a description of the model domain and the adopted horizontal and<br />
vertical resolution are illustrated. In Sections 4.2 to 4.4 the results of the<br />
hydrodynamic model for the three scenarios are illustrated, while some<br />
considerations on tidal currents can be found in Section 4.5.<br />
It has to be noticed that the model is not calibrated against measurements, due<br />
to unavailability of registered data.<br />
4.1 Bathymetric data, model domain and resolution<br />
For the bathymetric characterisation of the area, the database CM-93 from C-<br />
MAP has been used [4]. CM-93 is a global database of nautical cartography in<br />
digital format, created and continuously updated by the Norwegian C-MAP.<br />
While nautical charts data are widely used offshore, near shore, in shallow water,<br />
it is advisable to use a more detailed bathymetric survey, especially where the<br />
detail of the nautical charts is poor, as in the present case. Figure 4-1 illustrates<br />
the coarse resolution of nautical charts available for the <strong>Albania</strong>n landfall site.<br />
A rough representation of near shore bathymetry could become a critical issue<br />
when it is needed to model the hydrodynamic conditions at a certain site,<br />
especially when the modelled currents are generated by waves. In fact, the ratio<br />
between wave height and water depth is crucial for a proper representation of<br />
the energy dissipation, which occurs during the propagation of the wave from<br />
offshore to near shore.<br />
22700172-01-00101.docx 31 DHI Italia
Trans Adriatic Pipeline – TAP, <strong>ESIA</strong> <strong>Albania</strong>, <strong>Annex</strong> 9 - <strong>Sediment</strong> <strong>Dispersion</strong> <strong>Modelling</strong><br />
AAL00-ERM-641-Y-TAE-1010, Rev.: 01 / at05, Page 36 of 278<br />
Figure 4-1 Bathymetric data extracted from the CM-93 database [4], available within<br />
MIKE C-MAP toolbox, part of DHI software package [5]<br />
In order to obtain a more accurate representation of the local bathymetry, a<br />
detailed bathymetric survey, provided by TAP, has been used. This survey is<br />
showed in <strong>Annex</strong> D of the document “OPL00-STA-160-Y-TAE-0001_00-Final<br />
Report Environmental Survey <strong>Albania</strong>n Landfall”, where the environmental chart<br />
for the east side is represented. This detailed bathymetry is available for a<br />
narrow corridor (Figure 4-2) along the pipeline route, so these data have been<br />
merged with the bathymetric data coming from the C-MAP database [5] (Figure<br />
4-3).<br />
Latitude [°]<br />
Latitude [°]<br />
Longitude [°]<br />
Longitude [°]<br />
Figure 4-2 Bathymetric survey provided by TAP<br />
22700172-01-00101.docx 32 DHI Italia
Trans Adriatic Pipeline – TAP, <strong>ESIA</strong> <strong>Albania</strong>, <strong>Annex</strong> 9 - <strong>Sediment</strong> <strong>Dispersion</strong> <strong>Modelling</strong><br />
AAL00-ERM-641-Y-TAE-1010, Rev.: 01 / at05, Page 37 of 278<br />
Latitude [°]<br />
Longitude [°]<br />
Figure 4-3 Merge of the two sources of bathymetric data: bathymetric survey provided<br />
by TAP and bathymetric data extracted from CM-93 database [4]<br />
The final result of this processing is illustrated in Figure 4-4 where the model<br />
bathymetry is illustrated, including lines at equal depth and labels.<br />
The extension of the model domain is approximately equal to 27,000 m along<br />
the coast and to 15,000 m in the direction perpendicular to the coast. The<br />
maximum depth which can be found in the model domain is approximately equal<br />
to 95 m.<br />
The model bathymetry has been constructed using the flexible mesh approach:<br />
the offshore spatial resolution (average length of triangles sides) is around 1,000<br />
m; gradually, while approaching the coast and to the pipeline route corridor, the<br />
resolution is finer, up to around 100 m. Along the pipeline route corridor, a<br />
resolution of around 50 m has been selected; in this corridor a quadrangular<br />
mesh, instead of triangular, is used (Figure 4-5). The quadrangular mesh is<br />
more suitable when simulating local sources of sediment, like in this case.<br />
The vertical discretization is made of 5 sigma-layers combined with one zedlayer.<br />
The water depth between surface and -20 m is discretized through 5<br />
sigma-layers, each one characterized by a variable thickness depending on the<br />
local water depth (i.e. when the water depth is 15 m, the thickness of each<br />
sigma-layer is 3 m), while the deeper part of the water column is discretized<br />
through an unique zed-layer.<br />
22700172-01-00101.docx 33 DHI Italia
Trans Adriatic Pipeline – TAP, <strong>ESIA</strong> <strong>Albania</strong>, <strong>Annex</strong> 9 - <strong>Sediment</strong> <strong>Dispersion</strong> <strong>Modelling</strong><br />
AAL00-ERM-641-Y-TAE-1010, Rev.: 01 / at05, Page 38 of 278<br />
Latitude [°]<br />
Longitude [°]<br />
Figure 4-4 Merged bathymetry in the calculation grid used to study the <strong>Albania</strong>n landfall<br />
site<br />
22700172-01-00101.docx 34 DHI Italia
Trans Adriatic Pipeline – TAP, <strong>ESIA</strong> <strong>Albania</strong>, <strong>Annex</strong> 9 - <strong>Sediment</strong> <strong>Dispersion</strong> <strong>Modelling</strong><br />
AAL00-ERM-641-Y-TAE-1010, Rev.: 01 / at05, Page 39 of 278<br />
Latitude [°]<br />
Longitude [°]<br />
Figure 4-5<br />
Mesh used in the numerical model to study the <strong>Albania</strong>n landfall site<br />
Following the assumed progress of dredging operation, four different<br />
bathymetries have been created (Section 5.1.3), each one specific for the<br />
simulation of the sediment release at a certain point along the pipeline route.<br />
The detailed description of the dredging phases and the related bathymetries are<br />
illustrated in Chapter 5.<br />
4.2 Scenario 1: results<br />
Scenario 1 is representative of typical autumn/winter conditions. In these<br />
months the currents from the general circulation of the Adriatic Sea (baroclinic<br />
currents) are frequently directed from south to north and this direction can be<br />
found almost constant both along the 15 days simulated and along the water<br />
column, due to the reduced stratification.<br />
In general, results show that the currents are stronger offshore than near shore.<br />
In fact, the general circulation is dominated by currents from the general<br />
circulation of the Adriatic Sea (baroclinic currents), which are stronger at higher<br />
depths, because of the lower interaction with the sea bed that causes energy<br />
dissipation and a reduction in the current speed.<br />
22700172-01-00101.docx 35 DHI Italia
Trans Adriatic Pipeline – TAP, <strong>ESIA</strong> <strong>Albania</strong>, <strong>Annex</strong> 9 - <strong>Sediment</strong> <strong>Dispersion</strong> <strong>Modelling</strong><br />
AAL00-ERM-641-Y-TAE-1010, Rev.: 01 / at05, Page 40 of 278<br />
Another important forcing that plays an important role in the generation of the<br />
current field is the wind, the influence of which is very important at the surface.<br />
The following figures illustrate an example of the hydrodynamic field at three<br />
different depths (surface, intermediate depth and sea bed depth) for the existing<br />
bathymetry. The plots corresponding to “surface” and “intermediate depth” are<br />
referred to the upper and intermediate sigma layer of the model, respectively.<br />
This means that the plots are not representative of the same depth everywhere:<br />
where the water depth is 20 m or higher, the intermediate depth is 10 m, where<br />
the water depth is shallower than 20 m, the intermediate depth is half of the<br />
local water depth. The plots corresponding to “sea bed depth” are referred to the<br />
deeper sigma layer. This means that the plot is representative of what happens<br />
at the sea bed where the water depth is equal or shallower than 20 m (which is<br />
the limit of the sigma layer – zed layer interface). Where the water depth is<br />
deeper, the plot is representative of the behavior of the currents at the interface<br />
depth (20 m).<br />
The plots refer to two time steps: one is representative of an average condition<br />
of current speed and direction (04/01/2008), and the other is representative of a<br />
condition characterized by higher current speed (13/01/2008). The plots<br />
referring to the same time steps but to different bathymetries are illustrated in<br />
Appendix D.<br />
In general, at surface the average current speed is around 0.25 m/s (Figure 4-6)<br />
and decreases gradually in the deeper layer, up to an average speed of around<br />
0.1 m/s at the sea bed depth (Figure 4-8).<br />
The maximum current speed reached during the 15 days of simulation is<br />
approximately equal to 0.5 m/s at surface (Figure 4-9). At the same time step,<br />
the maximum current speed at the sea bed depth is around 0.30 m/s (Figure<br />
4-11).<br />
The influence of the dredging of the access channel on the hydrodynamic field is<br />
limited to the area where the channel will be dredged. In particular, the presence<br />
of the channel creates a discontinuity in the current field: along the dredged<br />
stretch the current velocity decreases significantly. In general, the current speed<br />
inside the channel is never higher than 0.05-0.10 m/s.<br />
22700172-01-00101.docx 36 DHI Italia
Trans Adriatic Pipeline – TAP, <strong>ESIA</strong> <strong>Albania</strong>, <strong>Annex</strong> 9 - <strong>Sediment</strong> <strong>Dispersion</strong> <strong>Modelling</strong><br />
AAL00-ERM-641-Y-TAE-1010, Rev.: 01 / at05, Page 41 of 278<br />
Latitude [°]<br />
Longitude [°]<br />
Figure 4-6 Hydrodynamic field at surface for the <strong>Albania</strong>n landfall site (existing<br />
bathymetry) during autumn/winter representative conditions (04/01/2008)<br />
22700172-01-00101.docx 37 DHI Italia
Trans Adriatic Pipeline – TAP, <strong>ESIA</strong> <strong>Albania</strong>, <strong>Annex</strong> 9 - <strong>Sediment</strong> <strong>Dispersion</strong> <strong>Modelling</strong><br />
AAL00-ERM-641-Y-TAE-1010, Rev.: 01 / at05, Page 42 of 278<br />
Latitude [°]<br />
Longitude [°]<br />
Figure 4-7 Hydrodynamic field at intermediate depth for the <strong>Albania</strong>n landfall site<br />
(existing bathymetry) during autumn/winter representative conditions<br />
(04/01/2008)<br />
22700172-01-00101.docx 38 DHI Italia
Trans Adriatic Pipeline – TAP, <strong>ESIA</strong> <strong>Albania</strong>, <strong>Annex</strong> 9 - <strong>Sediment</strong> <strong>Dispersion</strong> <strong>Modelling</strong><br />
AAL00-ERM-641-Y-TAE-1010, Rev.: 01 / at05, Page 43 of 278<br />
Latitude [°]<br />
Longitude [°]<br />
Figure 4-8 Hydrodynamic field at sea bed depth for the <strong>Albania</strong>n landfall site (existing<br />
bathymetry) during autumn/winter representative conditions (04/01/2008)<br />
22700172-01-00101.docx 39 DHI Italia
Trans Adriatic Pipeline – TAP, <strong>ESIA</strong> <strong>Albania</strong>, <strong>Annex</strong> 9 - <strong>Sediment</strong> <strong>Dispersion</strong> <strong>Modelling</strong><br />
AAL00-ERM-641-Y-TAE-1010, Rev.: 01 / at05, Page 44 of 278<br />
Latitude [°]<br />
Longitude [°]<br />
Figure 4-9 Hydrodynamic field at surface for the <strong>Albania</strong>n landfall site (existing<br />
bathymetry) during autumn/winter representative conditions (13/01/2008)<br />
22700172-01-00101.docx 40 DHI Italia
Trans Adriatic Pipeline – TAP, <strong>ESIA</strong> <strong>Albania</strong>, <strong>Annex</strong> 9 - <strong>Sediment</strong> <strong>Dispersion</strong> <strong>Modelling</strong><br />
AAL00-ERM-641-Y-TAE-1010, Rev.: 01 / at05, Page 45 of 278<br />
Latitude [°]<br />
Longitude [°]<br />
Figure 4-10 Hydrodynamic field at intermediate depth for the <strong>Albania</strong>n landfall site<br />
(existing bathymetry) during autumn/winter representative conditions<br />
(13/01/2008)<br />
22700172-01-00101.docx 41 DHI Italia
Trans Adriatic Pipeline – TAP, <strong>ESIA</strong> <strong>Albania</strong>, <strong>Annex</strong> 9 - <strong>Sediment</strong> <strong>Dispersion</strong> <strong>Modelling</strong><br />
AAL00-ERM-641-Y-TAE-1010, Rev.: 01 / at05, Page 46 of 278<br />
Latitude [°]<br />
Longitude [°]<br />
Figure 4-11 Hydrodynamic field at sea bed depth for the <strong>Albania</strong>n landfall site (existing<br />
bathymetry) during autumn/winter representative conditions (13/01/2008)<br />
4.3 Scenario 2: results<br />
Scenario 2 is representative of typical spring/summer conditions. In these<br />
months the currents from the general circulation of the Adriatic Sea (baroclinic<br />
currents) are frequently directed from north to south and this direction can be<br />
found almost constant both along the 15 days simulated but, due to the<br />
significant stratification of the water column, some differences in the<br />
hydrodynamic field can be noticed along the water column.<br />
In general, similarly to scenario 1, the results show that the currents are<br />
stronger offshore than near shore.<br />
The following figures illustrate an example of the hydrodynamic field at three<br />
different depths (surface, intermediate depth and sea bed depth) for the existing<br />
bathymetry. The definition of “surface”, “intermediate depth” and “sea bed<br />
depth” is illustrated in section 4.2. The plots refer to two time steps: one is<br />
representative of an average condition of current speed and direction<br />
(23/06/2008), and the other (01/07/2008) is representative of a condition<br />
characterized by the presence of a big eddy which generates at the lee side of the<br />
Seman river mouth: on this day, in fact, the near shore current is directed from<br />
south to north.<br />
22700172-01-00101.docx 42 DHI Italia
Trans Adriatic Pipeline – TAP, <strong>ESIA</strong> <strong>Albania</strong>, <strong>Annex</strong> 9 - <strong>Sediment</strong> <strong>Dispersion</strong> <strong>Modelling</strong><br />
AAL00-ERM-641-Y-TAE-1010, Rev.: 01 / at05, Page 47 of 278<br />
The plots referring to the same time steps but to different bathymetries are<br />
illustrated in Appendix D.<br />
In general, at surface the average current speed is around 0.20 m/s (Figure<br />
4-12) and decreases gradually in the deeper layer, up to an average speed of<br />
around 0.05 m/s at the sea bed depth (Figure 4-14).<br />
The maximum current speed reached during the 15 days of simulation is<br />
approximately equal to 0.40 m/s at surface. At the same time step, the<br />
maximum current speed at the sea bed depth is around 0.30 m/s.<br />
For scenario 2 conditions, the influence of the dredging of the access channel on<br />
the hydrodynamic field is even lower than for scenario 1. The current speed is in<br />
fact already very weak along the pipeline route, due to the protection from these<br />
currents induced by the presence of the Seman river mouth shape immediately<br />
north of the <strong>Albania</strong>n landfall site.<br />
Latitude [°]<br />
Longitude [°]<br />
Figure 4-12 Hydrodynamic field at surface for the <strong>Albania</strong>n landfall site (existing<br />
bathymetry) during spring/summer representative conditions (23/06/2008)<br />
22700172-01-00101.docx 43 DHI Italia
Trans Adriatic Pipeline – TAP, <strong>ESIA</strong> <strong>Albania</strong>, <strong>Annex</strong> 9 - <strong>Sediment</strong> <strong>Dispersion</strong> <strong>Modelling</strong><br />
AAL00-ERM-641-Y-TAE-1010, Rev.: 01 / at05, Page 48 of 278<br />
Latitude [°]<br />
Longitude [°]<br />
Figure 4-13 Hydrodynamic field at intermediate depth for the <strong>Albania</strong>n landfall site<br />
(existing bathymetry) during spring/summer representative conditions<br />
(23/06/2008)<br />
22700172-01-00101.docx 44 DHI Italia
Trans Adriatic Pipeline – TAP, <strong>ESIA</strong> <strong>Albania</strong>, <strong>Annex</strong> 9 - <strong>Sediment</strong> <strong>Dispersion</strong> <strong>Modelling</strong><br />
AAL00-ERM-641-Y-TAE-1010, Rev.: 01 / at05, Page 49 of 278<br />
Latitude [°]<br />
Longitude [°]<br />
Figure 4-14 Hydrodynamic field at sea bed depth for the <strong>Albania</strong>n landfall site (existing<br />
bathymetry) during spring/summer representative conditions (23/06/2008)<br />
22700172-01-00101.docx 45 DHI Italia
Trans Adriatic Pipeline – TAP, <strong>ESIA</strong> <strong>Albania</strong>, <strong>Annex</strong> 9 - <strong>Sediment</strong> <strong>Dispersion</strong> <strong>Modelling</strong><br />
AAL00-ERM-641-Y-TAE-1010, Rev.: 01 / at05, Page 50 of 278<br />
Latitude [°]<br />
Longitude [°]<br />
Figure 4-15 Hydrodynamic field at surface for the <strong>Albania</strong>n landfall site (existing<br />
bathymetry) during spring/summer representative conditions (01/07/2008)<br />
22700172-01-00101.docx 46 DHI Italia
Trans Adriatic Pipeline – TAP, <strong>ESIA</strong> <strong>Albania</strong>, <strong>Annex</strong> 9 - <strong>Sediment</strong> <strong>Dispersion</strong> <strong>Modelling</strong><br />
AAL00-ERM-641-Y-TAE-1010, Rev.: 01 / at05, Page 51 of 278<br />
Latitude [°]<br />
Longitude [°]<br />
Figure 4-16 Hydrodynamic field at intermediate depth for the <strong>Albania</strong>n landfall site<br />
(existing bathymetry) during spring/summer representative conditions<br />
(01/07/2008)<br />
22700172-01-00101.docx 47 DHI Italia
Trans Adriatic Pipeline – TAP, <strong>ESIA</strong> <strong>Albania</strong>, <strong>Annex</strong> 9 - <strong>Sediment</strong> <strong>Dispersion</strong> <strong>Modelling</strong><br />
AAL00-ERM-641-Y-TAE-1010, Rev.: 01 / at05, Page 52 of 278<br />
Latitude [°]<br />
Longitude [°]<br />
Figure 4-17 Hydrodynamic field at sea bed depth for the <strong>Albania</strong>n landfall site (existing<br />
bathymetry) during spring/summer representative conditions (01/07/2008)<br />
4.4 Scenario 3: results<br />
In this scenario the same meteomarine conditions assumed for scenario 2 of<br />
tide, wind and currents from the general circulation of the Adriatic Sea<br />
(baroclinic currents) have been considered. In addition, a relatively severe wave<br />
event characterized by a duration of 48 h has been added.<br />
Scenario 3 therefore includes the effect of wave generated currents: during the<br />
propagation of the waves from offshore to near shore, when approaching the so<br />
called surf zone, if the mean wave direction is not perpendicular to the isolines, a<br />
gradient in radiation stress fields at the seabed generates longshore currents,<br />
which are characterized by higher speed in case of large waves and very oblique<br />
wave attack.<br />
In general, longshore currents are not strong enough to lift the sediment from<br />
the seabed and disperse it in the water column: the main responsible for this is<br />
the mechanical action of wave breaking, while longshore currents are responsible<br />
for the horizontal movement of the suspended sediments once they have already<br />
been put in suspension.<br />
On the basis of the above, a significant amount of sediment can be put in<br />
suspension from wave breaking, which mainly occurs in shallow water. The<br />
22700172-01-00101.docx 48 DHI Italia
Trans Adriatic Pipeline – TAP, <strong>ESIA</strong> <strong>Albania</strong>, <strong>Annex</strong> 9 - <strong>Sediment</strong> <strong>Dispersion</strong> <strong>Modelling</strong><br />
AAL00-ERM-641-Y-TAE-1010, Rev.: 01 / at05, Page 53 of 278<br />
presence of the temporary amount of sediment nearby the dredged channel<br />
locally determines shallow water conditions, above which wave breaking can<br />
therefore dissipate a great part of the energy associated to the incident wave.<br />
This is the reason why, for Scenario 3, the temporary amount of sediment is<br />
included in the model bathymetry.<br />
From the analysis of the model results, higher values of current speed can be<br />
observed where the temporary deposit will be placed (shallow water, more<br />
severe wave breaking). On the contrary, inside the channel, due to the local<br />
deepening of the seabed, the current speed decreases. This situation is<br />
particularly evident in Figure 4-20, Figure 4-21, and Figure 4-22.<br />
For this scenario, results have been plotted at three different depths (surface,<br />
intermediate depth and sea bed depth) in four different time steps. The time<br />
steps considered as representatives of this scenario are the following:<br />
<br />
<br />
<br />
growing phase of the storm: it is the first time step at which the significant<br />
wave height is bigger than 1.0 m (23/06/2008 – h. 7.00);<br />
peak of the storm: the wave event reaches the maximum significant wave<br />
height, which is equal to 2.5 m (23/06/2008 – h. 16.00);<br />
decreasing phase of the storm: it is the first time step at which the significant<br />
wave height again becomes smaller than 1.0 m (24/06/2008 – h. 11.00).<br />
During the growing phase of the storm, when the current speed is still low, at<br />
surface, in the zone of the channel the current speed is around 0.1 m/s and<br />
around 0.3 m/s in the zone of the deposit (Figure 4-12), while it is respectively<br />
0.05 m/s and 0.15 m/s in the deeper layer (Figure 4-14).<br />
At the peak of the storm, the current speed at surface is around 0.25 m/s inside<br />
the channel and higher than 0.50 m/s above the sediment deposit and around<br />
the dredged channel in general (Figure 4-21). At deeper water, the current<br />
speed is around 0.10 m/s along the channel and around 0.30 m/s above the<br />
temporary deposit.<br />
Again, the definition of “surface”, “intermediate depth” and<br />
associated to each plot is illustrated in section 4.2.<br />
“sea bed depth”<br />
22700172-01-00101.docx 49 DHI Italia
Trans Adriatic Pipeline – TAP, <strong>ESIA</strong> <strong>Albania</strong>, <strong>Annex</strong> 9 - <strong>Sediment</strong> <strong>Dispersion</strong> <strong>Modelling</strong><br />
AAL00-ERM-641-Y-TAE-1010, Rev.: 01 / at05, Page 54 of 278<br />
Latitude [°]<br />
Longitude [°]<br />
Figure 4-18 Hydrodynamic field at surface for the <strong>Albania</strong>n landfall site (bathymetry<br />
includes the temporary deposit of dredged sediment) during the growing<br />
phase of the storm, at the first time step at which the significant wave height<br />
is bigger than 1.0 m (23/06/2008 – h. 7.00)<br />
22700172-01-00101.docx 50 DHI Italia
Trans Adriatic Pipeline – TAP, <strong>ESIA</strong> <strong>Albania</strong>, <strong>Annex</strong> 9 - <strong>Sediment</strong> <strong>Dispersion</strong> <strong>Modelling</strong><br />
AAL00-ERM-641-Y-TAE-1010, Rev.: 01 / at05, Page 55 of 278<br />
Latitude [°]<br />
Longitude [°]<br />
Figure 4-19 Hydrodynamic field at intermediate depth for the <strong>Albania</strong>n landfall site<br />
(bathymetry includes the temporary deposit of dredged sediment) during the<br />
growing phase of the storm, at the first time step at which the significant<br />
wave height is bigger than 1.0 m (23/06/2008 – h. 7.00)<br />
22700172-01-00101.docx 51 DHI Italia
Trans Adriatic Pipeline – TAP, <strong>ESIA</strong> <strong>Albania</strong>, <strong>Annex</strong> 9 - <strong>Sediment</strong> <strong>Dispersion</strong> <strong>Modelling</strong><br />
AAL00-ERM-641-Y-TAE-1010, Rev.: 01 / at05, Page 56 of 278<br />
Latitude [°]<br />
Longitude [°]<br />
Figure 4-20 Hydrodynamic field at sea bed depth for the <strong>Albania</strong>n landfall site<br />
(bathymetry includes the temporary deposit of dredged sediment) during the<br />
growing phase of the storm, at the first time step at which the significant<br />
wave height is bigger than 1.0 m (23/06/2008 – h. 7.00)<br />
22700172-01-00101.docx 52 DHI Italia
Trans Adriatic Pipeline – TAP, <strong>ESIA</strong> <strong>Albania</strong>, <strong>Annex</strong> 9 - <strong>Sediment</strong> <strong>Dispersion</strong> <strong>Modelling</strong><br />
AAL00-ERM-641-Y-TAE-1010, Rev.: 01 / at05, Page 57 of 278<br />
Latitude [°]<br />
Longitude [°]<br />
Figure 4-21 Hydrodynamic field at surface for the <strong>Albania</strong>n landfall site (bathymetry<br />
includes the temporary deposit of dredged sediment) during the peak of the<br />
storm, when the wave event reaches the maximum significant wave height<br />
equal to 2.5 m (23/06/2008 – h. 16.00)<br />
22700172-01-00101.docx 53 DHI Italia
Trans Adriatic Pipeline – TAP, <strong>ESIA</strong> <strong>Albania</strong>, <strong>Annex</strong> 9 - <strong>Sediment</strong> <strong>Dispersion</strong> <strong>Modelling</strong><br />
AAL00-ERM-641-Y-TAE-1010, Rev.: 01 / at05, Page 58 of 278<br />
Latitude [°]<br />
Longitude [°]<br />
Figure 4-22 Hydrodynamic field at intermediate depth for the <strong>Albania</strong>n landfall site<br />
(bathymetry includes the temporary deposit of dredged sediment) during the<br />
peak of the storm, when the wave event reaches the maximum significant<br />
wave height equal to 2.5 m (23/06/2008 – h. 16.00)<br />
22700172-01-00101.docx 54 DHI Italia
Trans Adriatic Pipeline – TAP, <strong>ESIA</strong> <strong>Albania</strong>, <strong>Annex</strong> 9 - <strong>Sediment</strong> <strong>Dispersion</strong> <strong>Modelling</strong><br />
AAL00-ERM-641-Y-TAE-1010, Rev.: 01 / at05, Page 59 of 278<br />
Latitude [°]<br />
Longitude [°]<br />
Figure 4-23 Hydrodynamic field at sea bed depth for the <strong>Albania</strong>n landfall site<br />
(bathymetry includes the temporary deposit of dredged sediment) during the<br />
peak of the storm, when the wave event reaches the maximum significant<br />
wave height equal to 2.5 m (23/06/2008 – h. 16.00)<br />
22700172-01-00101.docx 55 DHI Italia
Trans Adriatic Pipeline – TAP, <strong>ESIA</strong> <strong>Albania</strong>, <strong>Annex</strong> 9 - <strong>Sediment</strong> <strong>Dispersion</strong> <strong>Modelling</strong><br />
AAL00-ERM-641-Y-TAE-1010, Rev.: 01 / at05, Page 60 of 278<br />
Latitude [°]<br />
Longitude [°]<br />
Figure 4-24 Hydrodynamic field at surface for the <strong>Albania</strong>n landfall site (bathymetry<br />
includes the temporary deposit of dredged sediment) during the decreasing<br />
phase of the storm, at the first time step at which the significant wave height<br />
again becomes smaller than 1.0 m (24/06/2008 – h. 11.00)<br />
22700172-01-00101.docx 56 DHI Italia
Trans Adriatic Pipeline – TAP, <strong>ESIA</strong> <strong>Albania</strong>, <strong>Annex</strong> 9 - <strong>Sediment</strong> <strong>Dispersion</strong> <strong>Modelling</strong><br />
AAL00-ERM-641-Y-TAE-1010, Rev.: 01 / at05, Page 61 of 278<br />
Latitude [°]<br />
Longitude [°]<br />
Figure 4-25 Hydrodynamic field at intermediate depth for the <strong>Albania</strong>n landfall site<br />
(bathymetry includes the temporary deposit of dredged sediment) during the<br />
decreasing phase of the storm, at the first time step at which the significant<br />
wave height again becomes smaller than 1.0 m (24/06/2008 – h. 11.00)<br />
22700172-01-00101.docx 57 DHI Italia
Trans Adriatic Pipeline – TAP, <strong>ESIA</strong> <strong>Albania</strong>, <strong>Annex</strong> 9 - <strong>Sediment</strong> <strong>Dispersion</strong> <strong>Modelling</strong><br />
AAL00-ERM-641-Y-TAE-1010, Rev.: 01 / at05, Page 62 of 278<br />
Latitude [°]<br />
Longitude [°]<br />
Figure 4-26 Hydrodynamic field at sea bed depth for the <strong>Albania</strong>n landfall site<br />
(bathymetry includes the temporary deposit of dredged sediment) during the<br />
decreasing phase of the storm, at the first time step at which the significant<br />
wave height again becomes smaller than 1.0 m (24/06/2008 – h. 11.00)<br />
4.5 Considerations on tidal currents<br />
It is important to notice that the contribution of tidal currents in the<br />
representative current conditions at the <strong>Albania</strong>n landfall site can be considered<br />
as negligible: specific simulations considering only tidal forcing have been<br />
performed and the conclusion is that the current speed induced by tidal variation<br />
is at least one order of magnitude lower than currents from the general<br />
circulation of the Adriatic Sea (baroclinic currents) and/or wind currents at<br />
surface (example in Figure 4-27, where the current field during a condition of<br />
spring tide is illustrated). This figure shows a maximum current speed of about<br />
0.016 m/s and an average speed of about 0.01 m/s.<br />
Although it is negligible, the tidal current contribution is included as a separate<br />
forcing in both scenario 1 and scenario 2.<br />
22700172-01-00101.docx 58 DHI Italia
Trans Adriatic Pipeline – TAP, <strong>ESIA</strong> <strong>Albania</strong>, <strong>Annex</strong> 9 - <strong>Sediment</strong> <strong>Dispersion</strong> <strong>Modelling</strong><br />
AAL00-ERM-641-Y-TAE-1010, Rev.: 01 / at05, Page 63 of 278<br />
Latitude [°]<br />
Longitude [°]<br />
Figure 4-27 Current field at the <strong>Albania</strong>n landfall site generated by astronomical tide<br />
variations (Spring tide condition)<br />
22700172-01-00101.docx 59 DHI Italia
Trans Adriatic Pipeline – TAP, <strong>ESIA</strong> <strong>Albania</strong>, <strong>Annex</strong> 9 - <strong>Sediment</strong> <strong>Dispersion</strong> <strong>Modelling</strong><br />
AAL00-ERM-641-Y-TAE-1010, Rev.: 01 / at05, Page 64 of 278<br />
5 3D SEDIMENT DISPERSION MODEL<br />
The numerical modelling study of the sediment dispersion during dredging<br />
operations and during storm conditions has been performed using the<br />
MIKEbyDHI package, developed by DHI (Danish Hydraulic Institute). In<br />
particular, the 3D model MIKE 3 MT FM has been used for the simulation of<br />
sediment dispersion in the area.<br />
MT is a specific module developed to simulate the suspension and sedimentation<br />
of cohesive and mixed sediments under hydrodynamics forcing and external<br />
actions.<br />
The mud transport model includes the following physical phenomena:<br />
<br />
<br />
<br />
<br />
<br />
<br />
flocculation due to concentration;<br />
flocculation due to salinity;<br />
density effects at high concentrations;<br />
hindered settling;<br />
consolidation;<br />
morphological bed changes<br />
A detailed description of MIKE 3 MT FM model [7] is included in Appendix G.<br />
The sediment dispersion model is fully integrated with the hydrodynamic model<br />
MIKE 3 HD FM [6] (Chapter 4). Each simulation of the MT model is therefore<br />
characterized by a duration of 15 days, during which the plume of suspended<br />
sediment released during dredging operations or during a storm changes in<br />
extension, shape and concentration according to hydrodynamics (advection) and<br />
dispersion conditions.<br />
In Section 5.1 the methodological approach is illustrated, including the selection<br />
of representative points for the sediment release, the estimation of the dredging,<br />
release rates and settling velocity and the definition of the model bathymetries.<br />
In Sections 5.3 to 5.5 the maps of the maximum sediment concentrations over<br />
the entire duration of the simulation, averaged in the first 20 m of the water<br />
column and for the selected release points are illustrated.<br />
The plots representing maps of suspended sediment concentration (SSC) at<br />
three different depths (surface, intermediate depth and sea bed depth) for<br />
significant time steps are illustrated in Appendix E.<br />
5.1 Methodological approach<br />
5.1.1 Selection of representative points for the sediment release<br />
The choice of these points has taken into account the different approach in the<br />
dredging operations at different locations along the pipeline route: three<br />
different stretches can be identified, as follows:<br />
<br />
The first stretch is approximately 200 m long from the shoreline. Along this<br />
stretch the pipeline is placed through the use of cofferdams. Within the area<br />
of the cofferdams materials will be removed to a minimum dredging depth of<br />
3 m; this will provide a minimum burial depth (to top of pipe) of<br />
approximately 2 m. The purpose of the structure is to prevent natural<br />
22700172-01-00101.docx 60 DHI Italia
Trans Adriatic Pipeline – TAP, <strong>ESIA</strong> <strong>Albania</strong>, <strong>Annex</strong> 9 - <strong>Sediment</strong> <strong>Dispersion</strong> <strong>Modelling</strong><br />
AAL00-ERM-641-Y-TAE-1010, Rev.: 01 / at05, Page 65 of 278<br />
backfilling and retain the depth of the dredged channel until the pipeline can<br />
be laid during pipe installation. The area shall remain wet at all times. At this<br />
first stretch, the sediment released during dredging operations will stay<br />
confined within the area of the cofferdams. The assumed release point for<br />
the model of this first stretch is therefore the offshore end of the cofferdams,<br />
where the sediment can migrate from the protected area to the open sea;<br />
<br />
The second stretch is approximately 2,000 m long, from the offshore end of<br />
the cofferdam, where the depth is around 2.5 m, to a depth of approximately<br />
8 m. This stretch is characterized by the dredging of an access channel,<br />
aiming at guaranteeing the accessibility of the dredger to the actual shallow<br />
water areas. The channel will be dredged using Cutter-Suction Dredger<br />
(CSD), which excavates the channel by means of cutting and suction,<br />
pumping the excavated masses through a floating hose controlled by a<br />
support vessel. The excavated masses will be temporarily deposited outside<br />
the channel, starting from a distance of around 10 m. The process will be<br />
reversed when the channel is back-filled following the pipeline installation,<br />
restoring the seabed to its natural condition. In total the estimated time span<br />
from beginning of these operations to the end, weather permitting, is<br />
approximately 80 days: about 40 days are needed to remove the soil from<br />
the access channel and about 40 days are needed to backfill the same<br />
channel. In general, the CSD capacity is depending on type and size;<br />
according to the information provided by TAP, for <strong>Albania</strong>n landfall a capacity<br />
of 2,500 m 3 /hour (theoretical 60,000 m 3 per day) has been assumed. The<br />
access channel will be approximately 160 m wide, 2,000 m long and 5 m<br />
deep; so the total amount of dredged sediment will be approximately equal<br />
to 1,600,000 m 3 .<br />
Along this second stretch, which is the most relevant in terms of released<br />
quantity of dredged sediment, 4 release points have been considered, each<br />
representative of different zones and different steps of the operational<br />
activities. In particular, one point is located at the offshore end of the<br />
cofferdam (point n°1), one at the offshore end of the access channel (point<br />
n°4), and the two remaining points (point n°2 and point n°3) are located in<br />
the middle of the access channel. The mutual distance between the four<br />
points is constant. The geographical coordinates, the distances from the<br />
coastline and the water depths where these points are located are illustrated<br />
in Table 5-1. In addition, the location of the points is illustrated in the plots<br />
from Figure 5-3 to Figure 5-5. For each of these four points, due to the<br />
expected dredging methodology, two release sources are considered: one is<br />
located inside the channel, where the sediment is dredged, and one outside<br />
the channel, where the material is temporarily deposited.<br />
Table 5-1 Locationn of release points<br />
Release<br />
point<br />
Geographical coordinates<br />
[°]<br />
Depth<br />
[m]<br />
Distance<br />
from the<br />
coastline [m]<br />
1 LON 19.3734; LAT 40.7924 2.7 220<br />
2 LON 19.3655; LAT 40.7921 5.0 880<br />
3 LON 19.3577; LAT 40.7916 6.7 1,540<br />
4 LON 19.3500; LAT 40.7911 8.0 2,200<br />
5 LON 19.3280; LAT 40.7897 11.8 4,000<br />
22700172-01-00101.docx 61 DHI Italia
Trans Adriatic Pipeline – TAP, <strong>ESIA</strong> <strong>Albania</strong>, <strong>Annex</strong> 9 - <strong>Sediment</strong> <strong>Dispersion</strong> <strong>Modelling</strong><br />
AAL00-ERM-641-Y-TAE-1010, Rev.: 01 / at05, Page 66 of 278<br />
Following the expected time schedule for the dredging operations, each<br />
release point has been considered representative of 10 days of work: during<br />
these 10 days, a continuous release is assumed. The simulation time is<br />
longer (15 days) because there is a time lag between the end of the release<br />
and the complete dispersion of the suspended sediment introduced in the<br />
water column.<br />
<br />
The third stretch is approximately 4,000 m long, between the offshore end of<br />
the access channel, where the water depth is 8 m, to a distance from the<br />
coastline of around 6,000 m, where the water depth is approximately 30 m.<br />
Along this stretch the pipeline is placed at the bottom of a dredged trench.<br />
Release point n°5 is located halfway along the trench; the geographical<br />
coordinates, the distance from the coastline and the water depth of this point<br />
are illustrated in Table 5-1. In this case, as agreed with TAP, only one release<br />
source, inside the trench, has been assumed.<br />
Along this trench the volume of dredged sediment is significantly lower than<br />
in the access channel. On the basis of the expected time schedule of the<br />
operations, it has been agreed with TAP that point n°5 is representative of<br />
only one day of continuous release.<br />
To study this stretch some assumptions have been made because of the<br />
uncertainty of operational techniques that will be applied. In particular, it is<br />
here assumed that the dredging of the offshore stretch will be operated<br />
through CSD. The use of post-trenching instead of CSD would produce less<br />
sediment. Hence, the assumption is conservative.<br />
5.1.2 Dredging rate, release rate, settling velocity<br />
During dredging operations, both sand fraction and fine fraction are released in<br />
the water column. The sand fraction is assumed to settle nearby the release<br />
point and therefore its environmental impact is generally negligible. Following<br />
the above assumption, the numerical model only aims at simulating the<br />
dispersion and fate of the fine fraction of the sediment, which can have a<br />
significant environmental impact since it can remain in suspension for a long<br />
time and migrate to sensitive areas.<br />
Under the above assumption, the calculation of the sediment volume that will be<br />
modelled only refers to the fine fraction of the material. In order to quantify this<br />
fraction for each of the 5 release points, the grain curves provided by TAP<br />
referring to the collected samples by FUGRO OCEANSISMICA S.p.A. have been<br />
used. In particular, the particle size analysis of the samples which are located<br />
closer to each release point has been considered. Referring to the “Trans Adriatic<br />
Pipeline (TAP) – Environmental Survey <strong>Albania</strong>n Landfall – Final Report” provided<br />
by TAP, for the 5 release points the samples illustrated in Table 5-2 have been<br />
considered.<br />
Table 5-2<br />
Samples used for the sediment dispersion study<br />
Release point<br />
number<br />
Sample<br />
Sample coordinates<br />
[°]<br />
Percentage of fine<br />
sediment [%]<br />
1 ADD2 LON 19.37261; LAT 40.7938 13.2<br />
2 E4 LON 19.3655; LAT 40.7921 8.8<br />
3 and 4 F4 LON 19.3527; LAT 40.7911 21.2<br />
5 H4 LON 19.3291; LAT 40.7895 96.2<br />
22700172-01-00101.docx 62 DHI Italia
Trans Adriatic Pipeline – TAP, <strong>ESIA</strong> <strong>Albania</strong>, <strong>Annex</strong> 9 - <strong>Sediment</strong> <strong>Dispersion</strong> <strong>Modelling</strong><br />
AAL00-ERM-641-Y-TAE-1010, Rev.: 01 / at05, Page 67 of 278<br />
Figure 5-1 illustrates the grain curves associated to the above four sediment<br />
samples.<br />
Figure 5-1 Grain curves of the samples listed in Table 5-2<br />
The grain diameter threshold between sand fraction and fine fraction has been<br />
assumed equal to 63 μm, according to the Wentworth scale, a standard<br />
classification for clastic sediment and rock (Figure 5-2). The threshold is the limit<br />
between very fine sand and coarse silt.<br />
22700172-01-00101.docx 63 DHI Italia
Trans Adriatic Pipeline – TAP, <strong>ESIA</strong> <strong>Albania</strong>, <strong>Annex</strong> 9 - <strong>Sediment</strong> <strong>Dispersion</strong> <strong>Modelling</strong><br />
AAL00-ERM-641-Y-TAE-1010, Rev.: 01 / at05, Page 68 of 278<br />
Figure 5-2 Wentworth scale for clastic sediment and rock standard classification<br />
On the basis of the expected dredging rate (2,500 m 3 /hour) and the calculated<br />
ratio between fine fraction and sand fraction, it has been possible to quantify the<br />
dredging rate of the fine part of the sediment for each of the 5 points. Based on<br />
the large DHI experience within dredging studies, a density of 1,900 Kg/m 3 is<br />
assumed to be reasonable for the fine fraction of sediments. Table 5-3 illustrates<br />
the dredging rates for the 5 points.<br />
Table 5-3<br />
Dredging rates in each release point<br />
Release point<br />
number<br />
Dredging rate<br />
[m 3 /h]<br />
Dredging rate<br />
fine fraction<br />
[m 3 /h]<br />
Dredging rate<br />
fine fraction<br />
[kg/s]<br />
1 2,500 330 174<br />
2 2,500 220 116<br />
3 2,500 530 280<br />
4 2,500 530 280<br />
5 2,500 2,405 1,269<br />
The high dredging rate for point n°5 (offshore) is due to the high ratio between<br />
fine fraction and sand fraction. The release from this point is, however, less<br />
critical because the duration of the release is only 1/10 compared to the other<br />
points and because the release source is one instead of two (see assumptions in<br />
Section 5.1.1).<br />
The amount of sediment actually released in the water column during dredging<br />
operations is only a fraction of the dredged sediment: the rate of release per unit<br />
22700172-01-00101.docx 64 DHI Italia
Trans Adriatic Pipeline – TAP, <strong>ESIA</strong> <strong>Albania</strong>, <strong>Annex</strong> 9 - <strong>Sediment</strong> <strong>Dispersion</strong> <strong>Modelling</strong><br />
AAL00-ERM-641-Y-TAE-1010, Rev.: 01 / at05, Page 69 of 278<br />
of dredged material is an "average" loss quantity that can take into account<br />
differences between dredging methods and enables comparison between<br />
methods of total mass lost into the surrounding water. Blokland (1988) describes<br />
a systematic method for determining the quantity of sediment released into the<br />
immediate vicinity of the dredger, in kg/m 3 dredged. This is the socalled "Sfactor".<br />
It is based on in situ measurements of suspended sediment<br />
concentrations, rather than measured release rates from the dredger and so<br />
takes into account any dynamic plume effects. In this case the S-factor has been<br />
useful to estimate the magnitude of sediment losses because of the lack of sitespecific<br />
information of the rate of release per unit of dredged material.<br />
Kirby and Land (1991) made further use of the S-factor, and provided<br />
indications on losses of fine sediment resulting from the different types of<br />
dredging operations in muddy sediment.<br />
On the basis of the above references and on large DHI experience within<br />
dredging studies, a release rate of 1% of the dredging rate is assumed to be<br />
associated to the CSD dredger.<br />
Another important assumption when modelling sediment dispersion is the<br />
estimation of settling velocity. In this case, for each release point,<br />
independently on the grain diameter variations from point to point, a settling<br />
velocity of 0.05 cm/s has been considered. This estimation is based both on<br />
DHI’s experience and on many references [8 ÷ 12] regarding the definition of<br />
settling velocity, which has been estimated to lie between 0.023 and 0.054 cm/s<br />
for suspended material characterized by diameters smaller than 50 μm.<br />
5.1.3 Model bathymetries<br />
As anticipated in Chapter 4, both the hydrodynamic and the mud transport<br />
model have been setup considering different bathymetric conditions in relation to<br />
the progress of the dredging operations. A tentative sequence of operations for<br />
the dredging activities, agreed with TAP, is illustrated below:<br />
1. Placement of cofferdam: the cofferdam is a simple sheet piling construction<br />
that extends from the shoreline out to approximately 200 m from the<br />
shoreline. The purpose of the structure is to prevent natural backfilling and<br />
retain the depth of the dredged channel until the pipeline can be laid during<br />
pipe installation;<br />
2. Dredging of the access channel, from offshore to near shore. The access<br />
channel is needed in order to allow the CSD (Cutter Suction Dredger) to<br />
operate in the stretch now characterized by shallow water depths<br />
(approximately 2,000 m from the end of the cofferdam to offshore). The<br />
expected width of the channel is 160 m, its average depth is 5 m and the<br />
total volume dredged is in the order of 1.6 million m 3 ;<br />
3. Dredging of the trench which will host the pipeline; the trench will be<br />
dredged from the offshore end of the access channel up to the depth of 25 m<br />
offshore (approximately length of the trench; 4 km);<br />
4. Backfilling of the access channel, from onshore to offshore.<br />
Due to the relevant variations in the bathymetry at different steps of the above<br />
sequence of operations, four different bathymetries, representing four different<br />
seabed conditions, have been built:<br />
22700172-01-00101.docx 65 DHI Italia
Trans Adriatic Pipeline – TAP, <strong>ESIA</strong> <strong>Albania</strong>, <strong>Annex</strong> 9 - <strong>Sediment</strong> <strong>Dispersion</strong> <strong>Modelling</strong><br />
AAL00-ERM-641-Y-TAE-1010, Rev.: 01 / at05, Page 70 of 278<br />
<br />
<br />
<br />
<br />
bathymetry n°1 (Figure 5-3): the bathymetry is the existing bathymetry,<br />
without the presence of the access channel, but with the cofferdam already in<br />
place. This bathymetry is used to simulate the sediment dispersion for<br />
release point n°4. This bathymetric representation is used for meteomarine<br />
scenarios 1 and 2;<br />
bathymetry n°2 (Figure 5-4): the offshore half of the access channel is<br />
dredged, the is cofferdam in place. This bathymetry is used to simulate the<br />
sediment dispersion for release points n°2 and n°3. This bathymetric<br />
representation is used for meteomarine scenarios 1 and 2;<br />
bathymetry n°3 (Figure 5-5): the whole access channel is dredged, the<br />
cofferdam is in place. This bathymetry is used to simulate the sediment<br />
dispersion for release points n°1 and n°5. This bathymetric representation is<br />
used for meteomarine scenarios 1 and 2;<br />
bathymetry n°4 (Figure 5-6): the cofferdam is in place, the whole access<br />
channel is dredged and the temporary deposit of dredged sediment is in<br />
place nearby the channel. This bathymetric representation is used for<br />
meteomarine scenario 3. Due to the high level of uncertainties in assuming a<br />
reliable shape and location of this deposit, the following assumptions, agreed<br />
with TAP, are considered:<br />
o the deposit will be placed very close to the dredged channel<br />
(starting at a distance of 10 m);<br />
o the top of the sediment deposit reaches at any location half of the<br />
actual water depth;<br />
o as a consequence of the above assumption, the width of the base of<br />
the sediment deposit is variable along the channel; the width is<br />
therefore larger where the actual water depth is smaller. If we<br />
assume this, a sketch for 3 different water depths is illustrated in<br />
Figure 5-7: at the offshore end of the access channel, where the<br />
actual water depth is around 8 m, the width of the deposit is<br />
assumed to be around 200 m, while at the near shore end, next to<br />
the cofferdam, where the actual water depth is around 3 m, the<br />
width of the deposit is assumed to be around 530 m.<br />
As agreed with TAP, due to the high level of uncertainty in assuming a shape and<br />
location of the temporary deposit, its presence has only been taken into account<br />
in the simulation of scenario 3, in which the deposit itself is the source of<br />
sediment resuspension and dispersion.<br />
22700172-01-00101.docx 66 DHI Italia
Trans Adriatic Pipeline – TAP, <strong>ESIA</strong> <strong>Albania</strong>, <strong>Annex</strong> 9 - <strong>Sediment</strong> <strong>Dispersion</strong> <strong>Modelling</strong><br />
AAL00-ERM-641-Y-TAE-1010, Rev.: 01 / at05, Page 71 of 278<br />
Longitude [°]<br />
Figure 5-3 Detail of bathymetry n°1 (cofferdam in place, no access channel), used to<br />
study representative meteomarine scenarios 1 and 2, and location of release<br />
point n°4<br />
Latitude [°]<br />
Latitude [°]<br />
Longitude [°]<br />
Figure 5-4 Detail of bathymetry n°2 (cofferdam in place, offshore part half dredged<br />
within access channel), used to study representative meteomarine scenarios<br />
1 and 2, and location of release points n°2 and n°3<br />
22700172-01-00101.docx 67 DHI Italia
Trans Adriatic Pipeline – TAP, <strong>ESIA</strong> <strong>Albania</strong>, <strong>Annex</strong> 9 - <strong>Sediment</strong> <strong>Dispersion</strong> <strong>Modelling</strong><br />
AAL00-ERM-641-Y-TAE-1010, Rev.: 01 / at05, Page 72 of 278<br />
Longitude [°]<br />
Figure 5-5 Detail of bathymetry n°3 (cofferdam in place, whole access channel<br />
dredged), used to study representative meteomarine scenarios 1 and 2, and<br />
location of release points n°1 and n°5<br />
Latitude [°]<br />
Latitude [°]<br />
Longitude [°]<br />
Figure 5-6 Detail of bathymetry n°4 (cofferdam in place, whole access channel dredged<br />
and dredged material deposited nearby), used to study representative<br />
meteomarine scenario 3<br />
22700172-01-00101.docx 68 DHI Italia
Trans Adriatic Pipeline – TAP, <strong>ESIA</strong> <strong>Albania</strong>, <strong>Annex</strong> 9 - <strong>Sediment</strong> <strong>Dispersion</strong> <strong>Modelling</strong><br />
AAL00-ERM-641-Y-TAE-1010, Rev.: 01 / at05, Page 73 of 278<br />
Figure 5-7 Representation of sea bed after the operations of dredging and deposition<br />
5.2 Assumptions on background suspended sediment concentration<br />
The <strong>Albania</strong>n landfall of the Trans Adriatic Pipeline is located very close to two<br />
important river mouths: Seman rivers to the north and Vjosa river to the south.<br />
Considering the relevance of these two rivers and their basins, it has to be<br />
noticed, although without available data, that there is a high probability that the<br />
background suspended sediment concentration of the water column in the area,<br />
which has been assumed equal to zero in the simulations, is naturally high.<br />
5.3 Scenario 1: results<br />
The dispersion and fate of the suspended sediment plume depend essentially on<br />
the hydrodynamic conditions, once fixed the release location and the release<br />
rate.<br />
During the autumn/winter months, considering release point n°1 (Figure 5-8),<br />
the maximum SSC, averaged in the first 20 m of the water column can be found<br />
in the cofferdam area, with concentrations that locally, due to the limited water<br />
depth, can reach 2.5 kg/m 3 .<br />
Out of the cofferdam area, the SSC rapidly decreases. Significant concentrations<br />
(higher than 0.1 kg/m 3 ) can still be found between the cofferdam and the Seman<br />
river mouth (approximately 3 km north of the <strong>Albania</strong>n landfall site).<br />
The highest concentration of suspended sediment can be found along the coast,<br />
distributed over a distance from the shore not higher than 800 ÷ 1,000 m.<br />
Based on the DHI experience within measurements of suspended sediment<br />
concentration, 0.002 kg/m 3 can be considered the threshold value below which<br />
the measured concentration cannot be considered reliable.<br />
22700172-01-00101.docx 69 DHI Italia
Trans Adriatic Pipeline – TAP, <strong>ESIA</strong> <strong>Albania</strong>, <strong>Annex</strong> 9 - <strong>Sediment</strong> <strong>Dispersion</strong> <strong>Modelling</strong><br />
AAL00-ERM-641-Y-TAE-1010, Rev.: 01 / at05, Page 74 of 278<br />
Latitude [°]<br />
Longitude [°]<br />
Figure 5-8 Maximum Suspended <strong>Sediment</strong> Concentration, averaged in the first 20 m of<br />
the water column during autumn/winter months for release point n°1 (LON<br />
19.3734°, LAT 40.7924°)<br />
Considering release point n°2 (Figure 5-9), the maximum SSC, averaged in the<br />
first 20 m of the water column, is located between the release point and the<br />
coastline, with concentrations in the order of 0.20 ÷ 0.30 kg/m 3 .<br />
Similarly to what happens during the release from point n°1, the highest<br />
concentration of suspended sediment can be found along the coast, mainly south<br />
of the area of the cofferdam for 2.5 ÷ 3.0 km.<br />
22700172-01-00101.docx 70 DHI Italia
Trans Adriatic Pipeline – TAP, <strong>ESIA</strong> <strong>Albania</strong>, <strong>Annex</strong> 9 - <strong>Sediment</strong> <strong>Dispersion</strong> <strong>Modelling</strong><br />
AAL00-ERM-641-Y-TAE-1010, Rev.: 01 / at05, Page 75 of 278<br />
Latitude [°]<br />
Longitude [°]<br />
Figure 5-9 Maximum Suspended <strong>Sediment</strong> Concentration, averaged in the first 20 m of<br />
the water column, during autumn/winter months for release point n°2 (LON<br />
19.3655°, LAT 40.7921°)<br />
Considering release point n°3 (Figure 5-10), the maximum SSC, averaged in the<br />
first 20 m of the water column, is located in correspondence to the release<br />
sources, with values up to 0.65 kg/m 3 .<br />
In this case, the maximum concentrations of the plume develop mainly<br />
southward for 4.0 ÷ 4.5 km and towards the coastline: in this zone SSC is on<br />
average around 0.15 ÷ 0.20 kg/m 3 . It has to be noticed that the map<br />
corresponding to maximum concentration is time independent; therefore it is not<br />
straightforward to identify a strict correlation between the instantaneous<br />
direction of the current and the development of the plume.<br />
22700172-01-00101.docx 71 DHI Italia
Trans Adriatic Pipeline – TAP, <strong>ESIA</strong> <strong>Albania</strong>, <strong>Annex</strong> 9 - <strong>Sediment</strong> <strong>Dispersion</strong> <strong>Modelling</strong><br />
AAL00-ERM-641-Y-TAE-1010, Rev.: 01 / at05, Page 76 of 278<br />
Latitude [°]<br />
Longitude [°]<br />
Figure 5-10 Maximum Suspended <strong>Sediment</strong> Concentration, averaged in the first 20 m of<br />
the water column, during autumn/winter months for release point n°3 (LON<br />
19.3577°, LAT 40.7916°)<br />
The shape of the plume associated to maximum concentration generated by<br />
release point n°4 (Figure 5-11) is similar to the one described for point n°3, both<br />
maximum concentration and extension.<br />
22700172-01-00101.docx 72 DHI Italia
Trans Adriatic Pipeline – TAP, <strong>ESIA</strong> <strong>Albania</strong>, <strong>Annex</strong> 9 - <strong>Sediment</strong> <strong>Dispersion</strong> <strong>Modelling</strong><br />
AAL00-ERM-641-Y-TAE-1010, Rev.: 01 / at05, Page 77 of 278<br />
Latitude [°]<br />
Longitude [°]<br />
Figure 5-11 Maximum Suspended <strong>Sediment</strong> Concentration, averaged in the first 20 m of<br />
the water column, during autumn/winter months for release point n°4 (LON<br />
19.3500°, LAT 40.7911°)<br />
In point n°5 the sediment is released only for one day; for this reason the<br />
maximum values of SSC are significantly lower than in the other points. In<br />
particular the maximum SSC, averaged in the first 20 m of the water column, is<br />
located in correspondence to the release source, with local values around 0.32<br />
kg/m 3 (Figure 5-12). The concentration quickly drops down to 0.10 kg/ m 3 after<br />
few hundred meters north and south of the release point.<br />
22700172-01-00101.docx 73 DHI Italia
Trans Adriatic Pipeline – TAP, <strong>ESIA</strong> <strong>Albania</strong>, <strong>Annex</strong> 9 - <strong>Sediment</strong> <strong>Dispersion</strong> <strong>Modelling</strong><br />
AAL00-ERM-641-Y-TAE-1010, Rev.: 01 / at05, Page 78 of 278<br />
Latitude [°]<br />
Longitude [°]<br />
Figure 5-12 Maximum Suspended <strong>Sediment</strong> Concentration, averaged in the first 20 m of<br />
the water column, during autumn/winter months for release point n°5 (LON<br />
19.3280°, LAT 40.7897°)<br />
5.4 Scenario 2: results<br />
During the spring/summer months, considering release point n°1 (Figure 5-13),<br />
the maximum SSC, averaged in the first 20 m of the water column, can be found<br />
in the area of the cofferdam with concentrations that locally, due to the limited<br />
water depth, can reach 2.8 kg/m 3 .<br />
Out of the area of the cofferdam, the concentration of suspended sediment is<br />
still higher than 0.1 kg/ m 3 for the first 1,000 m west of the cofferdam, 800 m<br />
south and 200m north.<br />
22700172-01-00101.docx 74 DHI Italia
Trans Adriatic Pipeline – TAP, <strong>ESIA</strong> <strong>Albania</strong>, <strong>Annex</strong> 9 - <strong>Sediment</strong> <strong>Dispersion</strong> <strong>Modelling</strong><br />
AAL00-ERM-641-Y-TAE-1010, Rev.: 01 / at05, Page 79 of 278<br />
Latitude [°]<br />
Longitude [°]<br />
Figure 5-13 Maximum Suspended <strong>Sediment</strong> Concentration, averaged in the first 20 m of<br />
the water column, during spring/summer months for release point n°1 (LON<br />
19.3734°, LAT 40.7924°)<br />
The shape of the maximum concentration plume generated by release in point<br />
n°2 looks very similar to the one obtained for point n°1.<br />
In this case (Figure 5-14), the maximum SSC, averaged in the first 20 m of the<br />
water column, is located in correspondence to the release sources with values<br />
around 1.00 kg/m 3 . Relevant concentrations, with values around 0.60 kg/m 3 ,<br />
can be found between the release points and the coast. Inside the area of the<br />
cofferdam the SSC is around 0.35 kg/m 3 .<br />
22700172-01-00101.docx 75 DHI Italia
Trans Adriatic Pipeline – TAP, <strong>ESIA</strong> <strong>Albania</strong>, <strong>Annex</strong> 9 - <strong>Sediment</strong> <strong>Dispersion</strong> <strong>Modelling</strong><br />
AAL00-ERM-641-Y-TAE-1010, Rev.: 01 / at05, Page 80 of 278<br />
Latitude [°]<br />
Longitude [°]<br />
Figure 5-14 Maximum Suspended <strong>Sediment</strong> Concentration, averaged in the first 20 m of<br />
the water column, during spring/summer months for release point 2 (LON<br />
19.3655°, LAT 40.7921°)<br />
Considering release point n°3 (Figure 5-15), the maximum SSC, averaged in the<br />
first 20 m of the water column, is located in correspondence to the release<br />
sources with values of about 1.1 kg/m 3 .<br />
Significant concentration, higher than 0.1 kg/m 3 can be found around the release<br />
point in a circular area characterized by a radius of approximately 2 km.<br />
22700172-01-00101.docx 76 DHI Italia
Trans Adriatic Pipeline – TAP, <strong>ESIA</strong> <strong>Albania</strong>, <strong>Annex</strong> 9 - <strong>Sediment</strong> <strong>Dispersion</strong> <strong>Modelling</strong><br />
AAL00-ERM-641-Y-TAE-1010, Rev.: 01 / at05, Page 81 of 278<br />
Latitude [°]<br />
Longitude [°]<br />
Figure 5-15 Maximum Suspended <strong>Sediment</strong> Concentration, averaged in the first 20 m of<br />
the water column, during spring/summer months for release point n°3 (LON<br />
19.3577°, LAT 40.7916°)<br />
The shape of the maximum suspended sediment concentration plume generated<br />
by the sediment release in point n°4 looks similar to the one obtained for point<br />
n°3 but it is more elongated in the direction perpendicular to the coast (Figure<br />
5-16).<br />
22700172-01-00101.docx 77 DHI Italia
Trans Adriatic Pipeline – TAP, <strong>ESIA</strong> <strong>Albania</strong>, <strong>Annex</strong> 9 - <strong>Sediment</strong> <strong>Dispersion</strong> <strong>Modelling</strong><br />
AAL00-ERM-641-Y-TAE-1010, Rev.: 01 / at05, Page 82 of 278<br />
Latitude [°]<br />
Longitude [°]<br />
Figure 5-16 Maximum Suspended <strong>Sediment</strong> Concentration, averaged in the first 20 m of<br />
the water column during spring/summer months for release point n°4 (LON<br />
19.3500°, LAT 40.7911°)<br />
The plume of the maximum suspended sediment concentration generated by<br />
release point n°5 is very limited both in extension and magnitude (Figure 5-17)<br />
due to the reduced duration of the release (only one day). In this case the<br />
maximum SSC, averaged in the first 20 m of the water column, is located in<br />
correspondence to the release source with values of about 0.18 kg/m 3 .<br />
The concentration quickly drops to 0.10 kg/ m 3 after few hundred meters south<br />
of the release point.<br />
22700172-01-00101.docx 78 DHI Italia
Trans Adriatic Pipeline – TAP, <strong>ESIA</strong> <strong>Albania</strong>, <strong>Annex</strong> 9 - <strong>Sediment</strong> <strong>Dispersion</strong> <strong>Modelling</strong><br />
AAL00-ERM-641-Y-TAE-1010, Rev.: 01 / at05, Page 83 of 278<br />
Latitude [°]<br />
Longitude [°]<br />
Figure 5-17 Maximum Suspended <strong>Sediment</strong> Concentration, averaged in the first 20 m of<br />
the water column during spring/summer months for release point n°5 (LON<br />
19.3280°, LAT 40.7897°)<br />
5.5 Scenario 3: results<br />
This scenario is used to simulate the resuspension of sediment due to a storm<br />
event which determines both significant wave generated long shore currents<br />
(Section 4.4) and strong bed shear stresses due to the direct action of wave<br />
breaking.<br />
Since the dredging operations will be suspended during storm conditions, this<br />
scenario is relevant in terms of resuspension of the amount of dredged sediment<br />
which will be temporarily deposited close to the dredged channel during the<br />
operations. The assumption for scenario 3 is that dredging operations will occur<br />
in the spring/summer period, which is characterized by a lower frequency and<br />
magnitude of storms (same meteomarine conditions assumed for scenario 2).<br />
In the map (Figure 5-18) illustrating the maximum SSC over the 15-day period<br />
(the duration of the storm is only 48 h but the suspended sediment dispersion in<br />
the model domain of course continues) it is possible to observe that the plume is<br />
distributed southward of the deposit. The maximum values of concentration is<br />
around 0.12 kg/m 3 in the area closer to the temporary sediment deposit and<br />
close to the coastline, while it is less relevant proceeding offshore.<br />
22700172-01-00101.docx 79 DHI Italia
Trans Adriatic Pipeline – TAP, <strong>ESIA</strong> <strong>Albania</strong>, <strong>Annex</strong> 9 - <strong>Sediment</strong> <strong>Dispersion</strong> <strong>Modelling</strong><br />
AAL00-ERM-641-Y-TAE-1010, Rev.: 01 / at05, Page 84 of 278<br />
In terms of evolution in time of the plume (plots in Appendix E), the maximum<br />
concentration corresponds to the peak of the storm. After the peak, the SSC<br />
decreases and it becomes equal to zero already at the end of the storm in the<br />
proximity of the temporary deposit.<br />
The approach followed for scenario 3 aims at supporting the environmental<br />
impact analysis of the dredging operations. It has to be noticed that it is<br />
recommended to investigate in detail both the stability of the temporary deposit<br />
of sediment and the risk of natural backfilling of the access channel during the<br />
storm.<br />
Latitude [°]<br />
Longitude [°]<br />
Figure 5-18 Maximum Suspended <strong>Sediment</strong> Concentration, averaged in the first 20 m of<br />
the water column, for hydrodynamic scenario 3<br />
5.6 Settling of fine sediment in the model domain<br />
Following a specific request from TAP, the settling of fine sediment in the<br />
model domain has been investigated. In the autumn/winter scenario, the<br />
combination of very small settling velocity and relatively high current speed<br />
prevents the fine suspended sediment to settle within the model domain in the<br />
time window of the simulation: in particular, almost 100% of the fine sediment<br />
in the water column goes out of the model domain after only 3 days from the<br />
22700172-01-00101.docx 80 DHI Italia
Trans Adriatic Pipeline – TAP, <strong>ESIA</strong> <strong>Albania</strong>, <strong>Annex</strong> 9 - <strong>Sediment</strong> <strong>Dispersion</strong> <strong>Modelling</strong><br />
AAL00-ERM-641-Y-TAE-1010, Rev.: 01 / at05, Page 85 of 278<br />
time of release (over a wide front and very low concentration). The amount of<br />
fine sediment which settles in the model domain is not relevant.<br />
In the spring/summer scenario the average current speed is lower so only 90%<br />
of the fine suspended sediment goes out of the domain after 15 days from the<br />
time of release (again over a wide front and very low concentration). The<br />
remaining 10%, however, still remains suspended in the water column and in<br />
this case, as for scenario 1, the amount of fine sediment which settles in the<br />
model domain is not relevant.<br />
5.7 Settling of sand in the model domain<br />
As illustrated in Chapter 5.1, the numerical modelling of the sediment dispersion<br />
only refers to the fine fraction of the material. This choice derives from the<br />
assumption that the sand fraction will settle nearby the release points, therefore<br />
being not relevant from an environmental impact perspective.<br />
Following a specific request from TAP, a rough estimation of the amount of sand<br />
fraction which will settle around the release point has been investigated.<br />
The amount of dredged material in terms of sand fraction is calculated as the<br />
difference of the already used dredging rates (total and fine fraction) illustrated<br />
in Table 5-3. Through simple desktop calculations involving settling velocity and<br />
current velocity, most of the released material (sand fraction) will settle in the<br />
first 100 m from each release point.<br />
The average volume of deposited sand is quite similar in the points along the<br />
access channel (points n°1, n°2, n°3, n°4) while it is much smaller in point n°5.<br />
A rough estimation for points n°1, n°2, n°3, n°4 brings approximately 7,500<br />
g/m 2 of settled sand within the 100 m radius area, while for point n°5 the settled<br />
sand is around 350 g/m 2 .<br />
22700172-01-00101.docx 81 DHI Italia
Trans Adriatic Pipeline – TAP, <strong>ESIA</strong> <strong>Albania</strong>, <strong>Annex</strong> 9 - <strong>Sediment</strong> <strong>Dispersion</strong> <strong>Modelling</strong><br />
AAL00-ERM-641-Y-TAE-1010, Rev.: 01 / at05, Page 86 of 278<br />
6 CONCLUSIONS<br />
This numerical modelling study aims at supporting the Environmental and Social<br />
Impact Assessment (<strong>ESIA</strong>) for the offshore part of the <strong>Albania</strong>n landfall of the<br />
TAP. The pipeline is planned to go from Italy (Puglia) to <strong>Albania</strong>, covering a<br />
distance of more than 100 km.<br />
In particular, the modeling study is focused on simulating the dispersion and fate<br />
of suspended sediment occurring during dredging operations. During dredging,<br />
both sand fraction and fine fraction are released in the water column. The sand<br />
fraction is assumed to settle nearby the release point and therefore its<br />
environmental impact is generally negligible. Following the above assumption,<br />
the numerical model only aimed at simulating the dispersion and fate of the fine<br />
fraction of the sediment, which can have a significant environmental impact<br />
since it can remain in suspension for a long time and migrate to sensitive areas.<br />
The meteomarine conditions which have been assumed as representative of<br />
typical conditions at the <strong>Albania</strong>n landfall of the TAP derive from an accurate<br />
processing of collected data of winds, waves, both yearly and seasonal, tidal<br />
variations and circulation in the southern Adriatic Sea; three meteomarine<br />
scenarios have been finally selected as representative of typical conditions at the<br />
<strong>Albania</strong>n landfall of the TAP:<br />
<br />
<br />
<br />
scenario 1: representative meteomarine conditions during autumn/winter<br />
season as wind, tide, currents from the general circulation of the Adriatic<br />
Sea, temperature and salinity profile;<br />
scenario 2: representative meteomarine conditions during spring/summer<br />
season as wind, tide, currents from the general circulation of the Adriatic<br />
Sea, temperature and salinity profile;<br />
scenario 3: representative meteomarine conditions for a spring/summer<br />
storm wave event<br />
In autumn/winter conditions (scenario 1), the currents from the general<br />
circulation of the Adriatic Sea, which is the main hydrodynamic forcing at the<br />
<strong>Albania</strong>n landfall of the TAP, are frequently directed from south to north and the<br />
vertical stratification of temperature and salinity is limited. This leads to quite<br />
uniform magnitude of currents along the water column. In spring/summer<br />
conditions (scenario 2) the currents from the general circulation of the Adriatic<br />
Sea are frequently directed from north to south but, due to a significant thermal<br />
stratification of the water column, significant differences in the hydrodynamic<br />
field can be noticed along the water column.<br />
Another important forcing that plays an important role in the generation of the<br />
current field is the wind, but its influence is only relevant at surface.<br />
For scenario 3, a relatively severe wave event characterized by a duration of 48<br />
hours has been considered. This scenario therefore includes the effect of wave<br />
breaking and wave generated currents. The presence of the temporary amount<br />
of sediment nearby the dredged channel locally determines shallow water<br />
conditions, above which wave breaking can dissipate a great part of the energy<br />
associated to the incident wave. The model results show higher values of current<br />
speed where the temporary deposit will be placed (shallow water, more severe<br />
wave breaking). On the contrary, inside the channel, due to the local deepening of<br />
the seabed, the current speed decreases.<br />
22700172-01-00101.docx 82 DHI Italia
Trans Adriatic Pipeline – TAP, <strong>ESIA</strong> <strong>Albania</strong>, <strong>Annex</strong> 9 - <strong>Sediment</strong> <strong>Dispersion</strong> <strong>Modelling</strong><br />
AAL00-ERM-641-Y-TAE-1010, Rev.: 01 / at05, Page 87 of 278<br />
Both the hydrodynamic and the mud transport model have been setup considering<br />
different bathymetric conditions in relation to the progress of the dredging<br />
operations. The sediment dispersion model is fully integrated with the<br />
hydrodynamic model. Each simulation of the sediment model is characterized by a<br />
duration of 15 days, during which the plume of suspended sediment released<br />
during dredging operations or during a storm changes in extension, shape and<br />
concentration according to hydrodynamics (advection) and dispersion conditions.<br />
The sediment dispersion model has been implemented for five release locations<br />
along the pipeline route, each one characterized by a specific sediment release in<br />
the water column, depending on the dredging rate, on the dredging method<br />
(Cutter Suction Dredger) and on the local percentage of the fine fraction.<br />
The results of the sediment dispersion model showed a high variability of the<br />
distribution of the suspended sediment concentration depending on the season<br />
and on the release point. In general, the stronger currents during autumn/winter<br />
conditions determine a shape of the sediment plume which is almost parallel to<br />
the coast, while during the spring/summer season the currents are weaker and<br />
the plume is more uniformly distributed around the release location. In both<br />
cases the concentration of suspended sediment is higher than 0.5 kg/m 3 in the<br />
proximity of the release point, while a concentration higher than 0.2 kg/m 3 can<br />
be found up to 2÷3 km from the release points. Offshore of the access channel,<br />
the volume of the dredged sediment is significantly lower, leading to very low<br />
concentration of suspended sediment released from the location which is<br />
representative of this stretch.<br />
In the third scenario, the release of sediment is not due to dredging operations<br />
but it is generated by the effect of wave breaking in shallow water. The results of<br />
the third scenario showed that the plume is distributed southward of the<br />
temporary deposit. The maximum values of concentration is around 0.12 kg/m 3<br />
in the area closer to the temporary sediment deposit and close to the coastline,<br />
while it is less relevant proceeding offshore.<br />
It has to be noticed that the <strong>Albania</strong>n landfall of the Trans Adriatic Pipeline is<br />
located very close to two important river mouths: Seman rivers to the north and<br />
Vjosa river to the south. Considering the relevance of these two rivers and their<br />
basins, although without available data, there is a high probability that the<br />
background suspended sediment concentration of the water column in the area,<br />
which has been assumed equal to zero in the simulations, is naturally high.<br />
22700172-01-00101.docx 83 DHI Italia
Trans Adriatic Pipeline – TAP, <strong>ESIA</strong> <strong>Albania</strong>, <strong>Annex</strong> 9 - <strong>Sediment</strong> <strong>Dispersion</strong> <strong>Modelling</strong><br />
AAL00-ERM-641-Y-TAE-1010, Rev.: 01 / at05, Page 88 of 278<br />
7 REFERENCES<br />
[1] Wind and Wave Mediterranean Atlas, Medatlas project led by a<br />
consortium of six companies located in France, Italy and Greece, 1999-<br />
2004.<br />
[2] Integrated Project Water and Global Change (WATCH), European Union<br />
Sixth Framework Programme (EU FP6), 2007-2011.<br />
[3] Mediterranean Forecasting System (MFS) database available within the<br />
framework of MyOcean EU Project.<br />
[4] Database CM-93, Norwegian C-MAP, release 2011.<br />
[5] Tool MIKE C-MAP, Danish Hydraulic Institute (DHI), release 2011.<br />
[6] MIKE 3 HD FM, Danish Hydraulic Institute (DHI), release 2011.<br />
[7] MIKE 3 MT FM, Danish Hydraulic Institute (DHI), release 2011.<br />
[8] Måling af insitu faldhastigheder af klappet havnesediment i Grådyb.<br />
GRAS A/S July 2004.<br />
[9] Edelvang, K A study of the significance of flocculation for the in situ<br />
settling velocities in a tidal channel. Advanced Limnology 47: 462-467.<br />
1996.<br />
[10] Edelvang, K The significance of particle aggregation in an estuarine<br />
environment. Case studies from the Lister Dyb tidal area. Geographica<br />
Hafnesia A5: 1-105, 1996.<br />
[11] Edelvang, K Tial variation in the settling diameters of suspended matter<br />
on a tidal mud flat. Helgoländer meeresuntersuchungen 51: 269-279,<br />
1997.<br />
[12] Edelvang, K Austen, I The temporal variation of flocs and fecal pellets in<br />
a tidal channel. Estuarine, Coastal and shelf science 44: 361-367, 1997.<br />
22700172-01-00101.docx 84 DHI Italia
Trans Adriatic Pipeline – TAP, <strong>ESIA</strong> <strong>Albania</strong>, <strong>Annex</strong> 9 - <strong>Sediment</strong> <strong>Dispersion</strong> <strong>Modelling</strong><br />
AAL00-ERM-641-Y-TAE-1010, Rev.: 01 / at05, Page 89 of 278<br />
A P P E N D I X A<br />
Yearly sea temperature<br />
22700172-01-00101.docx<br />
DHI Italia
Trans Adriatic Pipeline – TAP, <strong>ESIA</strong> <strong>Albania</strong>, <strong>Annex</strong> 9 - <strong>Sediment</strong> <strong>Dispersion</strong> <strong>Modelling</strong><br />
AAL00-ERM-641-Y-TAE-1010, Rev.: 01 / at05, Page 90 of 278<br />
Figure 1<br />
Sea temperature during 2006 at three different depths (0, -10, -20 m m.s.l.)<br />
offshore the <strong>Albania</strong>n landfall site. Source: the trends are processed by DHI on the<br />
basis of the oceanographic data downloaded from MyOcean website<br />
(http://www.myocean.org/) for the point of coordinates LON 19.25°, LAT 40.75°<br />
Figure 2<br />
Sea temperature during 2007 at three different depths (0, -10, -20 m m.s.l.)<br />
offshore the <strong>Albania</strong>n landfall site. Source: the trends are processed by DHI on the<br />
basis of the oceanographic data downloaded from MyOcean website<br />
(http://www.myocean.org/) for the point of coordinates LON 19.25°, LAT 40.75°<br />
22700172-01-00101.docx<br />
DHI Italia
Trans Adriatic Pipeline – TAP, <strong>ESIA</strong> <strong>Albania</strong>, <strong>Annex</strong> 9 - <strong>Sediment</strong> <strong>Dispersion</strong> <strong>Modelling</strong><br />
AAL00-ERM-641-Y-TAE-1010, Rev.: 01 / at05, Page 91 of 278<br />
Figure 3<br />
Sea temperature during 2008 at three different depths (0, -10, -20 m m.s.l.)<br />
offshore the <strong>Albania</strong>n landfall site. Source: the trends are processed by DHI on the<br />
basis of the oceanographic data downloaded from MyOcean website<br />
(http://www.myocean.org/) for the point of coordinates LON 19.25°, LAT 40.75°<br />
Figure 4<br />
Sea temperature during 2009 at three different depths (0, -10, -20 m m.s.l.)<br />
offshore the <strong>Albania</strong>n landfall site. Source: the trends are processed by DHI on the<br />
basis of the oceanographic data downloaded from MyOcean website<br />
(http://www.myocean.org/) for the point of coordinates LON 19.25°, LAT 40.75°<br />
22700172-01-00101.docx<br />
DHI Italia
Trans Adriatic Pipeline – TAP, <strong>ESIA</strong> <strong>Albania</strong>, <strong>Annex</strong> 9 - <strong>Sediment</strong> <strong>Dispersion</strong> <strong>Modelling</strong><br />
AAL00-ERM-641-Y-TAE-1010, Rev.: 01 / at05, Page 92 of 278<br />
Figure 5<br />
Sea temperature during 2010 at three different depths (0, -10, -20 m m.s.l.)<br />
offshore the <strong>Albania</strong>n landfall site. Source: the trends are processed by DHI on the<br />
basis of the oceanographic data downloaded from MyOcean website<br />
(http://www.myocean.org/) for the point of coordinates LON 19.25°, LAT 40.75°<br />
Figure 6<br />
Sea temperature during 2011 at three different depths (0, -10, -20 m m.s.l.)<br />
offshore the <strong>Albania</strong>n landfall site. Source: the trends are processed by DHI on the<br />
basis of the oceanographic data downloaded from MyOcean website<br />
(http://www.myocean.org/) for the point of coordinates LON 19.25°, LAT 40.75°<br />
22700172-01-00101.docx<br />
DHI Italia
Trans Adriatic Pipeline – TAP, <strong>ESIA</strong> <strong>Albania</strong>, <strong>Annex</strong> 9 - <strong>Sediment</strong> <strong>Dispersion</strong> <strong>Modelling</strong><br />
AAL00-ERM-641-Y-TAE-1010, Rev.: 01 / at05, Page 93 of 278<br />
A P P E N D I X B<br />
Yearly sea salinity<br />
22700172-01-00101.docx<br />
DHI Italia
Trans Adriatic Pipeline – TAP, <strong>ESIA</strong> <strong>Albania</strong>, <strong>Annex</strong> 9 - <strong>Sediment</strong> <strong>Dispersion</strong> <strong>Modelling</strong><br />
AAL00-ERM-641-Y-TAE-1010, Rev.: 01 / at05, Page 94 of 278<br />
Figure 7<br />
Sea salinity during 2006 at three different depths (0, -10, -20 m m.s.l.)<br />
offshore the <strong>Albania</strong>n landfall site. Source: the trends are processed by DHI<br />
on the basis of the oceanographic data downloaded from MyOcean website<br />
(http://www.myocean.org/) for the point of coordinates LON 19.25°, LAT<br />
40.75°<br />
Figure 8<br />
Sea salinity during 2007 at three different depths (0, -10, -20 m m.s.l.)<br />
offshore the <strong>Albania</strong>n landfall site. Source: the trends are processed by DHI<br />
on the basis of the oceanographic data downloaded from MyOcean website<br />
(http://www.myocean.org/) for the point of coordinates LON 19.25°, LAT<br />
40.75°<br />
22700172-01-00101.docx<br />
DHI Italia
Trans Adriatic Pipeline – TAP, <strong>ESIA</strong> <strong>Albania</strong>, <strong>Annex</strong> 9 - <strong>Sediment</strong> <strong>Dispersion</strong> <strong>Modelling</strong><br />
AAL00-ERM-641-Y-TAE-1010, Rev.: 01 / at05, Page 95 of 278<br />
Figure 9<br />
Sea salinity during 2008 at three different depths (0, -10, -20 m m.s.l.)<br />
offshore the <strong>Albania</strong>n landfall site. Source: the trends are processed by DHI<br />
on the basis of the oceanographic data downloaded from MyOcean website<br />
(http://www.myocean.org/) for the point of coordinates LON 19.25°, LAT<br />
40.75°<br />
Figure 10<br />
Sea salinity during 2009 at three different depths (0, -10, -20 m m.s.l.)<br />
offshore the <strong>Albania</strong>n landfall site. Source: the trends are processed by DHI<br />
on the basis of the oceanographic data downloaded from MyOcean website<br />
(http://www.myocean.org/) for the point of coordinates LON 19.25°, LAT<br />
40.75°<br />
22700172-01-00101.docx<br />
DHI Italia
Trans Adriatic Pipeline – TAP, <strong>ESIA</strong> <strong>Albania</strong>, <strong>Annex</strong> 9 - <strong>Sediment</strong> <strong>Dispersion</strong> <strong>Modelling</strong><br />
AAL00-ERM-641-Y-TAE-1010, Rev.: 01 / at05, Page 96 of 278<br />
Figure 11<br />
Sea salinity during 2010 at three different depths (0, -10, -20 m m.s.l.)<br />
offshore the <strong>Albania</strong>n landfall site. Source: the trends are processed by DHI<br />
on the basis of the oceanographic data downloaded from MyOcean website<br />
(http://www.myocean.org/) for the point of coordinates LON 19.25°, LAT<br />
40.75°<br />
Figure 12<br />
Sea salinity during 2011 at three different depths (0, -10, -20 m m.s.l.)<br />
offshore the <strong>Albania</strong>n landfall site. Source: the trends are processed by DHI<br />
on the basis of the oceanographic data downloaded from MyOcean website<br />
(http://www.myocean.org/) for the point of coordinates LON 19.25°, LAT<br />
40.75°<br />
22700172-01-00101.docx<br />
DHI Italia
Trans Adriatic Pipeline – TAP, <strong>ESIA</strong> <strong>Albania</strong>, <strong>Annex</strong> 9 - <strong>Sediment</strong> <strong>Dispersion</strong> <strong>Modelling</strong><br />
AAL00-ERM-641-Y-TAE-1010, Rev.: 01 / at05, Page 97 of 278<br />
A P P E N D I X C<br />
Offshore currents speed and direction<br />
22700172-01-00101.docx<br />
DHI Italia
Trans Adriatic Pipeline – TAP, <strong>ESIA</strong> <strong>Albania</strong>, <strong>Annex</strong> 9 - <strong>Sediment</strong> <strong>Dispersion</strong> <strong>Modelling</strong><br />
AAL00-ERM-641-Y-TAE-1010, Rev.: 01 / at05, Page 98 of 278<br />
Figure 13 Current speed and direction during January 2006 at three different depths (0,<br />
-10, -20 m m.s.l.) offshore the <strong>Albania</strong>n landfall site. Source: the trends are<br />
processed by DHI on the basis of the oceanographic data downloaded from<br />
MyOcean website (http://www.myocean.org/) for the point of coordinates<br />
LON 19.25°, LAT 40.75°<br />
Figure 14 Current speed and direction during January 2007 at three different depths (0,<br />
-10, -20 m m.s.l.) offshore the <strong>Albania</strong>n landfall site. Source: the trends are<br />
processed by DHI on the basis of the oceanographic data downloaded from<br />
MyOcean website (http://www.myocean.org/) for the point of coordinates<br />
LON 19.25°, LAT 40.75°<br />
22700172-01-00101.docx<br />
DHI Italia
Trans Adriatic Pipeline – TAP, <strong>ESIA</strong> <strong>Albania</strong>, <strong>Annex</strong> 9 - <strong>Sediment</strong> <strong>Dispersion</strong> <strong>Modelling</strong><br />
AAL00-ERM-641-Y-TAE-1010, Rev.: 01 / at05, Page 99 of 278<br />
Figure 15 Current speed and direction during January 2008 at three different depths (0,<br />
-10, -20 m m.s.l.) offshore the <strong>Albania</strong>n landfall site. Source: the trends are<br />
processed by DHI on the basis of the oceanographic data downloaded from<br />
MyOcean website (http://www.myocean.org/) for the point of coordinates<br />
LON 19.25°, LAT 40.75°<br />
Figure 16 Current speed and direction during January 2009 at three different depths (0,<br />
-10, -20 m m.s.l.) offshore the <strong>Albania</strong>n landfall site. Source: the trends are<br />
processed by DHI on the basis of the oceanographic data downloaded from<br />
MyOcean website (http://www.myocean.org/) for the point of coordinates<br />
LON 19.25°, LAT 40.75°<br />
22700172-01-00101.docx<br />
DHI Italia
Trans Adriatic Pipeline – TAP, <strong>ESIA</strong> <strong>Albania</strong>, <strong>Annex</strong> 9 - <strong>Sediment</strong> <strong>Dispersion</strong> <strong>Modelling</strong><br />
AAL00-ERM-641-Y-TAE-1010, Rev.: 01 / at05, Page 100 of 278<br />
Figure 17 Current speed and direction during January 2010 at three different depths (0,<br />
-10, -20 m m.s.l.) offshore the <strong>Albania</strong>n landfall site. Source: the trends are<br />
processed by DHI on the basis of the oceanographic data downloaded from<br />
MyOcean website (http://www.myocean.org/) for the point of coordinates<br />
LON 19.25°, LAT 40.75°<br />
Figure 18 Current speed and direction during January 2011 at three different depths (0,<br />
-10, -20 m m.s.l.) offshore the <strong>Albania</strong>n landfall site. Source: the trends are<br />
processed by DHI on the basis of the oceanographic data downloaded from<br />
MyOcean website (http://www.myocean.org/) for the point of coordinates<br />
LON 19.25°, LAT 40.75°<br />
22700172-01-00101.docx<br />
DHI Italia
Trans Adriatic Pipeline – TAP, <strong>ESIA</strong> <strong>Albania</strong>, <strong>Annex</strong> 9 - <strong>Sediment</strong> <strong>Dispersion</strong> <strong>Modelling</strong><br />
AAL00-ERM-641-Y-TAE-1010, Rev.: 01 / at05, Page 101 of 278<br />
Figure 19<br />
Current speed and direction during February 2006 at three different depths<br />
(0, -10, -20 m m.s.l.) offshore the <strong>Albania</strong>n landfall site. Source: the trends<br />
are processed by DHI on the basis of the oceanographic data downloaded<br />
from MyOcean website (http://www.myocean.org/) for the point of<br />
coordinates LON 19.25°, LAT 40.75°<br />
Figure 20<br />
Current speed and direction during February 2007 at three different depths<br />
(0, -10, -20 m m.s.l.) offshore the <strong>Albania</strong>n landfall site. Source: the trends<br />
are processed by DHI on the basis of the oceanographic data downloaded<br />
from MyOcean website (http://www.myocean.org/) for the point of<br />
coordinates LON 19.25°, LAT 40.75°<br />
22700172-01-00101.docx<br />
DHI Italia
Trans Adriatic Pipeline – TAP, <strong>ESIA</strong> <strong>Albania</strong>, <strong>Annex</strong> 9 - <strong>Sediment</strong> <strong>Dispersion</strong> <strong>Modelling</strong><br />
AAL00-ERM-641-Y-TAE-1010, Rev.: 01 / at05, Page 102 of 278<br />
Figure 21<br />
Current speed and direction during February 2008 at three different depths<br />
(0, -10, -20 m m.s.l.) offshore the <strong>Albania</strong>n landfall site. Source: the trends<br />
are processed by DHI on the basis of the oceanographic data downloaded<br />
from MyOcean website (http://www.myocean.org/) for the point of<br />
coordinates LON 19.25°, LAT 40.75°<br />
Figure 22<br />
Current speed and direction during February 2009 at three different depths<br />
(0, -10, -20 m m.s.l.) offshore the <strong>Albania</strong>n landfall site. Source: the trends<br />
are processed by DHI on the basis of the oceanographic data downloaded<br />
from MyOcean website (http://www.myocean.org/) for the point of<br />
coordinates LON 19.25°, LAT 40.75°<br />
22700172-01-00101.docx<br />
DHI Italia
Trans Adriatic Pipeline – TAP, <strong>ESIA</strong> <strong>Albania</strong>, <strong>Annex</strong> 9 - <strong>Sediment</strong> <strong>Dispersion</strong> <strong>Modelling</strong><br />
AAL00-ERM-641-Y-TAE-1010, Rev.: 01 / at05, Page 103 of 278<br />
Figure 23<br />
Current speed and direction during February 2010 at three different depths<br />
(0, -10, -20 m m.s.l.) offshore the <strong>Albania</strong>n landfall site. Source: the trends<br />
are processed by DHI on the basis of the oceanographic data downloaded<br />
from MyOcean website (http://www.myocean.org/) for the point of<br />
coordinates LON 19.25°, LAT 40.75°<br />
Figure 24<br />
Current speed and direction during February 2011 at three different depths<br />
(0, -10, -20 m m.s.l.) offshore the <strong>Albania</strong>n landfall site. Source: the trends<br />
are processed by DHI on the basis of the oceanographic data downloaded<br />
from MyOcean website (http://www.myocean.org/) for the point of<br />
coordinates LON 19.25°, LAT 40.75°<br />
22700172-01-00101.docx<br />
DHI Italia
Trans Adriatic Pipeline – TAP, <strong>ESIA</strong> <strong>Albania</strong>, <strong>Annex</strong> 9 - <strong>Sediment</strong> <strong>Dispersion</strong> <strong>Modelling</strong><br />
AAL00-ERM-641-Y-TAE-1010, Rev.: 01 / at05, Page 104 of 278<br />
Figure 25 Current speed and direction during March 2006 at three different depths (0, -<br />
10, -20 m m.s.l.) offshore the <strong>Albania</strong>n landfall site. Source: the trends are<br />
processed by DHI on the basis of the oceanographic data downloaded from<br />
MyOcean website (http://www.myocean.org/) for the point of coordinates<br />
LON 19.25°, LAT 40.75°<br />
Figure 26 Current speed and direction during March 2007 at three different depths (0, -<br />
10, -20 m m.s.l.) offshore the <strong>Albania</strong>n landfall site. Source: the trends are<br />
processed by DHI on the basis of the oceanographic data downloaded from<br />
MyOcean website (http://www.myocean.org/) for the point of coordinates<br />
LON 19.25°, LAT 40.75°<br />
22700172-01-00101.docx<br />
DHI Italia
Trans Adriatic Pipeline – TAP, <strong>ESIA</strong> <strong>Albania</strong>, <strong>Annex</strong> 9 - <strong>Sediment</strong> <strong>Dispersion</strong> <strong>Modelling</strong><br />
AAL00-ERM-641-Y-TAE-1010, Rev.: 01 / at05, Page 105 of 278<br />
Figure 27 Current speed and direction during March 2008 at three different depths (0, -<br />
10, -20 m m.s.l.) offshore the <strong>Albania</strong>n landfall site. Source: the trends are<br />
processed by DHI on the basis of the oceanographic data downloaded from<br />
MyOcean website (http://www.myocean.org/) for the point of coordinates<br />
LON 19.25°, LAT 40.75°<br />
Figure 28 Current speed and direction during March 2009 at three different depths (0, -<br />
10, -20 m m.s.l.) offshore the <strong>Albania</strong>n landfall site. Source: the trends are<br />
processed by DHI on the basis of the oceanographic data downloaded from<br />
MyOcean website (http://www.myocean.org/) for the point of coordinates<br />
LON 19.25°, LAT 40.75°<br />
22700172-01-00101.docx<br />
DHI Italia
Trans Adriatic Pipeline – TAP, <strong>ESIA</strong> <strong>Albania</strong>, <strong>Annex</strong> 9 - <strong>Sediment</strong> <strong>Dispersion</strong> <strong>Modelling</strong><br />
AAL00-ERM-641-Y-TAE-1010, Rev.: 01 / at05, Page 106 of 278<br />
Figure 29 Current speed and direction during March 2010 at three different depths (0, -<br />
10, -20 m m.s.l.) offshore the <strong>Albania</strong>n landfall site. Source: the trends are<br />
processed by DHI on the basis of the oceanographic data downloaded from<br />
MyOcean website (http://www.myocean.org/) for the point of coordinates<br />
LON 19.25°, LAT 40.75°<br />
Figure 30 Current speed and direction during March 2011 at three different depths (0, -<br />
10, -20 m m.s.l.) offshore the <strong>Albania</strong>n landfall site. Source: the trends are<br />
processed by DHI on the basis of the oceanographic data downloaded from<br />
MyOcean website (http://www.myocean.org/) for the point of coordinates<br />
LON 19.25°, LAT 40.75°<br />
22700172-01-00101.docx<br />
DHI Italia
Trans Adriatic Pipeline – TAP, <strong>ESIA</strong> <strong>Albania</strong>, <strong>Annex</strong> 9 - <strong>Sediment</strong> <strong>Dispersion</strong> <strong>Modelling</strong><br />
AAL00-ERM-641-Y-TAE-1010, Rev.: 01 / at05, Page 107 of 278<br />
Figure 31 Current speed and direction during April 2006 at three different depths (0, -<br />
10, -20 m m.s.l.) offshore the <strong>Albania</strong>n landfall site. Source: the trends are<br />
processed by DHI on the basis of the oceanographic data downloaded from<br />
MyOcean website (http://www.myocean.org/) for the point of coordinates<br />
LON 19.25°, LAT 40.75°<br />
Figure 32 Current speed and direction during April 2007 at three different depths (0, -<br />
10, -20 m m.s.l.) offshore the <strong>Albania</strong>n landfall site. Source: the trends are<br />
processed by DHI on the basis of the oceanographic data downloaded from<br />
MyOcean website (http://www.myocean.org/) for the point of coordinates<br />
LON 19.25°, LAT 40.75°<br />
22700172-01-00101.docx<br />
DHI Italia
Trans Adriatic Pipeline – TAP, <strong>ESIA</strong> <strong>Albania</strong>, <strong>Annex</strong> 9 - <strong>Sediment</strong> <strong>Dispersion</strong> <strong>Modelling</strong><br />
AAL00-ERM-641-Y-TAE-1010, Rev.: 01 / at05, Page 108 of 278<br />
Figure 33 Current speed and direction during April 2008 at three different depths (0, -<br />
10, -20 m m.s.l.) offshore the <strong>Albania</strong>n landfall site. Source: the trends are<br />
processed by DHI on the basis of the oceanographic data downloaded from<br />
MyOcean website (http://www.myocean.org/) for the point of coordinates<br />
LON 19.25°, LAT 40.75°<br />
Figure 34 Current speed and direction during April 2009 at three different depths (0, -<br />
10, -20 m m.s.l.) offshore the <strong>Albania</strong>n landfall site. Source: the trends are<br />
processed by DHI on the basis of the oceanographic data downloaded from<br />
MyOcean website (http://www.myocean.org/) for the point of coordinates<br />
LON 19.25°, LAT 40.75°<br />
22700172-01-00101.docx<br />
DHI Italia
Trans Adriatic Pipeline – TAP, <strong>ESIA</strong> <strong>Albania</strong>, <strong>Annex</strong> 9 - <strong>Sediment</strong> <strong>Dispersion</strong> <strong>Modelling</strong><br />
AAL00-ERM-641-Y-TAE-1010, Rev.: 01 / at05, Page 109 of 278<br />
Figure 35 Current speed and direction during April 2010 at three different depths (0, -<br />
10, -20 m m.s.l.) offshore the <strong>Albania</strong>n landfall site. Source: the trends are<br />
processed by DHI on the basis of the oceanographic data downloaded from<br />
MyOcean website (http://www.myocean.org/) for the point of coordinates<br />
LON 19.25°, LAT 40.75°<br />
Figure 36 Current speed and direction during April 2011 at three different depths (0, -<br />
10, -20 m m.s.l.) offshore the <strong>Albania</strong>n landfall site. Source: the trends are<br />
processed by DHI on the basis of the oceanographic data downloaded from<br />
MyOcean website (http://www.myocean.org/) for the point of coordinates<br />
LON 19.25°, LAT 40.75°<br />
22700172-01-00101.docx<br />
DHI Italia
Trans Adriatic Pipeline – TAP, <strong>ESIA</strong> <strong>Albania</strong>, <strong>Annex</strong> 9 - <strong>Sediment</strong> <strong>Dispersion</strong> <strong>Modelling</strong><br />
AAL00-ERM-641-Y-TAE-1010, Rev.: 01 / at05, Page 110 of 278<br />
Figure 37 Current speed and direction during May 2006 at three different depths (0, -<br />
10, -20 m m.s.l.) offshore the <strong>Albania</strong>n landfall site. Source: the trends are<br />
processed by DHI on the basis of the oceanographic data downloaded from<br />
MyOcean website (http://www.myocean.org/) for the point of coordinates<br />
LON 19.25°, LAT 40.75°<br />
Figure 38 Current speed and direction during May 2007 at three different depths (0, -<br />
10, -20 m m.s.l.) offshore the <strong>Albania</strong>n landfall site. Source: the trends are<br />
processed by DHI on the basis of the oceanographic data downloaded from<br />
MyOcean website (http://www.myocean.org/) for the point of coordinates<br />
LON 19.25°, LAT 40.75°<br />
22700172-01-00101.docx<br />
DHI Italia
Trans Adriatic Pipeline – TAP, <strong>ESIA</strong> <strong>Albania</strong>, <strong>Annex</strong> 9 - <strong>Sediment</strong> <strong>Dispersion</strong> <strong>Modelling</strong><br />
AAL00-ERM-641-Y-TAE-1010, Rev.: 01 / at05, Page 111 of 278<br />
Figure 39 Current speed and direction during May 2008 at three different depths (0, -<br />
10, -20 m m.s.l.) offshore the <strong>Albania</strong>n landfall site. Source: the trends are<br />
processed by DHI on the basis of the oceanographic data downloaded from<br />
MyOcean website (http://www.myocean.org/) for the point of coordinates<br />
LON 19.25°, LAT 40.75°<br />
Figure 40 Current speed and direction during May 2009 at three different depths (0, -<br />
10, -20 m m.s.l.) offshore the <strong>Albania</strong>n landfall site. Source: the trends are<br />
processed by DHI on the basis of the oceanographic data downloaded from<br />
MyOcean website (http://www.myocean.org/) for the point of coordinates<br />
LON 19.25°, LAT 40.75°<br />
22700172-01-00101.docx<br />
DHI Italia
Trans Adriatic Pipeline – TAP, <strong>ESIA</strong> <strong>Albania</strong>, <strong>Annex</strong> 9 - <strong>Sediment</strong> <strong>Dispersion</strong> <strong>Modelling</strong><br />
AAL00-ERM-641-Y-TAE-1010, Rev.: 01 / at05, Page 112 of 278<br />
Figure 41 Current speed and direction during May 2010 at three different depths (0, -<br />
10, -20 m m.s.l.) offshore the <strong>Albania</strong>n landfall site. Source: the trends are<br />
processed by DHI on the basis of the oceanographic data downloaded from<br />
MyOcean website (http://www.myocean.org/) for the point of coordinates<br />
LON 19.25°, LAT 40.75°<br />
Figure 42 Current speed and direction during May 2011 at three different depths (0, -<br />
10, -20 m m.s.l.) offshore the <strong>Albania</strong>n landfall site. Source: the trends are<br />
processed by DHI on the basis of the oceanographic data downloaded from<br />
MyOcean website (http://www.myocean.org/) for the point of coordinates<br />
LON 19.25°, LAT 40.75°<br />
22700172-01-00101.docx<br />
DHI Italia
Trans Adriatic Pipeline – TAP, <strong>ESIA</strong> <strong>Albania</strong>, <strong>Annex</strong> 9 - <strong>Sediment</strong> <strong>Dispersion</strong> <strong>Modelling</strong><br />
AAL00-ERM-641-Y-TAE-1010, Rev.: 01 / at05, Page 113 of 278<br />
Figure 43 Current speed and direction during June 2006 at three different depths (0, -<br />
10, -20 m m.s.l.) offshore the <strong>Albania</strong>n landfall site. Source: the trends are<br />
processed by DHI on the basis of the oceanographic data downloaded from<br />
MyOcean website (http://www.myocean.org/) for the point of coordinates<br />
LON 19.25°, LAT 40.75°<br />
Figure 44 Current speed and direction during June 2007 at three different depths (0, -<br />
10, -20 m m.s.l.) offshore the <strong>Albania</strong>n landfall site. Source: the trends are<br />
processed by DHI on the basis of the oceanographic data downloaded from<br />
MyOcean website (http://www.myocean.org/) for the point of coordinates<br />
LON 19.25°, LAT 40.75°<br />
22700172-01-00101.docx<br />
DHI Italia
Trans Adriatic Pipeline – TAP, <strong>ESIA</strong> <strong>Albania</strong>, <strong>Annex</strong> 9 - <strong>Sediment</strong> <strong>Dispersion</strong> <strong>Modelling</strong><br />
AAL00-ERM-641-Y-TAE-1010, Rev.: 01 / at05, Page 114 of 278<br />
Figure 45 Current speed and direction during June 2008 at three different depths (0, -<br />
10, -20 m m.s.l.) offshore the <strong>Albania</strong>n landfall site. Source: the trends are<br />
processed by DHI on the basis of the oceanographic data downloaded from<br />
MyOcean website (http://www.myocean.org/) for the point of coordinates<br />
LON 19.25°, LAT 40.75°<br />
Figure 46 Current speed and direction during June 2009 at three different depths (0, -<br />
10, -20 m m.s.l.) offshore the <strong>Albania</strong>n landfall site. Source: the trends are<br />
processed by DHI on the basis of the oceanographic data downloaded from<br />
MyOcean website (http://www.myocean.org/) for the point of coordinates<br />
LON 19.25°, LAT 40.75°<br />
22700172-01-00101.docx<br />
DHI Italia
Trans Adriatic Pipeline – TAP, <strong>ESIA</strong> <strong>Albania</strong>, <strong>Annex</strong> 9 - <strong>Sediment</strong> <strong>Dispersion</strong> <strong>Modelling</strong><br />
AAL00-ERM-641-Y-TAE-1010, Rev.: 01 / at05, Page 115 of 278<br />
Figure 47 Current speed and direction during June 2010 at three different depths (0, -<br />
10, -20 m m.s.l.) offshore the <strong>Albania</strong>n landfall site. Source: the trends are<br />
processed by DHI on the basis of the oceanographic data downloaded from<br />
MyOcean website (http://www.myocean.org/) for the point of coordinates<br />
LON 19.25°, LAT 40.75°<br />
Figure 48 Current speed and direction during June 2011 at three different depths (0, -<br />
10, -20 m m.s.l.) offshore the <strong>Albania</strong>n landfall site. Source: the trends are<br />
processed by DHI on the basis of the oceanographic data downloaded from<br />
MyOcean website (http://www.myocean.org/) for the point of coordinates<br />
LON 19.25°, LAT 40.75°<br />
22700172-01-00101.docx<br />
DHI Italia
Trans Adriatic Pipeline – TAP, <strong>ESIA</strong> <strong>Albania</strong>, <strong>Annex</strong> 9 - <strong>Sediment</strong> <strong>Dispersion</strong> <strong>Modelling</strong><br />
AAL00-ERM-641-Y-TAE-1010, Rev.: 01 / at05, Page 116 of 278<br />
Figure 49 Current speed and direction during July 2006 at three different depths (0, -<br />
10, -20 m m.s.l.) offshore the <strong>Albania</strong>n landfall site. Source: the trends are<br />
processed by DHI on the basis of the oceanographic data downloaded from<br />
MyOcean website (http://www.myocean.org/) for the point of coordinates<br />
LON 19.25°, LAT 40.75°<br />
Figure 50 Current speed and direction during July 2007 at three different depths (0, -<br />
10, -20 m m.s.l.) offshore the <strong>Albania</strong>n landfall site. Source: the trends are<br />
processed by DHI on the basis of the oceanographic data downloaded from<br />
MyOcean website (http://www.myocean.org/) for the point of coordinates<br />
LON 19.25°, LAT 40.75°<br />
22700172-01-00101.docx<br />
DHI Italia
Trans Adriatic Pipeline – TAP, <strong>ESIA</strong> <strong>Albania</strong>, <strong>Annex</strong> 9 - <strong>Sediment</strong> <strong>Dispersion</strong> <strong>Modelling</strong><br />
AAL00-ERM-641-Y-TAE-1010, Rev.: 01 / at05, Page 117 of 278<br />
Figure 51 Current speed and direction during July 2008 at three different depths (0, -<br />
10, -20 m m.s.l.) offshore the <strong>Albania</strong>n landfall site. Source: the trends are<br />
processed by DHI on the basis of the oceanographic data downloaded from<br />
MyOcean website (http://www.myocean.org/) for the point of coordinates<br />
LON 19.25°, LAT 40.75°<br />
Figure 52 Current speed and direction during July 2009 at three different depths (0, -<br />
10, -20 m m.s.l.) offshore the <strong>Albania</strong>n landfall site. Source: the trends are<br />
processed by DHI on the basis of the oceanographic data downloaded from<br />
MyOcean website (http://www.myocean.org/) for the point of coordinates<br />
LON 19.25°, LAT 40.75°<br />
22700172-01-00101.docx<br />
DHI Italia
Trans Adriatic Pipeline – TAP, <strong>ESIA</strong> <strong>Albania</strong>, <strong>Annex</strong> 9 - <strong>Sediment</strong> <strong>Dispersion</strong> <strong>Modelling</strong><br />
AAL00-ERM-641-Y-TAE-1010, Rev.: 01 / at05, Page 118 of 278<br />
Figure 53 Current speed and direction during July 2010 at three different depths (0, -<br />
10, -20 m m.s.l.) offshore the <strong>Albania</strong>n landfall site. Source: the trends are<br />
processed by DHI on the basis of the oceanographic data downloaded from<br />
MyOcean website (http://www.myocean.org/) for the point of coordinates<br />
LON 19.25°, LAT 40.75°<br />
Figure 54 Current speed and direction during July 2011 at three different depths (0, -<br />
10, -20 m m.s.l.) offshore the <strong>Albania</strong>n landfall site. Source: the trends are<br />
processed by DHI on the basis of the oceanographic data downloaded from<br />
MyOcean website (http://www.myocean.org/) for the point of coordinates<br />
LON 19.25°, LAT 40.75°<br />
22700172-01-00101.docx<br />
DHI Italia
Trans Adriatic Pipeline – TAP, <strong>ESIA</strong> <strong>Albania</strong>, <strong>Annex</strong> 9 - <strong>Sediment</strong> <strong>Dispersion</strong> <strong>Modelling</strong><br />
AAL00-ERM-641-Y-TAE-1010, Rev.: 01 / at05, Page 119 of 278<br />
Figure 55 Current speed and direction during August 2006 at three different depths (0,<br />
-10, -20 m m.s.l.) offshore the <strong>Albania</strong>n landfall site. Source: the trends are<br />
processed by DHI on the basis of the oceanographic data downloaded from<br />
MyOcean website (http://www.myocean.org/) for the point of coordinates<br />
LON 19.25°, LAT 40.75°<br />
Figure 56 Current speed and direction during August 2007 at three different depths (0,<br />
-10, -20 m m.s.l.) offshore the <strong>Albania</strong>n landfall site. Source: the trends are<br />
processed by DHI on the basis of the oceanographic data downloaded from<br />
MyOcean website (http://www.myocean.org/) for the point of coordinates<br />
LON 19.25°, LAT 40.75°<br />
22700172-01-00101.docx<br />
DHI Italia
Trans Adriatic Pipeline – TAP, <strong>ESIA</strong> <strong>Albania</strong>, <strong>Annex</strong> 9 - <strong>Sediment</strong> <strong>Dispersion</strong> <strong>Modelling</strong><br />
AAL00-ERM-641-Y-TAE-1010, Rev.: 01 / at05, Page 120 of 278<br />
Figure 57 Current speed and direction during August 2008 at three different depths (0,<br />
-10, -20 m m.s.l.) offshore the <strong>Albania</strong>n landfall site. Source: the trends are<br />
processed by DHI on the basis of the oceanographic data downloaded from<br />
MyOcean website (http://www.myocean.org/) for the point of coordinates<br />
LON 19.25°, LAT 40.75°<br />
Figure 58 Current speed and direction during August 2009 at three different depths (0,<br />
-10, -20 m m.s.l.) offshore the <strong>Albania</strong>n landfall site. Source: the trends are<br />
processed by DHI on the basis of the oceanographic data downloaded from<br />
MyOcean website (http://www.myocean.org/) for the point of coordinates<br />
LON 19.25°, LAT 40.75°<br />
22700172-01-00101.docx<br />
DHI Italia
Trans Adriatic Pipeline – TAP, <strong>ESIA</strong> <strong>Albania</strong>, <strong>Annex</strong> 9 - <strong>Sediment</strong> <strong>Dispersion</strong> <strong>Modelling</strong><br />
AAL00-ERM-641-Y-TAE-1010, Rev.: 01 / at05, Page 121 of 278<br />
Figure 59 Current speed and direction during August 2010 at three different depths (0,<br />
-10, -20 m m.s.l.) offshore the <strong>Albania</strong>n landfall site. Source: the trends are<br />
processed by DHI on the basis of the oceanographic data downloaded from<br />
MyOcean website (http://www.myocean.org/) for the point of coordinates<br />
LON 19.25°, LAT 40.75°<br />
Figure 60 Current speed and direction during August 2011 at three different depths (0,<br />
-10, -20 m m.s.l.) offshore the <strong>Albania</strong>n landfall site. Source: the trends are<br />
processed by DHI on the basis of the oceanographic data downloaded from<br />
MyOcean website (http://www.myocean.org/) for the point of coordinates<br />
LON 19.25°, LAT 40.75°<br />
22700172-01-00101.docx<br />
DHI Italia
Trans Adriatic Pipeline – TAP, <strong>ESIA</strong> <strong>Albania</strong>, <strong>Annex</strong> 9 - <strong>Sediment</strong> <strong>Dispersion</strong> <strong>Modelling</strong><br />
AAL00-ERM-641-Y-TAE-1010, Rev.: 01 / at05, Page 122 of 278<br />
Figure 61<br />
Current speed and direction during September 2006 at three different depths<br />
(0, -10, -20 m m.s.l.) offshore the <strong>Albania</strong>n landfall site. Source: the trends<br />
are processed by DHI on the basis of the oceanographic data downloaded<br />
from MyOcean website (http://www.myocean.org/) for the point of<br />
coordinates LON 19.25°, LAT 40.75°<br />
Figure 62<br />
Current speed and direction during September 2007 at three different depths<br />
(0, -10, -20 m m.s.l.) offshore the <strong>Albania</strong>n landfall site. Source: the trends<br />
are processed by DHI on the basis of the oceanographic data downloaded<br />
from MyOcean website (http://www.myocean.org/) for the point of<br />
coordinates LON 19.25°, LAT 40.75°<br />
22700172-01-00101.docx<br />
DHI Italia
Trans Adriatic Pipeline – TAP, <strong>ESIA</strong> <strong>Albania</strong>, <strong>Annex</strong> 9 - <strong>Sediment</strong> <strong>Dispersion</strong> <strong>Modelling</strong><br />
AAL00-ERM-641-Y-TAE-1010, Rev.: 01 / at05, Page 123 of 278<br />
Figure 63<br />
Current speed and direction during September 2008 at three different depths<br />
(0, -10, -20 m m.s.l.) offshore the <strong>Albania</strong>n landfall site. Source: the trends<br />
are processed by DHI on the basis of the oceanographic data downloaded<br />
from MyOcean website (http://www.myocean.org/) for the point of<br />
coordinates LON 19.25°, LAT 40.75°<br />
Figure 64<br />
Current speed and direction during September 2009 at three different depths<br />
(0, -10, -20 m m.s.l.) offshore the <strong>Albania</strong>n landfall site. Source: the trends<br />
are processed by DHI on the basis of the oceanographic data downloaded<br />
from MyOcean website (http://www.myocean.org/) for the point of<br />
coordinates LON 19.25°, LAT 40.75°<br />
22700172-01-00101.docx<br />
DHI Italia
Trans Adriatic Pipeline – TAP, <strong>ESIA</strong> <strong>Albania</strong>, <strong>Annex</strong> 9 - <strong>Sediment</strong> <strong>Dispersion</strong> <strong>Modelling</strong><br />
AAL00-ERM-641-Y-TAE-1010, Rev.: 01 / at05, Page 124 of 278<br />
Figure 65<br />
Current speed and direction during September 2010 at three different depths<br />
(0, -10, -20 m m.s.l.) offshore the <strong>Albania</strong>n landfall site. Source: the trends<br />
are processed by DHI on the basis of the oceanographic data downloaded<br />
from MyOcean website (http://www.myocean.org/) for the point of<br />
coordinates LON 19.25°, LAT 40.75°<br />
Figure 66<br />
Current speed and direction during September 2011 at three different depths<br />
(0, -10, -20 m m.s.l.) offshore the <strong>Albania</strong>n landfall site. Source: the trends<br />
are processed by DHI on the basis of the oceanographic data downloaded<br />
from MyOcean website (http://www.myocean.org/) for the point of<br />
coordinates LON 19.25°, LAT 40.75°<br />
22700172-01-00101.docx<br />
DHI Italia
Trans Adriatic Pipeline – TAP, <strong>ESIA</strong> <strong>Albania</strong>, <strong>Annex</strong> 9 - <strong>Sediment</strong> <strong>Dispersion</strong> <strong>Modelling</strong><br />
AAL00-ERM-641-Y-TAE-1010, Rev.: 01 / at05, Page 125 of 278<br />
Figure 67 Current speed and direction during October 2006 at three different depths (0,<br />
-10, -20 m m.s.l.) offshore the <strong>Albania</strong>n landfall site. Source: the trends are<br />
processed by DHI on the basis of the oceanographic data downloaded from<br />
MyOcean website (http://www.myocean.org/) for the point of coordinates<br />
LON 19.25°, LAT 40.75°<br />
Figure 68 Current speed and direction during October 2007 at three different depths (0,<br />
-10, -20 m m.s.l.) offshore the <strong>Albania</strong>n landfall site. Source: the trends are<br />
processed by DHI on the basis of the oceanographic data downloaded from<br />
MyOcean website (http://www.myocean.org/) for the point of coordinates<br />
LON 19.25°, LAT 40.75°<br />
22700172-01-00101.docx<br />
DHI Italia
Trans Adriatic Pipeline – TAP, <strong>ESIA</strong> <strong>Albania</strong>, <strong>Annex</strong> 9 - <strong>Sediment</strong> <strong>Dispersion</strong> <strong>Modelling</strong><br />
AAL00-ERM-641-Y-TAE-1010, Rev.: 01 / at05, Page 126 of 278<br />
Figure 69 Current speed and direction during October 2008 at three different depths (0,<br />
-10, -20 m m.s.l.) offshore the <strong>Albania</strong>n landfall site. Source: the trends are<br />
processed by DHI on the basis of the oceanographic data downloaded from<br />
MyOcean website (http://www.myocean.org/) for the point of coordinates<br />
LON 19.25°, LAT 40.75°<br />
Figure 70 Current speed and direction during October 2009 at three different depths (0,<br />
-10, -20 m m.s.l.) offshore the <strong>Albania</strong>n landfall site. Source: the trends are<br />
processed by DHI on the basis of the oceanographic data downloaded from<br />
MyOcean website (http://www.myocean.org/) for the point of coordinates<br />
LON 19.25°, LAT 40.75°<br />
22700172-01-00101.docx<br />
DHI Italia
Trans Adriatic Pipeline – TAP, <strong>ESIA</strong> <strong>Albania</strong>, <strong>Annex</strong> 9 - <strong>Sediment</strong> <strong>Dispersion</strong> <strong>Modelling</strong><br />
AAL00-ERM-641-Y-TAE-1010, Rev.: 01 / at05, Page 127 of 278<br />
Figure 71 Current speed and direction during October 2010 at three different depths (0,<br />
-10, -20 m m.s.l.) offshore the <strong>Albania</strong>n landfall site. Source: the trends are<br />
processed by DHI on the basis of the oceanographic data downloaded from<br />
MyOcean website (http://www.myocean.org/) for the point of coordinates<br />
LON 19.25°, LAT 40.75°<br />
Figure 72 Current speed and direction during October 2011 at three different depths (0,<br />
-10, -20 m m.s.l.) offshore the <strong>Albania</strong>n landfall site. Source: the trends are<br />
processed by DHI on the basis of the oceanographic data downloaded from<br />
MyOcean website (http://www.myocean.org/) for the point of coordinates<br />
LON 19.25°, LAT 40.75°<br />
22700172-01-00101.docx<br />
DHI Italia
Trans Adriatic Pipeline – TAP, <strong>ESIA</strong> <strong>Albania</strong>, <strong>Annex</strong> 9 - <strong>Sediment</strong> <strong>Dispersion</strong> <strong>Modelling</strong><br />
AAL00-ERM-641-Y-TAE-1010, Rev.: 01 / at05, Page 128 of 278<br />
Figure 73<br />
Current speed and direction during November 2006 at three different depths<br />
(0, -10, -20 m m.s.l.) offshore the <strong>Albania</strong>n landfall site. Source: the trends<br />
are processed by DHI on the basis of the oceanographic data downloaded<br />
from MyOcean website (http://www.myocean.org/) for the point of<br />
coordinates LON 19.25°, LAT 40.75°<br />
Figure 74<br />
Current speed and direction during November 2007 at three different depths<br />
(0, -10, -20 m m.s.l.) offshore the <strong>Albania</strong>n landfall site. Source: the trends<br />
are processed by DHI on the basis of the oceanographic data downloaded<br />
from MyOcean website (http://www.myocean.org/) for the point of<br />
coordinates LON 19.25°, LAT 40.75°<br />
22700172-01-00101.docx<br />
DHI Italia
Trans Adriatic Pipeline – TAP, <strong>ESIA</strong> <strong>Albania</strong>, <strong>Annex</strong> 9 - <strong>Sediment</strong> <strong>Dispersion</strong> <strong>Modelling</strong><br />
AAL00-ERM-641-Y-TAE-1010, Rev.: 01 / at05, Page 129 of 278<br />
Figure 75<br />
Current speed and direction during November 2008 at three different depths<br />
(0, -10, -20 m m.s.l.) offshore the <strong>Albania</strong>n landfall site. Source: the trends<br />
are processed by DHI on the basis of the oceanographic data downloaded<br />
from MyOcean website (http://www.myocean.org/) for the point of<br />
coordinates LON 19.25°, LAT 40.75°<br />
Figure 76<br />
Current speed and direction during November 2009 at three different depths<br />
(0, -10, -20 m m.s.l.) offshore the <strong>Albania</strong>n landfall site. Source: the trends<br />
are processed by DHI on the basis of the oceanographic data downloaded<br />
from MyOcean website (http://www.myocean.org/) for the point of<br />
coordinates LON 19.25°, LAT 40.75°<br />
22700172-01-00101.docx<br />
DHI Italia
Trans Adriatic Pipeline – TAP, <strong>ESIA</strong> <strong>Albania</strong>, <strong>Annex</strong> 9 - <strong>Sediment</strong> <strong>Dispersion</strong> <strong>Modelling</strong><br />
AAL00-ERM-641-Y-TAE-1010, Rev.: 01 / at05, Page 130 of 278<br />
Figure 77<br />
Current speed and direction during November 2010 at three different depths<br />
(0, -10, -20 m m.s.l.) offshore the <strong>Albania</strong>n landfall site. Source: the trends<br />
are processed by DHI on the basis of the oceanographic data downloaded<br />
from MyOcean website (http://www.myocean.org/) for the point of<br />
coordinates LON 19.25°, LAT 40.75°<br />
Figure 78<br />
Current speed and direction during December 2006 at three different depths<br />
(0, -10, -20 m m.s.l.) offshore the <strong>Albania</strong>n landfall site. Source: the trends<br />
are processed by DHI on the basis of the oceanographic data downloaded<br />
from MyOcean website (http://www.myocean.org/) for the point of<br />
coordinates LON 19.25°, LAT 40.75°<br />
22700172-01-00101.docx<br />
DHI Italia
Trans Adriatic Pipeline – TAP, <strong>ESIA</strong> <strong>Albania</strong>, <strong>Annex</strong> 9 - <strong>Sediment</strong> <strong>Dispersion</strong> <strong>Modelling</strong><br />
AAL00-ERM-641-Y-TAE-1010, Rev.: 01 / at05, Page 131 of 278<br />
Figure 79<br />
Current speed and direction during December 2007 at three different depths<br />
(0, -10, -20 m m.s.l.) offshore the landfall site. Source: the trends are<br />
processed by DHI on the basis of the oceanographic data downloaded from<br />
MyOcean website (http://www.myocean.org/) for the point of coordinates<br />
LON 19.25°, LAT 40.75°<br />
Figure 80<br />
Current speed and direction during December 2008 at three different depths<br />
(0, -10, -20 m m.s.l.) offshore the <strong>Albania</strong>n landfall site. Source: the trends<br />
are processed by DHI on the basis of the oceanographic data downloaded<br />
from MyOcean website (http://www.myocean.org/) for the point of<br />
coordinates LON 19.25°, LAT 40.75°<br />
22700172-01-00101.docx<br />
DHI Italia
Trans Adriatic Pipeline – TAP, <strong>ESIA</strong> <strong>Albania</strong>, <strong>Annex</strong> 9 - <strong>Sediment</strong> <strong>Dispersion</strong> <strong>Modelling</strong><br />
AAL00-ERM-641-Y-TAE-1010, Rev.: 01 / at05, Page 132 of 278<br />
Figure 81<br />
Current speed and direction during December 2009 at three different depths<br />
(0, -10, -20 m m.s.l.) offshore the <strong>Albania</strong>n landfall site. Source: the trends<br />
are processed by DHI on the basis of the oceanographic data downloaded<br />
from MyOcean website (http://www.myocean.org/) for the point of<br />
coordinates LON 19.25°, LAT 40.75°<br />
Figure 82<br />
Current speed and direction during December 2010 at three different depths<br />
(0, -10, -20 m m.s.l.) offshore the <strong>Albania</strong>n landfall site. Source: the trends<br />
are processed by DHI on the basis of the oceanographic data downloaded<br />
from MyOcean website (http://www.myocean.org/) for the point of<br />
coordinates LON 19.25°, LAT 40.75°<br />
22700172-01-00101.docx<br />
DHI Italia
Trans Adriatic Pipeline – TAP, <strong>ESIA</strong> <strong>Albania</strong>, <strong>Annex</strong> 9 - <strong>Sediment</strong> <strong>Dispersion</strong> <strong>Modelling</strong><br />
AAL00-ERM-641-Y-TAE-1010, Rev.: 01 / at05, Page 133 of 278<br />
A P P E N D I X D<br />
Plots representing maps of currents<br />
22700172-01-00101.docx<br />
DHI Italia
Trans Adriatic Pipeline – TAP, <strong>ESIA</strong> <strong>Albania</strong>, <strong>Annex</strong> 9 - <strong>Sediment</strong> <strong>Dispersion</strong> <strong>Modelling</strong><br />
AAL00-ERM-641-Y-TAE-1010, Rev.: 01 / at05, Page 134 of 278<br />
Figure 83 Location of the release points. For points n°1 (P1), n°2 (P2), n°3 (P3), n°4<br />
(P4), due to the expected dredging methodology, two release sources are<br />
considered: one is located inside the channel, where the sediment is dredged,<br />
and one outside the channel, where the material is temporarily deposited. For<br />
point n°5 only one release source, inside the trench, has been assumed.<br />
22700172-01-00101.docx<br />
DHI Italia
Trans Adriatic Pipeline – TAP, <strong>ESIA</strong> <strong>Albania</strong>, <strong>Annex</strong> 9 - <strong>Sediment</strong> <strong>Dispersion</strong> <strong>Modelling</strong><br />
AAL00-ERM-641-Y-TAE-1010, Rev.: 01 / at05, Page 135 of 278<br />
Latitude [°]<br />
Figure 84<br />
Longitude [°]<br />
Hydrodynamic field at surface for the <strong>Albania</strong>n landfall site (bathymetry n°1)<br />
during autumn/winter representative conditions (04/01/2008)<br />
22700172-01-00101.docx<br />
DHI Italia
Trans Adriatic Pipeline – TAP, <strong>ESIA</strong> <strong>Albania</strong>, <strong>Annex</strong> 9 - <strong>Sediment</strong> <strong>Dispersion</strong> <strong>Modelling</strong><br />
AAL00-ERM-641-Y-TAE-1010, Rev.: 01 / at05, Page 136 of 278<br />
Latitude [°]<br />
Longitude [°]<br />
Figure 85<br />
Hydrodynamic field at intermediate depth for the <strong>Albania</strong>n landfall site<br />
(bathymetry n°1) during autumn/winter representative conditions<br />
(04/01/2008)<br />
22700172-01-00101.docx<br />
DHI Italia
Trans Adriatic Pipeline – TAP, <strong>ESIA</strong> <strong>Albania</strong>, <strong>Annex</strong> 9 - <strong>Sediment</strong> <strong>Dispersion</strong> <strong>Modelling</strong><br />
AAL00-ERM-641-Y-TAE-1010, Rev.: 01 / at05, Page 137 of 278<br />
Latitude [°]<br />
Longitude [°]<br />
Figure 86<br />
Hydrodynamic field at sea bed depth for the <strong>Albania</strong>n landfall site<br />
(bathymetry n°1) during autumn/winter representative conditions<br />
(04/01/2008)<br />
22700172-01-00101.docx<br />
DHI Italia
Trans Adriatic Pipeline – TAP, <strong>ESIA</strong> <strong>Albania</strong>, <strong>Annex</strong> 9 - <strong>Sediment</strong> <strong>Dispersion</strong> <strong>Modelling</strong><br />
AAL00-ERM-641-Y-TAE-1010, Rev.: 01 / at05, Page 138 of 278<br />
Latitude [°]<br />
Longitude [°]<br />
Figure 87<br />
Hydrodynamic field at surface for the <strong>Albania</strong>n landfall site (bathymetry n°2)<br />
during autumn/winter representative conditions (04/01/2008)<br />
22700172-01-00101.docx<br />
DHI Italia
Trans Adriatic Pipeline – TAP, <strong>ESIA</strong> <strong>Albania</strong>, <strong>Annex</strong> 9 - <strong>Sediment</strong> <strong>Dispersion</strong> <strong>Modelling</strong><br />
AAL00-ERM-641-Y-TAE-1010, Rev.: 01 / at05, Page 139 of 278<br />
Latitude [°]<br />
Figure 88<br />
Longitude [°]<br />
Hydrodynamic field at intermediate depth for the <strong>Albania</strong>n landfall site<br />
(bathymetry n°2) during autumn/winter representative conditions<br />
(04/01/2008)<br />
22700172-01-00101.docx<br />
DHI Italia
Trans Adriatic Pipeline – TAP, <strong>ESIA</strong> <strong>Albania</strong>, <strong>Annex</strong> 9 - <strong>Sediment</strong> <strong>Dispersion</strong> <strong>Modelling</strong><br />
AAL00-ERM-641-Y-TAE-1010, Rev.: 01 / at05, Page 140 of 278<br />
Latitude [°]<br />
Figure 89<br />
Longitude [°]<br />
Hydrodynamic field at sea bed depth for the <strong>Albania</strong>n landfall site<br />
(bathymetry n°2) during autumn/winter representative conditions<br />
(04/01/2008)<br />
22700172-01-00101.docx<br />
DHI Italia
Trans Adriatic Pipeline – TAP, <strong>ESIA</strong> <strong>Albania</strong>, <strong>Annex</strong> 9 - <strong>Sediment</strong> <strong>Dispersion</strong> <strong>Modelling</strong><br />
AAL00-ERM-641-Y-TAE-1010, Rev.: 01 / at05, Page 141 of 278<br />
Latitude [°]<br />
Longitude [°]<br />
Figure 90<br />
Hydrodynamic field at surface for the <strong>Albania</strong>n landfall site (bathymetry n°3)<br />
during autumn/winter representative conditions (04/01/2008)<br />
22700172-01-00101.docx<br />
DHI Italia
Trans Adriatic Pipeline – TAP, <strong>ESIA</strong> <strong>Albania</strong>, <strong>Annex</strong> 9 - <strong>Sediment</strong> <strong>Dispersion</strong> <strong>Modelling</strong><br />
AAL00-ERM-641-Y-TAE-1010, Rev.: 01 / at05, Page 142 of 278<br />
Latitude [°]<br />
Longitude [°]<br />
Figure 91<br />
Hydrodynamic field at intermediate depth for the <strong>Albania</strong>n landfall site<br />
(bathymetry n°3) during autumn/winter representative conditions<br />
(04/01/2008)<br />
22700172-01-00101.docx<br />
DHI Italia
Trans Adriatic Pipeline – TAP, <strong>ESIA</strong> <strong>Albania</strong>, <strong>Annex</strong> 9 - <strong>Sediment</strong> <strong>Dispersion</strong> <strong>Modelling</strong><br />
AAL00-ERM-641-Y-TAE-1010, Rev.: 01 / at05, Page 143 of 278<br />
Latitude [°]<br />
Longitude [°]<br />
Figure 92<br />
Hydrodynamic field at sea bed depth for the <strong>Albania</strong>n landfall site<br />
(bathymetry n°3) during autumn/winter representative conditions<br />
(04/01/2008)<br />
22700172-01-00101.docx<br />
DHI Italia
Trans Adriatic Pipeline – TAP, <strong>ESIA</strong> <strong>Albania</strong>, <strong>Annex</strong> 9 - <strong>Sediment</strong> <strong>Dispersion</strong> <strong>Modelling</strong><br />
AAL00-ERM-641-Y-TAE-1010, Rev.: 01 / at05, Page 144 of 278<br />
Latitude [°]<br />
Longitude [°]<br />
Figure 93<br />
Hydrodynamic field at surface for the <strong>Albania</strong>n landfall site (bathymetry n°1)<br />
during autumn/winter representative conditions (13/01/2008)<br />
22700172-01-00101.docx<br />
DHI Italia
Trans Adriatic Pipeline – TAP, <strong>ESIA</strong> <strong>Albania</strong>, <strong>Annex</strong> 9 - <strong>Sediment</strong> <strong>Dispersion</strong> <strong>Modelling</strong><br />
AAL00-ERM-641-Y-TAE-1010, Rev.: 01 / at05, Page 145 of 278<br />
Latitude [°]<br />
Longitude [°]<br />
Figure 94<br />
Hydrodynamic field at intermediate depth for the <strong>Albania</strong>n landfall site<br />
(bathymetry n°1) during autumn/winter representative conditions<br />
(13/01/2008)<br />
22700172-01-00101.docx<br />
DHI Italia
Trans Adriatic Pipeline – TAP, <strong>ESIA</strong> <strong>Albania</strong>, <strong>Annex</strong> 9 - <strong>Sediment</strong> <strong>Dispersion</strong> <strong>Modelling</strong><br />
AAL00-ERM-641-Y-TAE-1010, Rev.: 01 / at05, Page 146 of 278<br />
Latitude [°]<br />
Longitude [°]<br />
Figure 95<br />
Hydrodynamic field at sea bed depth for the <strong>Albania</strong>n landfall site<br />
(bathymetry n°1) during autumn/winter representative conditions<br />
(13/01/2008)<br />
22700172-01-00101.docx<br />
DHI Italia
Trans Adriatic Pipeline – TAP, <strong>ESIA</strong> <strong>Albania</strong>, <strong>Annex</strong> 9 - <strong>Sediment</strong> <strong>Dispersion</strong> <strong>Modelling</strong><br />
AAL00-ERM-641-Y-TAE-1010, Rev.: 01 / at05, Page 147 of 278<br />
Latitude [°]<br />
Longitude [°]<br />
Figure 96<br />
Hydrodynamic field at surface for the <strong>Albania</strong>n landfall site (bathymetry n°2)<br />
during autumn/winter representative conditions (13/01/2008)<br />
22700172-01-00101.docx<br />
DHI Italia
Trans Adriatic Pipeline – TAP, <strong>ESIA</strong> <strong>Albania</strong>, <strong>Annex</strong> 9 - <strong>Sediment</strong> <strong>Dispersion</strong> <strong>Modelling</strong><br />
AAL00-ERM-641-Y-TAE-1010, Rev.: 01 / at05, Page 148 of 278<br />
Latitude [°]<br />
Longitude [°]<br />
Figure 97<br />
Hydrodynamic field at intermediate depth for the <strong>Albania</strong>n landfall site<br />
(bathymetry n°2) during autumn/winter representative conditions<br />
(13/01/2008)<br />
22700172-01-00101.docx<br />
DHI Italia
Trans Adriatic Pipeline – TAP, <strong>ESIA</strong> <strong>Albania</strong>, <strong>Annex</strong> 9 - <strong>Sediment</strong> <strong>Dispersion</strong> <strong>Modelling</strong><br />
AAL00-ERM-641-Y-TAE-1010, Rev.: 01 / at05, Page 149 of 278<br />
Latitude [°]<br />
Longitude [°]<br />
Figure 98<br />
Hydrodynamic field at sea bed depth for the <strong>Albania</strong>n landfall site<br />
(bathymetry n°2) during autumn/winter representative conditions<br />
(13/01/2008)<br />
22700172-01-00101.docx<br />
DHI Italia
Trans Adriatic Pipeline – TAP, <strong>ESIA</strong> <strong>Albania</strong>, <strong>Annex</strong> 9 - <strong>Sediment</strong> <strong>Dispersion</strong> <strong>Modelling</strong><br />
AAL00-ERM-641-Y-TAE-1010, Rev.: 01 / at05, Page 150 of 278<br />
Latitude [°]<br />
Figure 99<br />
Longitude [°]<br />
Hydrodynamic field at surface for the <strong>Albania</strong>n landfall site (bathymetry n°3)<br />
during autumn/winter representative conditions (13/01/2008)<br />
22700172-01-00101.docx<br />
DHI Italia
Trans Adriatic Pipeline – TAP, <strong>ESIA</strong> <strong>Albania</strong>, <strong>Annex</strong> 9 - <strong>Sediment</strong> <strong>Dispersion</strong> <strong>Modelling</strong><br />
AAL00-ERM-641-Y-TAE-1010, Rev.: 01 / at05, Page 151 of 278<br />
Latitude [°]<br />
Longitude [°]<br />
Figure 100 Hydrodynamic field at intermediate depth for the <strong>Albania</strong>n landfall site<br />
(bathymetry n°3) during autumn/winter representative conditions<br />
(13/01/2008)<br />
22700172-01-00101.docx<br />
DHI Italia
Trans Adriatic Pipeline – TAP, <strong>ESIA</strong> <strong>Albania</strong>, <strong>Annex</strong> 9 - <strong>Sediment</strong> <strong>Dispersion</strong> <strong>Modelling</strong><br />
AAL00-ERM-641-Y-TAE-1010, Rev.: 01 / at05, Page 152 of 278<br />
Latitude [°]<br />
Longitude [°]<br />
Figure 101 Hydrodynamic field at sea bed depth for the <strong>Albania</strong>n landfall site<br />
(bathymetry n°3) during autumn/winter representative conditions<br />
(13/01/2008)<br />
22700172-01-00101.docx<br />
DHI Italia
Trans Adriatic Pipeline – TAP, <strong>ESIA</strong> <strong>Albania</strong>, <strong>Annex</strong> 9 - <strong>Sediment</strong> <strong>Dispersion</strong> <strong>Modelling</strong><br />
AAL00-ERM-641-Y-TAE-1010, Rev.: 01 / at05, Page 153 of 278<br />
Latitude [°]<br />
Longitude [°]<br />
Figure 102 Hydrodynamic field at surface for the <strong>Albania</strong>n landfall site (bathymetry n°1)<br />
during spring/summer representative conditions (23/06/2008)<br />
22700172-01-00101.docx<br />
DHI Italia
Trans Adriatic Pipeline – TAP, <strong>ESIA</strong> <strong>Albania</strong>, <strong>Annex</strong> 9 - <strong>Sediment</strong> <strong>Dispersion</strong> <strong>Modelling</strong><br />
AAL00-ERM-641-Y-TAE-1010, Rev.: 01 / at05, Page 154 of 278<br />
Latitude [°]<br />
Longitude [°]<br />
Figure 103 Hydrodynamic field at intermediate depth for the <strong>Albania</strong>n landfall site<br />
(bathymetry n°1) during spring/summer representative conditions<br />
(23/06/2008)<br />
22700172-01-00101.docx<br />
DHI Italia
Trans Adriatic Pipeline – TAP, <strong>ESIA</strong> <strong>Albania</strong>, <strong>Annex</strong> 9 - <strong>Sediment</strong> <strong>Dispersion</strong> <strong>Modelling</strong><br />
AAL00-ERM-641-Y-TAE-1010, Rev.: 01 / at05, Page 155 of 278<br />
Latitude [°]<br />
Longitude [°]<br />
Figure 104 Hydrodynamic field at sea bed depth for the <strong>Albania</strong>n landfall site<br />
(bathymetry n°1) during spring/summer representative conditions<br />
(23/06/2008)<br />
22700172-01-00101.docx<br />
DHI Italia
Trans Adriatic Pipeline – TAP, <strong>ESIA</strong> <strong>Albania</strong>, <strong>Annex</strong> 9 - <strong>Sediment</strong> <strong>Dispersion</strong> <strong>Modelling</strong><br />
AAL00-ERM-641-Y-TAE-1010, Rev.: 01 / at05, Page 156 of 278<br />
Latitude [°]<br />
Longitude [°]<br />
Figure 105 Hydrodynamic field at surface for the <strong>Albania</strong>n landfall site (bathymetry n°2)<br />
during spring/summer representative conditions (23/06/2008)<br />
22700172-01-00101.docx<br />
DHI Italia
Trans Adriatic Pipeline – TAP, <strong>ESIA</strong> <strong>Albania</strong>, <strong>Annex</strong> 9 - <strong>Sediment</strong> <strong>Dispersion</strong> <strong>Modelling</strong><br />
AAL00-ERM-641-Y-TAE-1010, Rev.: 01 / at05, Page 157 of 278<br />
Latitude [°]<br />
Longitude [°]<br />
Figure 106 Hydrodynamic field at intermediate depth for the <strong>Albania</strong>n landfall site<br />
(bathymetry n°2) during spring/summer representative conditions<br />
(23/06/2008)<br />
22700172-01-00101.docx<br />
DHI Italia
Trans Adriatic Pipeline – TAP, <strong>ESIA</strong> <strong>Albania</strong>, <strong>Annex</strong> 9 - <strong>Sediment</strong> <strong>Dispersion</strong> <strong>Modelling</strong><br />
AAL00-ERM-641-Y-TAE-1010, Rev.: 01 / at05, Page 158 of 278<br />
Latitude [°]<br />
Longitude [°]<br />
Figure 107 Hydrodynamic field at sea bed depth for the <strong>Albania</strong>n landfall site<br />
(bathymetry n°2) during spring/summer representative conditions<br />
(23/06/2008)<br />
22700172-01-00101.docx<br />
DHI Italia
Trans Adriatic Pipeline – TAP, <strong>ESIA</strong> <strong>Albania</strong>, <strong>Annex</strong> 9 - <strong>Sediment</strong> <strong>Dispersion</strong> <strong>Modelling</strong><br />
AAL00-ERM-641-Y-TAE-1010, Rev.: 01 / at05, Page 159 of 278<br />
Latitude [°]<br />
Longitude [°]<br />
Figure 108 Hydrodynamic field at surface for the <strong>Albania</strong>n landfall site (bathymetry n°3)<br />
during spring/summer representative conditions (23/06/2008)<br />
22700172-01-00101.docx<br />
DHI Italia
Trans Adriatic Pipeline – TAP, <strong>ESIA</strong> <strong>Albania</strong>, <strong>Annex</strong> 9 - <strong>Sediment</strong> <strong>Dispersion</strong> <strong>Modelling</strong><br />
AAL00-ERM-641-Y-TAE-1010, Rev.: 01 / at05, Page 160 of 278<br />
Latitude [°]<br />
Longitude [°]<br />
Figure 109 Hydrodynamic field at intermediate depth for the <strong>Albania</strong>n landfall site<br />
(bathymetry n°3) during spring/summer representative conditions<br />
(23/06/2008)<br />
22700172-01-00101.docx<br />
DHI Italia
Trans Adriatic Pipeline – TAP, <strong>ESIA</strong> <strong>Albania</strong>, <strong>Annex</strong> 9 - <strong>Sediment</strong> <strong>Dispersion</strong> <strong>Modelling</strong><br />
AAL00-ERM-641-Y-TAE-1010, Rev.: 01 / at05, Page 161 of 278<br />
Latitude [°]<br />
Longitude [°]<br />
Figure 110 Hydrodynamic field at sea bed depth for the <strong>Albania</strong>n landfall site<br />
(bathymetry n°3) during spring/summer representative conditions<br />
(23/06/2008)<br />
22700172-01-00101.docx<br />
DHI Italia
Trans Adriatic Pipeline – TAP, <strong>ESIA</strong> <strong>Albania</strong>, <strong>Annex</strong> 9 - <strong>Sediment</strong> <strong>Dispersion</strong> <strong>Modelling</strong><br />
AAL00-ERM-641-Y-TAE-1010, Rev.: 01 / at05, Page 162 of 278<br />
Latitude [°]<br />
Longitude [°]<br />
Figure 111 Hydrodynamic field at surface for the <strong>Albania</strong>n landfall site (bathymetry n°1)<br />
during spring/summer representative conditions (01/07/2008)<br />
22700172-01-00101.docx<br />
DHI Italia
Trans Adriatic Pipeline – TAP, <strong>ESIA</strong> <strong>Albania</strong>, <strong>Annex</strong> 9 - <strong>Sediment</strong> <strong>Dispersion</strong> <strong>Modelling</strong><br />
AAL00-ERM-641-Y-TAE-1010, Rev.: 01 / at05, Page 163 of 278<br />
Latitude [°]<br />
Longitude [°]<br />
Figure 112 Hydrodynamic field at intermediate depth for the <strong>Albania</strong>n landfall site<br />
(bathymetry n°1) during spring/summer representative conditions<br />
(01/07/2008)<br />
22700172-01-00101.docx<br />
DHI Italia
Trans Adriatic Pipeline – TAP, <strong>ESIA</strong> <strong>Albania</strong>, <strong>Annex</strong> 9 - <strong>Sediment</strong> <strong>Dispersion</strong> <strong>Modelling</strong><br />
AAL00-ERM-641-Y-TAE-1010, Rev.: 01 / at05, Page 164 of 278<br />
Latitude [°]<br />
Longitude [°]<br />
Figure 113 Hydrodynamic field at sea bed depth for the <strong>Albania</strong>n landfall site<br />
(bathymetry n°1) during spring/summer representative conditions<br />
(01/07/2008)<br />
22700172-01-00101.docx<br />
DHI Italia
Trans Adriatic Pipeline – TAP, <strong>ESIA</strong> <strong>Albania</strong>, <strong>Annex</strong> 9 - <strong>Sediment</strong> <strong>Dispersion</strong> <strong>Modelling</strong><br />
AAL00-ERM-641-Y-TAE-1010, Rev.: 01 / at05, Page 165 of 278<br />
Latitude [°]<br />
Longitude [°]<br />
Figure 114 Hydrodynamic field at surface for the <strong>Albania</strong>n landfall site (bathymetry n°2)<br />
during spring/summer representative conditions (01/07/2008)<br />
22700172-01-00101.docx<br />
DHI Italia
Trans Adriatic Pipeline – TAP, <strong>ESIA</strong> <strong>Albania</strong>, <strong>Annex</strong> 9 - <strong>Sediment</strong> <strong>Dispersion</strong> <strong>Modelling</strong><br />
AAL00-ERM-641-Y-TAE-1010, Rev.: 01 / at05, Page 166 of 278<br />
Latitude [°]<br />
Longitude [°]<br />
Figure 115 Hydrodynamic field at intermediate depth for the <strong>Albania</strong>n landfall site<br />
(bathymetry n°2) during spring/summer representative conditions<br />
(01/07/2008)<br />
22700172-01-00101.docx<br />
DHI Italia
Trans Adriatic Pipeline – TAP, <strong>ESIA</strong> <strong>Albania</strong>, <strong>Annex</strong> 9 - <strong>Sediment</strong> <strong>Dispersion</strong> <strong>Modelling</strong><br />
AAL00-ERM-641-Y-TAE-1010, Rev.: 01 / at05, Page 167 of 278<br />
Latitude [°]<br />
Longitude [°]<br />
Figure 116 Hydrodynamic field at sea bed depth for the <strong>Albania</strong>n landfall site<br />
(bathymetry n°2) during spring/summer representative conditions<br />
(01/07/2008)<br />
22700172-01-00101.docx<br />
DHI Italia
Trans Adriatic Pipeline – TAP, <strong>ESIA</strong> <strong>Albania</strong>, <strong>Annex</strong> 9 - <strong>Sediment</strong> <strong>Dispersion</strong> <strong>Modelling</strong><br />
AAL00-ERM-641-Y-TAE-1010, Rev.: 01 / at05, Page 168 of 278<br />
Latitude [°]<br />
Longitude [°]<br />
Figure 117 Hydrodynamic field at surface for the <strong>Albania</strong>n landfall site (bathymetry n°3)<br />
during spring/summer representative conditions (01/07/2008)<br />
22700172-01-00101.docx<br />
DHI Italia
Trans Adriatic Pipeline – TAP, <strong>ESIA</strong> <strong>Albania</strong>, <strong>Annex</strong> 9 - <strong>Sediment</strong> <strong>Dispersion</strong> <strong>Modelling</strong><br />
AAL00-ERM-641-Y-TAE-1010, Rev.: 01 / at05, Page 169 of 278<br />
Latitude [°]<br />
Longitude [°]<br />
Figure 118 Hydrodynamic field at intermediate depth for the <strong>Albania</strong>n landfall site<br />
(bathymetry n°3) during spring/summer representative conditions<br />
(01/07/2008)<br />
22700172-01-00101.docx<br />
DHI Italia
Trans Adriatic Pipeline – TAP, <strong>ESIA</strong> <strong>Albania</strong>, <strong>Annex</strong> 9 - <strong>Sediment</strong> <strong>Dispersion</strong> <strong>Modelling</strong><br />
AAL00-ERM-641-Y-TAE-1010, Rev.: 01 / at05, Page 170 of 278<br />
Latitude [°]<br />
Longitude [°]<br />
Figure 119 Hydrodynamic field at sea bed depth for the <strong>Albania</strong>n landfall site<br />
(bathymetry n°3) during spring/summer representative conditions<br />
(01/07/2008)<br />
22700172-01-00101.docx<br />
DHI Italia
Trans Adriatic Pipeline – TAP, <strong>ESIA</strong> <strong>Albania</strong>, <strong>Annex</strong> 9 - <strong>Sediment</strong> <strong>Dispersion</strong> <strong>Modelling</strong><br />
AAL00-ERM-641-Y-TAE-1010, Rev.: 01 / at05, Page 171 of 278<br />
Latitude [°]<br />
Longitude [°]<br />
Figure 120 Hydrodynamic field at surface for the <strong>Albania</strong>n landfall site (bathymetry<br />
includes the temporary deposit of dredged sediment) during the growing<br />
phase of the storm, at the first time step at which the significant wave height<br />
is bigger than 1.0 m (23/06/2008 – h. 7.00)<br />
22700172-01-00101.docx<br />
DHI Italia
Trans Adriatic Pipeline – TAP, <strong>ESIA</strong> <strong>Albania</strong>, <strong>Annex</strong> 9 - <strong>Sediment</strong> <strong>Dispersion</strong> <strong>Modelling</strong><br />
AAL00-ERM-641-Y-TAE-1010, Rev.: 01 / at05, Page 172 of 278<br />
Latitude [°]<br />
Longitude [°]<br />
Figure 121 Hydrodynamic field at intermediate depth for the <strong>Albania</strong>n landfall site<br />
(bathymetry includes the temporary deposit of dredged sediment) during the<br />
growing phase of the storm, at the first time step at which the significant<br />
wave height is bigger than 1.0 m (23/06/2008 – h. 7.00)<br />
22700172-01-00101.docx<br />
DHI Italia
Trans Adriatic Pipeline – TAP, <strong>ESIA</strong> <strong>Albania</strong>, <strong>Annex</strong> 9 - <strong>Sediment</strong> <strong>Dispersion</strong> <strong>Modelling</strong><br />
AAL00-ERM-641-Y-TAE-1010, Rev.: 01 / at05, Page 173 of 278<br />
Latitude [°]<br />
Longitude [°]<br />
Figure 122 Hydrodynamic field at sea bed depth for the <strong>Albania</strong>n landfall site<br />
(bathymetry includes the temporary deposit of dredged sediment) during the<br />
growing phase of the storm, at the first time step at which the significant<br />
wave height is bigger than 1.0 m (23/06/2008 – h. 7.00)<br />
22700172-01-00101.docx<br />
DHI Italia
Trans Adriatic Pipeline – TAP, <strong>ESIA</strong> <strong>Albania</strong>, <strong>Annex</strong> 9 - <strong>Sediment</strong> <strong>Dispersion</strong> <strong>Modelling</strong><br />
AAL00-ERM-641-Y-TAE-1010, Rev.: 01 / at05, Page 174 of 278<br />
Latitude [°]<br />
Longitude [°]<br />
Figure 123 Hydrodynamic field at surface for the <strong>Albania</strong>n landfall site (bathymetry<br />
includes the temporary deposit of dredged sediment) during the peak of the<br />
storm, when the wave event reaches the maximum significant wave height<br />
equal to 2.5 m (23/06/2008 – h. 16.00)<br />
22700172-01-00101.docx<br />
DHI Italia
Trans Adriatic Pipeline – TAP, <strong>ESIA</strong> <strong>Albania</strong>, <strong>Annex</strong> 9 - <strong>Sediment</strong> <strong>Dispersion</strong> <strong>Modelling</strong><br />
AAL00-ERM-641-Y-TAE-1010, Rev.: 01 / at05, Page 175 of 278<br />
Latitude [°]<br />
Longitude [°]<br />
Figure 124 Hydrodynamic field at intermediate depth for the <strong>Albania</strong>n landfall site<br />
(bathymetry includes the temporary deposit of dredged sediment) during the<br />
peak of the storm, when the wave event reaches the maximum significant<br />
wave height equal to 2.5 m (23/06/2008 – h. 16.00)<br />
22700172-01-00101.docx<br />
DHI Italia
Trans Adriatic Pipeline – TAP, <strong>ESIA</strong> <strong>Albania</strong>, <strong>Annex</strong> 9 - <strong>Sediment</strong> <strong>Dispersion</strong> <strong>Modelling</strong><br />
AAL00-ERM-641-Y-TAE-1010, Rev.: 01 / at05, Page 176 of 278<br />
Latitude [°]<br />
Longitude [°]<br />
Figure 125 Hydrodynamic field at sea bed depth for the <strong>Albania</strong>n landfall site<br />
(bathymetry includes the temporary deposit of dredged sediment) during the<br />
peak of the storm, when the wave event reaches the maximum significant<br />
wave height equal to 2.5 m (23/06/2008 – h. 16.00)<br />
22700172-01-00101.docx<br />
DHI Italia
Trans Adriatic Pipeline – TAP, <strong>ESIA</strong> <strong>Albania</strong>, <strong>Annex</strong> 9 - <strong>Sediment</strong> <strong>Dispersion</strong> <strong>Modelling</strong><br />
AAL00-ERM-641-Y-TAE-1010, Rev.: 01 / at05, Page 177 of 278<br />
Latitude [°]<br />
Longitude [°]<br />
Figure 126 Hydrodynamic field at surface for the <strong>Albania</strong>n landfall site (bathymetry<br />
includes the temporary deposit of dredged sediment) during the decreasing<br />
phase of the storm, at the first time step at which the significant wave height<br />
again becomes smaller than 1.0 m (24/06/2008 – h. 11.00)<br />
22700172-01-00101.docx<br />
DHI Italia
Trans Adriatic Pipeline – TAP, <strong>ESIA</strong> <strong>Albania</strong>, <strong>Annex</strong> 9 - <strong>Sediment</strong> <strong>Dispersion</strong> <strong>Modelling</strong><br />
AAL00-ERM-641-Y-TAE-1010, Rev.: 01 / at05, Page 178 of 278<br />
Latitude [°]<br />
Longitude [°]<br />
Figure 127 Hydrodynamic field at intermediate depth for the <strong>Albania</strong>n landfall site<br />
(bathymetry includes the temporary deposit of dredged sediment) during the<br />
decreasing phase of the storm, at the first time step at which the significant<br />
wave height again becomes smaller than 1.0 m (24/06/2008 – h. 11.00)<br />
22700172-01-00101.docx<br />
DHI Italia
Trans Adriatic Pipeline – TAP, <strong>ESIA</strong> <strong>Albania</strong>, <strong>Annex</strong> 9 - <strong>Sediment</strong> <strong>Dispersion</strong> <strong>Modelling</strong><br />
AAL00-ERM-641-Y-TAE-1010, Rev.: 01 / at05, Page 179 of 278<br />
Latitude [°]<br />
Longitude [°]<br />
Figure 128 Hydrodynamic field at sea bed depth for the <strong>Albania</strong>n landfall site<br />
(bathymetry includes the temporary deposit of dredged sediment) during the<br />
decreasing phase of the storm, at the first time step at which the significant<br />
wave height again becomes smaller than 1.0 m (24/06/2008 – h. 11.00)<br />
22700172-01-00101.docx<br />
DHI Italia
Trans Adriatic Pipeline – TAP, <strong>ESIA</strong> <strong>Albania</strong>, <strong>Annex</strong> 9 - <strong>Sediment</strong> <strong>Dispersion</strong> <strong>Modelling</strong><br />
AAL00-ERM-641-Y-TAE-1010, Rev.: 01 / at05, Page 180 of 278<br />
A P P E N D I X E<br />
Plots representing maps of suspended sediment<br />
22700172-01-00101.docx<br />
DHI Italia
Trans Adriatic Pipeline – TAP, <strong>ESIA</strong> <strong>Albania</strong>, <strong>Annex</strong> 9 - <strong>Sediment</strong> <strong>Dispersion</strong> <strong>Modelling</strong><br />
AAL00-ERM-641-Y-TAE-1010, Rev.: 01 / at05, Page 181 of 278<br />
Figure 129 Location of the release points. For points n°1 (P1), n°2 (P2), n°3 (P3), n°4<br />
(P4), due to the expected dredging methodology, two release sources are<br />
considered: one is located inside the channel, where the sediment is dredged,<br />
and one outside the channel, where the material is temporarily deposited. For<br />
point n°5 only one release source, inside the trench, has been assumed.<br />
22700172-01-00101.docx<br />
DHI Italia
Trans Adriatic Pipeline – TAP, <strong>ESIA</strong> <strong>Albania</strong>, <strong>Annex</strong> 9 - <strong>Sediment</strong> <strong>Dispersion</strong> <strong>Modelling</strong><br />
AAL00-ERM-641-Y-TAE-1010, Rev.: 01 / at05, Page 182 of 278<br />
Latitude [°]<br />
Longitude [°]<br />
Figure 130 Suspended <strong>Sediment</strong> Concentration field at surface for the <strong>Albania</strong>n landfall<br />
site (bathymetry n°3) during autumn/winter representative conditions<br />
(04/01/2008) for release point n°1 (LON 19.3734°, LAT 40.7924°)<br />
22700172-01-00101.docx<br />
DHI Italia
Trans Adriatic Pipeline – TAP, <strong>ESIA</strong> <strong>Albania</strong>, <strong>Annex</strong> 9 - <strong>Sediment</strong> <strong>Dispersion</strong> <strong>Modelling</strong><br />
AAL00-ERM-641-Y-TAE-1010, Rev.: 01 / at05, Page 183 of 278<br />
Latitude [°]<br />
Longitude [°]<br />
Figure 131 Suspended <strong>Sediment</strong> Concentration field at intermediate depth for the<br />
<strong>Albania</strong>n landfall site (bathymetry n°3) during autumn/winter representative<br />
conditions (04/01/2008) for release point n°1 (LON 19.3734°, LAT 40.7924°)<br />
22700172-01-00101.docx<br />
DHI Italia
Trans Adriatic Pipeline – TAP, <strong>ESIA</strong> <strong>Albania</strong>, <strong>Annex</strong> 9 - <strong>Sediment</strong> <strong>Dispersion</strong> <strong>Modelling</strong><br />
AAL00-ERM-641-Y-TAE-1010, Rev.: 01 / at05, Page 184 of 278<br />
Latitude [°]<br />
Longitude [°]<br />
Figure 132 Suspended <strong>Sediment</strong> Concentration field at sea bed depth for the <strong>Albania</strong>n<br />
landfall site (bathymetry n°3) during autumn/winter representative<br />
conditions (04/01/2008) for release point n°1 (LON 19.3734°, LAT 40.7924°)<br />
22700172-01-00101.docx<br />
DHI Italia
Trans Adriatic Pipeline – TAP, <strong>ESIA</strong> <strong>Albania</strong>, <strong>Annex</strong> 9 - <strong>Sediment</strong> <strong>Dispersion</strong> <strong>Modelling</strong><br />
AAL00-ERM-641-Y-TAE-1010, Rev.: 01 / at05, Page 185 of 278<br />
Latitude [°]<br />
Longitude [°]<br />
Figure 133 Suspended <strong>Sediment</strong> Concentration field at surface for the <strong>Albania</strong>n landfall<br />
site (bathymetry n°2) during autumn/winter representative conditions<br />
(04/01/2008) for release point n°2 (LON 19.3655°, LAT 40.7921°)<br />
22700172-01-00101.docx<br />
DHI Italia
Trans Adriatic Pipeline – TAP, <strong>ESIA</strong> <strong>Albania</strong>, <strong>Annex</strong> 9 - <strong>Sediment</strong> <strong>Dispersion</strong> <strong>Modelling</strong><br />
AAL00-ERM-641-Y-TAE-1010, Rev.: 01 / at05, Page 186 of 278<br />
Latitude [°]<br />
Longitude [°]<br />
Figure 134 Suspended <strong>Sediment</strong> Concentration field at intermediate depth for the<br />
<strong>Albania</strong>n landfall site (bathymetry n°2) during autumn/winter representative<br />
conditions (04/01/2008) for release point n°2 (LON 19.3655°, LAT 40.7921°)<br />
22700172-01-00101.docx<br />
DHI Italia
Trans Adriatic Pipeline – TAP, <strong>ESIA</strong> <strong>Albania</strong>, <strong>Annex</strong> 9 - <strong>Sediment</strong> <strong>Dispersion</strong> <strong>Modelling</strong><br />
AAL00-ERM-641-Y-TAE-1010, Rev.: 01 / at05, Page 187 of 278<br />
Latitude [°]<br />
Longitude [°]<br />
Figure 135 Suspended <strong>Sediment</strong> Concentration field at sea bed depth for the <strong>Albania</strong>n<br />
landfall site (bathymetry n°2) during autumn/winter representative<br />
conditions (04/01/2008) for release point n°2 (LON 19.3655°, LAT 40.7921°)<br />
22700172-01-00101.docx<br />
DHI Italia
Trans Adriatic Pipeline – TAP, <strong>ESIA</strong> <strong>Albania</strong>, <strong>Annex</strong> 9 - <strong>Sediment</strong> <strong>Dispersion</strong> <strong>Modelling</strong><br />
AAL00-ERM-641-Y-TAE-1010, Rev.: 01 / at05, Page 188 of 278<br />
Latitude [°]<br />
Longitude [°]<br />
Figure 136 Suspended <strong>Sediment</strong> Concentration field at surface for the <strong>Albania</strong>n landfall<br />
site (bathymetry n°2) during autumn/winter representative conditions<br />
(04/01/2008) for release point n°3 (LON 19.3577°, LAT 40.7916°)<br />
22700172-01-00101.docx<br />
DHI Italia
Trans Adriatic Pipeline – TAP, <strong>ESIA</strong> <strong>Albania</strong>, <strong>Annex</strong> 9 - <strong>Sediment</strong> <strong>Dispersion</strong> <strong>Modelling</strong><br />
AAL00-ERM-641-Y-TAE-1010, Rev.: 01 / at05, Page 189 of 278<br />
Latitude [°]<br />
Longitude [°]<br />
Figure 137 Suspended <strong>Sediment</strong> Concentration field at intermediate depth for the<br />
<strong>Albania</strong>n landfall site (bathymetry n°2) during autumn/winter representative<br />
conditions (04/01/2008) for release point n°3 (LON 19.3577°, LAT 40.7916°)<br />
22700172-01-00101.docx<br />
DHI Italia
Trans Adriatic Pipeline – TAP, <strong>ESIA</strong> <strong>Albania</strong>, <strong>Annex</strong> 9 - <strong>Sediment</strong> <strong>Dispersion</strong> <strong>Modelling</strong><br />
AAL00-ERM-641-Y-TAE-1010, Rev.: 01 / at05, Page 190 of 278<br />
Latitude [°]<br />
Longitude [°]<br />
Figure 138 Suspended <strong>Sediment</strong> Concentration field at sea bed depth for the <strong>Albania</strong>n<br />
landfall site (bathymetry n°2) during autumn/winter representative<br />
conditions (04/01/2008) for release point n°3 (LON 19.3577°, LAT 40.7916°)<br />
22700172-01-00101.docx<br />
DHI Italia
Trans Adriatic Pipeline – TAP, <strong>ESIA</strong> <strong>Albania</strong>, <strong>Annex</strong> 9 - <strong>Sediment</strong> <strong>Dispersion</strong> <strong>Modelling</strong><br />
AAL00-ERM-641-Y-TAE-1010, Rev.: 01 / at05, Page 191 of 278<br />
Latitude [°]<br />
Longitude [°]<br />
Figure 139 Suspended <strong>Sediment</strong> Concentration field at surface for the <strong>Albania</strong>n landfall<br />
site (bathymetry n°1) during autumn/winter representative conditions<br />
(04/01/2008) for release point n°4 (LON 19.3500°, LAT 40.7911°)<br />
22700172-01-00101.docx<br />
DHI Italia
Trans Adriatic Pipeline – TAP, <strong>ESIA</strong> <strong>Albania</strong>, <strong>Annex</strong> 9 - <strong>Sediment</strong> <strong>Dispersion</strong> <strong>Modelling</strong><br />
AAL00-ERM-641-Y-TAE-1010, Rev.: 01 / at05, Page 192 of 278<br />
Latitude [°]<br />
Longitude [°]<br />
Figure 140 Suspended <strong>Sediment</strong> Concentration field at intermediate depth for the<br />
<strong>Albania</strong>n landfall site (bathymetry n°1) during autumn/winter representative<br />
conditions (04/01/2008) for release point n°4 (LON 19.3500°, LAT 40.7911°)<br />
22700172-01-00101.docx<br />
DHI Italia
Trans Adriatic Pipeline – TAP, <strong>ESIA</strong> <strong>Albania</strong>, <strong>Annex</strong> 9 - <strong>Sediment</strong> <strong>Dispersion</strong> <strong>Modelling</strong><br />
AAL00-ERM-641-Y-TAE-1010, Rev.: 01 / at05, Page 193 of 278<br />
Latitude [°]<br />
Longitude [°]<br />
Figure 141 Suspended <strong>Sediment</strong> Concentration field at sea bed depth for the <strong>Albania</strong>n<br />
landfall site (bathymetry n°1) during autumn/winter representative<br />
conditions (04/01/2008) for release point n°4 (LON 19.3500°, LAT 40.7911°)<br />
22700172-01-00101.docx<br />
DHI Italia
Trans Adriatic Pipeline – TAP, <strong>ESIA</strong> <strong>Albania</strong>, <strong>Annex</strong> 9 - <strong>Sediment</strong> <strong>Dispersion</strong> <strong>Modelling</strong><br />
AAL00-ERM-641-Y-TAE-1010, Rev.: 01 / at05, Page 194 of 278<br />
Latitude [°]<br />
Longitude [°]<br />
Figure 142 Suspended <strong>Sediment</strong> Concentration field at surface for the <strong>Albania</strong>n landfall<br />
site (bathymetry n°3) during autumn/winter representative conditions<br />
(04/01/2008) for release point n°5 (LON 19.3280°, LAT 40.7897°)<br />
22700172-01-00101.docx<br />
DHI Italia
Trans Adriatic Pipeline – TAP, <strong>ESIA</strong> <strong>Albania</strong>, <strong>Annex</strong> 9 - <strong>Sediment</strong> <strong>Dispersion</strong> <strong>Modelling</strong><br />
AAL00-ERM-641-Y-TAE-1010, Rev.: 01 / at05, Page 195 of 278<br />
Latitude [°]<br />
Longitude [°]<br />
Figure 143 Suspended <strong>Sediment</strong> Concentration field at intermediate depth for the<br />
<strong>Albania</strong>n landfall site (bathymetry n°3) during autumn/winter representative<br />
conditions (04/01/2008) for release point n°5 (LON 19.3280°, LAT 40.7897°)<br />
22700172-01-00101.docx<br />
DHI Italia
Trans Adriatic Pipeline – TAP, <strong>ESIA</strong> <strong>Albania</strong>, <strong>Annex</strong> 9 - <strong>Sediment</strong> <strong>Dispersion</strong> <strong>Modelling</strong><br />
AAL00-ERM-641-Y-TAE-1010, Rev.: 01 / at05, Page 196 of 278<br />
Latitude [°]<br />
Longitude [°]<br />
Figure 144 Suspended <strong>Sediment</strong> Concentration field at sea bed depth for the <strong>Albania</strong>n<br />
landfall site (bathymetry n°3) during autumn/winter representative<br />
conditions (04/01/2008) for release point n°5 (LON 19.3280°, LAT 40.7897°)<br />
22700172-01-00101.docx<br />
DHI Italia
Trans Adriatic Pipeline – TAP, <strong>ESIA</strong> <strong>Albania</strong>, <strong>Annex</strong> 9 - <strong>Sediment</strong> <strong>Dispersion</strong> <strong>Modelling</strong><br />
AAL00-ERM-641-Y-TAE-1010, Rev.: 01 / at05, Page 197 of 278<br />
Latitude [°]<br />
Longitude [°]<br />
Figure 145 Suspended <strong>Sediment</strong> Concentration field at surface for the <strong>Albania</strong>n landfall<br />
site (bathymetry n°3) during autumn/winter representative conditions<br />
(13/01/2008) for release point n°1 (LON 19.3734°, LAT 40.7924°)<br />
22700172-01-00101.docx<br />
DHI Italia
Trans Adriatic Pipeline – TAP, <strong>ESIA</strong> <strong>Albania</strong>, <strong>Annex</strong> 9 - <strong>Sediment</strong> <strong>Dispersion</strong> <strong>Modelling</strong><br />
AAL00-ERM-641-Y-TAE-1010, Rev.: 01 / at05, Page 198 of 278<br />
Latitude [°]<br />
Longitude [°]<br />
Figure 146 Suspended <strong>Sediment</strong> Concentration field at intermediate depth for the<br />
<strong>Albania</strong>n landfall site (bathymetry n°3) during autumn/winter representative<br />
conditions (13/01/2008) for release point n°1 (LON 19.3734°, LAT 40.7924°)<br />
22700172-01-00101.docx<br />
DHI Italia
Trans Adriatic Pipeline – TAP, <strong>ESIA</strong> <strong>Albania</strong>, <strong>Annex</strong> 9 - <strong>Sediment</strong> <strong>Dispersion</strong> <strong>Modelling</strong><br />
AAL00-ERM-641-Y-TAE-1010, Rev.: 01 / at05, Page 199 of 278<br />
Latitude [°]<br />
Longitude [°]<br />
Figure 147 Suspended <strong>Sediment</strong> Concentration field at sea bed depth for the <strong>Albania</strong>n<br />
landfall site (bathymetry n°3) during autumn/winter representative<br />
conditions (13/01/2008) for release point n°1 (LON 19.3734°, LAT 40.7924°)<br />
22700172-01-00101.docx<br />
DHI Italia
Trans Adriatic Pipeline – TAP, <strong>ESIA</strong> <strong>Albania</strong>, <strong>Annex</strong> 9 - <strong>Sediment</strong> <strong>Dispersion</strong> <strong>Modelling</strong><br />
AAL00-ERM-641-Y-TAE-1010, Rev.: 01 / at05, Page 200 of 278<br />
Latitude [°]<br />
Longitude [°]<br />
Figure 148 Suspended <strong>Sediment</strong> Concentration field at surface for the <strong>Albania</strong>n landfall<br />
site (bathymetry n°2) during autumn/winter representative conditions<br />
(13/01/2008) for release point n°2 (LON 19.3655°, LAT 40.7921°)<br />
22700172-01-00101.docx<br />
DHI Italia
Trans Adriatic Pipeline – TAP, <strong>ESIA</strong> <strong>Albania</strong>, <strong>Annex</strong> 9 - <strong>Sediment</strong> <strong>Dispersion</strong> <strong>Modelling</strong><br />
AAL00-ERM-641-Y-TAE-1010, Rev.: 01 / at05, Page 201 of 278<br />
Latitude [°]<br />
Longitude [°]<br />
Figure 149 Suspended <strong>Sediment</strong> Concentration field at intermediate depth for the<br />
<strong>Albania</strong>n landfall site (bathymetry n°2) during autumn/winter representative<br />
conditions (13/01/2008) for release point n°2 (LON 19.3655°, LAT 40.7921°)<br />
22700172-01-00101.docx<br />
DHI Italia
Trans Adriatic Pipeline – TAP, <strong>ESIA</strong> <strong>Albania</strong>, <strong>Annex</strong> 9 - <strong>Sediment</strong> <strong>Dispersion</strong> <strong>Modelling</strong><br />
AAL00-ERM-641-Y-TAE-1010, Rev.: 01 / at05, Page 202 of 278<br />
Latitude [°]<br />
Longitude [°]<br />
Figure 150 Suspended <strong>Sediment</strong> Concentration field at sea bed depth for the <strong>Albania</strong>n<br />
landfall site (bathymetry n°2) during autumn/winter representative<br />
conditions (13/01/2008) for release point n°2 (LON 19.3655°, LAT 40.7921°)<br />
22700172-01-00101.docx<br />
DHI Italia
Trans Adriatic Pipeline – TAP, <strong>ESIA</strong> <strong>Albania</strong>, <strong>Annex</strong> 9 - <strong>Sediment</strong> <strong>Dispersion</strong> <strong>Modelling</strong><br />
AAL00-ERM-641-Y-TAE-1010, Rev.: 01 / at05, Page 203 of 278<br />
Latitude [°]<br />
Longitude [°]<br />
Figure 151 Suspended <strong>Sediment</strong> Concentration field at surface for the <strong>Albania</strong>n landfall<br />
site (bathymetry n°2) during autumn/winter representative conditions<br />
(13/01/2008) for release point n°3 (LON 19.3577°, LAT 40.7916°)<br />
22700172-01-00101.docx<br />
DHI Italia
Trans Adriatic Pipeline – TAP, <strong>ESIA</strong> <strong>Albania</strong>, <strong>Annex</strong> 9 - <strong>Sediment</strong> <strong>Dispersion</strong> <strong>Modelling</strong><br />
AAL00-ERM-641-Y-TAE-1010, Rev.: 01 / at05, Page 204 of 278<br />
Latitude [°]<br />
Longitude [°]<br />
Figure 152 Suspended <strong>Sediment</strong> Concentration field at intermediate depth for the<br />
<strong>Albania</strong>n landfall site (bathymetry n°2) during autumn/winter representative<br />
conditions (13/01/2008) for release point n°3 (LON 19.3577°, LAT 40.7916°)<br />
22700172-01-00101.docx<br />
DHI Italia
Trans Adriatic Pipeline – TAP, <strong>ESIA</strong> <strong>Albania</strong>, <strong>Annex</strong> 9 - <strong>Sediment</strong> <strong>Dispersion</strong> <strong>Modelling</strong><br />
AAL00-ERM-641-Y-TAE-1010, Rev.: 01 / at05, Page 205 of 278<br />
Latitude [°]<br />
Longitude [°]<br />
Figure 153 Suspended <strong>Sediment</strong> Concentration field at sea bed depth for the <strong>Albania</strong>n<br />
landfall site (bathymetry n°2) during autumn/winter representative<br />
conditions (13/01/2008) for release point n°3 (LON 19.3577°, LAT 40.7916°)<br />
22700172-01-00101.docx<br />
DHI Italia
Trans Adriatic Pipeline – TAP, <strong>ESIA</strong> <strong>Albania</strong>, <strong>Annex</strong> 9 - <strong>Sediment</strong> <strong>Dispersion</strong> <strong>Modelling</strong><br />
AAL00-ERM-641-Y-TAE-1010, Rev.: 01 / at05, Page 206 of 278<br />
Latitude [°]<br />
Longitude [°]<br />
Figure 154 Suspended <strong>Sediment</strong> Concentration field at surface for the <strong>Albania</strong>n landfall<br />
site (bathymetry n°1) during autumn/winter representative conditions<br />
(13/01/2008) for release point n°4 (LON 19.3500°, LAT 40.7911°)<br />
22700172-01-00101.docx<br />
DHI Italia
Trans Adriatic Pipeline – TAP, <strong>ESIA</strong> <strong>Albania</strong>, <strong>Annex</strong> 9 - <strong>Sediment</strong> <strong>Dispersion</strong> <strong>Modelling</strong><br />
AAL00-ERM-641-Y-TAE-1010, Rev.: 01 / at05, Page 207 of 278<br />
Latitude [°]<br />
Longitude [°]<br />
Figure 155 Suspended <strong>Sediment</strong> Concentration field at intermediate depth for the<br />
<strong>Albania</strong>n landfall site (bathymetry n°1) during autumn/winter representative<br />
conditions (13/01/2008) for release point n°4 (LON 19.3500°, LAT 40.7911°)<br />
22700172-01-00101.docx<br />
DHI Italia
Trans Adriatic Pipeline – TAP, <strong>ESIA</strong> <strong>Albania</strong>, <strong>Annex</strong> 9 - <strong>Sediment</strong> <strong>Dispersion</strong> <strong>Modelling</strong><br />
AAL00-ERM-641-Y-TAE-1010, Rev.: 01 / at05, Page 208 of 278<br />
Latitude [°]<br />
Longitude [°]<br />
Figure 156 Suspended <strong>Sediment</strong> Concentration field at sea bed depth for the <strong>Albania</strong>n<br />
landfall site (bathymetry n°1) during autumn/winter representative<br />
conditions (13/01/2008) for release point n°4 (LON 19.3500°, LAT 40.7911°)<br />
22700172-01-00101.docx<br />
DHI Italia
Trans Adriatic Pipeline – TAP, <strong>ESIA</strong> <strong>Albania</strong>, <strong>Annex</strong> 9 - <strong>Sediment</strong> <strong>Dispersion</strong> <strong>Modelling</strong><br />
AAL00-ERM-641-Y-TAE-1010, Rev.: 01 / at05, Page 209 of 278<br />
Latitude [°]<br />
Longitude [°]<br />
Figure 157 Suspended <strong>Sediment</strong> Concentration field at surface for the <strong>Albania</strong>n landfall<br />
site (bathymetry n°3) during autumn/winter representative conditions<br />
(13/01/2008) for release point n°5 (LON 19.3280°, LAT 40.7897°)<br />
22700172-01-00101.docx<br />
DHI Italia
Trans Adriatic Pipeline – TAP, <strong>ESIA</strong> <strong>Albania</strong>, <strong>Annex</strong> 9 - <strong>Sediment</strong> <strong>Dispersion</strong> <strong>Modelling</strong><br />
AAL00-ERM-641-Y-TAE-1010, Rev.: 01 / at05, Page 210 of 278<br />
Latitude [°]<br />
Longitude [°]<br />
Figure 158 Suspended <strong>Sediment</strong> Concentration field at intermediate depth for the<br />
<strong>Albania</strong>n landfall site (bathymetry n°3) during autumn/winter representative<br />
conditions (13/01/2008) for release point n°5 (LON 19.3280°, LAT 40.7897°)<br />
22700172-01-00101.docx<br />
DHI Italia
Trans Adriatic Pipeline – TAP, <strong>ESIA</strong> <strong>Albania</strong>, <strong>Annex</strong> 9 - <strong>Sediment</strong> <strong>Dispersion</strong> <strong>Modelling</strong><br />
AAL00-ERM-641-Y-TAE-1010, Rev.: 01 / at05, Page 211 of 278<br />
Latitude [°]<br />
Longitude [°]<br />
Figure 159 Suspended <strong>Sediment</strong> Concentration field at sea bed depth for the <strong>Albania</strong>n<br />
landfall site (bathymetry n°3) during autumn/winter representative<br />
conditions (13/01/2008) for release point n°5 (LON 19.3280°, LAT 40.7897°)<br />
22700172-01-00101.docx<br />
DHI Italia
Trans Adriatic Pipeline – TAP, <strong>ESIA</strong> <strong>Albania</strong>, <strong>Annex</strong> 9 - <strong>Sediment</strong> <strong>Dispersion</strong> <strong>Modelling</strong><br />
AAL00-ERM-641-Y-TAE-1010, Rev.: 01 / at05, Page 212 of 278<br />
Latitude [°]<br />
Longitude [°]<br />
Figure 160 Suspended <strong>Sediment</strong> Concentration field at surface for the <strong>Albania</strong>n landfall<br />
site (bathymetry n°3) during spring/summer representative conditions<br />
(23/06/2008) for release point n°1 (LON 19.3734°, LAT 40.7924°)<br />
22700172-01-00101.docx<br />
DHI Italia
Trans Adriatic Pipeline – TAP, <strong>ESIA</strong> <strong>Albania</strong>, <strong>Annex</strong> 9 - <strong>Sediment</strong> <strong>Dispersion</strong> <strong>Modelling</strong><br />
AAL00-ERM-641-Y-TAE-1010, Rev.: 01 / at05, Page 213 of 278<br />
Latitude [°]<br />
Longitude [°]<br />
Figure 161 Suspended <strong>Sediment</strong> Concentration field at intermediate depth for the<br />
<strong>Albania</strong>n landfall site (bathymetry n°3) during spring/summer representative<br />
conditions (23/06/2008) for release point n°1 (LON 19.3734°, LAT 40.7924°)<br />
22700172-01-00101.docx<br />
DHI Italia
Trans Adriatic Pipeline – TAP, <strong>ESIA</strong> <strong>Albania</strong>, <strong>Annex</strong> 9 - <strong>Sediment</strong> <strong>Dispersion</strong> <strong>Modelling</strong><br />
AAL00-ERM-641-Y-TAE-1010, Rev.: 01 / at05, Page 214 of 278<br />
Latitude [°]<br />
Longitude [°]<br />
Figure 162 Suspended <strong>Sediment</strong> Concentration field at sea bed depth for the <strong>Albania</strong>n<br />
landfall site (bathymetry n°3) during spring/summer representative<br />
conditions (23/06/2008) for release point n°1 (LON 19.3734°, LAT 40.7924°)<br />
22700172-01-00101.docx<br />
DHI Italia
Trans Adriatic Pipeline – TAP, <strong>ESIA</strong> <strong>Albania</strong>, <strong>Annex</strong> 9 - <strong>Sediment</strong> <strong>Dispersion</strong> <strong>Modelling</strong><br />
AAL00-ERM-641-Y-TAE-1010, Rev.: 01 / at05, Page 215 of 278<br />
Latitude [°]<br />
Longitude [°]<br />
Figure 163 Suspended <strong>Sediment</strong> Concentration field at surface for the <strong>Albania</strong>n landfall<br />
site (bathymetry n°2) during spring/summer representative conditions<br />
(23/06/2008) for release point n°2 (LON 19.3655°, LAT 40.7921°)<br />
22700172-01-00101.docx<br />
DHI Italia
Trans Adriatic Pipeline – TAP, <strong>ESIA</strong> <strong>Albania</strong>, <strong>Annex</strong> 9 - <strong>Sediment</strong> <strong>Dispersion</strong> <strong>Modelling</strong><br />
AAL00-ERM-641-Y-TAE-1010, Rev.: 01 / at05, Page 216 of 278<br />
Latitude [°]<br />
Longitude [°]<br />
Figure 164 Suspended <strong>Sediment</strong> Concentration field at intermediate depth for the<br />
<strong>Albania</strong>n landfall site (bathymetry n°2) during spring/summer representative<br />
conditions (23/06/2008) for release point n°2 (LON 19.3655°, LAT 40.7921°)<br />
22700172-01-00101.docx<br />
DHI Italia
Trans Adriatic Pipeline – TAP, <strong>ESIA</strong> <strong>Albania</strong>, <strong>Annex</strong> 9 - <strong>Sediment</strong> <strong>Dispersion</strong> <strong>Modelling</strong><br />
AAL00-ERM-641-Y-TAE-1010, Rev.: 01 / at05, Page 217 of 278<br />
Latitude [°]<br />
Longitude [°]<br />
Figure 165 Suspended <strong>Sediment</strong> Concentration field at sea bed depth for the <strong>Albania</strong>n<br />
landfall site (bathymetry n°2) during spring/summer representative<br />
conditions (23/06/2008) for release point n°2 (LON 19.3655°, LAT 40.7921°)<br />
22700172-01-00101.docx<br />
DHI Italia
Trans Adriatic Pipeline – TAP, <strong>ESIA</strong> <strong>Albania</strong>, <strong>Annex</strong> 9 - <strong>Sediment</strong> <strong>Dispersion</strong> <strong>Modelling</strong><br />
AAL00-ERM-641-Y-TAE-1010, Rev.: 01 / at05, Page 218 of 278<br />
Latitude [°]<br />
Longitude [°]<br />
Figure 166 Suspended <strong>Sediment</strong> Concentration field at surface for the <strong>Albania</strong>n landfall<br />
site (bathymetry n°2) during spring/summer representative conditions<br />
(23/06/2008) for release point n°3 (LON 19.3577°, LAT 40.7916°)<br />
22700172-01-00101.docx<br />
DHI Italia
Trans Adriatic Pipeline – TAP, <strong>ESIA</strong> <strong>Albania</strong>, <strong>Annex</strong> 9 - <strong>Sediment</strong> <strong>Dispersion</strong> <strong>Modelling</strong><br />
AAL00-ERM-641-Y-TAE-1010, Rev.: 01 / at05, Page 219 of 278<br />
Latitude [°]<br />
Longitude [°]<br />
Figure 167 Suspended <strong>Sediment</strong> Concentration field at intermediate depth for the<br />
<strong>Albania</strong>n landfall site (bathymetry n°2) during spring/summer representative<br />
conditions (23/06/2008) for release point n°3 (LON 19.3577°, LAT 40.7916°)<br />
22700172-01-00101.docx<br />
DHI Italia
Trans Adriatic Pipeline – TAP, <strong>ESIA</strong> <strong>Albania</strong>, <strong>Annex</strong> 9 - <strong>Sediment</strong> <strong>Dispersion</strong> <strong>Modelling</strong><br />
AAL00-ERM-641-Y-TAE-1010, Rev.: 01 / at05, Page 220 of 278<br />
Latitude [°]<br />
Longitude [°]<br />
Figure 168 Suspended <strong>Sediment</strong> Concentration field at sea bed depth for the <strong>Albania</strong>n<br />
landfall site (bathymetry n°2) during spring/summer representative<br />
conditions (23/06/2008) for release point n°3 (LON 19.3577°, LAT 40.7916°)<br />
22700172-01-00101.docx<br />
DHI Italia
Trans Adriatic Pipeline – TAP, <strong>ESIA</strong> <strong>Albania</strong>, <strong>Annex</strong> 9 - <strong>Sediment</strong> <strong>Dispersion</strong> <strong>Modelling</strong><br />
AAL00-ERM-641-Y-TAE-1010, Rev.: 01 / at05, Page 221 of 278<br />
Latitude [°]<br />
Longitude [°]<br />
Figure 169 Suspended <strong>Sediment</strong> Concentration field at surface for the <strong>Albania</strong>n landfall<br />
site (bathymetry n°1) during spring/summer representative conditions<br />
(23/06/2008) for release point n°4 (LON 19.3500°, LAT 40.7911°)<br />
22700172-01-00101.docx<br />
DHI Italia
Trans Adriatic Pipeline – TAP, <strong>ESIA</strong> <strong>Albania</strong>, <strong>Annex</strong> 9 - <strong>Sediment</strong> <strong>Dispersion</strong> <strong>Modelling</strong><br />
AAL00-ERM-641-Y-TAE-1010, Rev.: 01 / at05, Page 222 of 278<br />
Latitude [°]<br />
Longitude [°]<br />
Figure 170 Suspended <strong>Sediment</strong> Concentration field at intermediate depth for the<br />
<strong>Albania</strong>n landfall site (bathymetry n°1) during spring/summer representative<br />
conditions (23/06/2008) for release point n°4 (LON 19.3500°, LAT 40.7911°)<br />
22700172-01-00101.docx<br />
DHI Italia
Trans Adriatic Pipeline – TAP, <strong>ESIA</strong> <strong>Albania</strong>, <strong>Annex</strong> 9 - <strong>Sediment</strong> <strong>Dispersion</strong> <strong>Modelling</strong><br />
AAL00-ERM-641-Y-TAE-1010, Rev.: 01 / at05, Page 223 of 278<br />
Latitude [°]<br />
Longitude [°]<br />
Figure 171 Suspended <strong>Sediment</strong> Concentration field at sea bed depth for the <strong>Albania</strong>n<br />
landfall site (bathymetry n°1) during spring/summer representative<br />
conditions (23/06/2008) for release point n°4 (LON 19.3500°, LAT 40.7911°)<br />
22700172-01-00101.docx<br />
DHI Italia
Trans Adriatic Pipeline – TAP, <strong>ESIA</strong> <strong>Albania</strong>, <strong>Annex</strong> 9 - <strong>Sediment</strong> <strong>Dispersion</strong> <strong>Modelling</strong><br />
AAL00-ERM-641-Y-TAE-1010, Rev.: 01 / at05, Page 224 of 278<br />
Latitude [°]<br />
Longitude [°]<br />
Figure 172 Suspended <strong>Sediment</strong> Concentration field at surface for the <strong>Albania</strong>n landfall<br />
site (bathymetry n°3) during spring/summer representative conditions<br />
(23/06/2008) for release point n°5 (LON 19.3280°, LAT 40.7897°)<br />
22700172-01-00101.docx<br />
DHI Italia
Trans Adriatic Pipeline – TAP, <strong>ESIA</strong> <strong>Albania</strong>, <strong>Annex</strong> 9 - <strong>Sediment</strong> <strong>Dispersion</strong> <strong>Modelling</strong><br />
AAL00-ERM-641-Y-TAE-1010, Rev.: 01 / at05, Page 225 of 278<br />
Latitude [°]<br />
Longitude [°]<br />
Figure 173 Suspended <strong>Sediment</strong> Concentration field at intermediate depth for the<br />
<strong>Albania</strong>n landfall site (bathymetry n°3) during spring/summer representative<br />
conditions (23/06/2008) for release point n°5 (LON 19.3280°, LAT 40.7897°)<br />
22700172-01-00101.docx<br />
DHI Italia
Trans Adriatic Pipeline – TAP, <strong>ESIA</strong> <strong>Albania</strong>, <strong>Annex</strong> 9 - <strong>Sediment</strong> <strong>Dispersion</strong> <strong>Modelling</strong><br />
AAL00-ERM-641-Y-TAE-1010, Rev.: 01 / at05, Page 226 of 278<br />
Latitude [°]<br />
Longitude [°]<br />
Figure 174 Suspended <strong>Sediment</strong> Concentration field at sea bed depth for the <strong>Albania</strong>n<br />
landfall site (bathymetry n°3) during spring/summer representative<br />
conditions (23/06/2008) for release point n°5 (LON 19.3280°, LAT 40.7897°)<br />
22700172-01-00101.docx<br />
DHI Italia
Trans Adriatic Pipeline – TAP, <strong>ESIA</strong> <strong>Albania</strong>, <strong>Annex</strong> 9 - <strong>Sediment</strong> <strong>Dispersion</strong> <strong>Modelling</strong><br />
AAL00-ERM-641-Y-TAE-1010, Rev.: 01 / at05, Page 227 of 278<br />
Latitude [°]<br />
Longitude [°]<br />
Figure 175 Suspended <strong>Sediment</strong> Concentration field at surface for the <strong>Albania</strong>n landfall<br />
site (bathymetry n°3) during spring/summer representative conditions<br />
(01/07/2008) for release point n°1 (LON 19.3734°, LAT 40.7924°)<br />
22700172-01-00101.docx<br />
DHI Italia
Trans Adriatic Pipeline – TAP, <strong>ESIA</strong> <strong>Albania</strong>, <strong>Annex</strong> 9 - <strong>Sediment</strong> <strong>Dispersion</strong> <strong>Modelling</strong><br />
AAL00-ERM-641-Y-TAE-1010, Rev.: 01 / at05, Page 228 of 278<br />
Latitude [°]<br />
Longitude [°]<br />
Figure 176 Suspended <strong>Sediment</strong> Concentration field at intermediate depth for the<br />
<strong>Albania</strong>n landfall site (bathymetry n°3) during spring/summer representative<br />
conditions (01/07/2008) for release point n°1 (LON 19.3734°, LAT 40.7924°)<br />
22700172-01-00101.docx<br />
DHI Italia
Trans Adriatic Pipeline – TAP, <strong>ESIA</strong> <strong>Albania</strong>, <strong>Annex</strong> 9 - <strong>Sediment</strong> <strong>Dispersion</strong> <strong>Modelling</strong><br />
AAL00-ERM-641-Y-TAE-1010, Rev.: 01 / at05, Page 229 of 278<br />
Latitude [°]<br />
Longitude [°]<br />
Figure 177 Suspended <strong>Sediment</strong> Concentration field at sea bed depth for the <strong>Albania</strong>n<br />
landfall site (bathymetry n°3) during spring/summer representative<br />
conditions (01/07/2008) for release point n°1 (LON 19.3734°, LAT 40.7924°)<br />
22700172-01-00101.docx<br />
DHI Italia
Trans Adriatic Pipeline – TAP, <strong>ESIA</strong> <strong>Albania</strong>, <strong>Annex</strong> 9 - <strong>Sediment</strong> <strong>Dispersion</strong> <strong>Modelling</strong><br />
AAL00-ERM-641-Y-TAE-1010, Rev.: 01 / at05, Page 230 of 278<br />
Latitude [°]<br />
Longitude [°]<br />
Figure 178 Suspended <strong>Sediment</strong> Concentration field at surface for the <strong>Albania</strong>n landfall<br />
site (bathymetry n°2) during spring/summer representative conditions<br />
(01/07/2008) for release point n°2 (LON 19.3655°, LAT 40.7921°)<br />
22700172-01-00101.docx<br />
DHI Italia
Trans Adriatic Pipeline – TAP, <strong>ESIA</strong> <strong>Albania</strong>, <strong>Annex</strong> 9 - <strong>Sediment</strong> <strong>Dispersion</strong> <strong>Modelling</strong><br />
AAL00-ERM-641-Y-TAE-1010, Rev.: 01 / at05, Page 231 of 278<br />
Latitude [°]<br />
Longitude [°]<br />
Figure 179 Suspended <strong>Sediment</strong> Concentration field at intermediate depth for the<br />
<strong>Albania</strong>n landfall site (bathymetry n°2) during spring/summer representative<br />
conditions (01/07/2008) for release point n°2 (LON 19.3655°, LAT 40.7921°)<br />
22700172-01-00101.docx<br />
DHI Italia
Trans Adriatic Pipeline – TAP, <strong>ESIA</strong> <strong>Albania</strong>, <strong>Annex</strong> 9 - <strong>Sediment</strong> <strong>Dispersion</strong> <strong>Modelling</strong><br />
AAL00-ERM-641-Y-TAE-1010, Rev.: 01 / at05, Page 232 of 278<br />
Latitude [°]<br />
Longitude [°]<br />
Figure 180 Suspended <strong>Sediment</strong> Concentration field at sea bed depth for the <strong>Albania</strong>n<br />
landfall site (bathymetry n°2) during spring/summer representative<br />
conditions (01/07/2008) for release point n°2 (LON 19.3655°, LAT 40.7921°)<br />
22700172-01-00101.docx<br />
DHI Italia
Trans Adriatic Pipeline – TAP, <strong>ESIA</strong> <strong>Albania</strong>, <strong>Annex</strong> 9 - <strong>Sediment</strong> <strong>Dispersion</strong> <strong>Modelling</strong><br />
AAL00-ERM-641-Y-TAE-1010, Rev.: 01 / at05, Page 233 of 278<br />
Latitude [°]<br />
Longitude [°]<br />
Figure 181 Suspended <strong>Sediment</strong> Concentration field at surface for the <strong>Albania</strong>n landfall<br />
site (bathymetry n°2) during spring/summer representative conditions<br />
(01/07/2008) for release point n°3 (LON 19.3577°, LAT 40.7916°)<br />
22700172-01-00101.docx<br />
DHI Italia
Trans Adriatic Pipeline – TAP, <strong>ESIA</strong> <strong>Albania</strong>, <strong>Annex</strong> 9 - <strong>Sediment</strong> <strong>Dispersion</strong> <strong>Modelling</strong><br />
AAL00-ERM-641-Y-TAE-1010, Rev.: 01 / at05, Page 234 of 278<br />
Latitude [°]<br />
Longitude [°]<br />
Figure 182 Suspended <strong>Sediment</strong> Concentration field at intermediate depth for the<br />
<strong>Albania</strong>n landfall site (bathymetry n°2) during spring/summer representative<br />
conditions (01/07/2008) for release point n°3 (LON 19.3577°, LAT 40.7916°)<br />
22700172-01-00101.docx<br />
DHI Italia
Trans Adriatic Pipeline – TAP, <strong>ESIA</strong> <strong>Albania</strong>, <strong>Annex</strong> 9 - <strong>Sediment</strong> <strong>Dispersion</strong> <strong>Modelling</strong><br />
AAL00-ERM-641-Y-TAE-1010, Rev.: 01 / at05, Page 235 of 278<br />
Latitude [°]<br />
Longitude [°]<br />
Figure 183 Suspended <strong>Sediment</strong> Concentration field at sea bed depth for the <strong>Albania</strong>n<br />
landfall site (bathymetry n°2) during spring/summer representative<br />
conditions (01/07/2008) for release point n°3 (LON 19.3577°, LAT 40.7916°)<br />
22700172-01-00101.docx<br />
DHI Italia
Trans Adriatic Pipeline – TAP, <strong>ESIA</strong> <strong>Albania</strong>, <strong>Annex</strong> 9 - <strong>Sediment</strong> <strong>Dispersion</strong> <strong>Modelling</strong><br />
AAL00-ERM-641-Y-TAE-1010, Rev.: 01 / at05, Page 236 of 278<br />
Latitude [°]<br />
Longitude [°]<br />
Figure 184 Suspended <strong>Sediment</strong> Concentration field at surface for the <strong>Albania</strong>n landfall<br />
site (bathymetry n°1) during spring/summer representative conditions<br />
(01/07/2008) for release point n°4 (LON 19.3500°, LAT 40.7911°)<br />
22700172-01-00101.docx<br />
DHI Italia
Trans Adriatic Pipeline – TAP, <strong>ESIA</strong> <strong>Albania</strong>, <strong>Annex</strong> 9 - <strong>Sediment</strong> <strong>Dispersion</strong> <strong>Modelling</strong><br />
AAL00-ERM-641-Y-TAE-1010, Rev.: 01 / at05, Page 237 of 278<br />
Latitude [°]<br />
Longitude [°]<br />
Figure 185 Suspended <strong>Sediment</strong> Concentration field at intermediate depth for the<br />
<strong>Albania</strong>n landfall site (bathymetry n°1) during spring/summer representative<br />
conditions (01/07/2008) for release point n°4 (LON 19.3500°, LAT 40.7911°)<br />
22700172-01-00101.docx<br />
DHI Italia
Trans Adriatic Pipeline – TAP, <strong>ESIA</strong> <strong>Albania</strong>, <strong>Annex</strong> 9 - <strong>Sediment</strong> <strong>Dispersion</strong> <strong>Modelling</strong><br />
AAL00-ERM-641-Y-TAE-1010, Rev.: 01 / at05, Page 238 of 278<br />
Latitude [°]<br />
Longitude [°]<br />
Figure 186 Suspended <strong>Sediment</strong> Concentration field at sea bed depth for the <strong>Albania</strong>n<br />
landfall site (bathymetry n°1) during spring/summer representative<br />
conditions (01/07/2008) for release point n°4 (LON 19.3500°, LAT 40.7911°)<br />
22700172-01-00101.docx<br />
DHI Italia
Trans Adriatic Pipeline – TAP, <strong>ESIA</strong> <strong>Albania</strong>, <strong>Annex</strong> 9 - <strong>Sediment</strong> <strong>Dispersion</strong> <strong>Modelling</strong><br />
AAL00-ERM-641-Y-TAE-1010, Rev.: 01 / at05, Page 239 of 278<br />
Latitude [°]<br />
Longitude [°]<br />
Figure 187 Suspended <strong>Sediment</strong> Concentration field at surface for the <strong>Albania</strong>n landfall<br />
site (bathymetry n°3) during spring/summer representative conditions<br />
(01/07/2008) for release point n°5 (LON 19.3280°, LAT 40.7897°)<br />
22700172-01-00101.docx<br />
DHI Italia
Trans Adriatic Pipeline – TAP, <strong>ESIA</strong> <strong>Albania</strong>, <strong>Annex</strong> 9 - <strong>Sediment</strong> <strong>Dispersion</strong> <strong>Modelling</strong><br />
AAL00-ERM-641-Y-TAE-1010, Rev.: 01 / at05, Page 240 of 278<br />
Latitude [°]<br />
Longitude [°]<br />
Figure 188 Suspended <strong>Sediment</strong> Concentration field at intermediate depth for the<br />
<strong>Albania</strong>n landfall site (bathymetry n°3) during spring/summer representative<br />
conditions (01/07/2008) for release point n°5 (LON 19.3280°, LAT 40.7897°)<br />
22700172-01-00101.docx<br />
DHI Italia
Trans Adriatic Pipeline – TAP, <strong>ESIA</strong> <strong>Albania</strong>, <strong>Annex</strong> 9 - <strong>Sediment</strong> <strong>Dispersion</strong> <strong>Modelling</strong><br />
AAL00-ERM-641-Y-TAE-1010, Rev.: 01 / at05, Page 241 of 278<br />
Latitude [°]<br />
Longitude [°]<br />
Figure 189 Suspended <strong>Sediment</strong> Concentration field at sea bed depth for the <strong>Albania</strong>n<br />
landfall site (bathymetry n°3) during spring/summer representative<br />
conditions (01/07/2008) for release point n°5 (LON 19.3280°, LAT 40.7897°)<br />
22700172-01-00101.docx<br />
DHI Italia
Trans Adriatic Pipeline – TAP, <strong>ESIA</strong> <strong>Albania</strong>, <strong>Annex</strong> 9 - <strong>Sediment</strong> <strong>Dispersion</strong> <strong>Modelling</strong><br />
AAL00-ERM-641-Y-TAE-1010, Rev.: 01 / at05, Page 242 of 278<br />
Latitude [°]<br />
Longitude [°]<br />
Figure 190 Suspended <strong>Sediment</strong> Concentration field at surface for the <strong>Albania</strong>n landfall<br />
site (bathymetry includes the temporary deposit of dredged sediment) during<br />
the growing phase of the storm, at the first time step at which the significant<br />
wave height is bigger than 1.0 m (23/06/2008 – h. 7.00)<br />
22700172-01-00101.docx<br />
DHI Italia
Trans Adriatic Pipeline – TAP, <strong>ESIA</strong> <strong>Albania</strong>, <strong>Annex</strong> 9 - <strong>Sediment</strong> <strong>Dispersion</strong> <strong>Modelling</strong><br />
AAL00-ERM-641-Y-TAE-1010, Rev.: 01 / at05, Page 243 of 278<br />
Latitude [°]<br />
Longitude [°]<br />
Figure 191 Suspended <strong>Sediment</strong> Concentration field at intermediate depth for the<br />
<strong>Albania</strong>n landfall site (bathymetry includes the temporary deposit of dredged<br />
sediment) during the growing phase of the storm, at the first time step at<br />
which the significant wave height is bigger than 1.0 m (23/06/2008 – h.<br />
7.00)<br />
22700172-01-00101.docx<br />
DHI Italia
Trans Adriatic Pipeline – TAP, <strong>ESIA</strong> <strong>Albania</strong>, <strong>Annex</strong> 9 - <strong>Sediment</strong> <strong>Dispersion</strong> <strong>Modelling</strong><br />
AAL00-ERM-641-Y-TAE-1010, Rev.: 01 / at05, Page 244 of 278<br />
Latitude [°]<br />
Longitude [°]<br />
Figure 192 Suspended <strong>Sediment</strong> Concentration field at sea bed depth for the <strong>Albania</strong>n<br />
landfall site (bathymetry includes the temporary deposit of dredged<br />
sediment) during the growing phase of the storm, at the first time step at<br />
which the significant wave height is bigger than 1.0 m (23/06/2008 – h.<br />
7.00)<br />
22700172-01-00101.docx<br />
DHI Italia
Trans Adriatic Pipeline – TAP, <strong>ESIA</strong> <strong>Albania</strong>, <strong>Annex</strong> 9 - <strong>Sediment</strong> <strong>Dispersion</strong> <strong>Modelling</strong><br />
AAL00-ERM-641-Y-TAE-1010, Rev.: 01 / at05, Page 245 of 278<br />
Latitude [°]<br />
Longitude [°]<br />
Figure 193 Suspended <strong>Sediment</strong> Concentration field at surface for the <strong>Albania</strong>n landfall<br />
site (bathymetry includes the temporary deposit of dredged sediment) during<br />
the peak of the storm, when the wave event reaches the maximum<br />
significant wave height equal to 2.5 m (23/06/2008 – h. 16.00)<br />
22700172-01-00101.docx<br />
DHI Italia
Trans Adriatic Pipeline – TAP, <strong>ESIA</strong> <strong>Albania</strong>, <strong>Annex</strong> 9 - <strong>Sediment</strong> <strong>Dispersion</strong> <strong>Modelling</strong><br />
AAL00-ERM-641-Y-TAE-1010, Rev.: 01 / at05, Page 246 of 278<br />
Latitude [°]<br />
Longitude [°]<br />
Figure 194 Suspended <strong>Sediment</strong> Concentration field at intermediate depth for the<br />
<strong>Albania</strong>n landfall site (bathymetry includes the temporary deposit of dredged<br />
sediment) during the peak of the storm, when the wave event reaches the<br />
maximum significant wave height equal to 2.5 m (23/06/2008 – h. 16.00)<br />
22700172-01-00101.docx<br />
DHI Italia
Trans Adriatic Pipeline – TAP, <strong>ESIA</strong> <strong>Albania</strong>, <strong>Annex</strong> 9 - <strong>Sediment</strong> <strong>Dispersion</strong> <strong>Modelling</strong><br />
AAL00-ERM-641-Y-TAE-1010, Rev.: 01 / at05, Page 247 of 278<br />
Latitude [°]<br />
Longitude [°]<br />
Figure 195 Suspended <strong>Sediment</strong> Concentration field at sea bed depth for the <strong>Albania</strong>n<br />
landfall site (bathymetry includes the temporary deposit of dredged<br />
sediment) during the peak of the storm, when the wave event reaches the<br />
maximum significant wave height equal to 2.5 m (23/06/2008 – h. 16.00)<br />
22700172-01-00101.docx<br />
DHI Italia
Trans Adriatic Pipeline – TAP, <strong>ESIA</strong> <strong>Albania</strong>, <strong>Annex</strong> 9 - <strong>Sediment</strong> <strong>Dispersion</strong> <strong>Modelling</strong><br />
AAL00-ERM-641-Y-TAE-1010, Rev.: 01 / at05, Page 248 of 278<br />
Latitude [°]<br />
Longitude [°]<br />
Figure 196 Suspended <strong>Sediment</strong> Concentration field at surface for the <strong>Albania</strong>n landfall<br />
site (bathymetry includes the temporary deposit of dredged sediment) during<br />
the decreasing phase of the storm, at the first time step at which the<br />
significant wave height again becomes smaller than 1.0 m (24/06/2008 – h.<br />
11.00)<br />
22700172-01-00101.docx<br />
DHI Italia
Trans Adriatic Pipeline – TAP, <strong>ESIA</strong> <strong>Albania</strong>, <strong>Annex</strong> 9 - <strong>Sediment</strong> <strong>Dispersion</strong> <strong>Modelling</strong><br />
AAL00-ERM-641-Y-TAE-1010, Rev.: 01 / at05, Page 249 of 278<br />
Latitude [°]<br />
Longitude [°]<br />
Figure 197 Suspended <strong>Sediment</strong> Concentration field at intermediate depth for the<br />
<strong>Albania</strong>n landfall site (bathymetry includes the temporary deposit of dredged<br />
sediment) during the decreasing phase of the storm, at the first time step at<br />
which the significant wave height again becomes smaller than 1.0 m<br />
(24/06/2008 – h. 11.00)<br />
22700172-01-00101.docx<br />
DHI Italia
Trans Adriatic Pipeline – TAP, <strong>ESIA</strong> <strong>Albania</strong>, <strong>Annex</strong> 9 - <strong>Sediment</strong> <strong>Dispersion</strong> <strong>Modelling</strong><br />
AAL00-ERM-641-Y-TAE-1010, Rev.: 01 / at05, Page 250 of 278<br />
Latitude [°]<br />
Longitude [°]<br />
Figure 198 Suspended <strong>Sediment</strong> Concentration field at sea bed depth for the <strong>Albania</strong>n<br />
landfall site (bathymetry includes the temporary deposit of dredged<br />
sediment) during the decreasing phase of the storm, at the first time step at<br />
which the significant wave height again becomes smaller than 1.0 m<br />
(24/06/2008 – h. 11.00)<br />
22700172-01-00101.docx<br />
DHI Italia
Trans Adriatic Pipeline – TAP, <strong>ESIA</strong> <strong>Albania</strong>, <strong>Annex</strong> 9 - <strong>Sediment</strong> <strong>Dispersion</strong> <strong>Modelling</strong><br />
AAL00-ERM-641-Y-TAE-1010, Rev.: 01 / at05, Page 251 of 278<br />
A P P E N D I X F<br />
Description of MIKE 3 HD FM Model<br />
22700172-01-00101.docx<br />
DHI Italia
Trans Adriatic Pipeline – TAP, <strong>ESIA</strong> <strong>Albania</strong>, <strong>Annex</strong> 9 - <strong>Sediment</strong> <strong>Dispersion</strong> <strong>Modelling</strong><br />
AAL00-ERM-641-Y-TAE-1010, Rev.: 01 / at05, Page 252 of 278<br />
MIKE 21 & MIKE 3 FLOW MODEL FM<br />
Hydrodynamic Module<br />
Short Description
Trans Adriatic Pipeline – TAP, <strong>ESIA</strong> <strong>Albania</strong>, <strong>Annex</strong> 9 - <strong>Sediment</strong> <strong>Dispersion</strong> <strong>Modelling</strong><br />
AAL00-ERM-641-Y-TAE-1010, Rev.: 01 / at05, Page 253 of 278<br />
MIKE 21 & MIKE 3 FLOW MODEL FM<br />
Agern Allé 5<br />
DK-2970 Hørsholm<br />
Denmark<br />
Tel: +45 4516 9200<br />
Support: +45 4516 9333<br />
Fax: +45 4516 9292<br />
mikebydhi@dhigroup.com<br />
www.mikebydhi.com<br />
MIKE213_HD_FM_Short_Description.docx/ AJS/EBR/2011Short_Descriptions.lsm/2011-06-10<br />
Hydrodynamic Module
Trans Adriatic Pipeline – TAP, <strong>ESIA</strong> <strong>Albania</strong>, <strong>Annex</strong> 9 - <strong>Sediment</strong> <strong>Dispersion</strong> <strong>Modelling</strong><br />
AAL00-ERM-641-Y-TAE-1010, Rev.: 01 / at05, Page 254 of 278<br />
MIKE 21 & MIKE 3 Flow Model FM<br />
The Flow Model FM is a comprehensive<br />
modelling system for two- and three-dimensional<br />
water modelling developed by DHI. The 2D and<br />
3D models carry the same names as the classic<br />
DHI model versions MIKE 21 & MIKE 3 with an<br />
„FM‟ added referring to the type of model grid -<br />
Flexible Mesh.<br />
The modelling system has been developed for<br />
complex applications within oceanographic,<br />
coastal and estuarine environments. However,<br />
being a general modelling system for 2D and 3D<br />
free-surface flows it may also be applied for<br />
studies of inland surface waters, e.g. overland<br />
flooding and lakes or reservoirs.<br />
MIKE 21 & MIKE 3 Flow Model FM is a general<br />
hydrodynamic flow modelling system based on a finite<br />
volume method on an unstructured mesh<br />
DHI‟s Flexible Mesh (FM) series includes the<br />
following:<br />
Flow Model FM modules<br />
Hydrodynamic Module, HD<br />
Transport Module, TR<br />
Ecology Module, ECO Lab<br />
Oil Spill Module, ELOS<br />
Sand Transport Module, ST<br />
Mud Transport Module, MT<br />
Particle Tracking Module, PT<br />
Wave module<br />
Spectral Wave Module, SW<br />
The FM Series meets the increasing demand for<br />
realistic representations of nature, both with<br />
regard to „look alike‟ and to its capability to model<br />
coupled processes, e.g. coupling between currents,<br />
waves and sediments. Coupling of modules is<br />
managed in the Coupled Model FM.<br />
All modules are supported by advanced user<br />
interfaces including efficient and sophisticated<br />
tools for mesh generation, data management,<br />
2D/3D visualization, etc. In combination with<br />
comprehensive documentation and support, the<br />
FM series forms a unique professional software<br />
tool for consultancy services related to design,<br />
operation and maintenance tasks within the marine<br />
environment.<br />
An unstructured grid provides an optimal degree<br />
of flexibility in the representation of complex<br />
geometries and enables smooth representations of<br />
boundaries. Small elements may be used in areas<br />
where more detail is desired, and larger elements<br />
used where less detail is needed, optimising<br />
information for a given amount of computational<br />
time.<br />
The spatial discretisation of the governing<br />
equations is performed using a cell-centred finite<br />
volume method. In the horizontal plane an<br />
unstructured grid is used while a structured mesh<br />
is used in the vertical domain (3D).<br />
This document provides a short description of the<br />
Hydrodynamic Module included in MIKE 21 &<br />
MIKE 3 Flow Model FM.<br />
Example of computational mesh for Tamar Estuary, UK<br />
Short Description Page 1
Trans Adriatic Pipeline – TAP, <strong>ESIA</strong> <strong>Albania</strong>, <strong>Annex</strong> 9 - <strong>Sediment</strong> <strong>Dispersion</strong> <strong>Modelling</strong><br />
AAL00-ERM-641-Y-TAE-1010, Rev.: 01 / at05, Page 255 of 278<br />
MIKE 21 & MIKE 3 FLOW MODEL FM<br />
MIKE 21 & MIKE 3 FLOW MODEL FM supports both Cartesian and spherical coordinates. Spherical coordinates are<br />
usually applied for regional and global sea circulation applications. The chart shows the computational mesh and<br />
bathymetry for the planet Earth generated by the MIKE Zero Mesh Generator<br />
MIKE 21 & MIKE 3 Flow Model FM -<br />
Hydrodynamic Module<br />
The Hydrodynamic Module provides the basis for<br />
computations performed in many other modules,<br />
but can also be used alone. It simulates the water<br />
level variations and flows in response to a variety<br />
of forcing functions on flood plains, in lakes,<br />
estuaries and coastal areas.<br />
Application Areas<br />
The Hydrodynamic Module included in MIKE 21<br />
& MIKE 3 Flow Model FM simulates unsteady<br />
flow taking into account density variations,<br />
bathymetry and external forcings.<br />
The choice between 2D and 3D model depends on<br />
a number of factors. For example, in shallow<br />
waters, wind and tidal current are often sufficient<br />
to keep the water column well-mixed, i.e.<br />
homogeneous in salinity and temperature. In such<br />
cases a 2D model can be used. In water bodies<br />
with stratification, either by density or by species<br />
(ecology), a 3D model should be used. This is also<br />
the case for enclosed or semi-enclosed waters<br />
where wind-driven circulation occurs.<br />
Typical application areas are<br />
Assessment of hydrographic conditions for<br />
design, construction and operation of<br />
structures and plants in stratified and nonstratified<br />
waters<br />
Environmental impact assessment studies<br />
Coastal and oceanographic circulation studies<br />
Optimization of port and coastal protection<br />
infrastructures<br />
Lake and reservoir hydrodynamics<br />
Cooling water, recirculation and desalination<br />
Coastal flooding and storm surge<br />
Inland flooding and overland flow modelling<br />
Forecast and warning systems<br />
Example of a global tide application of MIKE 21 Flow<br />
Model FM. Results from such a model can be used as<br />
boundary conditions for regional scale forecast or hindcast<br />
models<br />
Page 2<br />
Hydrodynamic Module
Trans Adriatic Pipeline – TAP, <strong>ESIA</strong> <strong>Albania</strong>, <strong>Annex</strong> 9 - <strong>Sediment</strong> <strong>Dispersion</strong> <strong>Modelling</strong><br />
AAL00-ERM-641-Y-TAE-1010, Rev.: 01 / at05, Page 256 of 278<br />
The MIKE 21 & MIKE 3 Flow Model FM also<br />
support spherical coordinates, which makes both<br />
models particularly applicable for global and<br />
regional sea scale applications.<br />
Typical applications with the MIKE 21 & MIKE 3 Flow<br />
Model FM include cooling water recirculation and<br />
ecological impact assessment (eutrophication)<br />
The Hydrodynamic Module is together with the<br />
Transport Module (TR) used to simulate the<br />
spreading and fate of dissolved and suspended<br />
substances. This module combination is applied in<br />
tracer simulations, flushing and simple water<br />
quality studies.<br />
Example of a flow field in Tampa Bay, FL, simulated by<br />
MIKE 21 Flow Model FM<br />
Tracer simulation of single component from outlet in the<br />
Adriatic, simulated by MIKE 21 Flow Model FM HD+TR<br />
Study of thermal recirculation<br />
Prediction of ecosystem behaviour using the MIKE 21 &<br />
MIKE 3 Flow Model FM together with ECO Lab<br />
Short Description Page 3
Trans Adriatic Pipeline – TAP, <strong>ESIA</strong> <strong>Albania</strong>, <strong>Annex</strong> 9 - <strong>Sediment</strong> <strong>Dispersion</strong> <strong>Modelling</strong><br />
AAL00-ERM-641-Y-TAE-1010, Rev.: 01 / at05, Page 257 of 278<br />
MIKE 21 & MIKE 3 FLOW MODEL FM<br />
The Hydrodynamic Module can be coupled to the<br />
Ecological Module (ECO Lab) to form the basis<br />
for environmental water quality studies<br />
comprising multiple components.<br />
Furthermore, the Hydrodynamic Module can be<br />
coupled to sediment models for the calculation of<br />
sediment transport. The Sand Transport Module<br />
and Mud Transport Module can be applied to<br />
simulate transport of non-cohesive and cohesive<br />
sediments, respectively.<br />
In the coastal zone the transport is mainly<br />
determined by wave conditions and associated<br />
wave-induced currents. The wave-induced<br />
currents are generated by the gradients in radiation<br />
stresses that occur in the surf zone. The Spectral<br />
Wave Module can be used to calculate the wave<br />
conditions and associated radiation stresses.<br />
Coastal application (morphology) with coupled MIKE 21<br />
HD, SW and ST, Torsminde harbour Denmark<br />
Model bathymetry of Taravao Bay, Tahiti<br />
Example of Cross reef currents in Taravao Bay, Tahiti simulated with MIKE 3 Flow Model FM. The circulation and renewal of<br />
water inside the reef is dependent on the tides, the meteorological conditions and the cross reef currents, thus the circulation<br />
model includes the effects of wave induced cross reef currents<br />
Page 4<br />
Hydrodynamic Module
Trans Adriatic Pipeline – TAP, <strong>ESIA</strong> <strong>Albania</strong>, <strong>Annex</strong> 9 - <strong>Sediment</strong> <strong>Dispersion</strong> <strong>Modelling</strong><br />
AAL00-ERM-641-Y-TAE-1010, Rev.: 01 / at05, Page 258 of 278<br />
Computational Features<br />
The main features and effects included in<br />
simulations with the MIKE 21 & MIKE 3 Flow<br />
Model FM – Hydrodynamic Module are the<br />
following:<br />
Flooding and drying<br />
Momentum dispersion<br />
Bottom shear stress<br />
Coriolis force<br />
Wind shear stress<br />
Barometric pressure gradients<br />
Ice coverage<br />
Tidal potential<br />
Precipitation/evaporation<br />
Wave radiation stresses<br />
Sources and sinks<br />
Model Equations<br />
The modelling system is based on the numerical<br />
solution of the two/three-dimensional incompressible<br />
Reynolds averaged Navier-Stokes equations<br />
subject to the assumptions of Boussinesq and of<br />
hydrostatic pressure. Thus, the model consists of<br />
continuity, momentum, temperature, salinity and<br />
density equations and it is closed by a turbulent<br />
closure scheme. The density does not depend on<br />
the pressure, but only on the temperature and the<br />
salinity.<br />
For the 3D model, the free surface is taken into<br />
account using a sigma-coordinate transformation<br />
approach or using a combination of a sigma and z-<br />
level coordinate system.<br />
Below the governing equations are presented<br />
using Cartesian coordinates.<br />
The local continuity equation is written as<br />
u<br />
v<br />
w<br />
S<br />
x<br />
y<br />
z<br />
and the two horizontal momentum equations for<br />
the x- and y-component, respectively<br />
2<br />
u<br />
u<br />
vu<br />
wu<br />
<br />
t<br />
x<br />
y<br />
z<br />
1 pa<br />
g<br />
<br />
x<br />
<br />
0<br />
0<br />
1 pa<br />
g<br />
<br />
y<br />
<br />
<br />
<br />
z<br />
<br />
dz F<br />
x<br />
<br />
fv g <br />
x<br />
u<br />
u<br />
<br />
<br />
t usS<br />
z<br />
z<br />
<br />
2<br />
v<br />
v<br />
uv<br />
wv<br />
<br />
fu g <br />
t<br />
y<br />
x<br />
z<br />
y<br />
0<br />
0<br />
<br />
<br />
z<br />
<br />
v<br />
<br />
dz Fv<br />
<br />
t vs<br />
S<br />
y<br />
z<br />
z<br />
<br />
Temperature and salinity<br />
In the Hydrodynamic Module, calculations of the<br />
transports of temperature, T, and salinity, s follow<br />
the general transport-diffusion equations as<br />
T<br />
uT<br />
vT<br />
wT<br />
F<br />
t<br />
x<br />
y<br />
z<br />
s<br />
us<br />
vs<br />
ws<br />
F<br />
t<br />
x<br />
y<br />
z<br />
T<br />
<br />
D<br />
z<br />
<br />
s<br />
v<br />
<br />
D<br />
z<br />
<br />
T<br />
<br />
z<br />
v<br />
<br />
<br />
<br />
H T S<br />
s<br />
<br />
s<br />
z<br />
<br />
s<br />
s<br />
S<br />
Unstructured mesh technique gives the maximum degree of<br />
flexibility, for example: 1) Control of node distribution allows for<br />
optimal usage of nodes 2) Adoption of mesh resolution to the<br />
relevant physical scales 3) Depth-adaptive and boundary-fitted<br />
mesh. Below is shown an example from Ho Bay Denmark with the<br />
approach channel to the Port of Esbjerg<br />
Short Description Page 5
Trans Adriatic Pipeline – TAP, <strong>ESIA</strong> <strong>Albania</strong>, <strong>Annex</strong> 9 - <strong>Sediment</strong> <strong>Dispersion</strong> <strong>Modelling</strong><br />
AAL00-ERM-641-Y-TAE-1010, Rev.: 01 / at05, Page 259 of 278<br />
MIKE 21 & MIKE 3 FLOW MODEL FM<br />
The horizontal diffusion terms are defined by<br />
<br />
, s h h <br />
x<br />
x<br />
y<br />
y<br />
<br />
F<br />
F D D T<br />
s<br />
T ,<br />
The equations for two-dimensional flow are<br />
obtained by integration of the equations over<br />
depth.<br />
Heat exchange with the atmosphere is also<br />
included.<br />
Symbol list<br />
t<br />
time<br />
x, y, z: Cartesian coordinates<br />
u, v, w: flow velocity components<br />
T, s: temperature and salinity<br />
D v :<br />
H :<br />
vertical turbulent (eddy) diffusion<br />
coefficient<br />
source term due to heat exchange<br />
with atmosphere<br />
S: magnitude of discharge due to point<br />
sources<br />
T s , s s : temperature and salinity of source<br />
F T , F s , F c :<br />
D h :<br />
h :<br />
horizontal diffusion terms<br />
horizontal diffusion coefficient<br />
depth<br />
Solution Technique<br />
The spatial discretisation of the primitive<br />
equations is performed using a cell-centred finite<br />
volume method. The spatial domain is discretised<br />
by subdivision of the continuum into nonoverlapping<br />
elements/cells.<br />
In the horizontal plane an unstructured mesh is<br />
used while a structured mesh is used in the vertical<br />
domain of the 3D model. In the 2D model the<br />
elements can be triangles or quadrilateral<br />
elements. In the 3D model the elements can be<br />
prisms or bricks whose horizontal faces are<br />
triangles and quadrilateral elements, respectively.<br />
Model Input<br />
Input data can be divided into the following<br />
groups:<br />
Domain and time parameters:<br />
computational mesh (the coordinate type is<br />
defined in the computational mesh file)<br />
and bathymetry<br />
simulation length and overall time step<br />
Calibration factors<br />
bed resistance<br />
momentum dispersion coefficients<br />
wind friction factors<br />
Initial conditions<br />
water surface level<br />
velocity components<br />
Boundary conditions<br />
closed<br />
water level<br />
discharge<br />
Other driving forces<br />
wind speed and direction<br />
tide<br />
source/sink discharge<br />
wave radiation stresses<br />
Principle of 3D mesh<br />
View button on all the GUIs in MIKE 21 & MIKE 3 FM HD<br />
for graphical view of input and output files<br />
Page 6<br />
Hydrodynamic Module
Trans Adriatic Pipeline – TAP, <strong>ESIA</strong> <strong>Albania</strong>, <strong>Annex</strong> 9 - <strong>Sediment</strong> <strong>Dispersion</strong> <strong>Modelling</strong><br />
AAL00-ERM-641-Y-TAE-1010, Rev.: 01 / at05, Page 260 of 278<br />
3D visualization of a computational mesh<br />
The Mesh Generator is an efficient MIKE Zero tool for the<br />
generation and handling of unstructured meshes, including<br />
the definition and editing of boundaries<br />
Providing MIKE 21 & MIKE 3 Flow Model FM<br />
with a suitable mesh is essential for obtaining<br />
reliable results from the models. Setting up the<br />
mesh includes the appropriate selection of the area<br />
to be modelled, adequate resolution of the<br />
bathymetry, flow, wind and wave fields under<br />
consideration and definition of codes for defining<br />
boundaries.<br />
If wind data is not available from an atmospheric<br />
meteorological model, the wind fields (e.g.<br />
cyclones) can be determined by using the windgenerating<br />
programs available in MIKE 21<br />
Toolbox.<br />
Global winds (pressure & wind data) can be<br />
downloaded for immediate use in your simulation.<br />
The sources of data are from GFS courtesy of<br />
NCEP, NOAA. By specifying the location,<br />
orientation and grid dimensions, the data is<br />
returned to you in the correct format as a spatial<br />
varying grid series or a time series. The link is:<br />
www.mikebydhi.com/Download/DocumentsAndTools/Tools/Av<br />
ailableData.aspx<br />
2D visualization of a computational mesh (Odense<br />
Estuary)<br />
Bathymetric values for the mesh generation can<br />
e.g. be obtained from the MIKE by DHI product<br />
MIKE C-Map. MIKE C-Map is an efficient tool<br />
for extracting depth data and predicted tidal<br />
elevation from the world-wide Electronic Chart<br />
Database CM-93 Edition 3.0 from Jeppesen<br />
Norway.<br />
The chart shows a hindcast wind field in the North Sea<br />
and Baltic Sea as wind speed and wind direction<br />
Short Description Page 7
Trans Adriatic Pipeline – TAP, <strong>ESIA</strong> <strong>Albania</strong>, <strong>Annex</strong> 9 - <strong>Sediment</strong> <strong>Dispersion</strong> <strong>Modelling</strong><br />
AAL00-ERM-641-Y-TAE-1010, Rev.: 01 / at05, Page 261 of 278<br />
MIKE 21 & MIKE 3 FLOW MODEL FM<br />
Model Output<br />
Computed output results at each mesh element and<br />
for each time step consist of:<br />
Basic variables<br />
water depth and surface elevation<br />
flux densities in main directions<br />
velocities in main directions<br />
densities, temperatures and salinities<br />
Additional variables<br />
Current speed and direction<br />
Wind velocities<br />
Air pressure<br />
Drag coefficient<br />
Precipitation/evaporation<br />
Courant/CFL number<br />
Eddy viscosity<br />
Element area/volume<br />
The output results can be saved in defined points,<br />
lines and areas. In the case of 3D calculations the<br />
results are saved in a selection of layers.<br />
Output from MIKE 21 & MIKE 3 Flow Model<br />
FM is typically post-processed using the Data<br />
Viewer available in the common MIKE Zero shell.<br />
The Data Viewer is a tool for analysis and<br />
visualization of unstructured data, e.g. to view<br />
meshes, spectra, bathymetries, results files of<br />
different format with graphical extraction of time<br />
series and line series from plan view and import of<br />
graphical overlays.<br />
Vector and contour plot of current speed at a vertical<br />
profile defined along a line in Data Viewer in MIKE Zero<br />
Validation<br />
Prior to the first release of MIKE 21 & MIKE 3<br />
Flow Model FM the model has successfully been<br />
applied to a number of rather basic idealized<br />
situations for which the results can be compared<br />
with analytical solutions or information from the<br />
literature.<br />
The domain is a channel with a parabola-shaped bump in<br />
the middle. The upstream (western) boundary is a<br />
constant flux and the downstream (eastern) boundary is a<br />
constant elevation. Below: the total depths for the<br />
stationary hydraulic jump at convergence. Red line: 2D<br />
setup, green line: 3D setup, black line: analytical solution<br />
The Data Viewer in MIKE Zero – an efficient tool for<br />
analysis and visualization of unstructured data including<br />
processing of animations. Above screen dump shows<br />
surface elevations from a model setup covering Port of<br />
Copenhagen<br />
Page 8<br />
Hydrodynamic Module
Trans Adriatic Pipeline – TAP, <strong>ESIA</strong> <strong>Albania</strong>, <strong>Annex</strong> 9 - <strong>Sediment</strong> <strong>Dispersion</strong> <strong>Modelling</strong><br />
AAL00-ERM-641-Y-TAE-1010, Rev.: 01 / at05, Page 262 of 278<br />
A dam-break flow in an L-shaped channel (a, b, c):<br />
a) Outline of model setup showing the location of<br />
gauging points<br />
c) Contour plots of the surface elevation at T = 1.6 s<br />
(top) and T = 4.8 s (bottom)<br />
b) Comparison between simulated and measured water<br />
levels at the six gauge locations.<br />
(Blue) coarse mesh (black) fine mesh and (red)<br />
measurements<br />
Example from Ho Bay, a tidal estuary (barrier island coast)<br />
in South-West Denmark with access channel to the Port of<br />
Esbjerg. Below: Comparison between measured and<br />
simulated water levels<br />
The model has also been applied and tested in<br />
numerous natural geophysical conditions; ocean<br />
scale, inner shelves, estuaries, lakes and overland,<br />
which are more realistic and complicated than<br />
academic and laboratory tests.<br />
Short Description Page 9
Trans Adriatic Pipeline – TAP, <strong>ESIA</strong> <strong>Albania</strong>, <strong>Annex</strong> 9 - <strong>Sediment</strong> <strong>Dispersion</strong> <strong>Modelling</strong><br />
AAL00-ERM-641-Y-TAE-1010, Rev.: 01 / at05, Page 263 of 278<br />
MIKE 21 & MIKE 3 FLOW MODEL FM<br />
The user interface of the MIKE 21 and MIKE 3 Flow Model FM (Hydrodynamic Module), including an example of the<br />
extensive Online Help system<br />
Graphical User Interface<br />
The MIKE 21 & MIKE 3 Flow Model FM are<br />
operated through a fully Windows integrated<br />
graphical user interface (GUI). Support is<br />
provided at each stage by an Online Help system.<br />
The common MIKE Zero shell provides entries<br />
for common data file editors, plotting facilities and<br />
utilities such as the Mesh Generator and Data<br />
Viewer.<br />
Overview of the common MIKE Zero utilities<br />
Page 10<br />
Hydrodynamic Module
Trans Adriatic Pipeline – TAP, <strong>ESIA</strong> <strong>Albania</strong>, <strong>Annex</strong> 9 - <strong>Sediment</strong> <strong>Dispersion</strong> <strong>Modelling</strong><br />
AAL00-ERM-641-Y-TAE-1010, Rev.: 01 / at05, Page 264 of 278<br />
Parallelisation<br />
The computational engines of the MIKE 21/3 FM<br />
series are available in versions that have been<br />
parallelised using both shared memory (OpenMP)<br />
as well as distributed memory architecture (MPI).<br />
The result is much faster simulations on systems<br />
with many cores.<br />
MIKE 21/3 FM speed-up using multicore PCs for Release<br />
2011 with distributed memory architecture (blue) and<br />
shared memory architecture that was part of Release 2009<br />
(green)<br />
Hardware and Operating System<br />
Requirements<br />
The MIKE 21 and MIKE 3 Flow Model FM<br />
Hydrodynamic Module supports Microsoft<br />
Windows XP Professional Edition (32 and 64 bit),<br />
Microsoft Windows Vista Business (32 and 64 bit)<br />
and Microsoft Windows 7 Enterprise (32 and 64<br />
bit). Microsoft Internet Explorer 6.0 (or higher) is<br />
required for network license management as well<br />
as for accessing the Online Help.<br />
The recommended minimum hardware<br />
requirements for executing MIKE 21 & MIKE 3<br />
Flow Model FM are listed below:<br />
Support<br />
News about new features, applications, papers,<br />
updates, patches, etc. are available here:<br />
www.mikebydhi.com/Download/DocumentsAndTools.aspx<br />
For further information on MIKE 21 and MIKE 3<br />
Flow Model FM software, please contact your<br />
local DHI office or the Software Support Centre:<br />
MIKE by DHI<br />
DHI<br />
Agern Allé 5<br />
DK-2970 Hørsholm<br />
Denmark<br />
Tel: +45 4516 9333<br />
Fax: +45 4516 9292<br />
www.mikebydhi.com<br />
mikebydhi@dhigroup.com<br />
References<br />
The MIKE 21 & MIKE 3 Flow Model FM are<br />
provided with comprehensive user guides, online<br />
help, scientific documentation, application<br />
examples and step-by-step training examples.<br />
Processor:<br />
Memory (RAM):<br />
Hard disk:<br />
Monitor:<br />
Graphic card:<br />
Media:<br />
3 GHz PC (or higher)<br />
4 GB (or higher)<br />
160 GB (or higher)<br />
SVGA, resolution 1024x768<br />
32 MB RAM (or higher),<br />
32 bit true colour<br />
CD-ROM/DVD drive, 20 x<br />
speed (or higher)<br />
Short Description Page 11
Trans Adriatic Pipeline – TAP, <strong>ESIA</strong> <strong>Albania</strong>, <strong>Annex</strong> 9 - <strong>Sediment</strong> <strong>Dispersion</strong> <strong>Modelling</strong><br />
AAL00-ERM-641-Y-TAE-1010, Rev.: 01 / at05, Page 265 of 278<br />
MIKE 21 & MIKE 3 FLOW MODEL FM<br />
Petersen, N.H., Rasch, P. “<strong>Modelling</strong> of the Asian<br />
Tsunami off the Coast of Northern Sumatra”,<br />
presented at the 3rd Asia-Pacific DHI Software<br />
Conference in Kuala Lumpur, Malaysia, 21-22<br />
February, 2005<br />
French, B. and Kerper, D. Salinity Control as a<br />
Mitigation Strategy for Habitat Improvement of<br />
Impacted Estuaries. 7 th Annual EPA Wetlands<br />
Workshop, NJ, USA 2004.<br />
DHI Note, “Flood Plain <strong>Modelling</strong> using<br />
unstructured Finite Volume Technique” January<br />
2004 – download from<br />
www.mikebydhi.com/Download/DocumentsAndTools/PapersA<br />
ndDocs/Hydrodynamics.aspx<br />
Page 12<br />
Hydrodynamic Module
Trans Adriatic Pipeline – TAP, <strong>ESIA</strong> <strong>Albania</strong>, <strong>Annex</strong> 9 - <strong>Sediment</strong> <strong>Dispersion</strong> <strong>Modelling</strong><br />
AAL00-ERM-641-Y-TAE-1010, Rev.: 01 / at05, Page 266 of 278<br />
A P P E N D I X G<br />
Description of MIKE 3 MT FM Model<br />
22700172-01-00101.docx<br />
DHI Italia
Trans Adriatic Pipeline – TAP, <strong>ESIA</strong> <strong>Albania</strong>, <strong>Annex</strong> 9 - <strong>Sediment</strong> <strong>Dispersion</strong> <strong>Modelling</strong><br />
AAL00-ERM-641-Y-TAE-1010, Rev.: 01 / at05, Page 267 of 278<br />
MIKE 21 & MIKE 3 FLOW MODEL FM<br />
Mud Transport Module<br />
Short Description
Trans Adriatic Pipeline – TAP, <strong>ESIA</strong> <strong>Albania</strong>, <strong>Annex</strong> 9 - <strong>Sediment</strong> <strong>Dispersion</strong> <strong>Modelling</strong><br />
AAL00-ERM-641-Y-TAE-1010, Rev.: 01 / at05, Page 268 of 278<br />
MIKE 21 & MIKE 3 FLOW MODEL FM<br />
Agern Allé 5<br />
DK-2970 Hørsholm<br />
Denmark<br />
Tel: +45 4516 9200<br />
Support: +45 4516 9333<br />
Fax: +45 4516 9292<br />
mikebydhi@dhigroup.com<br />
www.mikebydhi.com<br />
MIKE213_MT_FM_ShortDescription.docx/AJS/HKH/ULU/KAE/2011Short_Descriptions.lsm/2011-06-17<br />
Mud Transport Module
Trans Adriatic Pipeline – TAP, <strong>ESIA</strong> <strong>Albania</strong>, <strong>Annex</strong> 9 - <strong>Sediment</strong> <strong>Dispersion</strong> <strong>Modelling</strong><br />
AAL00-ERM-641-Y-TAE-1010, Rev.: 01 / at05, Page 269 of 278<br />
MIKE 21 & MIKE 3 Flow Model FM<br />
– Mud Transport Module<br />
This document describes the Mud Transport<br />
Module (MT) under the comprehensive modelling<br />
system for two- and three-dimensional flows, the<br />
Flexible Mesh series, developed by DHI.<br />
The MT module includes a state-of-the-art mud<br />
transport model that simulates the erosion,<br />
transport, settling and deposition of cohesive<br />
sediment in marine, brackish and freshwater areas.<br />
The module also takes into account fine-grained<br />
non-cohesive material.<br />
With the FM series it is possible to combine and<br />
run the modules dynamically. If the morphological<br />
changes within the area of interest are within the<br />
same order of magnitude as the variation in the<br />
water depth, then it is possible to take the<br />
morphological impact on the hydrodynamics into<br />
consideration. This option for dynamic feedback<br />
between update of seabed and flow may be<br />
relevant to apply in shallow areas, for example,<br />
where long term effects are being considered.<br />
Furthermore it may be relevant in shallow areas<br />
where capital or considerable maintenance<br />
dredging is planned and similarly at sites where<br />
disposal of the dredged material takes place.<br />
Example of spreading of dredged material in Øresund,<br />
Denmark<br />
The MT module is an add-on module to MIKE 21<br />
& MIKE 3 Flow Model FM. It requires a coupling<br />
to the hydrodynamic solver and to the transport<br />
solver for passive components (Advection<br />
<strong>Dispersion</strong> module). The hydrodynamic basis is<br />
obtained with the MIKE 21 or MIKE 3 FM HD<br />
module. The influence of waves on the<br />
erosion/deposition patterns can be included by<br />
applying the Spectral Wave module, MIKE 21 FM<br />
SW.<br />
Example of sediment plume from a river near Malmö,<br />
Sweden<br />
Short Description Page 1
Trans Adriatic Pipeline – TAP, <strong>ESIA</strong> <strong>Albania</strong>, <strong>Annex</strong> 9 - <strong>Sediment</strong> <strong>Dispersion</strong> <strong>Modelling</strong><br />
AAL00-ERM-641-Y-TAE-1010, Rev.: 01 / at05, Page 270 of 278<br />
MIKE 21 & MIKE 3 FLOW MODEL FM<br />
Application Areas<br />
The MT module is used in a variety of cases<br />
where the erosion, dispersion, and deposition of<br />
cohesive sediments are of interest. Fine-grained<br />
sediment may cause impacts in different ways. In<br />
suspension, the fines may shadow areas over a<br />
time span, which can be critical for the survival of<br />
light-depending benthic fauna and flora. The finegrained<br />
sediment may deposit in areas where<br />
deposition is unwanted, for instance in harbour<br />
inlets. Furthermore, pollutants such as heavy<br />
metals and TBT are prone to adhere to the<br />
cohesive sediment. If polluted sediment is<br />
deposited in ecologically sensitive areas it may<br />
heavily affect local flora and fauna and water<br />
quality in general.<br />
Optimisation of dredging operations<br />
Siltation of harbours<br />
Siltation in access channels<br />
Cohesive sediment dynamics and morphology<br />
<strong>Dispersion</strong> of river plumes<br />
Erosion of fine-grained material under<br />
combined waves and currents<br />
Studies of dynamics of contaminated<br />
sediments<br />
Example of muddy estuary. Caravelas, Brazil<br />
Example of resuspension in the nearshore zone.<br />
Caravelas, Brazil. Assessment of resuspension may be<br />
relevant in for example dredging projects to identify<br />
sources and levels of background turbidity<br />
The estimation of siltation rates is an area where<br />
the MT module often is applied and also an<br />
important aspect to consider when designing new<br />
approach channels or deepening existing channels<br />
to allow access for larger vessels to the ports.<br />
Simulations of fine-grained sediment dynamics<br />
may contribute to optimise the design with regard<br />
to navigation and manoeuvrability on one hand<br />
and minimising the need for maintenance dredging<br />
on the other.<br />
The MT module has many application areas and<br />
some of the most frequently used are listed below:<br />
<strong>Dispersion</strong> of dredged material<br />
Computational Features<br />
The main features of the MIKE 21 & MIKE 3<br />
Flow Model FM Mud Transport module are:<br />
Multiple sediment fractions<br />
Multiple bed layers<br />
Flocculation<br />
Hindered settling<br />
Inclusion of non-cohesive sediments<br />
Bed shear stress from combined currents and<br />
waves<br />
Waves included as wave database or 2D time<br />
series<br />
Consolidation<br />
Morphological update of bed<br />
Tracking of sediment spills<br />
Example of modelled physical processes<br />
Page 2<br />
Mud Transport Module
Trans Adriatic Pipeline – TAP, <strong>ESIA</strong> <strong>Albania</strong>, <strong>Annex</strong> 9 - <strong>Sediment</strong> <strong>Dispersion</strong> <strong>Modelling</strong><br />
AAL00-ERM-641-Y-TAE-1010, Rev.: 01 / at05, Page 271 of 278<br />
Model Equations<br />
The governing equations behind the MT module<br />
are essentially based on Mehta et al. (1989). The<br />
impact of waves is introduced through the bed<br />
shear stress.<br />
The cohesive sediment transport module or mud<br />
transport (MT) module deals with the movement<br />
of mud in a fluid and the interaction between the<br />
mud and the bed.<br />
The transport of the mud is generally described by<br />
the following equation (e.g. Teisson, 1991):<br />
i i i i i<br />
c<br />
uc<br />
vc<br />
wc<br />
w s c<br />
<br />
t<br />
x<br />
y<br />
z<br />
z<br />
i<br />
i<br />
<br />
Tx c<br />
<br />
<br />
Ty c<br />
<br />
<br />
Tz<br />
<br />
<br />
x<br />
i<br />
x<br />
y<br />
i<br />
y<br />
z<br />
i<br />
<br />
Tx <br />
Ty <br />
Tz<br />
i<br />
c<br />
<br />
<br />
z<br />
<br />
<br />
The transport of the cohesive sediment is handled<br />
by a transport solver for passive components (ADmodule).<br />
The settling velocity w s is a<br />
sedimentological process and as such it is<br />
described separately with the extra term<br />
using an operator splitting technique.<br />
Symbol list<br />
t<br />
time<br />
x, y, z: Cartesian co-ordinates<br />
u, v, w: flow velocity components<br />
D v :<br />
c i :<br />
w s i :<br />
Tx i :<br />
Tx :<br />
S i :<br />
vertical turbulent (eddy) diffusion<br />
coefficient<br />
i<br />
ws<br />
C<br />
z<br />
i<br />
S<br />
the i’th scalar component (defined as the<br />
mass concentration)<br />
fall velocity<br />
turbulent Schmidt number<br />
anisotropic eddy viscosity<br />
source term<br />
The bed interaction/update and the settling<br />
velocity terms are handled in the MT module.<br />
The sedimentological effects on the fluid density<br />
and viscosity (concentrated near-bed suspensions)<br />
are not considered as part of the mud process<br />
module. Instead they are provided as separate submodules<br />
as they are only relevant for higher<br />
suspended sediment concentrations (SSC).<br />
Mud plains in Loire river, France<br />
Settling velocity<br />
The settling velocity of the suspended sediment<br />
may be specified as a constant value. Flocculation<br />
is described as a relationship with the suspended<br />
sediment concentration as given in Burt (1986).<br />
Hindered settling can be applied if the suspended<br />
sediment concentration exceeds a certain level. To<br />
distinguish between three different settling<br />
regimes, two boundaries are defined, c floc and<br />
c hindered , being the concentrations where<br />
flocculation and hindered settling begins,<br />
respectively.<br />
Constant settling velocity<br />
Below a certain suspended sediment concentration<br />
the flocculation may be negligible and a constant<br />
settling velocity can be applied:<br />
w k<br />
c <br />
s<br />
c floc<br />
where w s is the settling velocity and k is the<br />
constant.<br />
Flocculation<br />
After reaching c floc , the sediment will begin to<br />
flocculate. Burt (1986) found the following<br />
relationship:<br />
c<br />
ws<br />
k <br />
<br />
<br />
sediment<br />
<br />
<br />
<br />
<br />
c<br />
floc<br />
c c<br />
hindered<br />
In which k is a constant, sediment is the sediment<br />
density, and is a coefficient termed settling<br />
index.<br />
Hindered settling<br />
After a relatively high sediment concentration<br />
(c hindered ) is reached, the settling columns of flocs<br />
begin to interfere and hereby reducing the settling<br />
velocity. Formulations given by Richardson and<br />
Short Description Page 3
Trans Adriatic Pipeline – TAP, <strong>ESIA</strong> <strong>Albania</strong>, <strong>Annex</strong> 9 - <strong>Sediment</strong> <strong>Dispersion</strong> <strong>Modelling</strong><br />
AAL00-ERM-641-Y-TAE-1010, Rev.: 01 / at05, Page 272 of 278<br />
MIKE 21 & MIKE 3 FLOW MODEL FM<br />
Zaki (1954) and Winterwerp (1999) are<br />
implemented.<br />
Deposition<br />
The deposition is described as (Krone, 1962):<br />
S w c<br />
D<br />
s<br />
b<br />
p<br />
D<br />
where w s is the settling velocity of the suspended<br />
sediment (m s -1 ), c b is the suspended sediment<br />
concentration near the bed, and p d is an<br />
expression of the probability of deposition:<br />
p<br />
d<br />
<br />
b<br />
1<br />
<br />
cd<br />
In the three-dimensional model, c b is simply equal<br />
to the sediment concentration in the water cell just<br />
above the sediment bed.<br />
In the two-dimensional model, two different<br />
approaches are available for computing c b . If the<br />
Rouse profile is applied, the near bed sediment<br />
concentration is related to the depth averaged<br />
sediment concentration by multiplying with a<br />
constant centroid height:<br />
c b<br />
c (centroid<br />
height)<br />
Teeter (1986) related the near bed concentrations<br />
to the Peclet number (P e ), the bed fluxes, and the<br />
depth averaged suspended sediment<br />
concentrations. In this case, the near bed sediment<br />
concentration is described as:<br />
c<br />
<br />
<br />
P<br />
<br />
e<br />
c 1<br />
1.25<br />
4.75p<br />
b<br />
<br />
2. 5<br />
d<br />
where P e is the Peclet number:<br />
<br />
<br />
<br />
<br />
ws<br />
h<br />
Pe<br />
<br />
Dz<br />
where h is the water depth, D z is the eddy<br />
diffusivity, both computed by the hydrodynamic<br />
model.<br />
Where E is the erodibility (kg m -2 s -1 ), n is the<br />
power of erosion, b is the bed shear stress (N m -2 )<br />
and ce is the critical shear stress for erosion<br />
(N m -2 ). S E is the erosion rate (kg m -2 s -1 ).<br />
Soft bed<br />
For a soft, partly consolidated bed the erosion rate<br />
can be written as (Parchure and Mehta, 1985):<br />
<br />
<br />
<br />
b<br />
<br />
c<br />
S E e <br />
E<br />
<br />
b<br />
c<br />
<br />
<br />
<br />
<br />
<br />
<br />
Consolidation<br />
When long term simulations are performed<br />
consolidation of deposited sediment may be an<br />
important process. If several bed layers are used a<br />
transition rate (T i ) can be applied. This will cause<br />
sediment from the top layers to be transferred to<br />
the subsequently lower layers.<br />
Solution Technique<br />
The solution of the transport equations is closely<br />
linked to the solution of the hydrodynamic<br />
conditions.<br />
The spatial discretisation of the primitive<br />
equations is performed using a cell-centred finite<br />
volume method. The spatial domain is discretised<br />
by subdivision of the continuum into nonoverlapping<br />
elements/cells. In the horizontal plane<br />
an unstructured grid is used while in the vertical<br />
domain in the 3D model a structured mesh is used.<br />
In the 2D model the elements can be triangles or<br />
quadrilateral elements. In the 3D model the<br />
elements can be prisms or bricks whose horizontal<br />
faces are triangles and quadrilateral elements,<br />
respectively.<br />
The time integration is performed using an explicit<br />
scheme.<br />
Erosion<br />
Erosion features the following two modes.<br />
Hard bed<br />
For a consolidated bed the erosion rate can be<br />
written as (Partheniades, 1965):<br />
S<br />
E<br />
n<br />
<br />
E<br />
b<br />
<br />
<br />
1<br />
ce <br />
<br />
b<br />
c<br />
Page 4<br />
Mud Transport Module
Trans Adriatic Pipeline – TAP, <strong>ESIA</strong> <strong>Albania</strong>, <strong>Annex</strong> 9 - <strong>Sediment</strong> <strong>Dispersion</strong> <strong>Modelling</strong><br />
AAL00-ERM-641-Y-TAE-1010, Rev.: 01 / at05, Page 273 of 278<br />
Computed bed shear stress<br />
Computed settling velocities<br />
Updated bathymetry<br />
Principle of 3D mesh<br />
Validation<br />
The model engine is well proven in numerous<br />
studies throughout the world:<br />
The MT module is a tool for estuary sediment<br />
management in complex estuaries like San Francisco bay,<br />
California, USA<br />
Model Input<br />
The generic nature of cohesive sediment dynamics<br />
reveals a numerical model that will always call for<br />
tremendous field work or calibration due to<br />
measurements performed. The following input<br />
parameters have to be given:<br />
Settling velocity<br />
Critical shear stress for erosion<br />
Critical shear stress for deposition<br />
Erosion coefficients<br />
Power of erosion<br />
Suspended sediment<br />
Concentration at open boundaries<br />
<strong>Dispersion</strong> coefficients<br />
Thickness of bed layers or estimate of total<br />
amount of active sediment in the system<br />
Transition coefficients between bed layers<br />
Dry density of bed layers<br />
Model Output<br />
The main output possibilities are listed below:<br />
Suspended sediment concentrations in space<br />
and time<br />
<strong>Sediment</strong> in bed layers given as masses or<br />
heights<br />
Net sedimentation rates<br />
The Rio Grande estuary, Brazil<br />
In 2001, the model was applied for a 3D study in<br />
the Rio Grande estuary (Brazil). The study<br />
focused on a number of hydrodynamic issues<br />
related to changing the Rio Grande Port layout. In<br />
addition the possible changes in sedimentation<br />
patterns and dredging requirements were<br />
investigated.<br />
SSC in surface layer (kg/m 3 ), Rio Grande, Brazil<br />
Short Description Page 5
Trans Adriatic Pipeline – TAP, <strong>ESIA</strong> <strong>Albania</strong>, <strong>Annex</strong> 9 - <strong>Sediment</strong> <strong>Dispersion</strong> <strong>Modelling</strong><br />
AAL00-ERM-641-Y-TAE-1010, Rev.: 01 / at05, Page 274 of 278<br />
MIKE 21 & MIKE 3 FLOW MODEL FM<br />
Graadyb tidal inlet (Skallingen), Denmark<br />
Instantaneous erosion (kg/m 2 /s), Rio Grande, Brazil<br />
The figure below shows the most common<br />
calibration parameter, which is the suspended<br />
sediment concentration (SSC). The results are<br />
reasonable given the large uncertainties connected<br />
with mud transport modelling.<br />
Bathymetry and computational mesh for the Graadyb tidal<br />
inlet, Denmark<br />
A comparison between measured and simulated<br />
SSC time series is shown below. The overall<br />
comparison is excellent.<br />
Suspended sediment concentrations, Rio Grande, Brazil<br />
The Graadyb tidal inlet, Denmark<br />
The MT module has also been used in the<br />
Graadyb tidal inlet located in the Danish part of<br />
the Wadden Sea. In this area, the highest tidal<br />
range reaches 1.7 m at springs, but the storm surge<br />
in the area can be as high as 2-4 metres.<br />
The maximum current in the navigation channel<br />
leading to the harbour of Esbjerg is in the range of<br />
1-2 m/s. The depth in the channel is 10-12 m at<br />
mean sea level.<br />
Comparison between measured and simulated suspended<br />
sediment concentrations, Graadyb tidal inlet, Denmark<br />
Page 6<br />
Mud Transport Module
Trans Adriatic Pipeline – TAP, <strong>ESIA</strong> <strong>Albania</strong>, <strong>Annex</strong> 9 - <strong>Sediment</strong> <strong>Dispersion</strong> <strong>Modelling</strong><br />
AAL00-ERM-641-Y-TAE-1010, Rev.: 01 / at05, Page 275 of 278<br />
The graphical user interface of the MIKE 21 & MIKE 3 Flow Model FM MT module including an example of the Online Help<br />
System<br />
Graphical User Interface<br />
The MIKE 21 & MIKE 3 Flow Model FM, Mud<br />
Transport module is operated through a fully<br />
Windows integrated Graphical User Interface<br />
(GUI). Support is provided at each stage by an<br />
Online Help System.<br />
The common MIKE Zero shell provides entries<br />
for common data file editors, plotting facilities and<br />
utilities such as the Mesh Generator, the Data<br />
Viewer and the Data Manager.<br />
Overview of the common MIKE Zero utilities<br />
Short Description Page 7
Trans Adriatic Pipeline – TAP, <strong>ESIA</strong> <strong>Albania</strong>, <strong>Annex</strong> 9 - <strong>Sediment</strong> <strong>Dispersion</strong> <strong>Modelling</strong><br />
AAL00-ERM-641-Y-TAE-1010, Rev.: 01 / at05, Page 276 of 278<br />
MIKE 21 & MIKE 3 FLOW MODEL FM<br />
Parallelisation<br />
The computational engines of the MIKE 21/3 FM<br />
series are available in versions that have been<br />
parallelised using both shared memory (OpenMP)<br />
as well as distributed memory architecture (MPI).<br />
The result is much faster simulations on systems<br />
with many cores.<br />
MIKE 21/3 FM speed-up using multicore PCs for Release<br />
2011 with distributed memory architecture (blue) and<br />
shared memory architecture that was part of Release 2009<br />
(green)<br />
Hardware and Operating System<br />
Requirements<br />
The MIKE 21 and MIKE 3 Flow Model FM Mud<br />
Transport Module supports Microsoft Windows<br />
XP Professional Edition (32 and 64 bit), Microsoft<br />
Windows Vista Business (32 and 64 bit) and<br />
Microsoft Windows 7 Enterprise (32 and 64 bit).<br />
Microsoft Internet Explorer 6.0 (or higher) is<br />
required for network license management as well<br />
as for accessing the Online Help.<br />
The recommended minimum hardware<br />
requirements for executing MIKE 21 & MIKE 3<br />
Flow Model FM Mud Transport Module are:<br />
Processor:<br />
Memory (RAM):<br />
Hard disk:<br />
Monitor:<br />
Graphic card:<br />
Media:<br />
3 GHz PC (or higher)<br />
4 GB (or higher)<br />
160 GB (or higher)<br />
SVGA, resolution 1024x768<br />
32 MB RAM (or higher),<br />
32 bit true colour<br />
CD-ROM/DVD drive, 20 x<br />
speed (or higher)<br />
Support<br />
News about new features, applications, papers,<br />
updates, patches, etc. are available here:<br />
www.mikebydhi.com/Download/DocumentsAndTools.aspx<br />
For further information on MIKE 21 & MIKE 3<br />
Flow Model FM software, please contact your<br />
local DHI office or the Software Support Centre:<br />
MIKE by DHI<br />
DHI<br />
Agern Allé 5<br />
DK-2970 Hørsholm<br />
Denmark<br />
Tel: +45 4516 9333<br />
Fax: +45 4516 9292<br />
www.mikebydhi.com<br />
mikebydhi@dhigroup.com<br />
References<br />
Burt, N., 1986. Field settling velocities of estuary<br />
muds. In: Estuarine Cohesive <strong>Sediment</strong> Dynamics,<br />
edited by Mehta, A.J. Springer-Verlag, Berlin,<br />
Heidelberg, NewYork, Tokyo, 126–150.<br />
Krone, R.B., 1962. Flume Studies of the Transport<br />
of <strong>Sediment</strong> in Estuarine Shoaling Processes.<br />
Final Report to San Francisco District U. S. Army<br />
Corps of Engineers, Washington D.C.<br />
Mehta, A.J., Hayter, E.J., Parker, W.R., Krone,<br />
R.B. and Teeter, A.M., 1989. Cohesive sediment<br />
transport. I: Process description. Journal of<br />
Hydraulic Engineering – ASCE 115 (8), 1076–<br />
1093.<br />
Parchure, T.M. and Mehta, A.J., 1985. Erosion of<br />
soft cohesive sediment deposits. Journal of<br />
Hydraulic Engineering – ASCE 111 (10), 1308–<br />
1326.<br />
Partheniades, E., 1965. Erosion and deposition of<br />
cohesive soils. Journal of the hydraulics division<br />
Proceedings of the ASCE 91 (HY1), 105–139.<br />
Richardson, J.F and Zaki, W.N., 1954.<br />
<strong>Sediment</strong>ation and fluidization, Part I,<br />
Transactions of the institution Chemical Engineers<br />
32, 35–53.<br />
Teeter, A.M., 1986. Vertical transport in finegrained<br />
suspension and newly deposited sediment.<br />
In: Estuarine Cohesive <strong>Sediment</strong> Dynamics, edited<br />
by Mehta, A.J. Springer-Verlag, Berlin,<br />
Heidelberg, NewYork, Tokyo, 170–191.<br />
Page 8<br />
Mud Transport Module
Trans Adriatic Pipeline – TAP, <strong>ESIA</strong> <strong>Albania</strong>, <strong>Annex</strong> 9 - <strong>Sediment</strong> <strong>Dispersion</strong> <strong>Modelling</strong><br />
AAL00-ERM-641-Y-TAE-1010, Rev.: 01 / at05, Page 277 of 278<br />
Teisson, C., 1991. Cohesive suspended sediment<br />
transport: feasibility and limitations of numerical<br />
modelling. Journal of Hydraulic Research 29 (6),<br />
755–769.<br />
Winterwerp, J.C. (1999) “Flocculation and settling<br />
velocity”, TU delft. pp 10-17.<br />
References on applications<br />
Edelvang, K., Lund-Hansen, L.C., Christiansen,<br />
C., Petersen, O.S., Uhrenholdt, T., Laima, M. and<br />
Berastegui, D.A., 2002. <strong>Modelling</strong> of suspended<br />
matter transport from the Oder River. Journal of<br />
Coastal Research 18 (1), 62–74.<br />
Lumborg, U., Andersen, T.J. and Pejrup, M.,<br />
2006. The effect of Hydrobia ulvae and<br />
microphytobenthos on cohesive sediment<br />
dynamics on an intertidal mudflat described by<br />
means of numerical modelling. Estuarine, Coastal<br />
and Shelf Science 68 (1-2), 208–220.<br />
Lumborg, U. and Pejrup, M., 2005. <strong>Modelling</strong> of<br />
cohesive sediment transport in a tidal lagoon – An<br />
annual budget. Marine Geology 218 (1-4), 1–16.<br />
Petersen, O. and Vested, H.J., 2002. Description<br />
of vertical exchange processes in numerical mud<br />
transport modelling. In: Fine <strong>Sediment</strong> Dynamics<br />
in the Marine Environment, edited by Winterwerp,<br />
J.C. and Kranenburg, C. Elsevier, Amsterdam,<br />
375–391.<br />
Petersen, O., Vested, H.J., Manning, A.J., Christie,<br />
M. and Dyer, K., 2002. Numerical modelling of<br />
mud transport processes in the Tamar Estuary. In:<br />
Fine <strong>Sediment</strong> Dynamics in the Marine<br />
Environment, edited by Winterwerp, J.C. and<br />
Kranenburg, C. Elsevier, Amsterdam, 643–654.<br />
Valeur, J.R., 2004. <strong>Sediment</strong> investigations<br />
connected with the building of the Øresund bridge<br />
and tunnel. Danish Journal of Geography 104 (2),<br />
1–12.<br />
Short Description Page 9
Trans Adriatic Pipeline – TAP, <strong>ESIA</strong> <strong>Albania</strong>, <strong>Annex</strong> 9 - <strong>Sediment</strong> <strong>Dispersion</strong> <strong>Modelling</strong><br />
AAL00-ERM-641-Y-TAE-1010, Rev.: 01 / at05, Page 278 of 278<br />
MIKE 21 & MIKE 3 FLOW MODEL FM<br />
Page 10<br />
Mud Transport Module
Trans Adriatic Pipeline AG – <strong>Albania</strong> (Branch Office)<br />
Torre Drin, Rruga Abdi Toptani<br />
Tirana, <strong>Albania</strong><br />
Tel.: + 355 44 306 937<br />
Fax: + 355 42 265 685<br />
esia-comments@tap-ag.com<br />
www.tap-ag.com<br />
Date 01/2013<br />
Copyright Reserved: This document may not be copied, shown to or placed at the disposal of third parties without prior consent of TAP AG.<br />
The latest version of the document is registered in the TAP Project's Database.