Annual Report 2010–2011, Part 2: Financial (1.8 ... - Tourism Victoria
Annual Report 2010–2011, Part 2: Financial (1.8 ... - Tourism Victoria
Annual Report 2010–2011, Part 2: Financial (1.8 ... - Tourism Victoria

Create successful ePaper yourself
Turn your PDF publications into a flip-book with our unique Google optimized e-Paper software.
NOTES TO THE FINANCIAL STATEMENTS CONTINUED<br />
30 JUNE 2011<br />
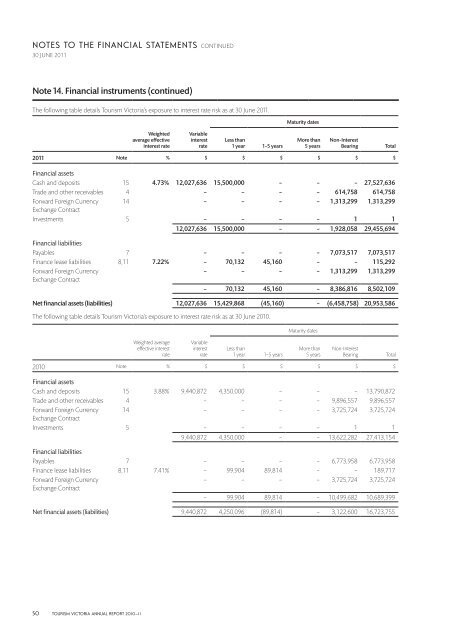
Note 14. <strong>Financial</strong> instruments (continued)<br />
The following table details <strong>Tourism</strong> <strong>Victoria</strong>’s exposure to interest rate risk as at 30 June 2011.<br />
Maturity dates<br />
Weighted<br />
average effective<br />
interest rate<br />
Variable<br />
interest<br />
rate<br />
Less than<br />
1 year 1–5 years<br />
More than<br />
5 years<br />
Non-Interest<br />
Bearing<br />
Total<br />
2011 Note % $ $ $ $ $ $<br />
<strong>Financial</strong> assets<br />
Cash and deposits 15 4.73% 12,027,636 15,500,000 – – – 27,527,636<br />
Trade and other receivables 4 – – – – 614,758 614,758<br />
Forward Foreign Currency 14 – – – – 1,313,299 1,313,299<br />
Exchange Contract<br />
Investments 5 – – – – 1 1<br />
12,027,636 15,500,000 – – 1,928,058 29,455,694<br />
<strong>Financial</strong> liabilities<br />
Payables 7 – – – – 7,073,517 7,073,517<br />
Finance lease liabilities 8,11 7.22% – 70,132 45,160 – – 115,292<br />
Forward Foreign Currency<br />
– – – – 1,313,299 1,313,299<br />
Exchange Contract<br />
– 70,132 45,160 – 8,386,816 8,502,109<br />
Net financial assets (liabilities) 12,027,636 15,429,868 (45,160) – (6,458,758) 20,953,586<br />
The following table details <strong>Tourism</strong> <strong>Victoria</strong>’s exposure to interest rate risk as at 30 June 2010.<br />
Maturity dates<br />
Weighted average<br />
effective interest<br />
rate<br />
Variable<br />
interest<br />
rate<br />
Less than<br />
1 year 1–5 years<br />
More than<br />
5 years<br />
Non-Interest<br />
Bearing<br />
Total<br />
2010 Note % $ $ $ $ $ $<br />
<strong>Financial</strong> assets<br />
Cash and deposits 15 3.88% 9,440,872 4,350,000 – – – 13,790,872<br />
Trade and other receivables 4 – – – – 9,896,557 9,896,557<br />
Forward Foreign Currency 14 – – – – 3,725,724 3,725,724<br />
Exchange Contract<br />
Investments 5 – – – – 1 1<br />
9,440,872 4,350,000 – – 13,622,282 27,413,154<br />
<strong>Financial</strong> liabilities<br />
Payables 7 – – – – 6,773,958 6,773,958<br />
Finance lease liabilities 8,11 7.41% – 99,904 89,814 – – 189,717<br />
Forward Foreign Currency<br />
– – – – 3,725,724 3,725,724<br />
Exchange Contract<br />
– 99,904 89,814 – 10,499,682 10,689,399<br />
Net financial assets (liabilities) 9,440,872 4,250,096 (89,814) – 3,122,600 16,723,755<br />
50 TOURISM VICTORIA ANNUAL REPORT 2010–11