Annual Report 2010–2011, Part 2: Financial (1.8 ... - Tourism Victoria
Annual Report 2010–2011, Part 2: Financial (1.8 ... - Tourism Victoria
Annual Report 2010–2011, Part 2: Financial (1.8 ... - Tourism Victoria

Create successful ePaper yourself
Turn your PDF publications into a flip-book with our unique Google optimized e-Paper software.
NOTES TO THE FINANCIAL STATEMENTS CONTINUED<br />
30 JUNE 2011<br />
Note 14. <strong>Financial</strong> instruments (continued)<br />
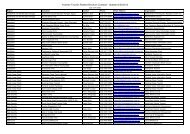
Ageing analysis of contractual receivables<br />
Carrying amount<br />
Not past due and<br />
not impaired<br />
Past due but not impaired<br />
Less than 1 month 1–3 months 3 months – 1 year<br />
2011<br />
Debtors 507,045 270,407 144,238 92,400 –<br />
Other receivables 107,713 107,713 – – –<br />
614,758 378,120 144,238 92,400 –<br />
2010<br />
Debtors 9,813,601 8,909,951 892,970 10,680 –<br />
Other receivables 82,957 82,957 – – –<br />
9,896,557 8,992,908 892,970 10,680 –<br />
Credit quality of contractual financial assets that are neither past due or impaired<br />
Finance<br />
Institutions<br />
Government<br />
Departments<br />
Other<br />
Government<br />
Entities<br />
Regional<br />
<strong>Tourism</strong> Bodies Other Total<br />
2011<br />
Cash and deposits 11,778,728 – 15,500,000 – 248,909 27,527,636<br />
Receivables 22,515 221,000 4,100 92,132 275,011 614,758<br />
Investments – – – – 1 1<br />
Total contractual financial assets 11,801,243 221,000 15,504,100 92,132 523,921 28,142,395<br />
2010<br />
Cash and deposits 9,138,012 – 4,350,000 – 302,860 13,790,872<br />
Receivables 15,251 8,814,860 134,076 780,714 151,658 9,896,557<br />
Investments – – – – 1 1<br />
Total contractual financial assets 9,153,263 8,814,860 4,484,076 780,714 454,519 23,687,430<br />
There are no material financial assets which are individually determined to be impaired.<br />
48 TOURISM VICTORIA ANNUAL REPORT 2010–11