BEVACIZUMAB EFFECT ON TOPOTECAN PHARMACOKINETICS ...
BEVACIZUMAB EFFECT ON TOPOTECAN PHARMACOKINETICS ... BEVACIZUMAB EFFECT ON TOPOTECAN PHARMACOKINETICS ...
with TPT only and received TPT 1 day, 3 days or 7 days after the last dose of BEV were evaluated to assess whether the pre-treatment of BEV has effect on antitumor activity of TPT. In addition, the final tumor volume in mice treated with TPT 1 day, 3 days or 7 days after the last dose of BEV administration were evaluated to assess whether the antitumor activity was dependent upon the schedule of BEV and TPT. Collectively, the TPT penetration and efficacy study designs were shown in Tables 1-2 and Figures 1-2. 2.2.5 In vivo tumor microdialysis The principle and methodology of microdialysis sampling have been reviewed thoroughly in volume 45, issue 2-3 of Advanced Drug Delivery Reviews. In brief, a short length of semi-permeable microdialysis probe is implanted into tissue and continuously perfused with a physiologic solution at a low flow rate (0.5-10 µl/min). The analyte of interest in the tissue ECF diffuses into the microdialysis probe, resulting from the concentration gradient across the probe membrane, and is carried via microtubing into the collection vials. In the present study, a CMA/20 microdialysis probe (CMA Microdialysis, Chelmsford, MA) was used. The probe was perfused with Ringer's solution (USP) at 0.5 μL/min flow rate by a CMA 102 pump (CMA Microdialysis, Chelmsford, MA). The probe was equilibrated for one hour prior to the microdialysis sample collection. The dialysate samples were collected up to 6 hours every 30 minutes for the off line system and every 18 minutes for the online system [179] after TPT injection. The off line system was composed of two steps─collecting samples manually and analyzing samples on a separate HPLC system, while the samples were directly injected into a connected HPLC system and analyzed at real-time on the on line system [179]. The samples were stored in the -80°C freezer before analysis for the off line system. For each microdialysis experiment, retrodialysis calibration was performed as previously described [178] after the sample collection. Briefly, a TPT solution (50 ng/mL) was prepared in Ringer’s solution and perfused through the microdialysis probe at two different flow rates 4.0 and 0.5 μL/min. The system was allowed to equilibrate for 30 minutes between the flow rate change. The total TPT concentration in the solution exiting the probe at 4.0 μL/min (Cin) and at 0.5 μL/min (Cout) was determined by HPLC. The recovery was estimated as shown in Equation 1. Recovery % TPT C C C 100 Eq. 1 At the end of the retrodialysis study the mice were euthanized by cervical dislocation under anesthesia. 23
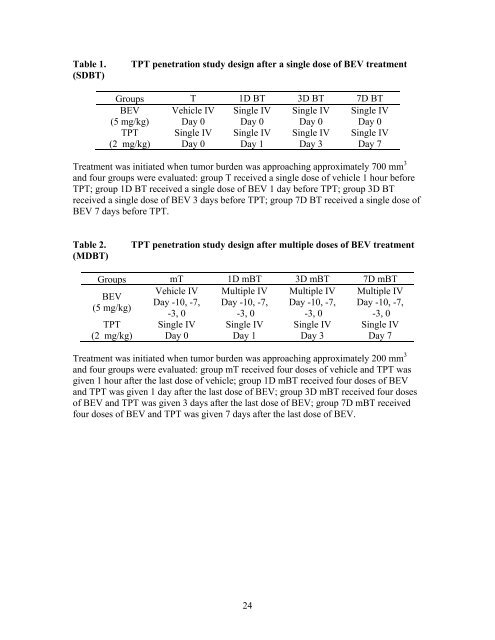
Table 1. (SDBT) TPT penetration study design after a single dose of BEV treatment Groups T 1D BT 3D BT 7D BT BEV (5 mg/kg) Vehicle IV Day 0 Single IV Day 0 Single IV Day 0 Single IV Day 0 TPT (2 mg/kg) Single IV Day 0 Single IV Day 1 Single IV Day 3 Single IV Day 7 Treatment was initiated when tumor burden was approaching approximately 700 mm 3 and four groups were evaluated: group T received a single dose of vehicle 1 hour before TPT; group 1D BT received a single dose of BEV 1 day before TPT; group 3D BT received a single dose of BEV 3 days before TPT; group 7D BT received a single dose of BEV 7 days before TPT. Table 2. (MDBT) TPT penetration study design after multiple doses of BEV treatment Groups mT 1D mBT 3D mBT 7D mBT Vehicle IV Multiple IV Multiple IV Multiple IV BEV Day -10, -7, Day -10, -7, Day -10, -7, Day -10, -7, (5 mg/kg) -3, 0 -3, 0 -3, 0 -3, 0 TPT (2 mg/kg) Single IV Day 0 Single IV Day 1 Single IV Day 3 Single IV Day 7 Treatment was initiated when tumor burden was approaching approximately 200 mm 3 and four groups were evaluated: group mT received four doses of vehicle and TPT was given 1 hour after the last dose of vehicle; group 1D mBT received four doses of BEV and TPT was given 1 day after the last dose of BEV; group 3D mBT received four doses of BEV and TPT was given 3 days after the last dose of BEV; group 7D mBT received four doses of BEV and TPT was given 7 days after the last dose of BEV. 24
- Page 1 and 2: BEVACIZUMAB EFFECT ON TOPOTECAN PHA
- Page 3 and 4: ACKNOWLEDGEMENTS I would like to th
- Page 5 and 6: overall effect of BEV on TPT pharma
- Page 7 and 8: 2.3.1 The effect of BEV on the phar
- Page 9 and 10: LIST OF FIGURES Figure 1. TPT effic
- Page 11 and 12: SDBT Single dose of bevacizumab tre
- Page 13 and 14: hypertension and the pathologic ext
- Page 15 and 16: 1.1.3 Strategies to improve drug pe
- Page 17 and 18: 1.2.2 Role of vascular endothelial
- Page 19 and 20: enhanced the tumor response to conv
- Page 21 and 22: non-favorable sites [109]. So devel
- Page 23 and 24: low sensitivity. Additionally, it r
- Page 25 and 26: tumor distribution of TMZ in V+ SC
- Page 27 and 28: over-pruned microvessel [146, 147].
- Page 29 and 30: 1.7 Summary Although the overall su
- Page 31 and 32: CHAPTER 2. THE EFFECT OF BEVACIZUMA
- Page 33: 2.2.4 Tumor model and treatment Ort
- Page 37 and 38: Figure 2. TPT penetration plus effi
- Page 39 and 40: Figure 3. A pharmacokinetic model f
- Page 41 and 42: 2.2.10 Statistical analyses For eac
- Page 43 and 44: Figure 6. Representative plasma and
- Page 45 and 46: Figure 7. The effect of BEV on the
- Page 47 and 48: Figure 8. The effect of BEV on the
- Page 49 and 50: Table 6. Population PK parameters o
- Page 51 and 52: variability for Kte decreased from
- Page 53 and 54: Figure 11. The effect of different
- Page 55 and 56: efflux transporters. TPT is a campt
- Page 57 and 58: Furthermore, although the volume of
- Page 59 and 60: 19. Sleeman, J., A. Schmid, and W.
- Page 61 and 62: 56. ElBayoumi, T.A. and V.P. Torchi
- Page 63 and 64: 91. Ma, J. and D.J. Waxman, Combina
- Page 65 and 66: 125. Hao, M., et al., Pharmacokinet
- Page 67 and 68: 154. Dickson, P.V., et al., Bevaciz
- Page 69 and 70: 188. Tian, Q., et al., Topotecan is
Table 1.<br />
(SDBT)<br />
TPT penetration study design after a single dose of BEV treatment<br />
Groups T 1D BT 3D BT 7D BT<br />
BEV<br />
(5 mg/kg)<br />
Vehicle IV<br />
Day 0<br />
Single IV<br />
Day 0<br />
Single IV<br />
Day 0<br />
Single IV<br />
Day 0<br />
TPT<br />
(2 mg/kg)<br />
Single IV<br />
Day 0<br />
Single IV<br />
Day 1<br />
Single IV<br />
Day 3<br />
Single IV<br />
Day 7<br />
Treatment was initiated when tumor burden was approaching approximately 700 mm 3<br />
and four groups were evaluated: group T received a single dose of vehicle 1 hour before<br />
TPT; group 1D BT received a single dose of BEV 1 day before TPT; group 3D BT<br />
received a single dose of BEV 3 days before TPT; group 7D BT received a single dose of<br />
BEV 7 days before TPT.<br />
Table 2.<br />
(MDBT)<br />
TPT penetration study design after multiple doses of BEV treatment<br />
Groups mT 1D mBT 3D mBT 7D mBT<br />
Vehicle IV Multiple IV Multiple IV Multiple IV<br />
BEV<br />
Day -10, -7, Day -10, -7, Day -10, -7, Day -10, -7,<br />
(5 mg/kg)<br />
-3, 0<br />
-3, 0<br />
-3, 0<br />
-3, 0<br />
TPT<br />
(2 mg/kg)<br />
Single IV<br />
Day 0<br />
Single IV<br />
Day 1<br />
Single IV<br />
Day 3<br />
Single IV<br />
Day 7<br />
Treatment was initiated when tumor burden was approaching approximately 200 mm 3<br />
and four groups were evaluated: group mT received four doses of vehicle and TPT was<br />
given 1 hour after the last dose of vehicle; group 1D mBT received four doses of BEV<br />
and TPT was given 1 day after the last dose of BEV; group 3D mBT received four doses<br />
of BEV and TPT was given 3 days after the last dose of BEV; group 7D mBT received<br />
four doses of BEV and TPT was given 7 days after the last dose of BEV.<br />
24


